Back to Journals » Journal of Inflammation Research » Volume 15
Dynamic Interleukin-1 Receptor Type 1 Signaling Mediates Microglia-Vasculature Interactions Following Repeated Systemic LPS
Authors Nemeth DP ![]() , Liu X
, Liu X ![]() , McKim DB, DiSabato DJ, Oliver B, Herd A, Katta A
, McKim DB, DiSabato DJ, Oliver B, Herd A, Katta A ![]() , Negray CE, Floyd J, McGovern S, Pruden PS, Zhutang F
, Negray CE, Floyd J, McGovern S, Pruden PS, Zhutang F ![]() , Smirnova M
, Smirnova M ![]() , Godbout JP, Sheridan JF, Quan N
, Godbout JP, Sheridan JF, Quan N ![]()
Received 30 November 2021
Accepted for publication 16 February 2022
Published 4 March 2022 Volume 2022:15 Pages 1575—1590
DOI https://doi.org/10.2147/JIR.S350114
Checked for plagiarism Yes
Review by Single anonymous peer review
Peer reviewer comments 2
Editor who approved publication: Dr Monika Sharma
Daniel P Nemeth,1– 3 Xiaoyu Liu,3 Daniel B McKim,4 Damon J DiSabato,2,5 Braedan Oliver,2 Anu Herd,3 Asish Katta,1 Christina E Negray,1,2 James Floyd,3 Samantha McGovern,3 Paige S Pruden,2 Feiyang Zhutang,2 Maria Smirnova,3 Jonathan P Godbout,2,5 John Sheridan,1,2 Ning Quan3
1College of Dentistry, The Ohio State University, Columbus, OH, USA; 2Institute for Behavioral Medicine Research, The Ohio State University, Columbus, OH, USA; 3Stiles-Nicholson Brain Institute, Florida Atlantic University, Jupiter, FL, USA; 4Department of Animal Sciences, University of Illinois Urbana-Champaign, Champaign, IL, USA; 5Department of Neuroscience, The Ohio State University, Columbus, OH, USA
Correspondence: Daniel P Nemeth; Ning Quan, 5353 Parkside Drive, Jupiter, FL, 33458, USA, Email [email protected]; [email protected]
Introduction: Lipopolysaccharide (LPS) preconditioning involves repeated, systemic, and sub-threshold doses of LPS, which induces a neuroprotective state within the CNS, thus preventing neuronal death and functional losses. Recently, proinflammatory cytokine, Interleukin-1 (IL-1), and its primary signaling partner, interleukin-1 receptor type 1 (IL-1R1), have been associated with neuroprotection in the CNS. However, it is still unknown how IL-1/IL-1R1 signaling impacts the processes associated with neuroprotection.
Methods: Using our IL-1R1 restore genetic mouse model, mouse lines were generated to restrict IL-1R1 expression either to endothelia (Tie2-Cre-Il1r1r/r) or microglia (Cx3Cr1-Cre-Il1r1r/r), in addition to either global ablation (Il1r1r/r) or global restoration of IL-1R1 (Il1r1GR/GR). The LPS preconditioning paradigm consisted of four daily i.p. injections of LPS at 1 mg/kg (4d LPS). 24 hrs following the final i.p. LPS injection, tissue was collected for qPCR analysis, immunohistochemistry, or FAC sorting.
Results: Following 4d LPS, we found multiple phenotypes that are dependent on IL-1R1 signaling such as microglia morphology alterations, increased microglial M2-like gene expression, and clustering of microglia onto the brain vasculature. We determined that 4d LPS induces microglial morphological changes, clustering at the vasculature, and gene expression changes are dependent on endothelial IL-1R1, but not microglial IL-1R1. A novel observation was the induction of microglial IL-1R1 (mIL-1R1) following 4d LPS. The induced mIL-1R1 permits a unique response to central IL-1β: the mIL-1R1 dependent induction of IL-1R1 antagonist (IL-1RA) and IL-1β gene expression. Analysis of RNA sequencing datasets revealed that mIL-1R1 is also induced in neurodegenerative diseases.
Discussion: Here, we have identified cell type-specific IL-1R1 mediated mechanisms, which may contribute to the neuroprotection observed in LPS preconditioning. These findings identify key cellular and molecular contributors in LPS-induced neuroprotection.
Keywords: BBB, neuroinflammation, perivascular microglia
Graphical Abstract:

Plain Language Summary
Repeated systemic immune activation with bacterial lipopolysaccharide (LPS), called LPS preconditioning, is known to initiate a neuroprotective state in the brain and spinal cord which prevents excessive neuronal damage, central nervous system pathology, and functional deficits. Microglia are the resident innate immune cell of the central nervous system (CNS), and are thought to play a major role in conferring neuroprotection to the CNS and exhibit unique phenotypes during this neuroprotective mode. These phenotypes are changes to microglial morphology, microglial gene expression, and the relationship of microglia to the blood brain barrier (BBB). Dr. Nemeth et. al. find cytokine signaling through the Interleukin-1 Receptor 1 (IL-1R1) on endothelial cells of the BBB recapitulate microglial phenotypes which are associated with neuroprotection. Additionally, following repeated LPS, microglia gain functional IL-1R1 and gain the ability to produce negative regulators of IL-1 signaling.
Introduction
Lipopolysaccharide (LPS) preconditioning is a phenomenon that utilizes repeated injections of sub-threshold doses of gram-negative bacterial product, LPS, to prepare tissue for future damage, thus mitigating cellular death and functional losses. This process results in a lasting shift in the activation of the immune system from a pro-inflammatory phenotype to a reparative phenotype. The protective effects of LPS preconditioning, including reduction of neuronal death and preservation of motor function, have been characterized in models of epilepsy,1 cryogenic injury,2 stroke,3,4 and ischemic spinal cord injury.5 This induction of a neuroprotective state is of interest to those studying injury within the central nervous system (CNS), as molecular mechanisms underlying LPS preconditioning may be employed for preventing potentially permanent loss of neurons and neuronal functions after CNS injury.
The literature suggests that microglia, a resident innate immune glial cell of the CNS, and endothelial cells of the blood brain barrier (BBB) are the primary cell types which confer the neuroprotective effects of LPS preconditioning.6 Reports show repeated peripheral, sub-threshold LPS consistently induces gradual, stepwise and global changes in microglial morphology which precedes LPS preconditioning induced neuroprotection.1,2,5 Recently, a causal relationship between microglia and LPS-induced neuroprotection has been shown, since depletion of microglia using CSF1R inhibitors diminishes the neuroprotective effects of LPS preconditioning.5 The dynamic microglial morphological alterations are accompanied by gene expression shifts from pro-inflammatory genes (IL-1β, TNF, and IL-6) to anti-inflammatory genes and phagocytic genes such as ARG1, YM1, MSR1, and IL-4R following the repeated doses of LPS. This inflammatory to anti-inflammatory shift could be a mechanism underlying neuroprotection induced by LPS preconditioning.2,7 The involvement of brain vasculature is surmised because systemically administered LPS, which generally does not penetrate the BBB at low doses, can elicit global microglial responses and, therefore, must require an intermediate signaling partner.8 Indeed, endothelial cells at the BBB express Toll-Like Receptor 4 (TLR4) and CD14, the pattern recognition receptors required to respond to LPS,9,10 and produce microglial activation factors upon inflammatory stimulation.11
The IL-1/IL-1R1 signaling pathway is one of the most important molecular pathways related to the LPS preconditioning induced changes in endothelial cells and microglia. Endothelial cells are the highest expresser of IL-1R1 in the CNS12,13 and can stimulate microglial pro-inflammatory cytokine production via IL-1R1 signaling.11,14 Peripheral administration of LPS can robustly increase IL-1β levels in the periphery15,16 and CNS.17–19 More recently, Freria et al demonstrate that endothelial-microglial communication via IL-1/IL-1R1 signaling is necessary for microglial morphological changes and the neuroprotective effects of LPS preconditioning in a model of ischemia of the spinal cord. Furthermore, LPS preconditioning initiated closer physical contact between microglia and IL-1R1+ endothelia, suggesting endothelial IL-1R1 signaling could recruit microglia to strengthen BBB.5 Previous reports indicate microglial IL-1R1 (mIL-1R1) expression in the normal brain is undetectable and homeostatic microglia are unresponsive to IL-1β in vitro20 and in vivo.11,13 However, following LPS stimulation, mIL-1R1 is upregulated in vitro.20 In the case of spinal cord ischemia, the induction of mIL-1R1 was thought to be crucial for the observed neuroprotection as deletion of mIL-1R1 prevented LPS-induced neuroprotection.5
In this study, using our unique and validated transgenic mouse model where IL-1R1 expression can be restricted to specific cell types, we show changes to microglia phenotypes associated with neuroprotection following LPS preconditioning were dependent on IL-1R1. Our LPS preconditioning consists of intraperitoneal (i.p.) administration of 1 mg/kg LPS for four consecutive days (4d LPS). In comparison to PBS controls, 4d LPS caused an increase in M2-like gene expression, alterations of microglial morphology, and physical microglial-vasculature interactions. The microglial morphological changes, M2-like gene expression, and clustering of microglia at the BBB were dependent on endothelial IL-1R1 (eIL-1R1). Furthermore, we show for the first time that LPS preconditioning induces the emergence of functional mIL-1R1 expression in vivo. The induced mIL-1R1 allows IL-1 to induce the production of the anti-inflammatory IL-1R1 antagonist (IL-1RA). Taken together, these data show a dynamic and multi-cellular response to 4d LPS, requiring endothelial and microglial IL-1R1 signaling to produce cellular processes relevant to LPS preconditioning.
Materials and Methods
Animals
All experiments described were performed with 12–14-week-old mice. Mice were housed in standard vivarium conditions where food and water were provided ad libitum. All studies were approved by Ohio State University Institutional Laboratory Animal Care and Use Committee (IACUC) and were in accordance with NIH Guidelines. In our lab, we have previously generated a double knock-in restore mouse model, Il1r1r/r, in which Il1r1 gene expression is disrupted by an intronic insertion of a loxP flanked disruptive sequence that can be deleted by Cre recombinase, resulting in a restored Il1r1 gene expression under its endogenous promoters; a second mutation was introduced at the stop codon to allow tracking of the restored IL-1R1 protein by a 3HA tag and Il1r1 mRNA by tdTomato fluorescence (Liu et al, 2015). The Il1r1r/r restore mice exhibits an IL-1R1 knock-out phenotype. However, when crossed with cell-type specific Cre expressing mice, we can restore the Il1r1 in a cell-type specific manner. In this study, we crossed Tie2-Cre (Mouse Strain: JAX 004128), Cx3Cr1-Cre (Mouse Strain: 036395-UCD) and LysM-Cre (Mouse Strain: JAX 018956) mice with the Il1r1r/r line to produce endothelial, microglial, or peripheral myeloid cell IL-1R1 restored mice, respectively. In addition, we utilized our global reporter mouse (Il1r1GR/GR) which tracks all Il1r1 mRNA with tdTomato fluorescence.12 All mouse lines used in this study are described in Table 1.
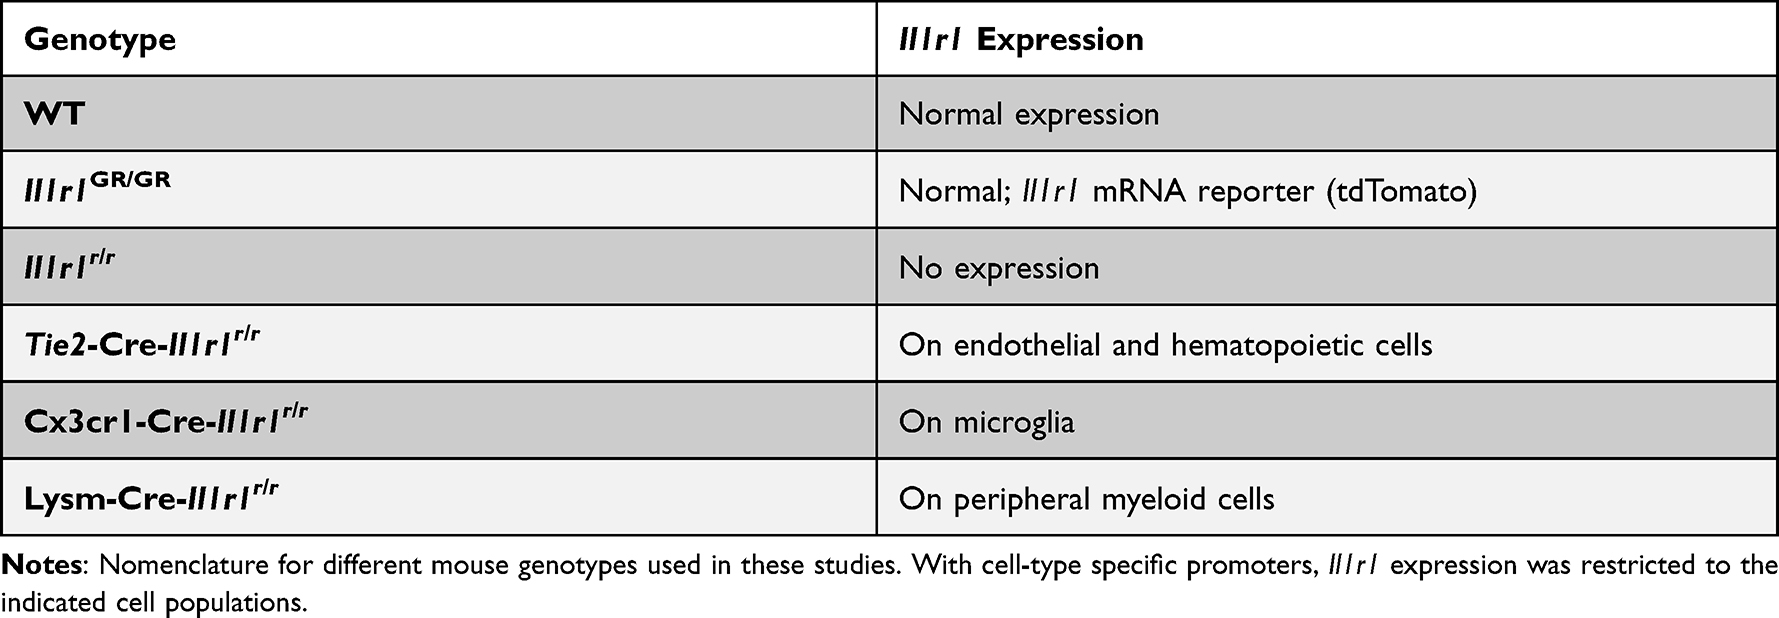 |
Table 1 Mouse Genotype Nomenclature and Expected Il1r1 Expression Patterns |
Repeated LPS Administration (4d LPS)
Animals were subjected to a regimen of intraperitoneal injections as shown in Figure 1A. In brief, 100 μL sterile PBS (Gibco, Cat#: 14190-114) or 1 mg/kg LPS (E. coli serotype 0111:B4, Sigma Aldrich, Cat#: L2630) was injected intraperitoneally (i.p.) daily for four consecutive days (4d LPS or 4d PBS). For qPCR analysis, immunohistochemical analysis and flow cytometry, animals were sacrificed 24 hrs following the final LPS or PBS injection. In a separate study, cohorts of Cx3Cr1-Cre-Il1r1r/r and LysM-Cre-Il1r1r/r were given 4d LPS or 4d PBS. 24 hrs following the final i.p. injection mice were injected intracerebroventricularly (i.c.v.) with IL-1β (R&D Systems, Cat#: 401-ML-005) or PBS and euthanized 24 hrs following the i.c.v. injections. Tissues were then collected for gene expression analysis and immunohistochemistry. This procedure is diagrammed in Figure 4A.
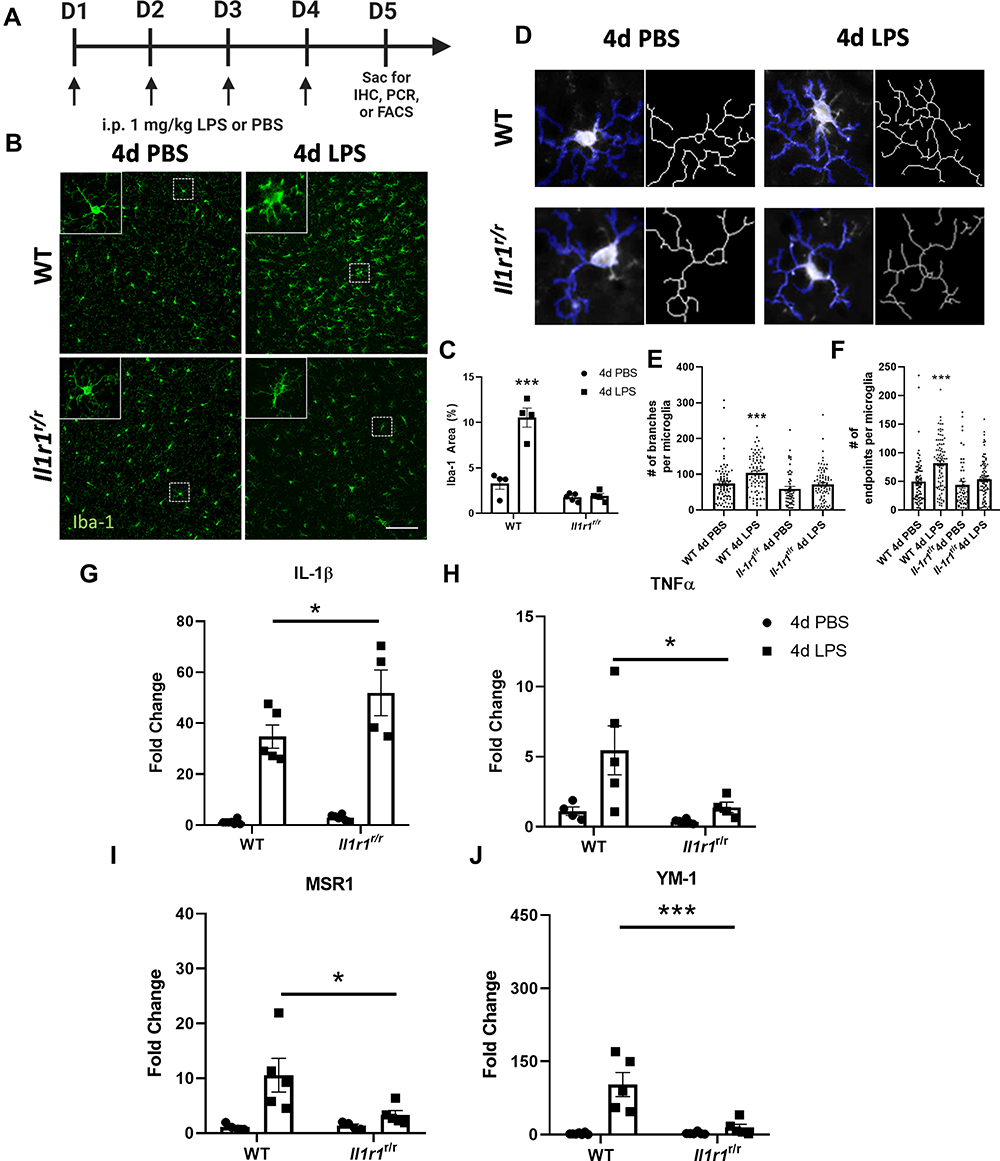 |
Figure 1 4d LPS induces IL-1R1-dependent microglial morphologies and cytokine mRNA expression changes. (A) Experimental design of repeated LPS (4d LPS). On days 1 through 4 mice are injected daily with LPS (1 mg/kg, i.p.) or PBS. 24 hrs following the final i.p. injection mice were sacrificed for IHC, PCR, or FACS analysis. (B) Fluorescent immunolabeling of Iba-1 (green) following 4d PBS or 4d LPS in WT and Il1r1r/r mice. (C) Quantification of percent area of Iba-1 immunolabeling from WT and Il1r1r/r mice treated with 4d PBS or 4d LPS (n=4–5). (D) Representative images of individual Iba-1+ microglia overlaid with a thresholded mask and skeletonized structure by Cell Profiler 3.0. (E) Quantification of the branches from individual skeletonized microglia in both WT and Il1r1r/r mice treated with either 4d PBS or 4d LPS (n=50–90 individual microglia, n=4-5). (F) Quantification of the endpoints from individual skeletonized microglia in both WT and Il1r1r/r mice treated with either 4d PBS or 4d LPS (n=50–90 individual microglia, n=4–5). Quantification of the relative hippocampal tissue mRNA expression of IL-1β (G), TNFα (H), MSR1 (I) and YM-1 (J) from WT or Il1r1r/r animals treated with 4d PBS or 4d LPS (WT PBS n=7; WT LPS n=5; Il1r1r/r PBS n=6; Il1r1r/r LPS n=4). Scale bar = 100μm.Bars represented as mean ± standard error. Data denoted with asterisk (*) were determined as statistically significant from corresponding control group (P < 0.05), following F-protected post hoc test. *p < 0.05, ***P < 0.001. |
Stereotaxic Injections
Mice were deeply anesthetized with 5% isoflurane, the surgical area was shaved, head was affixed onto a stereotaxic robot (Neurostar, Germany), and then sterilized with 4% Chlorhexidine and 70% Ethanol. Anesthesia was maintained at 1% for the remainder of the surgery while foot reflexes and respiration rate were monitored. A 5 mm incision was created over the midline of the skull and skin was retracted to reveal the skull. For intracerebroventricular (i.c.v.) injections, skull was leveled using bregma and lambda as reference, then a small burr hole was drilled over the injection site and 2 μL of IL-1β (10 ng/μL) or sterile PBS was injected into the right ventricle (coordinates relative to bregma AP: −0.7, ML: −0.5, DV: −1.2) at a rate of 1 μL/min using a pulled glass capillary affixed to a nanoinjector. Glass needle remained for 5 mins to prevent reflux and was retracted slowly (1 mm/min). The surgical incision was closed using VetBond (3M) adhesive and animal was left to recover in a clean heated cage. Post-operative buprenorphine was administered every 8 hrs until euthanasia at 24 hrs following injection for pain management.
Immunohistochemistry
Mice were euthanized using carbon dioxide and transcardially perfused with ice cold phosphate buffered saline (PBS, pH 7.4) followed by 4% Paraformaldehyde (PFA, Sigma Aldrich, Cat#:441244) in phosphate buffer. Brains were dissected out and post-fixed in 4% PFA for 24 hrs followed by cryoprotection in 20% sucrose for an additional 24 hrs. Brains were frozen in −80°C liquid isopentane and stored at −80°C until use. The brain tissues were cut on a cryostat to 40 μm-thick coronal sections. The sections were collected in a cryoprotectant solution (30% v/v ethylene glycol and 30% v/v polyethylene glycol in PB) and stored at −20ᵒC. For the IHC protocol, sections were washed 3X with PBS for 5 mins and blocked with 5% Normal Donkey Serum (NDS, Abcam, Cat#: ab7475) for 1 hour at room temperature. The sections were incubated overnight at 4°C in the primary antibodies diluted in PBS containing 1% Bovine Serum Albumin (BSA, Fischer Scientific, Cat#: BP1600100), 0.1% Triton-X 100 (Sigma Aldrich, Cat#:X100). Then, sections were washed 3X with PBS for 5 mins and incubated with a fluorochrome-conjugated secondary antibody 2 hrs at room temperature. Lastly, sections were washed 3X with PBS for 5 mins and mounted on microscope slides and cover-slipped with VectaShield Hardset Mounting medium containing DAPI (Vector Laboratories, Cat#: H-1500-10).
Antibodies
Primary antibodies used were: Rabbit-anti-Iba-1 (Wako, Cat#: 019-19741, 1:1000), Goat-anti-Iba-1 (Abcam, Cat#: ab5076, 1:500), Rat-anti-CD31 (BD Pharmingen, MEC13.3 clone, Cat#: 550274, 1:1000), goat-anti-tdTomato (SicGen, Cat#: AB8181-200, 1:500), and Rabbit-anti-P2YR12 (Anaspec, Cat#: AS-55042A, 1:2000).
Secondary antibodies (ThermoFisher Scientific, 1:500) used were: Donkey-anti-Rabbit Immunoglobulin G (IgG) polyclonal antibody conjugated with Alexa Fluor 488, Polyclonal IgG Donkey-Anti-Rat AlexaFluor 594, and polyclonal IgG Donkey-anti-goat AlexaFluor 647.
Microglia Isolation
Microglia were enriched and isolated using a Percoll gradient as previously reported.21 In brief, brains were collected 24 hrs following the final i.p. injection and homogenized with Potter-Elvehjem tissue Grinders (Wheaton) in PBS and centrifuged at 900 × g for 6 minutes. Supernatant was decanted and cells were pelleted. The cell pellets were resuspended in 70% isotonic Percoll (GE-Healthcare, Cat#: GE17-0891-01). A Percoll gradient layer (70%, 50%, 30% and 0%) was utilized to isolate the microglia based on density. The gradient was centrifuged for 20 mins at 2000 x g and enriched CD11b+ cells were collected from the interphase between the 70% and 50% layers.
Fluorescence-Activated Cell Sorting (FACs)
Microglia were detected by staining of surface antigens (CD45 and CD11b) as previously described.22 The isolated microglia were prepared for FACs by blocking with FcBlock solution (eBioscience, Cat#: 14–9161-73), washed, incubated with CD45 and CD11b antibodies to detect microglia for 1 hour at 4°C, washed, resuspended in FACS buffer. Antigen detection was determined by a cell sorting flow cytometer (BD FACSCalibur) and microglia were sorted by a CD45low/CD11b+phenotype. Sorted microglia were immediately lysed in 2-Mercaptoethanol to preserve mRNA.
Real Time-qPCR
The hippocampal tissue used for RT-qPCR analysis was collected and flash frozen at 24 hrs following the last i.p. injection or i.c.v. injection. RNA was isolated using Tri-Reagent (Millipore-Sigma, Cat#:93289) protocol. For isolated microglia, cells were lysed in 2-Mercaptoethanol and mRNA was isolated by RNeasy Kit as detailed by the manufacturer (Qiagen, Cat#: 74104). cDNA was synthesized using the Hi-Capacity reverse transcription kit (ThermoFisher Scientific, Cat#:4368814). RT-qPCR analysis was performed by using PerfeCTa Fastmix II Low ROX Mastermix (Quantabio, Cat#: 95120) and the following TaqMan primers: IL-1 (Mm01336189_m1), TNFα (Mm00443258_m1), MSR-1 (Mm00446214_m1), CHIL3/YM-1 (Mm00657889_mH), IL-1RN (Mm00446186_m1) and GAPDH (Mm99999915_g1). Cycle values were measured on an ABI PRISM 7500 sequence detection system and normalized to GAPDH reference sample. Relative gene expression was calculated using the ∆∆CT method and presented as fold change from the PBS injected controls.
A separate qPCR protocol was used to detect IL-1R1 mRNA levels. cDNA was amplified and detected using the SYBRGreen detection system. Relative IL-1R1 gene levels were detected using the primers that detect Exon IX and Exon X of IL-1R1: IL1R1-Foward, 5′-CCTCACGGCTACAATTGTATGC-3′ and IL1R1-Reverse, 5′-CAAACTGTCCCTCCAAGACC-3′.
Image Acquisition and Quantification
Images were acquired using an EVOS widefield epifluorescent microscope (Thermofisher Scientific) or Leica TCS SP8 confocal microscope. Epifluorescent images were taken at 20X magnification and channels were overlaid using ImageJ software (NIH). To measure Iba-1%, six cortical images (between −0.22 and −1.06 mm relative to bregma) per animal were acquired. Thresholds were set for individual channels to create a mask of the original image. The positive immunolabeled cell area was calculated and analyzed by the Analyze Particles plugin. For the microglial cuffing analysis, CD31 and Iba-1 channels were overlaid and an experimenter, blinded to treatment and genotype, counted morphologically distinct Iba-1+ cells with relation to CD31 immunolabeling. “Parenchymal” microglia were defined as microglia not associated with a CD31+ blood vessel. “Cuffed” microglia were defined as an Iba-1+ cell with the cell soma intersecting a CD31+ blood vessel. Groups of 3 or more cuffed microglia on the same blood vessel were considered a “cluster” of cuffed microglia. Examples of cuffed, parenchymal, and cuffed clusters of microglia can be found in Supplemental Figures 1B.
To quantify microglial morphology, up to 10 individual Iba-1+ microglia per image were selected and cropped from 20x cortical images using FIJI (ImageJ, NIH) by an experimenter blinded to the genotypes and treatment groups. Cropped microglia branches and endpoints were then analyzed. For branch and endpoint analysis, cropped microglia images were skeletonized using a custom pipeline in CellProfiler 3.0 (Broad Institute). Within the pipeline, images were first smoothed to eliminate background artefact and then 2-pixel tube-like features were enhanced to make the processes more salient. Smoothed and enhanced images were then thresholded using the 2-class Otsu thresholding method to create an object of the entire microglia. This object was further refined by creating a secondary object using the Propagation feature in relation to the original image. The refined microglia object was converted to a binary image, skeletonized, with branch and endpoint quantification was analyzed. All images were submitted to the pipeline and skeletons were manually cross referenced with the original images. Any images with incomplete or incorrect skeletons were excluded from analysis.
RNA Sequencing Data Analysis
RNA sequencing data was downloaded and analyzed from the interactive web platform (http://research-pub.gene.com/BrainMyeloidLandscape) provided by Friedman et al, 2018. In our study, the differential gene expression of Il1r1 (Gene ID: 16177, Interleukin-1 receptor type 1) in multiple disease models and innate immune responses was observed. The Log2 (fold change) or differential expression statistics were calculated using limma, voom+limma, DESeq2, or Mann–Whitney tests as provided by BrainMyleoidLandcape.
Statistical Analysis
All data analysis was performed by using GraphPad Prism software (version 8.0.1). Direct comparisons between two groups were analyzed using a Student’s t-test with an alpha of 0.05. When comparing multiple groups, One or Two-way ANOVA was conducted, and multiple comparisons were followed by Tukey’s HSD or Bonferroni post hoc test.
Results
4d LPS Induces IL-1R1-Dependent Microglia Morphology and Cytokine Expression Changes
As previously reported, 4d LPS caused consistent microglial morphological changes in the central nervous system.2,23 To determine if these changes are IL-1R1 dependent, we performed the 4d LPS procedure (as diagrammed in Figure 1A) on wild type (WT) mice and the Il1r1 functional knock-out, Il1r1r/r, mice. 24 hrs following the fourth i.p. injection, Iba-1 immunolabeled microglia were imaged within the cortex. Representative images of Iba-1+ microglia reveal morphological changes such as increased immunofluorescent intensity, soma size, and ramified processes following the treatment with 4d LPS compared to the 4d PBS controls (Figure 1B, top row). The Iba-1 proportional areas (Iba-1% area) and microglial morphological characteristics, such as branches and endpoints, were then quantified. Iba-1% area in LPS treated WT animals increased 3-fold (Figure 1C, left) and microglia from WT mice exhibited greater number of branches and endpoints compared to PBS controls (Figure 1D–F). In contrast, 4d LPS induced morphological changes and the increase of Iba-1% area were absent in the Il1r1r/r mice (Figure 1B, bottom row, Figure 1C, right, Figure 1D–F).
To determine whether 4d LPS induces M1- and M2-like gene expression, RT-qPCR of hippocampal cDNA was performed. Compared to 4d PBS treated controls, 4d LPS treated WT mice exhibited 24-fold increase in IL-1β (Figure 1G) and 6-fold increase TNFα (Figure 1H). Similarly, M2 genes, MSR-1 (Figure 1I) and YM-1 (Figure 1J) were increased 9-fold and 105-fold, respectively. However, the gene expression of TNFα, MSR1, and YM-1 was significantly reduced by more than half in Il1r1r/r mice treated with 4d LPS (Figure 1H–J) with respect to 4d LPS treated WT mice. Interestingly, IL-1β gene expression was twice as high in Il1r1r/r mice following 4d LPS compared to WT 4d LPS treated animals (Figure 1G). These data suggest that IL-1R1 signaling can regulate both microglial morphology and M1/M2 gene expression changes during 4d LPS.
4d LPS Induces IL-1R1-Dependent Cell-Specific Changes
To determine the 4d LPS-induced microglial specific gene expression, CD11b+ cells from WT mice were first enriched via a 70–50-30% Percoll gradient isolation and then the CD11b+/CD45lo microglia were sorted by FACS. The mRNA from the sorted microglia was isolated and analyzed via RT-qPCR. Microglia from 4d LPS treated WT mice showed significant increases in TNFα (3-fold), MSR-1 (93-fold), and a trend towards increased YM-1 (100-fold) expression, but not IL-1β compared to PBS treated controls (Figure 2A and B). It is well known that microglia express IL-1R1 at very low levels within the normal CNS.13,20 Interestingly, the isolated WT microglia after 4d LPS show a statistically significant 4-fold increase of Il1r1 mRNA compared to the 4d PBS controls (Figure 2C) indicating IL-1R1 expression in microglia was induced.
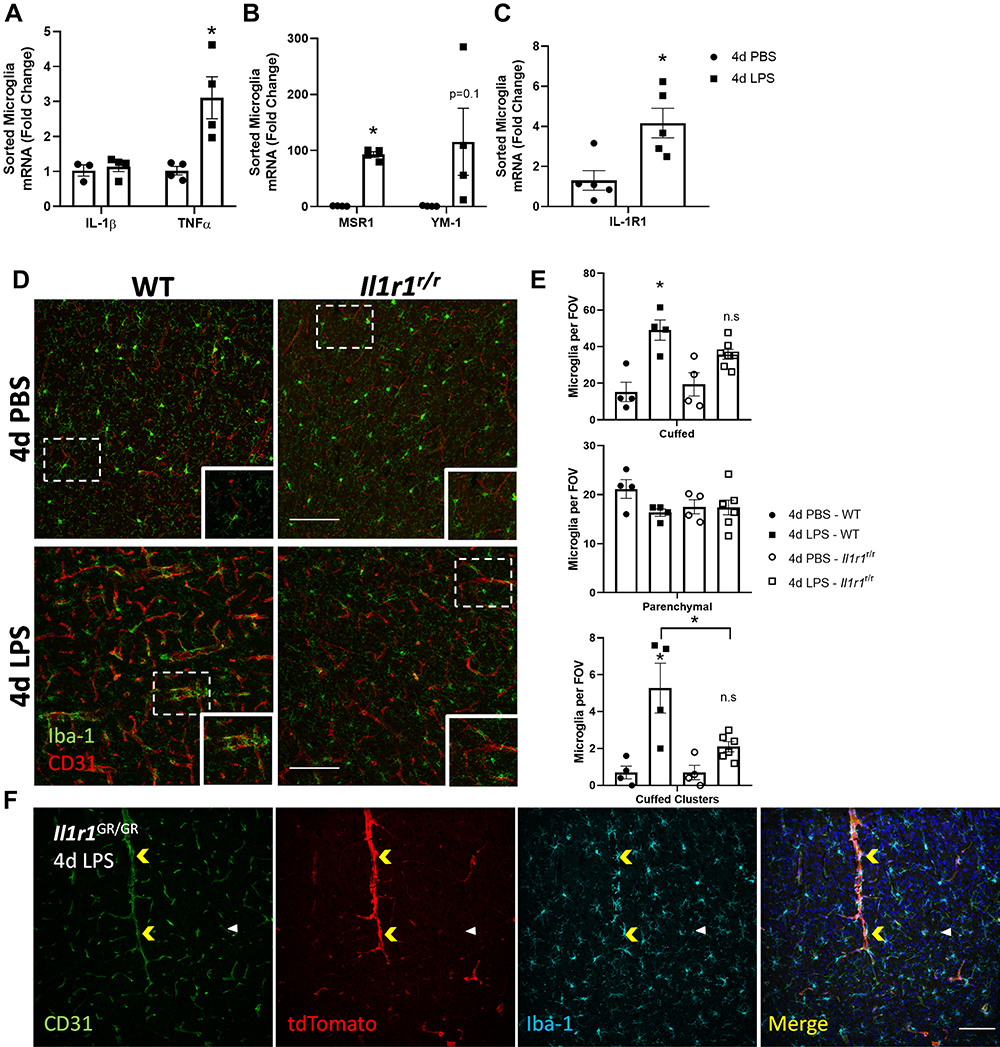 |
Figure 2 4d LPS drives cell-type specific changes in gene expression and IL-1R1-dependent microglia-vasculature interactions. Quantification of the relative mRNA expression of IL-1β (A), TNFα (A), YM-1 (B), MSR1 (B) and IL-1R1 (C) from FAC-sorted CD11b+CD45low microglia from WT mice treated with 4d LPS (n=4-5). (D) Representative immunofluorescent images of Iba-1 (green) and CD31 (red) 24 hrs following 4d PBS or 4d LPS in WT or Il1r1r/r mice. (E) Analysis of microglia morphological features including, cuffed, parenchymal, and cuffed clusters of microglia per field of view (FOV) in WT or Il1r1r/r following 4d PBS or 4d LPS (WT PBS n=4; WT LPS n=4; Il1r1r/r PBS n=4; Il1r1r/r LPS n=6). (F) Representative immunofluorescent images of CD31 (green), tdTomato (red), Iba-1 (Cyan) and merged channels from IL-1R1 reporter mouse, Il1r1GR/GR after 4d LPS. Yellow arrows denote microglia clustering on tdTomato+/CD31+ blood vessels. White arrow denote tdTomato−/CD31+ blood vessel without microglia clustering. Scale bar = 100 μm. Bars represented as mean ± standard error. Data denoted with asterisk (*) were determined as statistically significant from corresponding control group (P < 0.05) following F-protected post hoc test. *p < 0.05. |
4d LPS Induces IL-1R1-Dependent Microglia Clustering on the Blood Vessels
Previous reports have shown that repeated LPS injections can drive direct physical interactions between resident microglia and vasculature.2,5,24 In agreement, we found 4d LPS induced Iba-1+ microglia cuffing on the CD31+ blood vessels (Figure 2D, left). Additionally, these microglia were also P2YR12+ indicating they are, indeed, microglia (Supplemental Figure 1A). In this study, we distinguished three microglial phenotypes in relation to the blood vessels: parenchymal, cuffed, and clustered microglia. Parenchymal microglia are identified as Iba-1+ labeled cells that are not intersecting a CD31+ labeled blood vessel. Cuffed microglia are identified as Iba1+ labeled microglia whose soma intersects a CD31+ labeled blood vessel. A microglial cluster is identified as multiple (at least three or more) cuffed microglia associated to a single CD31+ labeled blood vessel segment. These three microglial morphological phenotypes were quantified per FOV within the cortex. Compared to the PBS treated control, 4d LPS treated WT mice showed a statistically significant tripling in cuffed microglia (Figure 2E, top) and five times the amount of clustered (Figure 2E, bottom) microglia, but there was no difference in parenchymal microglia per FOV (Figure 2E, middle). However, the amount of cuffed or clustered microglia did not significantly increase following 4d LPS in the Il1r1r/r mice (Figure 2D and E) compared to 4d PBS treated Il1r1r/r mice. This suggests that the 4d LPS induced microglial clustering can be modified by IL-1R1. Utilizing our IL-1R1 reporter mouse, IL-1R1GR/GR, where tdTomato faithfully tracks all IL-1R1 mRNA expression, we immunolabeled Iba-1, tdTomato, and CD31 to determine if the microglial clustering is associated with IL-1R1 positive blood vessels. Iba-1+ microglia primarily clustered onto tdTomato+/CD31+ blood vessels (Figure 2F, yellow arrows), but not tdTomato−/CD31+ (white arrows), blood vessels. This suggests following 4d LPS microglia specifically cluster onto the IL-1R1+ blood vessels in an IL-1R1 dependent manner.
Roles of Endothelial IL-1R1 and Microglial IL-1R1 During LPS Preconditioning
To examine the roles of endothelial (eIL-1R1) and microglial IL-1R1 (mIL-1R1) in 4d LPS induced microglial phenotypes we utilized, cell-type specific Il1r1 restore lines; Tie2-Cre-Il1r1r/r which will restore Il1r1 only on endothelial cells or Cx3Cr1-Cre-Il1r1r/r mice which will restore Il1r1 only on microglia. In both lines, 4d LPS or 4d PBS animals were sacrificed 24 hrs following the final i.p. injection and both CD31 and Iba-1 were immunolabeled. Representative images of Tie2-Cre-Il1r1r/r mice given 4d LPS showed changes in microglia morphology and proximity of microglia to the BBB compared to 4d PBS controls (Figure 3A). The number of cuffed microglia was significantly increased from 7 to 45 per FOV, and the number of clustered microglia increased 7-fold (Figure 3B) in the 4d LPS treated Tie2-Cre-Il1r1r/r mice. Further microglial morphology quantification revealed that, in the Tie2-Cre-Il1r1r/r mice, 4d LPS induced an 8% increase in Iba-1% area (Figure 3C). Thresholded and skeletonized microglia from 4d PBS or 4d LPS treated Tie2-Cre-Il1r1r/r mice showed distinct morphological changes (Figure 3D) and quantification of microglial endpoints and branches showed doubling of both (Figure 3E) compared to 4d PBS treated Tie2-Cre-Il1r1r/r mice. Representative images of Cx3Cr1-Cre-Il1r1r/r treated with 4d LPS do not show changes to microglial morphology but rather showed changes to the proximity of microglia to the BBB (Figure 3F). In the Cx3Cr1-Cre-Il1r1r/r mice, 4d LPS only caused an increase of in the number of cuffed, but not clustered, microglia (Figure 3G) and no changes to Iba1% area were detected (Figure 3H). Further characterization of microglia shows 4d LPS does not change number of branches and endpoints in microglia (Figure 3I and J). These results suggest that eIL-1R1 signaling is sufficient for microglia clustering at the brain vasculature and microglial morphological changes.
 |
Figure 3 Endothelial IL-1R1 modulates microglial-vasculature interactions. Representative immunofluorescent images of Iba-1 (green) and CD31 (red) following 4d PBS or 4d LPS in Tie2-Cre-Il1r1r/r mice (A) or Cx3cr1-Cre-Il1r1r/r (F). Counts of cuffed, parenchymal, and clusters of cuffed microglia in Tie2-Cre-Il1r1r/r (B) or Cx3cr1-Cre-Il1r1r/r (G) following 4d PBS or 4d LPS (Tie2-Cre-Il1r1r/r n=4; Cx3cr1-Cre-Il1r1r/r n=3–4). Quantification of Iba-1% area in Tie2-Cre-Il1r1r/r (C) or Cx3cr1-Cre-Il1r1r/r (H) mice treated with 4d PBS or 4d LPS (Tie2-Cre-Il1r1r/r n=4; Cx3cr1-Cre-Il1r1r/r n=3–4). Representative images of individual Iba-1+ microglia overlaid with a thresholded mask and skeletonized structure by Cell Profiler 3.0 (D and I). Quantification of the branches and endpoints of individual skeletonized microglia from Tie2-Cre-Il1r1r/r (E) or Cx3cr1-Cre-Il1r1r/r (J) mice treated with 4d PBS or 4d LPS (Tie2-Cre-Il1r1r/r n=40 individual microglia, n=4-5 mice; Cx3cr1-Cre-Il1r1r/r n=30–70 individual microglia, n= 4–5. Quantification of the relative hippocampal tissue mRNA expression of IL-1β, TNFα, YM-1, and MSR1 from Tie2-Cre-Il1r1r/r (K) or Cx3cr1-Cre-Il1r1r/r (L) animals treated with 4d PBS vs 4d LPS (Tie2-Cre-Il1r1r/r n=4-5; Cx3cr1-Cre-Il1r1r/r n=4–5). Scale bar = 100μm. Bars represented as mean ± standard error. Data denoted with asterisk (*) were determined as statistically significant from corresponding control group (P < 0.05) following F-protected post hoc test. *p < 0.05, **p < 0.01, ***P < 0.001. |
Role of eIL-1R1 and mIl-1R1 in 4d LPS Induced Gene Expression Changes
To determine the role of eIL-1R1 and mIL-1R1 in 4d LPS induced gene expression, Tie2-Cre-Il1r1r/r and Cx3Cr1-Cre-Il1r1r/r mice used to examine M1 or M2 mRNA genes in the hippocampus. In the Tie2-Cre-Il1r1r/r mice, 4d LPS caused significant increases in IL-1β, MSR1, and YM-1 but not TNFα (Figure 3K). On the other hand, in the Cx3Cr1-Cre-Il1r1r/r mice, 4d LPS caused significant increases in TNFα but not the other IL-1R1 dependent genes (Figure 3L). These data suggest eIL-1R1 plays a role in the expression of IL-1β, MSR1 and YM-1, whereas microglia IL-1R1 may control expression of TNFα.
4d LPS Induced Functional mIL-1R1 Expression
Previous reports have shown that microglia in the normal brain express low levels of IL-1R1 and do not directly respond to IL-1β administration.11 In this study, we found microglia from 4d LPS WT mice upregulated IL-1R1 expression (Figure 2C). To confirm this, we used the Cx3Cr1-Cre-Il1r1r/r mouse line, which restricts IL-1R1 expression to microglia. Following 4d LPS, IL-1R1 mRNA expression in hippocampal tissue increased 10-fold compared to PBS treated controls (Figure 4A). This novel finding suggests that microglia may gain the ability to directly respond to IL-1β in the LPS preconditioned brain. To test whether the 4d LPS-induced mIL-1R1 was functional and responsive, 4d LPS or PBS treated Cx3Cr1-Cre-Il1r1r/r mice were subsequently challenged with an i.c.v. injection of IL-1β or PBS. Microglia morphology and cytokine mRNA levels were analyzed 24 hrs after the i.c.v. injections (as diagrammed in Figure 4B). Interestingly, in the 4d LPS treated Cx3Cr1-Cre-Il1r1r/r mice, i.c.v. IL-1β caused distinct microglial morphological changes such as enlarged cell bodies and shortened and thickened processes (Figure 4C). In addition, i.c.v. IL-1β caused 15-fold increase in IL-1β (Figure 4D), no change in TNFα (Figure 4E), and a 4-fold increase in IL-1RA (Figure 4F) gene expression changes in the 4d LPS treated Cx3Cr1-Cre-Il1r1r/r mice. A caveat here is Cx3Cr1-Cre may be expressed on peripheral myeloid cells. Therefore, Cx3Cr1-Cre-Il1r1r/r mice might have off target IL-1R1 expression on these cells. To exclude the possibility that the induced response in the Cx3Cr1-Cre-Il1r1r/r mice is from peripheral myeloid IL-1R1, we repeated this experiment in LysM-Cre-Il1r1r/r mice, where IL-1R1 gene expression is restricted to the myeloid cell lineages. This time, i.c.v. IL-1β did not cause gene changes in the 4d LPS LysM-Cre-Il1r1r/r mice (Figure 4G–I), suggesting that the response in Cx3Cr1-Cre-Il1r1r/r mice can, indeed, be attributed to mIL-1R1 and not infiltrating myeloid cells.
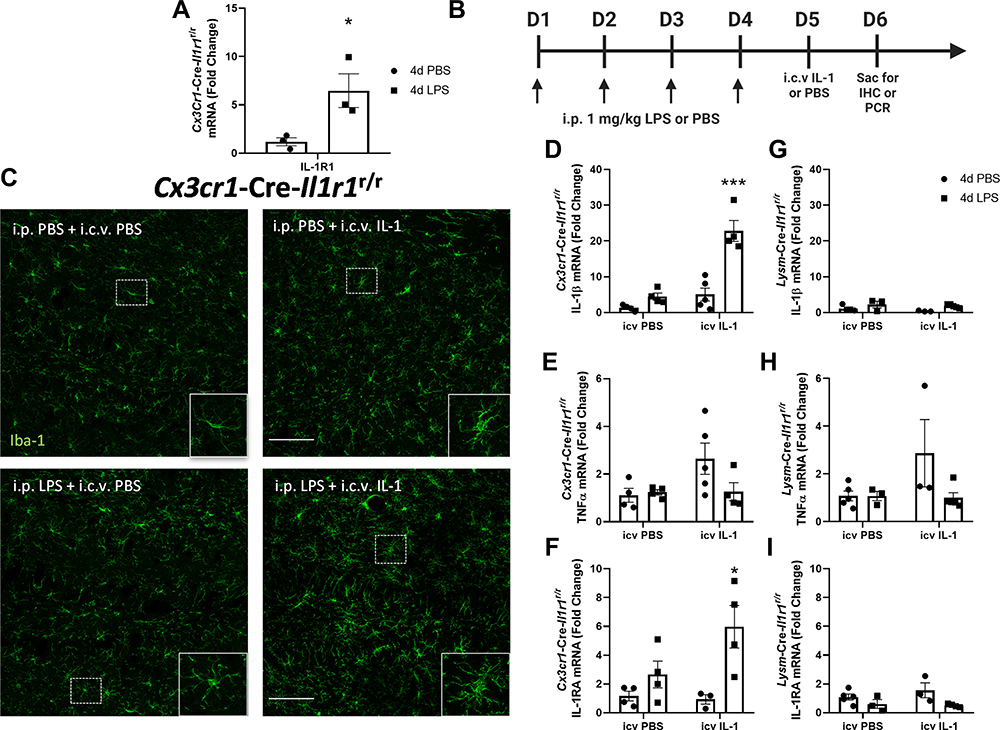 |
Figure 4 4d LPS induces functional IL-1R1 on microglia. (A) Quantification of the relative mRNA expression of IL-1R1 from Cx3cr1-Cre-Il1r1r/r treated mice for 4d PBS or 4d LPS (n=3). (B) Experimental design of 4d LPS plus i.c.v. IL-1 challenge. On days 1 through 4, mice are injected i.p. with 1mg/kg LPS or PBS. 24 hours following the final i.p. injection, mice were injected with IL-1β (20 ng, i.c.v) and sacrificed 24 hrs after for IHC and PCR analysis. (C) Representative images of fluorescent immunolabeling of Iba-1 (green) following 4d PBS or 4d LPS followed by i.c.v. IL-1 or PBS in Cx3cr1-Cre-Il1r1r/r mice. Relative hippocampal tissue mRNA expression of IL-1β, TNFα and IL-1RA in Cx3cr1-Cre-Il1r1r/r (D–F) or Lysm-Cre-Il1r1r/r (G–I) animals treated with 4d PBS vs 4d LPS followed by i.c.v PBS or IL-1 (Cx3cr1-Cre-Il1r1r/r n=4-5; Lysm-Cre-Il1r1r/r n=3-5). Scale bar = 100μm. Bars represented as mean ± standard error. Data denoted with asterisk (*) were determined as statistically significant from corresponding control group (P < 0.05) following F-protected post hoc test. *p < 0.05, ***P < 0.001 from PBS treated controls. |
Inducible mIL-1R1 is Found in Models of Chronic Neurodegenerative Diseases and Systemic Infection
The emerging mIL-1R1 after 4d LPS may contribute to important physiological functions in the CNS. To provide insight into what conditions may cause mIL-1R1 to arise, we utilized a collection of myeloid and microglia specific RNA sequencing data from Friedman et al, 2018 and Srinivasan et al, 2020 (Figure 5A). Five of the studies showed a statistically significant increase in Il1r1 gene expression in microglia were primarily animal models of Alzheimer’s disease. In amyloid-β mutation mouse models, mIL-1R1 increased 2.5 times in 13-month-old PS2APP mice (Figure 5B), doubled in the 5xFAD transgenic mice (Figure 5C), and showed a significant 11% in the APPswe/PS1dE9 mouse model (Figure 5D) compared to the non-transgenic (non-Tg) controls. In the hMAPT-P301S tauopathy animal model, mIL-1R1 (Figure 5E) was increased by 150% compared to the non-Tg controls. In a systemic infection model, a 7.5-fold increase in mIL-1R1 mRNA level was observed within mouse microglia 6 hrs following a large dose of i.p. LPS (10 mg/kg) (Figure 5F). Additionally, in the spinal cord at the end stage of the hSOD1-G93A amyotrophic lateral sclerosis (ALS) model showed a 7.5-fold increase in mIL-1R1 gene expression (Figure 5G).25,26 These data suggest that inducible mIL-1R1 is a common response to neuroinflammation.
 |
Figure 5 Microglial IL-1R1 induction is found in neurodegenerative diseases and following peripheral infections. (A) RNA sequencing analysis from Friedman et al, 2018 of microglia-specific Il1r1 log transformed differential gene expression in models of neurodegenerative disease, infection, and human disease. Differential gene expression of Il1r1 in FACS sorted brain microglia from (B) 7 month or 13 month non-transgenic or PS2APP mice (n=5), (C) 8.5 month old non-transgenic or 5xFAD mice (n=5), (D) 15–18 month old non-transgenic or APPswe/PS1dE9 mice (n=7), (E) non-transgenic or hMAPT-P301S mice or (F) 6 hrs following i.p. injection of vehicle or 10 mgkg−1 LPS (n=5). (G) Differential gene expression of Il1r1 mRNA in FAC-sorted spinal cord microglia (CD11b, CD86, CD11c cells) in hSOD-G93A model of ALS at 65d, 100d, 130d and end stage. Bars represented as mean ± standard error, *p < 0.05, **p < 0.01, ***P < 0.001 from corresponding controls. |
Discussion
The present study aimed to elucidate the impact of IL-1R1 signaling in relation to the known neuroprotective processes seen in LPS preconditioning. In the literature, LPS preconditioning causes changes at the blood brain barrier BBB,5,10,24,27,28 M2-like gene expression,7,29–31 and microglial activation,1,2,6,23 all of which have been correlated with enhanced neuroprotection.
In LPS preconditioning, alterations to the BBB are thought to provide additional protection from future injuries. Indeed, LPS preconditioning has been shown to reduce neuronal damage and infarct volume following ischemia via endothelial produced byproducts.27,32 Tightening of the BBB is one possible alteration that may provide additional neuroprotective support for the CNS. While high doses of LPS can cause damage to the BBB,33 the model of LPS preconditioning in this study does not induce overt signs of BBB degradation.5,8,34 This regimen of LPS preconditioning can prevent, rather than cause, fibrinogen leakage into the CNS following ischemic injury, suggesting that BBB is being protected rather than destroyed.5 Mounting evidence shows that the enhanced tightening at the BBB may be attributed to the increased association of microglia to blood vessels, also known as microglial cuffing. During LPS preconditioning, microglia send their processes through the basal membrane of blood vessels and this action is associated with tight junction gene expression in microglia. In addition, ablation of microglia prior to LPS preconditioning leads to a more permeable BBB.24 These results suggest LPS preconditioning causes microglia to physically integrate and strengthen the BBB.
Another possible neuroprotective mechanism with regard to the BBB may be an altered responsiveness of endothelium to subsequent inflammatory challenge. Priming of cultured human endothelial cells with LPS decreases their response to thrombin-induced inflammation28 suggesting LPS pretreatment can diminish endothelial proinflammatory capacity. LPS preconditioning also causes increased endothelial IL-1R1,5 eNOS,27 and VCAM32 gene expression by the CNS endothelium which are correlated with reduction of neuronal injury following ischemia. In this study, we found that microglia preferentially clustered onto IL-1R1 expressing endothelia and eIL-1R1 controls microglial clustering following 4d LPS. Taken together, IL-1R1 signaling may be important for the neuroprotective processes at the BBB.
Another way LPS preconditioning induces a neuroprotective state is to cause a M1 (pro-inflammatory) to M2 (reparative) shift in microglia. The expression of M2 genes, such as IL-4R, IL-1Ra, SOCS3, YM-1 and MSR1, has been associated with anti-inflammation and pathogen scavenging mechanisms, thereby improving the outcomes after brain2 or spinal cord35 injury. M2 microglia activation during spinal cord injury was found to require IL-1β,36 highlighting the importance of IL-1 signaling in the M1 to M2 transition. The role of IL-1R1 signaling in LPS preconditioning-induced M2 gene expression has yet to be clearly identified. The present results reveal that LPS-induced M2 gene expression, such as YM-1 and MSR1, is dependent on IL-1R1 signaling. Further, endothelial, but not microglial, IL-1R1 is crucial for mediating these changes.
In the current dataset, 4d LPS treated mice lacking IL-1R1 show elevated levels of brain IL-1β mRNA levels compared to 4d LPS treated WT mice. This increase of IL-1β production may be due to a few factors: 1) IL-1R1 may be required as a negative feedback signal for IL-1β production and 2) peripheral IL-1β expressing leukocytes may be recruited to the BBB. Recent studies show IL-1R1 KO mice following chronic stress show elevated IL-1β mRNA expression compared to stressed WT controls.37 This suggests that IL-1β expression in long lasting inflammatory conditions may require IL-1R1 to act as a negative regulator of IL-1β. Indeed, during LPS-induced inflammation knocking out IKKβ, a factor upstream of NFκB activation, causes the increase of blood IL-1β production.38 This suggests that NFκB, the canonical downstream pathway of IL-1R1, is an important negative regulator of IL-1β production. Secondly, IL-1R1 signaling is well known to recruit peripheral leukocytes to the CNS and the lack of IL-1R1 prevents leukocytes from being recruited to the brain.37,39 Stimulation of eIL-1R1 with IL-1 induces monocyte and neutrophil recruitment to the brain parenchyma.12,13 In this LPS preconditioning model, peripheral leukocytes are not known to infiltrate into the brain parenchyma.2 In addition, we did not find infiltrating leukocytes in the brain after 4d LPS (data not shown). Therefore, the increase in IL-1β expression in IL-1R1 KO mice following 4d LPS may be due to the lack of negative regulators of IL-1β expression and not leukocyte recruitment.
A prerequisite for LPS-induced neuroprotection is the activation of microglia. Ablation of microglia with a CSF1R inhibitor nullifies the protective effects of LPS preconditioning seen in spinal cord injury, thus establishing a causal relationship between LPS preconditioning-induced neuroprotection and microglial activation.5 One form of microglial activation is the morphological changes to microglia during an immune challenge. LPS preconditioning consistently induces microglial morphological changes that gradually intensify over the subsequent days of LPS injections.2,5 In this study, we found that IL-1R1 signaling was essential for microglial morphological changes. Additionally, microglial morphological changes during LPS preconditioning depended on eIL-1R1. Endothelial IL-1R1 is a well-known activator of microglial phenotypic changes, specifically pro-inflammatory gene expression and microglial morphological changes. Endothelial cells are known to activate microglial through soluble factors which are produced downstream of IL-1R1 through NFκB-dependent mechanisms. One potential factor that drives this proinflammatory microglial phenotype is cleaved hyaluronic acid.11 This mechanism is not well understood and requires more study. The present results, however, suggest that microglial morphological changes are mediated by endothelial IL-1R1 in the neuroprotective LPS preconditioning.
One unexpected and novel finding following LPS preconditioning was the emergence of microglial IL-1R1. Under basal conditions, mIL-1R1 is undetectable and microglia marginally respond to IL-1β.13 In vitro direct stimulation of microglia with LPS can drive IL-1R1 production but mIL-1R1 dependent products were not examined.20 Following LPS preconditioning, newly expressed mIL-1R1 allows microglia to directly respond to subsequent IL-1β administration via change of morphology and production of IL-1 family cytokines. As previously stated, microglia morphological changes during the 4d LPS paradigm were dependent on eIL-1R1 but not mIL-1R1; however, mIL-1R1 stimulated with IL-1β following LPS preconditioning was able to induce microglial morphological changes. This demonstrates increased sensitivity of microglia to IL-1β after 4d LPS, which were now capable of altering morphology in response to direct IL-1β stimulation. Similarly, LPS preconditioned microglia produced much higher levels of IL-1β upon IL-1 stimulation compared to non-conditioned microglia. Additionally, one of the major products of mIL-1R1 signaling is IL-1RA, which functions as an anti-inflammatory regulator. It is possible that the production of IL-1RA, in the context of LPS-induced neuroprotection, can block IL-1β signaling in cell types such as endothelial cells, which have a major role in the induction of inflammatory cytokines. The induction of mIL-1R1 and the ability to produce IL-1RA may be critical for LPS-mediated neuroprotection. Indeed, conditional deletion of mIL-1R1 drastically reversed LPS preconditioning-induced neuroprotection in a model of spinal cord ischemia.5
Taken together, the data suggest that the two hallmarks associated with LPS-induced neuroprotection —microglial morphology and M2-like gene expression— can be produced via the newly expressed mIL-1R1 which may be a novel mechanism for how microglia provide neuroprotection following LPS preconditioning. Interestingly, mIL-1R1 is upregulated across many models of neurodegenerative disease, specifically in Alzheimer’s disease and septic peripheral infection models. In addition, many of these disease models that also exhibited microglial production of IL-1RA (data from MyleoidLandscape2, not shown). Thus, the commonly induced mIL-1R1 in these disease states may play a role in neuroprotection and should be a topic of further investigation.
Data Sharing Statement
The data that support the findings of this study are available from the corresponding author upon reasonable request.
Acknowledgments
This study was funded by National Institute of Mental Health grant R01-MH-109165 to N.Q and National Institute of Dental and Craniofacial Research training grant 5T32DE014320-20 to D.P.N and D.J.D. Graphical abstract was created with Biorender.com.
Disclosure
The authors report no conflicts of interest in this work.
References
1. Amini E, Golpich M, Farjam AS, et al. Brain lipopolysaccharide preconditioning-induced gene reprogramming mediates a tolerance state in electroconvulsive shock model of epilepsy. Front Pharmacol. 2018;9. doi:10.3389/fphar.2018.00416
2. Chen Z, Jalabi W, Shpargel KB, et al. Lipopolysaccharide-induced microglial activation and neuroprotection against experimental brain injury is independent of hematogenous TLR4. J Neurosci. 2012;32(34):11706–11715. doi:10.1523/JNEUROSCI.0730-12.2012
3. Rosenzweig Holly L, Lessov Nikola S, Henshall David C, Manabu M, Simon Roger P, Stenzel-Poore Mary P. Endotoxin preconditioning prevents cellular inflammatory response during ischemic neuroprotection in mice. Stroke. 2004;35(11):2576–2581. doi:10.1161/01.STR.0000143450.04438.ae
4. Vartanian KB, Stevens SL, Marsh BJ, Williams-Karnesky R, Lessov NS, Stenzel-Poore MP. LPS preconditioning redirects TLR signaling following stroke: TRIF-IRF3 plays a seminal role in mediating tolerance to ischemic injury. J Neuroinflammation. 2011;8(1):140. doi:10.1186/1742-2094-8-140
5. Freria CM, Brennan FH, Sweet DR, et al. Serial systemic injections of endotoxin (LPS) elicit neuroprotective spinal cord microglia through IL-1-dependent cross talk with endothelial cells. J Neurosci. 2020;40(47):9103–9120. doi:10.1523/JNEUROSCI.0131-20.2020
6. Neher JJ, Cunningham C. Priming microglia for innate immune memory in the brain. Trends Immunol. 2019;40(4):358–374. doi:10.1016/j.it.2019.02.001
7. Hayakawa K, Okazaki R, Morioka K, Nakamura K, Tanaka S, Ogata T. Lipopolysaccharide preconditioning facilitates M2 activation of resident microglia after spinal cord injury. J Neurosci Res. 2014;92(12):1647–1658. doi:10.1002/jnr.23448
8. Banks WA, Robinson SM. Minimal penetration of lipopolysaccharide across the murine blood-brain barrier. Brain Behav Immun. 2010;24(1):102–109. doi:10.1016/j.bbi.2009.09.001
9. Chakravarty S. Toll-like receptor 4 on nonhematopoietic cells sustains CNS inflammation during endotoxemia, independent of systemic cytokines. J Neurosci. 2005;25(7):1788–1796. doi:10.1523/JNEUROSCI.4268-04.2005
10. Lacroix S, Feinstein D, Rivest S. The bacterial endotoxin lipopolysaccharide has the ability to target the brain in upregulating its membrane CD14 receptor within specific cellular populations. Brain Pathol. 1998;8(4):625–640. doi:10.1111/j.1750-3639.1998.tb00189.x
11. Zhu L, Liu X, Nemeth DP, et al. Interleukin-1 causes CNS inflammatory cytokine expression via endothelia-microglia bi-cellular signaling. Brain Behav Immun. 2019;81:292–304. doi:10.1016/j.bbi.2019.06.026
12. Liu X, Yamashita T, Chen Q, et al. Interleukin 1 type 1 receptor restore: a genetic mouse model for studying interleukin 1 receptor-mediated effects in specific cell types. J Neurosci. 2015;35(7):2860–2870. doi:10.1523/JNEUROSCI.3199-14.2015
13. Liu X, Nemeth DP, McKim DB, et al. Cell-type-specific interleukin 1 receptor 1 signaling in the brain regulates distinct neuroimmune activities. Immunity. 2019;50(2):317–333.e6. doi:10.1016/j.immuni.2018.12.012
14. Krasnow SM, Knoll JG, Verghese SC, Levasseur PR, Marks DL. Amplification and propagation of interleukin-1β signaling by murine brain endothelial and glial cells. J Neuroinflammation. 2017;14(1). doi:10.1186/s12974-017-0908-4
15. Skelly DT, Griffin ÉW, Murray CL, et al. Acute transient cognitive dysfunction and acute brain injury induced by systemic inflammation occur by dissociable IL-1-dependent mechanisms. Mol Psychiatry. 2019;24(10):1533–1548. doi:10.1038/s41380-018-0075-8
16. Turner M, Chantry D, Buchan G, Barrett K, Feldmann M. Regulation of expression of human IL-1 alpha and IL-1 beta genes. J Immunol. 1989;143(11):3556–3561.
17. Matsuwaki T, Shionoya K, Ihnatko R, et al. Involvement of interleukin-1 type 1 receptors in lipopolysaccharide-induced sickness responses. Brain Behav Immun. 2017;66:165–176. doi:10.1016/j.bbi.2017.06.013
18. Paeschke N, Von Haefen C, Endesfelder S, Sifringer M, Spies CD. Dexmedetomidine prevents lipopolysaccharide-induced microRNA expression in the adult rat brain. Int J Mol Sci. 2017;18(9):1830. doi:10.3390/ijms18091830
19. Quan N, Whiteside M, Herkenham M. Time course and localization patterns of interleukin-1β messenger RNA expression in brain and pituitary after peripheral administration of lipopolysaccharide. Neuroscience. 1998;83(1):281–293. doi:10.1016/S0306-4522(97)00350-3
20. Pinteaux E, Parker LC, Rothwell NJ, Luheshi GN. Expression of interleukin-1 receptors and their role in interleukin-1 actions in murine microglial cells. J Neurochem. 2002;83(4):754–763. doi:10.1046/j.1471-4159.2002.01184.x
21. McKim DB, Patterson JM, Wohleb ES, et al. Sympathetic release of splenic monocytes promotes recurring anxiety following repeated social defeat. Biol Psychiatry. 2016;79(10):803–813. doi:10.1016/j.biopsych.2015.07.010
22. McKim DB, Niraula A, Tarr AJ, Wohleb ES, Sheridan JF, Godbout JP. Neuroinflammatory dynamics underlie memory impairments after repeated social defeat. J Neurosci. 2016;36(9):2590–2604. doi:10.1523/JNEUROSCI.2394-15.2016
23. Norden DM, Trojanowski PJ, Villanueva E, Navarro E, Godbout JP. Sequential activation of microglia and astrocyte cytokine expression precedes increased Iba-1 or GFAP immunoreactivity following systemic immune challenge. Glia. 2016;64(2):300–316. doi:10.1002/glia.22930
24. Haruwaka K, Ikegami A, Tachibana Y, et al. Dual microglia effects on blood brain barrier permeability induced by systemic inflammation. Nat Commun. 2019;10(1):5816. doi:10.1038/s41467-019-13812-z
25. Friedman BA, Srinivasan K, Ayalon G, et al. Diverse brain myeloid expression profiles reveal distinct microglial activation states and aspects of alzheimer’s disease not evident in mouse models. Cell Rep. 2018;22(3):832–847. doi:10.1016/j.celrep.2017.12.066
26. Srinivasan K, Friedman BA, Etxeberria A, et al. Alzheimer’s patient microglia exhibit enhanced aging and unique transcriptional activation. Cell Rep. 2020;31(13):107843. doi:10.1016/j.celrep.2020.107843
27. Lin H-Y, Wu C-L, Huang -C-C. The akt-endothelial nitric oxide synthase pathway in lipopolysaccharide preconditioning-induced hypoxic-ischemic tolerance in the neonatal rat brain. Stroke. 2010;41(7):1543–1551. doi:10.1161/STROKEAHA.109.574004
28. Wada Y, Otu H, Wu S, et al. Preconditioning of primary human endothelial cells with inflammatory mediators alters the “set point” of the cell. FASEB J. 2005;19(13):1914–1916. doi:10.1096/fj.05-4037fje
29. Fenn AM, Henry CJ, Huang Y, Dugan A, Godbout JP. Lipopolysaccharide-induced interleukin (IL)-4 receptor-α expression and corresponding sensitivity to the M2 promoting effects of IL-4 are impaired in microglia of aged mice. Brain Behav Immun. 2012;26(5):766–777. doi:10.1016/j.bbi.2011.10.003
30. Qin Y, Sun X, Shao X, et al. Lipopolysaccharide preconditioning induces an anti-inflammatory phenotype in BV2 microglia. Cell Mol Neurobiol. 2016;36(8):1269–1277. doi:10.1007/s10571-015-0324-1
31. Schaafsma W, Zhang X, van Zomeren KC, et al. Long-lasting pro-inflammatory suppression of microglia by LPS-preconditioning is mediated by RelB-dependent epigenetic silencing. Brain Behav Immun. 2015;48:205–221. doi:10.1016/j.bbi.2015.03.013
32. Smithason S, Moore SK, Provencio JJ. Low-dose lipopolysaccharide injection prior to subarachnoid hemorrhage modulates delayed deterioration associated with vasospasm in subarachnoid hemorrhage. Acta Neurochir Suppl. 2013;115:253–258. doi:10.1007/978-3-7091-1192-5_45
33. Banks WA, Gray AM, Erickson MA, et al. Lipopolysaccharide-induced blood-brain barrier disruption: roles of cyclooxygenase, oxidative stress, neuroinflammation, and elements of the neurovascular unit. J Neuroinflammation. 2015;12(1). doi:10.1186/s12974-015-0434-1
34. Jin L, Nation RL, Li J, Nicolazzo JA. Species-dependent blood-brain barrier disruption of lipopolysaccharide: amelioration by colistin in vitro and in vivo. Antimicrob Agents Chemother. 2013;57(9):4336–4342. doi:10.1128/AAC.00765-13
35. Kigerl KA, Gensel JC, Ankeny DP, Alexander JK, Donnelly DJ, Popovich PG. Identification of two distinct macrophage subsets with divergent effects causing either neurotoxicity or regeneration in the injured mouse spinal cord. J Neurosci. 2009;29(43):13435–13444. doi:10.1523/JNEUROSCI.3257-09.2009
36. Sato A, Ohtaki H, Tsumuraya T, et al. Interleukin-1 participates in the classical and alternative activation of microglia/macrophages after spinal cord injury. J Neuroinflammation. 2012;9(1):65. doi:10.1186/1742-2094-9-65
37. DiSabato DJ, Nemeth DP, Liu X, et al. Interleukin-1 receptor on hippocampal neurons drives social withdrawal and cognitive deficits after chronic social stress. Mol Psychiatry. 2020:1–13. doi:10.1038/s41380-020-0788-3.
38. Greten FR, Arkan MC, Bollrath J, et al. NF-κB Is a negative regulator of IL-1β secretion as revealed by genetic and pharmacological inhibition of IKKβ. Cell. 2007;130(5):918–931. doi:10.1016/j.cell.2007.07.009
39. Batista SJ, Still KM, Johanson D, et al. Gasdermin-D-dependent IL-1α release from microglia promotes protective immunity during chronic Toxoplasma gondii infection. Nat Commun. 2020;11(1):3687. doi:10.1038/s41467-020-17491-z
 © 2022 The Author(s). This work is published and licensed by Dove Medical Press Limited. The
full terms of this license are available at https://www.dovepress.com/terms
and incorporate the Creative Commons Attribution
- Non Commercial (unported, 3.0) License.
By accessing the work you hereby accept the Terms. Non-commercial uses of the work are permitted
without any further permission from Dove Medical Press Limited, provided the work is properly
attributed. For permission for commercial use of this work, please see paragraphs 4.2 and 5 of our Terms.
© 2022 The Author(s). This work is published and licensed by Dove Medical Press Limited. The
full terms of this license are available at https://www.dovepress.com/terms
and incorporate the Creative Commons Attribution
- Non Commercial (unported, 3.0) License.
By accessing the work you hereby accept the Terms. Non-commercial uses of the work are permitted
without any further permission from Dove Medical Press Limited, provided the work is properly
attributed. For permission for commercial use of this work, please see paragraphs 4.2 and 5 of our Terms.