Back to Journals » Drug, Healthcare and Patient Safety » Volume 12
Drug Use and Type of Adverse Drug Events–Identified by a Trigger Tool in Different Units in a Swedish Pediatric Hospital
Authors Nydert P, Unbeck M ![]() , Pukk Härenstam K
, Pukk Härenstam K ![]() , Norman M
, Norman M ![]() , Lindemalm S
, Lindemalm S
Received 26 September 2019
Accepted for publication 13 December 2019
Published 31 January 2020 Volume 2020:12 Pages 31—40
DOI https://doi.org/10.2147/DHPS.S232604
Checked for plagiarism Yes
Review by Single anonymous peer review
Peer reviewer comments 2
Editor who approved publication: Dr Rajender Aparasu
Per Nydert, 1, 2 Maria Unbeck, 3, 4 Karin Pukk Härenstam, 1, 5 Mikael Norman, 1, 2 Synnöve Lindemalm 1, 2
1Astrid Lindgren’s Children’s Hospital, Karolinska University Hospital, Stockholm, Sweden; 2Department of Clinical Science, Intervention and Technology, Karolinska Institutet, Stockholm, Sweden; 3Trauma and Reparative Medicine Theme, Karolinska University Hospital, Stockholm, Sweden; 4Department of Neurobiology, Care Sciences and Society, Karolinska Institutet, Stockholm, Sweden; 5Medical Management Centre, Department of Learning, Informatics, Management and Ethics, Karolinska Institutet, Stockholm, Sweden
Correspondence: Per Nydert
Astrid Lindgren Children´s Hospital at Karolinska University Hospital, Stockholm SE-171 76, Sweden
Tel +46 8 51770000
Email [email protected]
Purpose: The objectives of our study were to determine drug use, type and incidence of all adverse event associated with drug or drug-related processes (Adverse Drug Events, ADE) among pediatric inpatients in relation to hospital unit and length of stay.
Patients and Methods: 600 pediatric (0– 18 years) admissions at a Swedish university hospital during one year were included and stratified in blocks to 150 neonatal, surgical/orthopedic, medicine and emergency-medicine unit admissions, respectively. Adverse events were identified from medical records using a pediatric trigger tool. All triggers identifying an adverse event related to drugs and drug-related devices were included. Data on drug use were extracted from the hospital drug-data warehouse.
Results: In total, 17794 daily drug orders were administrated to 486 (81.0% exposed) admissions. Parental nutrition, potassium salts and morphine constituted half of all high-risk drugs prescribed. Two-thirds of intravenous irritating drug doses consisted of vancomycin, esomeprazole and meropenem. In 129 (21.5%) admissions, at least one ADE was identified, out of which 21 ADE were classified as more severe (National Coordinating Council Medication Error Reporting Prevention-Index, NCCMERP≥F). The ADE incidence was 47.4 (95% confidence interval: 39.4– 57.3) per 1000 admission days and varied by unit category. In neonatal units, 56.9 (49.5– 65.4) ADEs/1000 admission days were detected, in surgery/orthopedic 54.2 (40.3– 72.8), in medicine 44.1 (33.1– 58.7), and in emergency-medicine 14.3 (7.7– 26.7) ADEs/1000 admission days were found. The most common types of ADEs were identified by triggers that were not directly aiming at drugs including insufficiently treated pain (incidence peaking already in the first days), skin, tissue or vascular harm (peaking at the end of the first week) and hospital-acquired infections (peaking in later admission days).
Conclusion: Adverse drug events are common in pediatric patients. The incidence of ADEs and type of ADE varies by hospital unit and length of hospital stay.
Keywords: patient safety, pediatrics, adverse drug event, pharmaceutical preparation, inpatients
Introduction
Drug treatment is a common intervention in pediatric hospitals. Besides its expected beneficial effects, pediatric drug treatment has increasingly been recognized as associated with adverse drug events (ADEs).1 In order to detect and characterize the epidemiology of ADEs, development and validation of reliable monitoring systems are needed.2
One flexible and well-studied method for detecting ADEs is the Global Trigger Tool. It was developed specifically for acute adult care by the Institute of Healthcare Improvement.3 This tool was later refined for pediatrics by Takata et al,4 using drug focused triggers to identify ADEs. They reported an average risk of 7.3 ADEs per 100 patients. In contrast, Matlow et al5 reported 1.5 ADEs per 100 patients in academic centers using a combination of Global Trigger Tool and the Harvard Medical Practice Study Protocol. There could be several explanations for the variation in reported ADE-rates using trigger tools as suggested by Hibbert et al6 in a systematic review. Differences in inclusion criteria, in methods used and in reviewer interpretations of the triggers are among the most likely ones. In addition, a Dutch pediatric tool extended the drug-focused triggers to include ADEs due to insufficiently treated pain which resulted in a higher risk (8.9 ADEs per 100 patients) than in previous studies.7 Further extension of triggers that can identify additional ADEs would be of interest since events related to omissions or medical devices required to administer drugs are usually not included and therefore still undetected. Finally, a better understanding of the type and timing of specified ADEs is needed, in order to ultimately target patient safety interventions during different phases of the care process.
In Sweden, a national pediatric trigger was developed and validated.8 Using this tool, the objectives of our study were to determine drug use, type and incidence of all adverse event (AE) associated with drug or drug-related processes (ADE) among pediatric inpatients in relation to hospital unit and length of stay.
Patients and Methods
Participants and Setting
All admissions in one year, lasting ≥24 hrs and of patients less than 19 years of age to Karolinska University Hospital in Stockholm were eligible for inclusion. We randomly sampled 600 admissions (4.7% of all admissions) to be included in the study cohort (Table 1). Sampling of admissions was performed in four blocks of 150 admissions each, stratified by the care category: neonatology, pediatric surgery/orthopedics, medicine or emergency-medicine units. The study had a retrospective design and data were collected from electronic medical records (EMR). All data collected were anonymized.
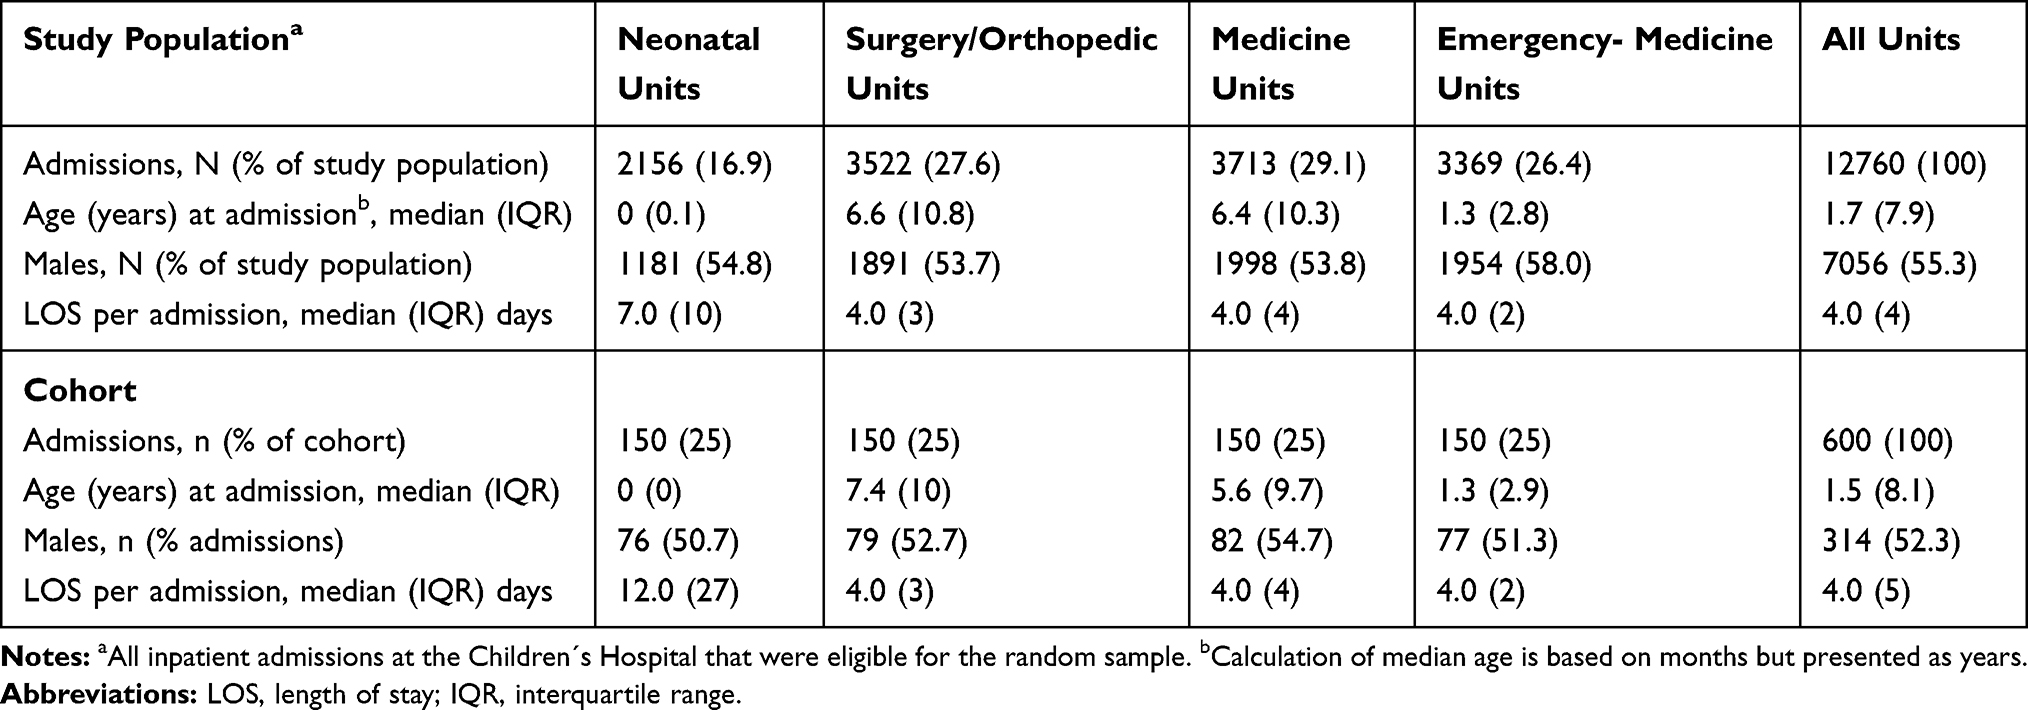 |
Table 1 Admissions in the Study Population and Cohort Stratified by Unit Category |
Classification and Definition of Outcome
Adverse Drug Events
An adverse event was defined as an unintended harm to the patient caused by health care rather than by the patient’s underlying disease. Adverse events (AE) were identified by using a pediatric trigger tool reported in detail elsewhere.8
In short, all EMRs were screened by trained registered nurses for the presence of one or more of 88 triggers indicating a potential AE (Supplementary Table 1). In a second review stage, trained physicians performed an independent review. They sorted the different triggers into potential AEs since several triggers can be involved in one AE. Every potential AE was then reviewed separately. To qualify as an AE, the physician had to assign the event a probability score of ≥4 on a 6-point Likert scale.9,10 AEs related to both commissions and omissions were included. The severity of the AE was categorized using an adaptation of the NCC MERP Index developed by The National Coordinating Council for Medication Error Reporting and Prevention with the inclusion of categories E-I relating to harm (E: Contributed to or resulted in temporary harm that required intervention. F: Contributed to or resulted in temporary harm that required initial or prolonged hospitalization, G: Contributed to or resulted in permanent harm, H: Intervention necessary to sustain life within one hour, I: Contributed to the patient’s death).11 Additional data such as type of AE, potential contributing factors, care processes and demographics were also collected.
In this study, all detected AEs during the index admission were included. An AE was regarded as drug related if the physician in the second review stage classified the AE as drug related. ADEs are usually defined as injuries resulting from medical interventions related to a drug.12 Our broad take on this definition included medications error-related events (preventable) and adverse drug reactions (non-preventable) as well as events with any suspicion of a relation to drug therapy (both preventable and non-preventable). For example, infections, vascular harm or pressure ulcers related to devices used for intravenous drug delivery or to devices used for enteral drug feeding. Data regarding type of medication error were not separately collected. All identified events were categorized by the reviewing physician into one of 14 different categories (Table 2).
 |
Table 2 Type of Adverse Drug Events (ADEs) with Examples |
A record review expert (MU) monitored all reviews for completeness and adherence to the study manual including trigger and AE definitions as well as categorizations. All questions or discrepancies were referred to the respective reviewer for resolution and clarifying discussions were held with the respective reviewer. All the ADE categorization was double checked by a pediatrician/clinical pharmacologist (SL) and the inter-rater reliability was >95%.
Drug Use
From the data warehouse of the EMR, all administered drugs during each of the 600 admissions were extracted. The hospital used two EMRs, one for the intensive and neonatal care units (Centricity, GE Healthcare IT, IL, US) and one for the remaining units (TakeCare, CompuGroup Medical Sweden, Uppsala Sweden).
A continuous infusion was recorded as one administration per day. All infusions that had not been manually registered as completed in the EMR (3% of the continuous infusions were started and not registered as completed during the admission), or could not be verified as administered, or appeared as duplicates were excluded. Recordings on enteral nutrition supplements and blood products occurring in the drug data set were also excluded. Finally, cytotoxic drugs compounded by the pharmacy, drugs administered immediately after birth (in the delivery unit) and drugs used in the operating room – all ordered in separate systems – were excluded in this study.
The remaining drugs were included and classified by: a) route; b) substance; c) high-risk drug – as categorized by the Institute of Safe Medication Practices for acute care units;13 and d) vascular irritating – if described in the section “cautions related to IV administration” in the Teddy Bear Book14 or if missing herein, in the Summary of Products Characteristics.
The classified drugs were grouped by admission, day of exposure, substance and route of administration. The groups were summarized by each Day a Drug order was Administered (DDA).
Time Exposure
The length of hospital stay (LOS) was calculated as [date of discharge –date of admission +1] and discovery time was calculated as [date of ADE –date of admission +1]. The drug exposure time was calculated as [date of drug exposure –date of admission +1]. Time at risk was calculated as days (of LOS) before or without any ADE. For graphical presentation, the X-axis was converted to a natural logarithmic scale.
Statistical Methods
As the dataset represented a randomized selection of 150 admissions from each of the four hospital unit categories, weighted data were presented for the total hospital estimate. The weight coefficient was calculated as percentage of admissions within each unit category divided by the percentage of admissions within each unit category in the total study population.
The sample size was based on an assumption of 10% admissions with AE with a 95% confidence interval (CI) of 7.6–12.4 if including 600 admissions.
The ADE was reported as 1) cumulative incidence (%) of admissions with at least one ADE, and 2) as incidence rates. The incidence rates were calculated as a) admissions with an ADE divided by days at risk (time until first ADE), b) number of ADE divided by LOS, c) number of ADE divided by DDA, d) the accumulated number of ADEs divided by the accumulated number of LOS for each day until final harm.
Risk-Ratio (RR) and Incidence Rate-Ratio (IRR) were calculated with the neonatal unit as reference category. Confidence intervals were calculated using Poisson or Logistic-regression. An inverse Kaplan Meier curve was used to illustrate and estimate the rate until first ADE or discharge (censored) for each admission.
The statistical software used were QlikView 11 (Qlik Technologies, Inc. PA, US) and Stata 12.0 (StataCorp, TX, US).
Ethical Approval
Ethical approval was provided by the Regional Ethical Review Board in Stockholm (numbers 2012/2014-31/5 and 2014/1126-32). Permission for patient data collection through the EMR was granted by the head of the Children´s Hospital and by each department chairman.
Results
The 600 admissions in the study cohort represented a total of 6105 inpatient days. Selected admission characteristics are presented in Table 1.
In total 40 (45.0%) of 88 triggers were used to identify ADEs and 11 (12.5%) of these were drug-focused triggers identifying typical ADEs such as allergic reactions, clostridium difficile colitis and drug-induced rash. However, the most common types of ADEs were found by triggers that were not directly aiming at drug-related outcomes such as subcutaneous infusions, insufficiently treated pain and central venous line infections (Table 2).
Overall, 302/485 AEs (62.0%) were categorized as ADEs and occurred in 129 (21.5%) admissions (20.2%, weighted). Cumulative incidences of ADEs varied by unit category. Neonatal admissions had higher relative risk for ADEs than admissions to emergency (RR 6.6 [95% CI: 3.3–13.4]) and medicine units (RR 1.8 [95% CI: 1.2–2.7]). This was also true comparing neonatal units with emergency-medicine units using inpatient days (IRR 4.0, 95% CI 2.1–8.4) or days at risk (IRR 3.0, 95% CI 1.4–7.4) as denominators. The difference became statistically insignificant when the denominator was changed to drug administrations (IRR 1.9, 95% CI 1.0–4.0). The calculated incidents of ADEs – by hospital unit categories and weighted in total – are presented in Table 3.
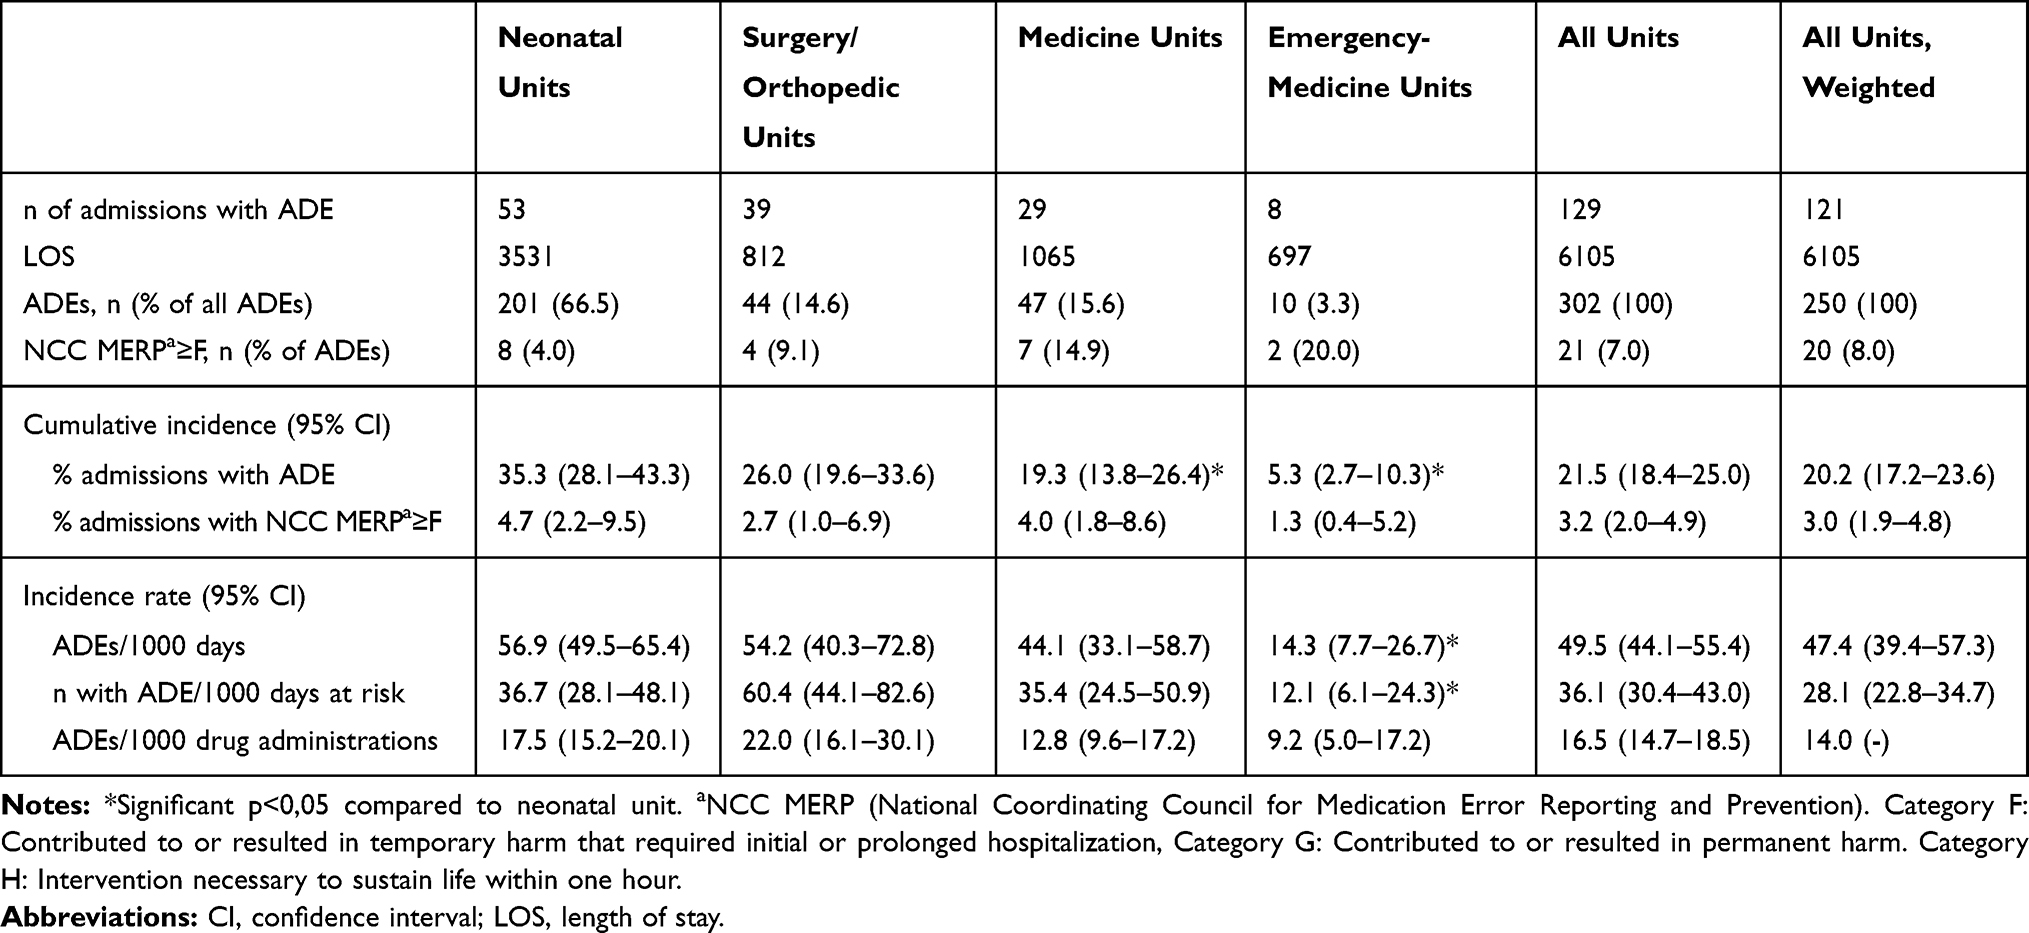 |
Table 3 Total Adverse Drug Events (ADEs) Stratified by Unit Category |
Most ADEs were deemed to be minor, ie, NCC MERP grade E (n=281, 93.0%). Whereas the remaining 21 (7.0%) were classified as more severe, ie, NCC MERP grades F – H (no ADE was classified as NCC MERP I). The severe ADEs were mainly associated with intubation causing an effect on vital parameters.
Figure 1A–D depicts changes in ADE incident rates in the four hospital units by type of ADE and LOS. ADEs related to insufficiently treated pain were most common in surgical/orthopedic units, peaking at 80.0 ADEs per 1000 days of LOS already on the first day of admission. Pain also appeared to be a problem in the neonatal units (Figure 1A). ADEs associated with skin/tissue/vascular harm were most common in the neonatal and medicine units, with a cumulative incident rate of 28.8 ADEs per 1000 days of LOS one week after admission (Figure 1B). ADEs associated with hospital-acquired infections had lower incidence rates compared to pain or skin/tissue/vascular harm and were present in admissions after transfer to the medicine units and occurred in the neonatal units’ weeks after admission (Figure 1C). ADEs other than pain, skin/tissue/vascular harm and hospital-acquired infections consisted of a variety of events, mainly in the neonatal units, such as insufficiently treated hypoglycemia in the days of admission, and harm by devices needed for drug administration such as endotracheal tube-related problems in the last in-hospital days. In the medicine and surgical/orthopedic units, other ADEs consisted mainly of non-preventable adverse reactions to drugs (Figure 1D). A total number of 43 (14.2%) ADEs were identified by drug focused triggers, corresponding to 7.2 ADEs/100 admissions. Triggers and their ability to capture ADEs are presented in Supplementary Table 1.
 |
Figure 1 Number of ADEs per 1000 days as the length of stay (LOS) accumulated over time. Displayed as an incident over the natural logarithm of LOS (ln(LOS)) until final harm. (A) ADEs due to insufficiently treated pain, (B) ADEs due to skin/tissue/vascular harm, (C) ADEs due to hospital-acquired infections (HAI), (D) Other ADEs. Lines represent each unit category starting with 150 admissions/category. |
The first occurrence of any ADE was saturated already in the first days after admission for neonatal, medicine and emergency-medicine units reaching a plateau at day 5. The median 25th percentile for hospital stay without an ADE was 3 (CI 95%: 3–3) days in the neonatal units, 4 (CI 95%: 3–5) days in surgical/orthopedic, 5 (CI 95%: 4–6) days in medicine units and 13 (CI 95%: 9–17) days in emergency-medicine unit. After day 20, only admissions previously exposed to ADEs continued to be exposed (Figure 2).
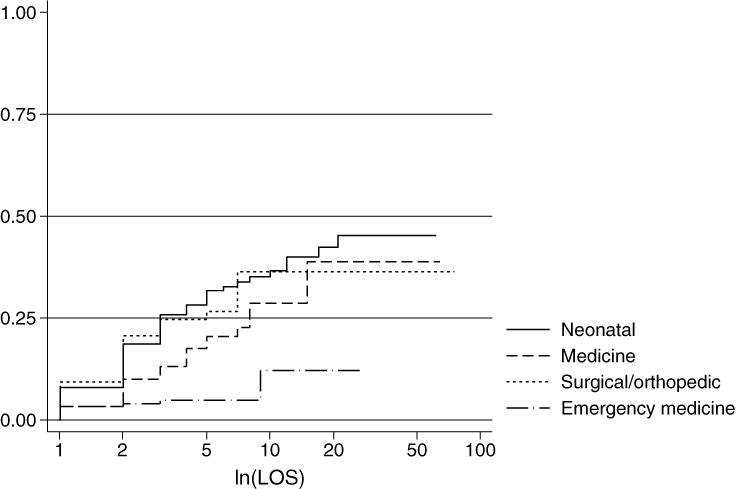 |
Figure 2 Probability to be harmed by first ADE over length of stay (LOS). Inverse Kaplan–Meier illustrating the probability to be harmed over time until censored or first ADE (any ADE) as the natural logarithm of LOS (ln(LOS)). Lines represent each unit category starting with 150 admissions/category. |
In total, the 600 admissions in the study cohort were exposed to 17794 DDA which corresponded to 33990 administrations of 225 different substances (Table 4). The neonatal units had a larger contribution to the drug administrations, attributed to longer LOS per admission, ie, more in-hospital time for total drug exposure with approximately 3 to 10 times higher the number of DDA administered compared to the medicine and emergency-medicine units, respectively (Figure 3). In addition, admissions exposed to 20 or more DDA were overrepresented in the medicine and neonatal units (data not shown). The proportions of admissions exposed to high-risk drugs and intravenous drugs known to be irritating to the veins were evenly distributed between the unit categories, but due to longer hospitalizations, the total exposure to high-risk and vascular irritating drugs were more prominent among neonatal patients (Table 4). Parental nutrition, potassium salts and morphine constituted half of all high-risk drugs prescribed. Two-thirds of the intravenous irritating drugs doses consisted of vancomycin, esomeprazole and meropenem. Among admissions with ≥40 days of hospital stay, a quarter of all the drugs administered after ≥40 days were low-risk drugs (oral vitamins and minerals provided for preterm infants).
 |
Table 4 Drug Treatment in Four Pediatric Unit Categories by Route of Drug Administration and Type of Drug |
 |
Figure 3 Drug use over length of stay (LOS). Summary of each day a drug order was administered (DDA) presented for the entire LOS as, the natural logarithm (ln(LOS)). Lines represent each unit category starting with 150 admissions/category. |
Discussion
This study has four important findings, all with clinical implications. First, ADEs were found to be common among children in hospital, events that in most cases had been undetected and un-recognized as drug-related. Secondly, although more severe ADEs (NCC MERP ≥F) were uncommon in relation to the total number of ADEs, they occurred frequent, more than weekly in a hospital perspective. Third, both the type and incidence of pediatric ADEs varied between hospital units and over the duration of hospital stay. Fourth, when benchmarking pediatric hospitals and health care systems for adverse drug events, denominators, patient´s age and hospital unit, as well as type of ADE must be considered.
The cumulative incidence of ADE in the total hospital population, 2 of 10 admissions, was double of the study assumption of 10% admission with AE. The high cumulative incidences could partly be explained by the power of triggers of finding additional events were the rate has been shown to be dependent on the error detection method in the ascending order of 1) incident reporting, 2) trigger tool and chart review and 3) direct observational methods.15,16 Stockwell et al used a global assessment of pediatric patient safety trigger tool and reported 20% admissions with AE for teaching pediatric hospitals and 30% for critically ill children.17 They also found hospital-acquired infections and intravenous line complications to be the most frequent occurring events but with low occurrence of untreated pain. The similarities, even if we focused on ADEs, could be due to a large neonatal population in our study and our broad inclusion of AE with a potential relation to drugs identified by an expanded set of triggers. Using such a broad definition, a significant number of ADEs were detected including devices and drug-related processes in addition to those directly related to a specific drug. Regarding insufficiently treated pain, the relationship to ADE is missioned in a Dutch pediatric tool study where the addition of pain as a trigger revealed the only significant ADEs.7 In comparison with other studies, the drug-focused triggers did identify 7.2 admissions with ADE per 100 admissions which is close to the Takata study with 7.3 ADE per 100 admissions.4 But even if the numbers are comparable, differences in patient safety studies are vast, eg, due to type of AE identified, interrater reliability and units included.18
Kaushal et al identified a threefold increase in potential risk but no difference in the actual risk, between adult and pediatric care in a prospective observational drug-chart review reporting 2.3 ADE per 100 admissions.19 They used a stricter inclusion by the Naranjo algorithm20 for assuring the likelihood that the event occurred due to a drug. Severity classification could be another reason for the difference in risk detection. Kaushal classified the outcome of an ADE in a way that could be relevant for higher NCC MERP, similar or above category “F”, which are more comparable to the risk identified in our study (weighted 3.0 ADE per 100 admissions).19
Time is another important factor, and patients with complicated conditions usually have longer LOS and are attributed to a higher degree of drug exposure and risk of harm. Comparing the four pediatric unit categories, the emergency-medicine units had significantly lower incidences over time of ADE compared to the units experiencing longer LOS and complex medication treatments. A study in adults has estimated that the exposure to an ADE add 4.6 inpatient days.21
When changing the denominator of the incidence rate based on the exposure of drugs, no significant differences were seen between the units. On the other hand, if investigating the specific ADE, large differences were seen between the units. The admissions to the surgical/orthopedic unit were mainly exposed to insufficiently treated pain and the medicine units together with the neonatal units had prominent skin/tissue/vascular harm with a need to work towards reducing time on vascular irritating intravenous drugs as one of the many ways to battle both the hospital-acquired infections and skin/tissue/vascular harm. A solution could be to acknowledge risks and at the right moment in time introduce bundled interventions.22 Some examples of interventions to reduce the number of those ADEs in our hospital in recent years are scrub the hub and new vascular devices, in addition with a safer handling of intravenous drugs with the help of national pediatric drug instructions and a dose range check.23,24
Limitations and Strengths
Our study has several limitations. Research in health-care and patient safety carries a risk of information bias, attributed to differences in culture of reporting, definition of medication errors, and detection systems. The data in this study were collected retrospectively from records that were written prospectively but not for the intent of patient safety research. Only events documented could therefore be captured by the trigger tool. The study also had a risk for selection bias as the collection of admissions from the neonatal units have a longer LOS. We handled this limitation by reviewing ADEs accumulated over time, meaning that all preceding events were carried forward to be analyzed at the selected point of time. We did not exclude twins or triplets (similar looks and similar names), known to be at higher risk of ADE than singletons.25 In addition, the type of medication error causing the ADE was not analyzed. Finally, in this study, we have done the assumption that ADE were equal or indistinguishable, which may not always be the case.
This study also has strengths. One is the large sample size including over 30,000 administrations of more than 200 substances to 600 pediatric admissions. Second, the trigger tool method supports standardization of data retrieval. Third, data collection and reviews were monitored and corrected for completeness and adherence to the study manual. Fourth, stratification on unit and studying the occurrence of ADE over time provided a better understanding of the underlying processes than just overall incidence rates. Finally, the definition of ADE in this study was broadened to include not only typical drug triggers, but also triggers for other adverse events that turned out to be judged as drug-related. This definition needs to be kept in mind when comparing the incidence rates found herein with those reported elsewhere in other studies of ADE in children.
There is no acceptable lower limit for medication errors and the healthcare organizations should use the information from close patient safety monitoring to improve their own drug use process.26 And, if measuring patient drug safety data for an organization, we find it of importance to investigate the type and time of the event. Generalizing the actual numbers from this study is context-dependent but it could help others to acknowledge the contribution of adverse drug events from different pediatric units depending on ADE type over time. The study outline is one way to deal with the confounding by the LOS and could also be used to direct your patient safety strategies in time.
Conclusion
ADEs identified by drug-focused triggers can be extended to identify a larger amount of drug-related events, such as non-treated pain, skin/tissue/vascular harm and hospital-acquired infections if other triggers are included. The incidence changes over time and are dependent on the type of ADE and unit category. Our results show a need to focus on patient safety strategies to improve prevention, diagnostics and treatment of neonatal hypoglycemia early in life, pain in the surgical units during the first days, skin/tissue/vascular harm in the neonatal and medicine wards around day five and lowering the risk of subsequent hospital-acquired infections in the medicine and neonatal wards.
Abbreviations
ADE, Adverse Drug Event; AE, Adverse Event; ATC, Anatomical Therapeutic Chemical classification system; CI, Confidence Interval; DDA, summary of each Day a Drug order was Administered; Electronic Medical Record (EMR); LOS, Length of Stay; NCC MERP, National Coordinating Council for Medication Error Reporting and Prevention; RR, Risk Ratio; IRR, Incidence Rate Ratio.
Acknowledgments
The authors wish to thank the reviewers: Ingimar Ingolfsson, Marianne Kjellgren, Jimmy Persson, Agneta Sinander, Marie Svanberg, Dirk Wackernagel, and Maria Ödling for important help planning the study and acquiring the data. Finally, statistician Ulf Hammar, Institute of Environmental Medicine, BioStat Core Facility at Karolinska Institutet for help with statistical assistance.
Author Contributions
All authors contributed to data analysis, drafting or revising the article, gave final approval of the version to be published, and agree to be accountable for all aspects of the work.
Funding
Financial support was provided through the Swedish Vinnvård programme (MU and KPH); the Regional Agreement on Medical Training and Clinical Research (ALF), project 20190127, between the Stockholm County Council and Karolinska Institutet (SL, MN and PN); the Childhood foundation of the Swedish Order of Freemasons (MN and PN); the Stockholm County Council and the Swedish Association of Local Authorities and Regions (MU, KPH and SL); and the Drug Therapy Group and the Department of Neonatology at Karolinska University hospital (SL, MN and PN). The funders have neither been involved in any part of the study, nor in writing the manuscript or in the decision to submit the manuscript for publication.
Disclosure
The authors declare that they have no other competing interests in this work.
References
1. Ghaleb MA, Wong ICK. Medication errors in paediatric patients. Arch Dis Child Educ Pract Ed. 2006;91:ep20–ep24. doi:10.1136/adc.2005.073379
2. Vincent C, Burnett S, Carthey J. Safety measurement and monitoring in healthcare: a framework to guide clinical teams and healthcare organisations in maintaining safety. BMJ Qual Saf. 2014;23(8):670–677. doi:10.1136/bmjqs-2013-002757
3. IHI (Institute of Healthcare Improvement). Trigger tool for measuring adverse drug events; 2004. Available from: http://www.ihi.org/resources/Pages/Tools/TriggerToolforMeasuringAdverseDrugEvents.aspx.
4. Takata GS, Mason W, Taketomo C, et al. Development, testing, and findings of a pediatric-focused trigger tool to identify medication-related harm in US children’s hospitals. Pediatrics. 2008;121(4):e927–35. doi:10.1542/peds.2007-1779
5. Matlow AG, Baker GR, Flintoft V, et al. Adverse events among children in Canadian hospitals: the Canadian Paediatric Adverse Events Study. Can Med Assoc J. 2012;184(13):E709–18. doi:10.1503/cmaj.112153
6. Hibbert PD, Molloy CJ, Hooper TD, et al. The application of the Global Trigger Tool: a systematic review. Int J Qual Health Care. 2016. doi:10.1093/intqhc/mzw115
7. Maaskant JM, Smeulers M, Bosman D, et al. The trigger tool as a method to measure harmful medication errors in children. J Patient Saf. 2015. doi:10.1097/PTS.0000000000000177
8. Unbeck M, Lindemalm S, Nydert P, et al. Validation of triggers and development of a pediatric trigger tool to identify adverse events. BMC Health Serv Res. 2014;14:655. doi:10.1186/s12913-014-0655-5
9. Brennan TA, Leape LL, Laird NM, et al. Incidence of adverse events and negligence in hospitalized patients. Results of the Harvard medical practice study I. N Engl J Med. 1991;324(6):370–376. doi:10.1056/NEJM199102073240604
10. Wilson RM, Runciman WB, Gibberd RW, et al. The quality in Australian health care study. Med J Aust. 1995;163(9):458–471. doi:10.5694/j.1326-5377.1995.tb124691.x
11. NCCMERP. National coordinating council for medication error. Reporting and Prevention Index for Categorizing Medication Errors. Available from: http://www.nccmerp.org/types-medication-errors.
12. Bates DW, Boyle DL, Vander Vliet MB, et al. Relationship between medication errors and adverse drug events. J Gen Intern Med. 1995;10(4):199–205. doi:10.1007/bf02600255
13. ISMP (Institute of Safe Medication Practices). High risk drug for acute care settings; 2014. Available from: https://www.ismp.org/recommendations/high-alert-medications-acute-list.
14. Kelley R, Tracy MH, Thompson AJ, et al. Pediatric Injectable Drugs: The Teddy Bear Book (Pediatric Injectable Drugs).
15. Gates PJ, Baysari MT, Gazarian M, et al. Prevalence of medication errors among paediatric inpatients: systematic review and meta-analysis. Drug Saf. 2019. doi:10.1007/s40264-019-00850-1
16. Meyer-Massetti C, Cheng CM, Schwappach DL, et al. Systematic review of medication safety assessment methods. Am J Health Syst Pharm. 2011;68(3):227–240. doi:10.2146/ajhp100019
17. Stockwell DC, Landrigan CP, Toomey SL, et al. Adverse events in hospitalized pediatric patients. Pediatrics. 2018;142(2):e20173360. doi:10.1542/peds.2017-3360
18. Kunac DL, Reith DM, Kennedy J, et al. Inter- and intra-rater reliability for classification of medication related events in paediatric inpatients. Qual Saf Health Care. 2006;15(3):196–201. doi:10.1136/qshc.2005.014407
19. Kaushal R, Bates DW, Landrigan C, et al. Medication errors and adverse drug events in pediatric inpatients. JAMA. 2001;285(16):2114–2120. doi:10.1001/jama.285.16.2114
20. Naranjo CA, Busto U, Sellers EM, et al. A method for estimating the probability of adverse drug reactions. Clin Pharmacol Ther. 1981;30(2):239–245. doi:10.1038/clpt.1981.154
21. Bates DW, Spell N, Cullen DJ, et al. The costs of adverse drug events in hospitalized patients. Adverse drug events prevention study group. JAMA. 1997;277(4):307–311. doi:10.1001/jama.1997.03540280045032
22. Bannan DF, Tully MP. Bundle interventions used to reduce prescribing and administration errors in hospitalized children: a systematic review. J Clin Pharm Ther. 2016;41(3):246–255. doi:10.1111/jcpt.12398
23. Sweet MA, Cumpston A, Briggs F, et al. Impact of alcohol-impregnated port protectors and needleless neutral pressure connectors on central line-associated bloodstream infections and contamination of blood cultures in an inpatient oncology unit. Am J Infect Control. 2012;40(10):931–934. doi:10.1016/j.ajic.2012.01.025
24. ePed. Evidence- and experience based pediatric drug information. Available from: http://www.eped.se.
25. Adelman JS, Applebaum JR, Southern WN, et al. Risk of wrong-patient orders among multiple vs singleton births in the neonatal intensive care units of 2 integrated health care systems. JAMA Pediatr. 2019;173:979. doi:10.1001/jamapediatrics.2019.2733
26. NCCMERP. Statement on medication error rates; 2008. Available from: http://www.nccmerp.org/statement-medication-error-rates.
 © 2020 The Author(s). This work is published and licensed by Dove Medical Press Limited. The
full terms of this license are available at https://www.dovepress.com/terms
and incorporate the Creative Commons Attribution
- Non Commercial (unported, 3.0) License.
By accessing the work you hereby accept the Terms. Non-commercial uses of the work are permitted
without any further permission from Dove Medical Press Limited, provided the work is properly
attributed. For permission for commercial use of this work, please see paragraphs 4.2 and 5 of our Terms.
© 2020 The Author(s). This work is published and licensed by Dove Medical Press Limited. The
full terms of this license are available at https://www.dovepress.com/terms
and incorporate the Creative Commons Attribution
- Non Commercial (unported, 3.0) License.
By accessing the work you hereby accept the Terms. Non-commercial uses of the work are permitted
without any further permission from Dove Medical Press Limited, provided the work is properly
attributed. For permission for commercial use of this work, please see paragraphs 4.2 and 5 of our Terms.