")
Back to Journals » Infection and Drug Resistance » Volume 16
Drug Resistance Profile Among HIV-1 Infections Experiencing ART with Low-Level Viral Load in Guangdong China During 2011–2022: A Retrospective Study
Authors Lan Y, Ling X, Deng X, Lin Y, Li J, Li L, He R, Cai W, Li F, Li L, Hu F
Received 2 May 2023
Accepted for publication 27 July 2023
Published 31 July 2023 Volume 2023:16 Pages 4953—4964
DOI https://doi.org/10.2147/IDR.S419610
Checked for plagiarism Yes
Review by Single anonymous peer review
Peer reviewer comments 2
Editor who approved publication: Prof. Dr. Héctor Mora-Montes
Yun Lan,1,* Xuemei Ling,1,2,* Xizi Deng,1,* Yaqing Lin,1 Junbin Li,1,2 Liya Li,1 Ruiying He,1 Weiping Cai,1 Feng Li,1,* Linghua Li,1 Fengyu Hu1
1Guangzhou Eighth People’s Hospital, Guangzhou Medical University, Guangzhou, 510440, People’s Republic of China; 2Guangdong Center for Diagnosis and Treatment of AIDS, Guangzhou, 510060, People’s Republic of China
*These authors contributed equally to this work
Correspondence: Fengyu Hu; Linghua Li, Guangzhou Eighth People’s Hospital, Guangzhou Medical University, No. 8 Huaying Road, Baiyun District, Guangzhou, 510440, People’s Republic of China, Email [email protected]; [email protected]
Background: Antiretroviral therapy (ART) efficiently reduces the morbidities and mortalities caused by HIV-1 infection and prevents the HIV epidemic. However, virologic failure (VF) occurs in some patients receiving ART experience, especially increases in those patients with intermittent or persistent low-level viremia (LLV). The presence of drug resistance mutations (DRMs) in LLV was a strong predictor of subsequent VF. The data on drug resistance (DR) or DRMs for HIV-1 infections at low-level viral load (LLVL) are limited in China.
Objective: To monitor the prevalence of HIV-1 drug resistance and to evaluate the risk factors associated with drug resistance in LLVL HIV-1 infections during ART in Guangdong, China.
Methods: Plasma samples with LLVL during ART in Guangdong Province between Jan 2011 and Dec 2022 were subjected to a modified reverse-transcription PCR with a pre-step of virus concentration by ultracentrifugation before extraction and the Sanger sequencing. Then, the genotypic resistance test was performed and DR was analyzed by the Stanford HIVDB program. Finally, DR-associated factors were identified by logistic regression analysis.
Results: We found that CRF01_AE (53.57%) and CRF07_BC (25.07%) were the dominant HIV-1 genotypes in LLVL in Guangdong between 2011 and 2022 but that the percentage of CRF01_AE showed a trend of decrease over time. M46 (1.49%), M184 (30.91%), and K103 (21.46%) were the dominant PI-, NRTI-, and NNRTI-associated mutations, respectively. The total DR rate was 47.06%. Specifically, PI (3.71%) showed a significantly lower DR rate than NNRTI (40.74%) and NRTI (34.14%). Duration of ART, initial ART regimen, ethnicity, and WHO clinical stages were associated with DR.
Conclusion: The drug resistance rate among the LLVL during ART in Guangdong, China is high. The risk factors associated with HIV drug resistance should be seriously considered for better control.
Keywords: HIV, low-level viral load, drug resistance mutation, drug resistance
Introduction
HIV infection remains one challenge for public health worldwide.1 Since its first report in 1985 in China, HIV infection keeps increasing. By October 2021, 1.14 million HIV/AIDS patients are reported in China.2 The national-wide antiretroviral therapy (ART) effectively alleviates HIV/AIDS-related morbidity, substantially prolongs the life span of HIV/AIDS patients, and considerably reduces HIV/AIDS-related deaths.3
ART can suppress the viral load (VL) below the detection limit of clinical assays in most treated HIV-infected individuals.3,4 However, some patients undergoing ART experience virologic failure (VF), and intermittent or persistent low-level viremia (LLV).3,5–7 VF varies according to different international guidelines, 1000 copies/mL (World Health Organization, WHO),8 200 copies/mL [Department of Health and Human Services, (DHHS, USA)],9 and 50 copies/mL (European AIDS Clinical Society, EACS).10 According to the WHO guideline adopted by China, VF is defined as the HIV viral load over 1000 copies/mL after six months of ART and the VL between 50 and 999 copies/mL is defined as LLV.8 In addition, the continuously emerging drug-resistant and multidrug-resistant strains contributed to the viral failure and its subsequent increased risk of HIV-related morbidity and mortality.11–14 And the presence of drug resistance mutations (DRMs) in LLV was a strong predictor of subsequent VF.15,16
By the end of October 2022, 84,481 HIV-infected individuals were confirmed in Guangdong, and 74,000 (90%) were receiving ART.17 The prevalence of HIV LLV in China was detected to be 5.3–38.7% in different regions.18 The percentage of LLV among HIV/AIDS patients receiving ART for more than one year was 3.3% in Guangdong.13 Drug resistance (DR) among LLV should require more attention. First, the amplification of HIV gene segments in low-level viral load HIV-1 samples (LLVL) is usually technically challenging.18 In addition, DR detection is still expensive, resulting in an unknown DR status in LLV patients who are not covered by the free DR monitoring program. The data on DR or DRM at LLVL are limited in China.19,20
In this study, we investigated the prevalence of HIV DR among ART-experienced patients with viral loads between 200 and 1000 in Guangdong Province (China), from 2011 to 2022, to provide guidance on the implementation of treatment and medication on LLVL.
Materials and Methods
Study Population and Sampling Strategy
HIV-1 infected individuals were eligible for inclusion in this study if they have received ART for at least 6 months with HIV-1 viral load between 200 to 1000 copies/mL. A total of 3274 samples were collected from patients living in Guangdong China between Nov 1st, 2011 to Dec 31st, 2022. Five milliliters of blood with EDTA were collected during follow-up and the plasma was obtained by centrifuging the sample at 3000 r/m for 5 min. Epidemiological data for the patients (including sex, age, delay of ART initiation, duration of ART, initial treatment regimen, HIV transmission route, degree of education, marital status, ethnicity, WHO clinical stages, geographical region, and occupation) were downloaded from the National Free Antiretroviral Treatment Database for Disease Control and Prevention.
Concentration, Partial Pol Gene Amplification, and Assembly
According to the method described in the previous study,18 we have made some adjustments. Zero point five-milliliter plasma was concentrated by ultracentrifugation at 4°C, 20,000× g for 1 hour. Then, 0.36 mL of the supernatant was removed, and the remaining 0.14 mL was left for nucleic acid extraction. RNA was extracted from the concentrated sample using the QIAamp Viral RNA Mini Kit (Qiagen, German). The partial HIV-1 pol gene (HXB2 nt 2253–3252) was amplified by one-step RT-PCR and nested PCR as previously described.21 The positive PCR products were purified and sequenced in a commercial company (Tianyi Huiyuan, China). The sequences obtained were assembled and cleaned using Sequencher version 5.4 software (Gene Codes Corporation), and those less than 980 bp were excluded from the analysis. Finally, partial pol sequences were obtained from 2074 out of 3274 samples (63.35%) in this analysis.
Genotype Determination
To determine the HIV-1 genotypes, all sequences were adjusted manually and submitted to the online subtyping tool Context-based Modeling for Expeditious Typing (COMET HIV-1, https://comet.lih.lu/index.php) by batch, developed by the Luxembourg Institute of Health22 and the unassigned sequences were verified by the HIV-1 Subtyping Tool REGA Version 3.0 (http://dbpartners.stanford.edu:8080/RegaSubtyping/stanford-hiv/typingtool/), developed by Tulio de Oliveira.23 The maximum likelihood (ML) phylogenetic tree was used for confirmation. Sequences were aligned and merged with HIV-1 subtyping references downloaded from the Los Alamos HIV Sequence Database via Bioedit software. The phylogenetic tree was constructed using the ML method with the general time-reversible (GTR) substitution model with the PhyML 3.024 and the branch support value was estimated using the approximate likelihood ratio test (aLRT). The final trees were visualized using the Figtree 1.4.2. The SH-like support aLTR value of 0.9 was selected as the threshold for identifying different viral lineages in the ML phylogeny.
Drug Resistance Mutation and Drug Resistance
The Stanford HIV dbprogram 9.4 (last updated on 7th Dec. 2022, https://hivdb.stanford.edu/hivdb/by-sequences/) was used to identify DRMs and infer resistance to antiretroviral drugs, including protease inhibitors (PI), nucleoside reverse- transcriptase inhibitors (NRTI) and non-nucleoside reverse-transcriptase inhibitors (NNRTI).25 Sequences were determined to be susceptible (<15, including potential resistance) or resistant (15<=low-level resistance<30, 30<= intermediate-level resistance<60, or high-level resistance≥60) according to their mutation scores.
Nucleotide Sequence Data
The partial pol nucleotide sequences were submitted to GenBank under the accession numbers: OQ886077-OQ888150.
Statistical Analysis
Statistical analyses were performed using the IBM SPSS program version 25.0. Qualitative statistics were described using frequency. Quantitative statistics were described using the median (range). Categorical variables were compared using the chi-square test. Univariate and multivariate logistic regression analyses were performed to identify potential risk factors. A P-value < 0.05 was considered statistically significant. Variables with a P-value < 0.05 in the univariate logistic regression analysis were included in the multivariate logistic regression analysis. Crude odds ratios (cORs) and adjusted odds ratios (aORs) with their 95% confidence intervals (95% CIs) were reported.
Results
Demographic and Clinical Characteristics
A total of 3274 patients were enrolled and 2074 HIV-1 partial pol sequences were obtained and subsequently used to establish the dataset. The participants were between 5 and 89 years old, with a median age of 43 years. 75.22% (1560/2074) of the subjects were male. The median (range) of the HIV-1 viral load (Copies/mL, Log10) was 2.70 (2.30–3.00). The time between HIV-1 confirmation and initial ART ranged 0.00 to 16.81 years, with a median of 0.16. And the years of duration of ART were 0.50 to 16.65, with a median of 3.03. Among the 1412 samples (68.08%, 1412/2074) have baseline CD4+ T cell count data, the median (range) of the baseline CD4+ T cell count was 177 (1–1256) cells/mm3, and 56.44% (797/1412) of the participants exhibited a CD4+ T cell count of <200 cells/mm3. Other patient characteristics are shown in Table 1.
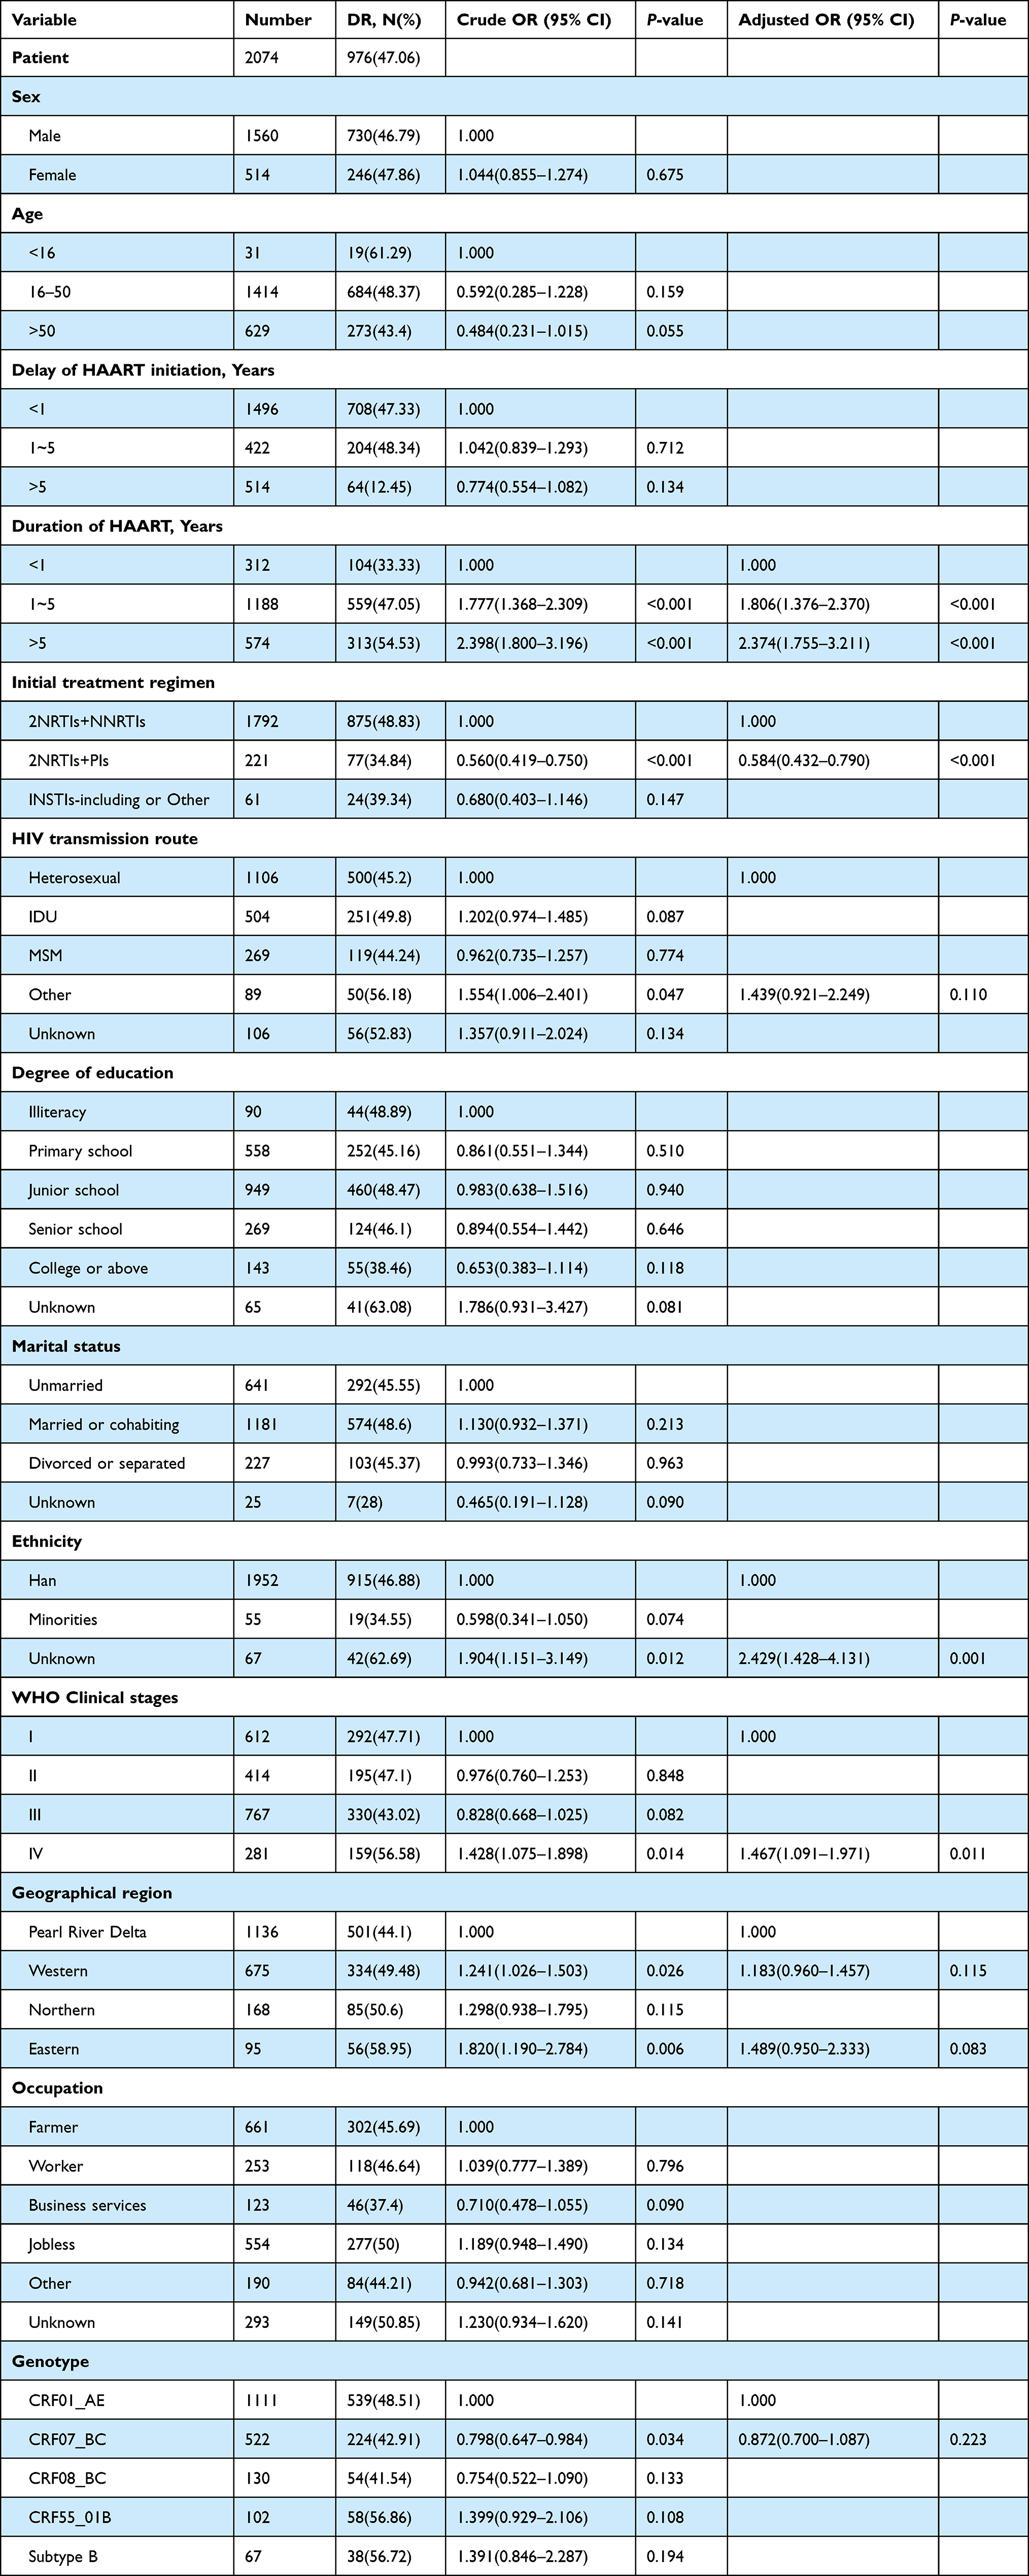 |
Table 1 Factors Associated with Drug Resistance in Low-Level Viral Load HIV-1 Infections in Guangdong Province, China (N = 2074) |
Distribution of HIV-1 Genotypes
The online subtyping tool COMET HIV-1 was used to classify genotypes by batch, and the classification was rechecked using REGA version 3.0 and the ML phylogenetic tree. More than ten different HIV-1 genotypes were observed among the 2074 participants.
The main HIV-1 genotypes circulating were found to be CRF01_AE (53.57%, 1111/2074), CRF07_BC (25.07%, 520/2074), CRF08_BC (6.27%, 130/2074) and CRF55_01B (4.92%, 102/2074), accounting for 89.92% of total infections. HIV-1 CRF59_01B (0.99%, 14/2074), Subtype C (0.78%, 11/2074), CRF02_AG (0.21%, 3/2074), CRF85_BC (0.14%, 2/2074), subtype G (0.07%, 1/2074), CRF67_01B (0.07%, 1/2074) and CRF68_01B (0.07%, 1/2074) were less frequently observed. In addition, 109 possible novel recombinant strains were observed (REGA tool “Recombination”, “Recombinationlike”, “potential-Recombination”, or “check the report”; and COMET tool “unassigned”). Less frequent HIV-1 genotypes and recombinant strains were classified as “other” genotypes (Figure 1A and B).
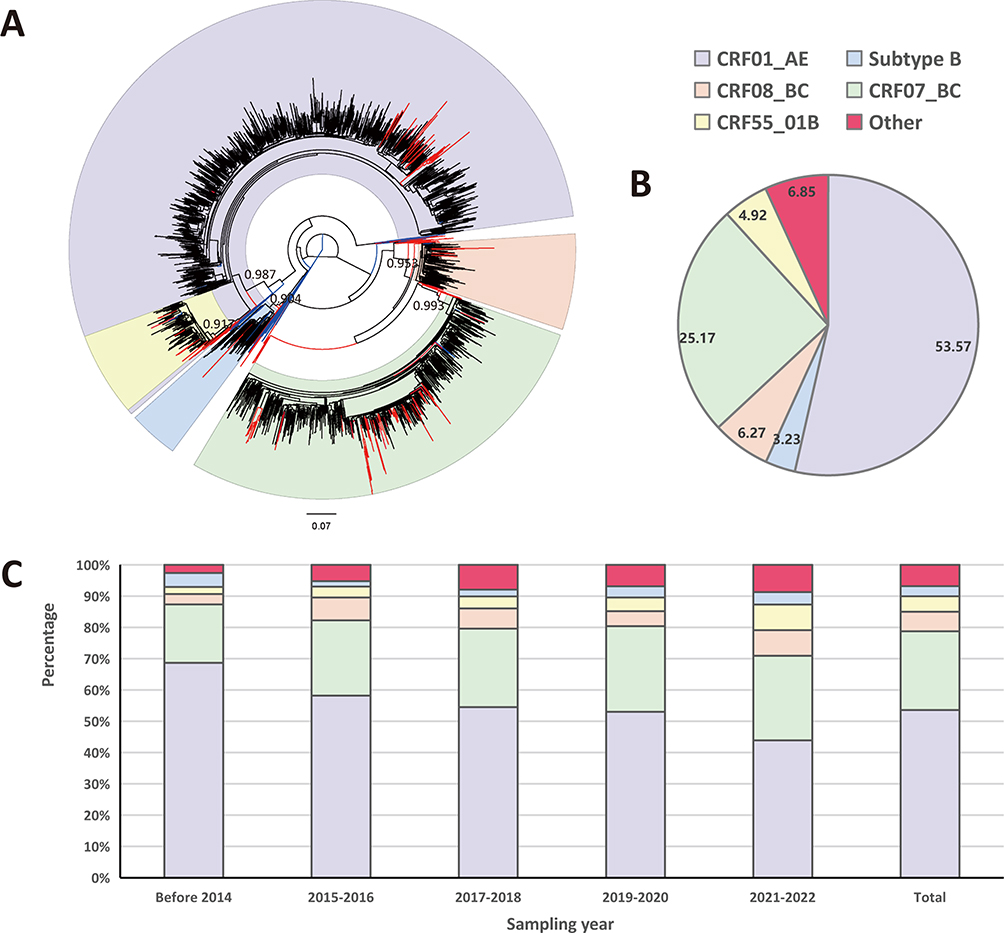 |
Figure 1 Distribution characteristics of HIV-1 genotypes in low-level viral load HIV-1 infections in Guangdong, different colors present different genotypes, as shown in the legend. (A) Maximum-Likelihood phylogenetic tree analysis of the genotypes. Blue branch representing the reference sequences including nine subtypes (A–D, F–H, J and K), CRF01_AE, CRF07_BC, CRF08_BC, CRF55_01B, and CRF59_01B. Black branch representing sequences classified as CRF01_AE, CRF07_BC, CRF08_BC, CRF55_01B, and Subtype B. And red branch represents sequences classified as “other” genotypes. (B) Pie chart representing the distribution of HIV-1 genotypes in low-level viral load HIV-1 infections with available sequences from 2011 to 2022. (C) Proportion of various genotypes of HIV-1 circulating throughout the study period, from 2011 to 2022. |
The distribution of HIV-1 genotypes in different years is generally consistent, with the genotypes changes observed over time: CRF01_AE infections decreased from 68.66% before 2014 to 43.90% in 2021–2022 (χ2=44.838, p<0.001), while those of CRF07_BC, CRF55_01B, and other genotypes continued to increase (18.66% to 27.00%, χ2=6.910, p=0.009; 2.24% to 8.19%, χ2=10.963, p<0.001; 2.61% to 8.71%, χ2=10.767, p=0.001) (Figure 1C).
Characteristics of Drug Resistance Mutations
Among the 2074 participants, 59.21% (1228/2074) exhibited DRMs, with 5.01% (104/2074), 39.68% (823/2074), and 49.13% (1019/2074) exhibiting resistance-associated mutation patterns for PI, NRTI, and NNRTI, respectively (Figure 2A). The DRM rate of PI was lower than that of NRTI and NNRTI (χ2=718.168 or 1022.294 respectively, p <0.001). The DRM rate of NNRTI was higher than that of NRTI, and the difference is statistically significant (χ2=37.515, p<0.001).
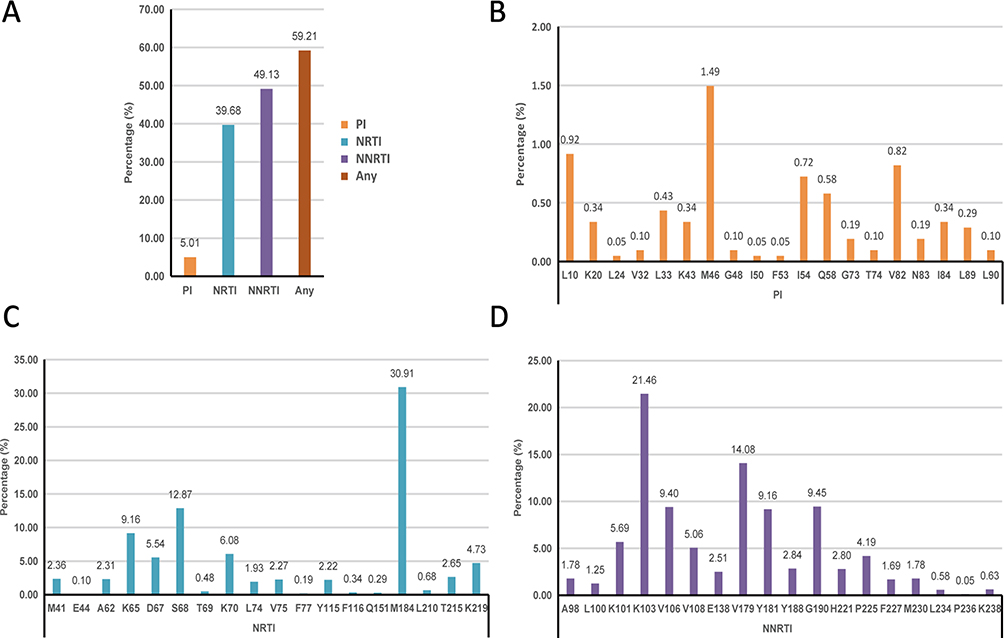 |
Figure 2 Distribution and percentage of DRMs in low-level viral load HIV-1 infections in Guangdong, China. (A) percentage of DRMs for any drug or a kind of drugs (PI, NRTI, and NNRTI); (B) Specific DRMs stratified by PI; (C) Specific DRMs stratified by NRTI; (D) Specific DRMs stratified by NNRTI. Abbreviations: PI, protease inhibitors; NRTI, nucleoside reverse transcriptase inhibitors; NNRTI, non-nucleoside reverse transcriptase inhibitors. |
Nineteen PI-associated mutation patterns, 18 NRTI-associated mutation patterns, and 18 NNRTI-associated mutation patterns were identified. The most prevalent PI-associated mutation was M46I/L (1.49%, 31/2074), followed by V82A/F (0.82%, 17/2074) (Figure 2B). M184I/L/T/V(30.91%, 641/2074) was the most common NRTI-associated mutation, followed by S68G/N/R (12.87%, 267/2074) and K65N/R (9.16%, 190/2074) (Figure 2C). K103A/N/Q/S/T (21.46%, 445/2074) was the dominant NNRTI-associated mutation, followed by V179D/E/F/T (14.26%, 190/2074) and V106 A/I/M (9.53%, 195/2074) (Figure 2D). The frequency and percentage of other DRMs are shown in Figure 2B–D.
Profiles of Drug Resistance
The HIV-1 resistance levels and percentage of 20 ARV drugs were analyzed, as shown in Figure 3. 976 out of 2074 patients (47.06%) were resistant to at least one drug (Figure 3A and Table 2). The total DR rate was 47.06% (976/2074), with PI (3.71%, 77/2074) showing a lower DR rate than NNRTI (40.74%, 845/2074) (χ2=822.557, p<0.001) and NRTI (34.14%, 708/2074) (χ2=625.606, p<0.001) (Figure 3A). HIV patients with a VL of 200–499 copies/mL had a lower DR rate than those with a VL of 500–999 copies/mL (χ2=11.527, p<0.001) (Figure 3A). The prevalence of DR varied throughout the study period, there was no clear trend observed from 47.74% in 2015–2016 to 43.03% in 2021–2022 (χ2=3.774, p=0.287) (Figure 3A).
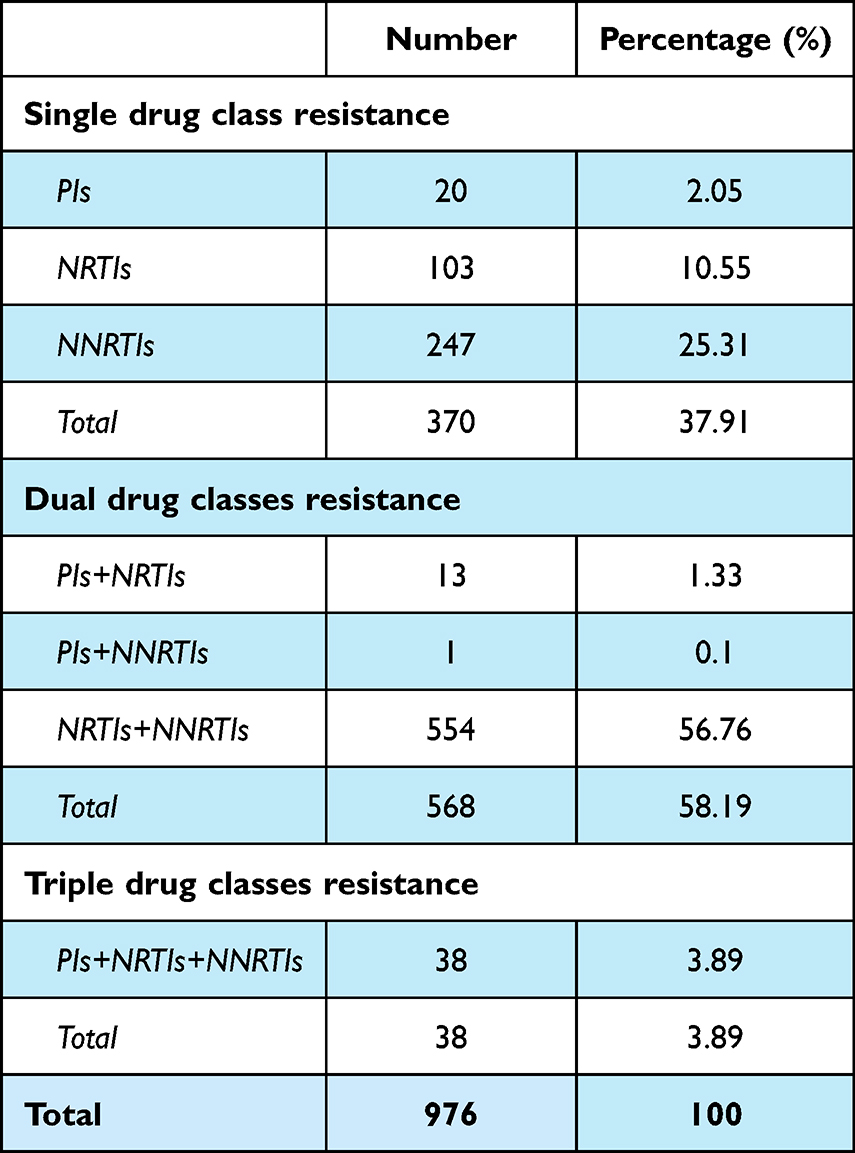 |
Table 2 Frequency of Different Drug Resistance Types in 976 Drug Resistance Low-Level Viral Load HIV-1 Infections in Guangdong Province, China |
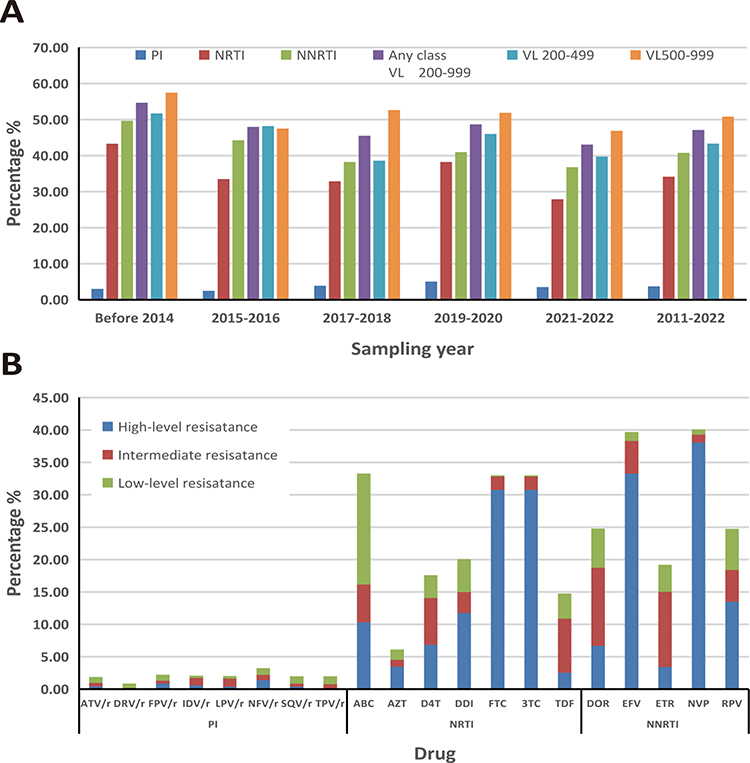 |
Figure 3 Drug resistance in low-level viral load HIV-1 infections in Guangdong, China. (A) Stratified by VL groups and drug classes throughout the study period, from 2011 to 2022. (B) Different drug resistance levels of three classes of antiretroviral drugs predicted by the Stanford HIV Drug Resistance Database. Abbreviations: ATV, atazanavir; DRV, darunavir; FPV, fosamprenavir; IDV, indinavir; LPV/r, ritonavir-boosted lopinavir; NFV, nelfinavir; SQV, saquinavir; TPV, tipranavir; ABC, abacavir; AZT, azidothymidine; D4T, stavudine; DDI, didanosine; FTC, emtricitabine; 3TC, lamivudine; TDF, tenofovir disoproxil fumarate; DOR, doravirine; EFV, efavirenz; ETV, etravirine; NVP, nevirapine; RPV, rilpivirine. |
For NRTI, the resistance to seven NRTI ranged from 6.12% (127/2074) to 33.27% (690/2074). DR to AZT (6.12%) was significantly lower than that to ABC (33.27%) (χ2=457.008, p<0.001), FTC (32.88%) (χ2=447.724, p<0.001), 3TC (32.88%) (χ2=447.724, p<0.001), TDF (14.75%) (χ2=80.438, p<0.001), D4T (17.60%) (χ2=126.652, p<0.001) and DDI (20.06%) (χ2=170.982, p<0.001) (Figure 3B). For NNRTI, the resistance to five NNRTI ranged from 19.19% (398/2074) to 40.07% (831/2074), and the DR prevalence to NVP and EFV was 40.07% (831/2074) and 39.68% (823/2074), respectively. ETR (19.19%) showed the lowest DR frequency, followed by RPV (24.73%), DOR (24.78%), EFV (39.68%), and NVP (40.07%) (χ2=331.422, p<0.001). The frequencies of DR to DOR (24.78%) and RPV (24.73%), or EFV (39.68%) and NVP (40.07%) were similar (χ2=0.001 or 0.056 respectively, p<0.001) (Figure 3B). For PI, the prevalence of DR to eight PI ranged from 0.87% (18/2074) to 3.23% (67/2074) (χ2=331.422, p<0.001), with only the DR to NFV/r (3.23%) being more than 3.00% and that to DRV/r (0.87%) being only below 1.00% (Figure 3B).Among the 976 patients resistant to at least one drug, a total of 606 (62.08%) individuals showed low or above-level drug resistance to more than one class of drugs: 38 (3.89%) individuals expressed triple resistance, 568 (58.19%) individuals expressed dual resistance, whereas 370 (37.91%) ones expressed single resistance to one class drug (Table 2).
Influencing Factors of Drug Resistance
Factors associated with HIV DR (sex, age, delay of ART initiation, duration of ART, initial treatment regimen, HIV transmission route, degree of education, marital status, ethnicity, WHO clinical stages, geographical region, occupation, and genotype) were listed in Table 1. In the univariate logistic regression analysis, nine factors were significantly associated with HIV DR. Variables with a P-value < 0.05 in the univariate logistic regression analysis were included in the multivariate logistic regression analysis. Patients whose duration of ART was 1~5 years or greater than 5 years were more likely to be resistant to drugs than those whose duration of ART was less than 1 year (1~5 years versus <1 year: OR=1.806, 95% CI=1.376–2.370, P<0.001; >5 years versus <1 year: OR=2.374, 95% CI=1.755–3.211, P<0.001). Patients whose initial treatment regimen was 2NRTI+PI were less likely to be resistant to drugs than those whose initial treatment regimen was 2NRTI+NNRTI (2NRTI+PI versus 2NRTI+NNRTI: OR=0.584, 95% CI=0.432–0.790, P<0.001). The sequences derived from patients whose WHO clinical stages were IV were more likely to be resistant to drugs than those derived from patients whose WHO clinical stages were I (stage IV versus stage 1: OR=1.467, 95% CI=1.091–1.971, P=0.011).
Discussion
When HIV/AIDS patients undergo VF, routine DR tests should be carried out, and the therapeutic regimen should be adjusted according to the DR results. However, the number of viruses contained in the LLVL plasma was low, and routine DR test is often unsuccessful. Previous studies illustrated that the appearance of LLV may be related to DR.18,26,27 In this study, we used ultracentrifugation to concentrate HIV RNA from patients whose VL was between 200 and 1000 copies/mL after at least 6 months of ART treatment, and the overall amplification success rate was 63.35%, consistent with the results of previous studies.27,28
The dominant epidemic HIV-1 genotypes detected in LLVL in Guangdong between 2011 and 2022 were CRF01_AE (53.57%) and CRF07_BC (25.07%). This result is consistent with a previous study among the LLVL with VL between 50 and 1000 copies/µL in Beijing 2020–2022 (44.8% CRF01_AE and 25.4% CRF07_BC).19 And we found a significant decrease of CRF01_AE from 68.66% before 2014 to 43.90% in 2021–2022 (p<0.001) and a significant increase of CRF07_BC from 18.66% before 2014 to 27.00% in 2021–2022 (p<0.009). These tendencies were consistent with that of CRF01_AE (from 49.68% in 2006 to 43.2% in 2013 and 35.56% in 2018) and that of CRF07_BC (from 22.26% in 2006 to 26.3% in 2013 and 35.90% in 2018) among treatment-naive patients in Guangdong.29–31
The most common NRTI-associated mutation was M184 in this study, observed in 30.91% (641/2074) participants, and the most common NNRTI-associated mutation was K103, observed in 21.46% (445/2074) participants (Figure 2). A high frequency of K103 plus M184 (11.9%, 248/2074) was observed in this study, and K103 plus M184 appeared sufficient to abrogate the NRTI and NNRTI activity of a regimen comprising FTC, 3TC, EFV, or NVP.32,33 Furthermore, K103 and M184 were the most commonly transmitted DRM.34–36 As a consequence, more attention should be reinforced to the possibility of transmitted DR. The other NNRTI mutations identified in our study were V179, V106, G190, and Y181. All mutations, except V179, reduced sensitivity to NVP and EFV, which were in accordance with the two NNRTI drugs selected in our first-line regimen. V179 was recommended by the Stanford HIV Drug Resistance Database as likely to reduce the virological response to NVP and EFV susceptibility.37 Previous studies confirmed that compared with patients not carried drug-resistant strains, those with drug resistance mutations have a higher risk of developing VF in the future, and early drug-resistance testing and adjusting treatment plans based on drug-resistance results can reduce the risk of developing VF and reduce the accumulation of additional drug resistance mutations.38–40
Here we found that the overall DR rate in LLVL in Guangdong was 47.06%, especially in NRTI and NNRTI with lower resistance barriers such as FTC/3TC/ABC or EFV/NVP, which is lower than our previous results in MSM (64.12%, 252/393)41 or sexual transmission (64.74%, 123/190)42 with HIV-1 VL>1000 after ART (χ2=38.479 or 21.776, p<0.001). The overall DR rate in LLVL in Guangdong is similar to that in LLV in other provinces of China such as Beijing (36.59%, 15/41, or 38.81%, 26/67)19,28 and Jiangsu (40.50%, 98/242),20 but is significantly lower than that in LLV in Rome, Italy (67.96%, 925/1361)7 (χ2=1.771, 1.775, 3.753 or 145.32, p= 0.183, 0.183, 0.053 or <0.001). The difference between ART-experienced patients with VL 200–999 and those with VL >1000 in Guangdong may be due to the ART-experienced patients with lower VL have lower medication compliance, while the difference between ART-experienced patients with VL 200–1000 in China and other countries may due to the different genotype distribution or treatment regimen, the specific reasons still need to be explored in a future study. And we also found the PI DR rate was lower than NNRTI and NRTI and the difference is statistically significant (χ2=822.557 or 625.606, p<0.001). The result of multivariate logistic regression analysis also showed that patients whose initial treatment regimen was 2NRTI+PI were less likely to be resistant to drugs than those whose initial treatment regimen was 2NRTI+NNRTI (Table 1). Furthermore, the DR rate of PI plus NRTI dual drug classes in the 976 drug resistance LLV population in Guangdong Province is relatively low (13/976, 1.33%) (Table 2). All these results suggested that the patients with low-level viral load could be prescribed treatment regimen containing PIs after drug adherence enhancement in Guangdong.
The parameters examined in this study had no significant effect on drug resistance except Duration of HAART, Initial treatment regimen, Ethnicity, and WHO Clinical stages (P<0.001, <0.001, 0.001, and 0.011, respectively). Virus load rebound or virologic failure without resistance is most often the result of inadequate drug concentrations caused by drug-drug interactions or poor adherence.5 In this study, patients with a treatment duration below one year (33.33%) or using 2NRTI+PI initial treatment (34.84%) had a lower drug resistance rate than other groups. The patients with the WHO clinical stage IV had a higher drug resistance rate than other groups in terms of the corresponding factors. More attention should be paid to differentiate between adherence- and resistance-driven LLVL, which are not mutually exclusive. In line with the evidence that different frequencies of DRMs and DR among HIV-1 subtypes circulate among drug-naive and treated individuals in China,43,44 there were different DR rates among different genotypes in this study with the difference no statistically significant (Table 1).
Our study had several limitations. First, of the 3274 LLVL during ART in Guangdong China, only 2074 (63.35%) were included in the final study successfully. The HIV DR rate in this study may not better represent the true drug resistance rate. Second, due to testing techniques and sample size limitations, ART-experienced patients with a VL of 50–200 copies/mL were not included. Next, we will increase the volume of centrifugal concentration to 1mL in an attempt to detect cases with a viral load of 50–200 copies/mL.
Conclusion
In summary, our study provided an overview of the DR profile among ART-experienced LLVL in Guangdong, China, 2011–2022. There was a high percentage of DRM to NRTI and NNRTI, meanwhile, there were multiple DRMs in NRTIs and NNRTIs. The total DR rate of these ART-experienced LLVLs was close to 50%. Long-term and ongoing surveillance of HIV DR among these patients is necessary, which will help us to adjust the treatment regimen as soon as possible and better grasp the prevalence of resistance.
Ethical Approval
This study was conducted in accordance with the Declaration of Helsinki, and approved by the Institutional Review Board of Guangzhou Eighth People’s Hospital. Participants above 18 and a parent or legal guardian of patients younger than 18 years old in the study provided written informed consent.
Funding
Our study was supported by the Guangzhou Science and Technology Plan Project (202201011646, 202201020503) The funders had no role in study design, data collection, analysis, the decision to publish, and preparation of the article.
Disclosure
The authors report no conflicts of interest in this work.
References
1. Daltro ACB, Almeida CS, Unfried AGC, de Aquino TR, Travassos AGÁ. Virological failure and adherence to antiretroviral therapy in adolescents and young adults living with human immunodeficiency virus. Trop Med Int Health. 2023;28(3):162–174. doi:10.1111/tmi.13854
2. 1.14 million people infected with HIV in China. Available from: https://www.shine.cn/news/nation/2112018939/.
3. Crespo-Bermejo C, de Arellano ER, Lara-Aguilar V, et al. Persistent low-Level viremia in persons living with HIV undertreatment: an unresolved status. Virulence. 2021;12(1):2919–2931. doi:10.1080/21505594.2021.2004743
4. Chen J, He Y, Zhong H, et al. Transcriptome analysis of CD4+ T cells from HIV-infected individuals receiving ART with LLV revealed novel transcription factors regulating HIV-1 promoter activity. Virol Sin. 2023;S1995–820X(23):22. doi:10.1016/j.virs.2023.03.001
5. McCluskey SM, Siedner MJ, Marconi VC. Management of virologic failure and HIV drug resistance. Infect Dis Clin North Am. 2019;33(3):707–742. doi:10.1016/j.idc.2019.05.004
6. Nettles RE, Kieffer TL, Kwon P, et al. Intermittent HIV-1 viremia (Blips) and drug resistance in patients receiving HAART. JAMA. 2005;293(7):817–829. doi:10.1001/jama.293.7.817
7. Santoro MM, Fabeni L, Armenia D, et al. Reliability and clinical relevance of the HIV-1 drug resistance test in patients with low viremia levels. Clin Infect Dis. 2014;58(8):1156–1164. doi:10.1093/cid/ciu020
8. World Health Organization. Consolidated Guidelines on HIV Prevention, Testing, Treatment, Service Delivery and Monitoring: Recommendations for a Public Health Approach. Geneva: World Health Organization; 2021.
9. U.S. Department of Health and Human Services. Panel on Antiretroviral Guidelines for Adults and Adolescents. Guidelines for the Use of Antiretroviral Agents inAdults and Adolescents with HIV; 2021. Available from: https://clinicalinfo.hiv.gov/en/guidelines/adult-and-adolescent-arv/whats-new-guidelines.
10. European AIDS clinical society. European guidelines for treatment of HIV infected adults in Europe; 2019. Available from: https://eacsociety.org/files/2019_guide.lines-10.0_final.pdf.
11. Temereanca A, Ruta S. Strategies to overcome HIV drug resistance-current and future perspectives. Front Microbiol. 2023;14:1133407. doi:10.3389/fmicb.2023.1133407
12. Galli L, Parisi MR, Poli A, et al. Burden of disease in PWH harboring a multidrug-resistant virus: data from the PRESTIGIO registry. Open Forum Infect Dis. 2020;7(11):ofaa456. doi:10.1093/ofid/ofaa456
13. Li L, Li H, Lan Y, et al. Impact of low level viremia on the antiviral effect of human immunodeficiency virus/acquired immunodeficiency syndrome patients received anti-retroviral therapy. Chinese J Infect Dis. 2021;39(8):470–474. Chinese. doi:10.3760/cma.j.cn311365-20200703-00693
14. Li Q, Chen M, Zhao H, et al. Persistent low-level viremia is an independent risk factor for virologic failure: a retrospective cohort study in China. Infect Drug Resist. 2021;14:4529–4537. doi:10.2147/IDR.S332924
15. Swenson LC, Min JE, Woods CK, et al. HIV drug resistance detected during low-level viraemia is associated with subsequent virologic failure. AIDS. 2014;28(8):1125–1134. doi:10.1097/QAD.0000000000000203
16. Bareng OT, Choga WT, Maphorisa ST, et al. HIV-1C in-House RNA-based genotyping assay for detection of drug resistance mutations in samples with low-level viral loads. Infect Drug Resist. 2022;15:7565–7576. doi:10.2147/IDR.S388816
17. People’s government of Guangdong Province: the overall AIDS epidemic in Guangdong Province is at a low epidemic level. Available from:http://www.gd.gov.cn/zwgk/zdlyxxgkzl/ylws/content/post_4056940.html.
18. Li Q, Yu F, Song C, et al. A concentration method for HIV drug resistance testing in low-level viremia samples. Biomed Res Int. 2022;2022:2100254. doi:10.1155/2022/2100254
19. Li Q, Yu F, Song C, et al. HIV-1 genotypic resistance testing using sanger and next-generation sequencing in adults with low-level viremia in China. Infect Drug Resist. 2022;15:6711–6722. doi:10.2147/IDR.S387215
20. Yuan D, Zhou Y, Shi L, et al. HIV-1 drug resistance profiles of low-level viremia patients and factors associated with the treatment effect of ART-treated patients: a cross-sectional study in Jiangsu, China. Front Public Health. 2022;10:944990. doi:10.3389/fpubh.2022.944990
21. Lan Y, He X, Li L, et al. Complicated genotypes circulating among treatment naïve HIV-1 patients in Guangzhou, China. Infect Genet Evol. 2021;87:104673. doi:10.1016/j.meegid.2020.104673
22. Struck D, Lawyer G, Ternes AM, Schmit JC, Bercoff DP. COMET: adaptive context-based modeling for ultrafast HIV-1 subtype identification. Nucleic Acids Res. 2014;42(18):e144. doi:10.1093/nar/gku739
23. Pineda-Peña AC, Faria NR, Imbrechts S, et al. Automated subtyping of HIV-1 genetic sequences for clinical and surveillance purposes: performance evaluation of the new REGA version 3 and seven other tools. Infect Genet Evol. 2013;19:337–348. doi:10.1016/j.meegid.2013.04.032
24. Guindon S, Dufayard JF, Lefort V, Anisimova M, Hordijk W, Gascuel O. New algorithms and methods to estimate maximum-likelihood phylogenies: assessing the performance of PhyML 3.0. Syst Biol. 2010;59(3):307–321. doi:10.1093/sysbio/syq010
25. Liu TF, Shafer RW. Web resources for HIV type 1 genotypic-resistance test interpretation. Clin Infect Dis. 2006;42(11):1608–1618. doi:10.1086/503914
26. Assoumou L, Charpentier C, Recordon-Pinson P, et al. Prevalence of HIV-1 drug resistance in treated patients with viral load >50 copies/mL: a 2014 French nationwide study. J Antimicrob Chemother. 2017;72(6):1769–1773. doi:10.1093/jac/dkx042
27. Bangalee A, Hans L, Steegen K. Feasibility and clinical relevance of HIV-1 drug resistance testing in patients with low-level viraemia in South Africa. J Antimicrob Chemother. 2021;76(10):2659–2665. doi:10.1093/jac/dkab220
28. Lyu S, Bai R, Dai M, et al. Features analysis of HIV-1 genotype resistance in patients with low-level viremia after antiretroviral therapy. Chin J AIDS. 2022;28(10):1187–1190. Chinese. doi:10.13419/j.cnki.aids.2022.10.16
29. He X, Xing H, Ruan Y, et al. A comprehensive mapping of HIV-1 genotypes in various risk groups and regions across China based on a nationwide molecular epidemiologic survey. PLoS One. 2012;7(10):e47289. doi:10.1371/journal.pone.0047289
30. Zhou PP, Yu G, Kuang YQ, et al. Rapid and complicated HIV genotype expansion among high-risk groups in Guangdong Province, China. BMC Infect Dis. 2019;19(1):185. doi:10.1186/s12879-019-3788-7
31. Lan Y, Li L, He X, et al. Transmitted drug resistance and transmission clusters among HIV-1 treatment-naïve patients in Guangdong, China: a cross-sectional study. Virol J. 2021;18(1):181. doi:10.1186/s12985-021-01653-6
32. Tisdale M, Kemp SD, Parry NR, Larder BA. Rapid in vitro selection of human immunodeficiency virus type 1 resistant to 3’-thiacytidine inhibitors due to a mutation in the YMDD region of reverse transcriptase. Proc Natl Acad Sci USA. 1993;90(12):5653–5656. doi:10.1073/pnas.90.12.5653
33. Melikian GL, Rhee SY, Varghese V, et al. Non-nucleoside reverse transcriptase inhibitor (NNRTI) cross-resistance: implications for preclinical evaluation of novel NNRTIs and clinical genotypic resistance testing. J Antimicrob Chemother. 2014;69(1):12–20. doi:10.1093/jac/dkt316
34. Rhee SY, Kassaye SG, Barrow G, Sundaramurthi JC, Jordan MR, Shafer RW. HIV-1 transmitted drug resistance surveillance: shifting trends in study design and prevalence estimates. J Int AIDS Soc. 2020;23(9):e25611. doi:10.1002/jia2.25611
35. Panichsillapakit T, Smith DM, Wertheim JO, Richman DD, Little SJ, Mehta SR. Prevalence of transmitted HIV drug resistance among recently infected persons in San Diego, CA 1996–2013. J Acquir Immune Defic Syndr. 2016;71(2):228–236. doi:10.1097/QAI.0000000000000831
36. Rossetti B, Di Giambenedetto S, Torti C, et al. Evolution of transmitted HIV-1 drug resistance and viral subtypes circulation in Italy from 2006 to 2016. HIV Med. 2018;19(9):619–628. doi:10.1111/hiv.12640
37. Liu Y, Zhang Y, Li H, et al. Natural presence of the V179D and K103R/V179D mutations associated with resistance to nonnucleoside reverse transcriptase inhibitors in HIV-1 CRF65_cpx strains. BMC Infect Dis. 2020;20(1):313. doi:10.1186/s12879-020-05007-5
38. Gonzalez-Serna A, Min JE, Woods C, et al. Performance of HIV-1 drug resistance testing at low-level viremia and its ability to predict future virologic outcomes and viral evolution in treatment-naive individuals. Clin Infect Dis. 2014;58(8):1165–1173. doi:10.1093/cid/ciu019
39. Gonzalez-Serna A, Swenson LC, Watson B, et al. A single untimed plasma drug concentration measurement during low-level HIV viremia predicts virologic failure. Clin Microbiol Infect. 2016;22(12):
40. Inzaule SC, Bertagnolio S, Kityo CM, et al. The relative contributions of HIV drug resistance, nonadherence and low-level viremia to viremic episodes on antiretroviral therapy in sub-Saharan Africa. AIDS. 2020;34(10):1559–1566. doi:10.1097/QAD.0000000000002588
41. Lan Y, Deng X, Li L, et al. HIV-1 drug resistance and genetic transmission networks among MSM failing antiretroviral therapy in South China 2014–2019. Infect Drug Resist. 2021;14:2977–2989. doi:10.2147/IDR.S317187
42. Cai X, Lan Y, Li J, et al. Analysis on drug resistance in HIV/AIDS patients with HAART through different infection routes in Guangdong. Chin J AIDS. 2015;21(5):369–372. Chinese. doi:10.13419/j.cnki.aids.2015.05.06
43. Yang Z, Wei S, Liu J, et al. Characterization of HIV-1 subtypes and drug resistance mutations in Henan Province, China (2017–2019). Arch Virol. 2020;165(6):1453–1461. doi:10.1007/s00705-020-04606-6
44. Chen J, Liu Y, Liu S, et al. HIV-1 drug resistance, distribution of subtypes, and drug resistance-associated mutations in virologic failure individuals in Chengdu, Southwest China, 2014–2016. Biomed Res Int. 2020;2020:5894124. doi:10.1155/2020/5894124
 © 2023 The Author(s). This work is published and licensed by Dove Medical Press Limited. The full terms of this license are available at https://www.dovepress.com/terms.php and incorporate the Creative Commons Attribution - Non Commercial (unported, v3.0) License.
By accessing the work you hereby accept the Terms. Non-commercial uses of the work are permitted without any further permission from Dove Medical Press Limited, provided the work is properly attributed. For permission for commercial use of this work, please see paragraphs 4.2 and 5 of our Terms.
© 2023 The Author(s). This work is published and licensed by Dove Medical Press Limited. The full terms of this license are available at https://www.dovepress.com/terms.php and incorporate the Creative Commons Attribution - Non Commercial (unported, v3.0) License.
By accessing the work you hereby accept the Terms. Non-commercial uses of the work are permitted without any further permission from Dove Medical Press Limited, provided the work is properly attributed. For permission for commercial use of this work, please see paragraphs 4.2 and 5 of our Terms.