")
Back to Journals » Drug Design, Development and Therapy » Volume 15
Drug Repurposing: Deferasirox Inhibits the Anti-Apoptotic Activity of Mcl-1
Authors Bourafai-Aziez A , Benabderrahmane M, Paysant H , Weiswald LB, Poulain L, Carlier L, Ravault D, Jouanne M, Coadou G , Oulyadi H, Voisin-Chiret AS, Sopková-de Oliveira Santos J, Sebban M
Received 12 July 2021
Accepted for publication 27 October 2021
Published 15 December 2021 Volume 2021:15 Pages 5035—5059
DOI https://doi.org/10.2147/DDDT.S323077
Checked for plagiarism Yes
Review by Single anonymous peer review
Peer reviewer comments 2
Editor who approved publication: Professor Anastasios Lymperopoulos
Supplementary video 1 of "Deferasirox inhibits the anti-apoptotic activity of Mcl-1" [ID 323077].
Views: 265
Asma Bourafai-Aziez,1 Mohammed Benabderrahmane,2 Hippolyte Paysant,3,4 Louis-Bastien Weiswald,3,4 Laurent Poulain,3,4 Ludovic Carlier,5 Delphine Ravault,5 Marie Jouanne,2 Gaël Coadou,1 Hassan Oulyadi,1 Anne-Sophie Voisin-Chiret,2 Jana Sopková-de Oliveira Santos,2 Muriel Sebban1
1Normandie Université, UNIROUEN, INSA de Rouen, CNRS Laboratoire COBRA (UMR 6014 & FR 3038), Rouen, 76000, France; 2Normandie Univ, UNICAEN, CERMN, Caen, 14000, France; 3Normandie Université, UNICAEN, Inserm U1086 ANTICIPE «Interdisciplinary Research Unit for Cancer Prevention and Treatment», Biology and Innovative Therapeutics for Ovarian Cancers Group (BioTICLA), Centre de Lutte Contre le Cancer F. Baclesse, Caen, 14076, France; 4UNICANCER, Centre de Lutte Contre le Cancer F. Baclesse, Caen, 14076, France; 5Sorbonne Université, École Normale Supérieure, PSL University, CNRS, Laboratoire des Biomolécules, LBM, Paris, France
Correspondence: Muriel Sebban
Normandie Université, UNIROUEN, INSA de Rouen, CNRS Laboratoire COBRA (UMR 6014 & FR 3038), Rouen, 76000, France
, Tel +33 2 35 52 29 44
Fax +33 2 35 52 24 41
Email [email protected]
Jana Sopková-de Oliveira Santos
Normandie Univ, UNICAEN, CERMN, Caen, 14000, France
Tel +33 2 31 56 68 21
Fax +33 2 31 56 68 03
Email [email protected]
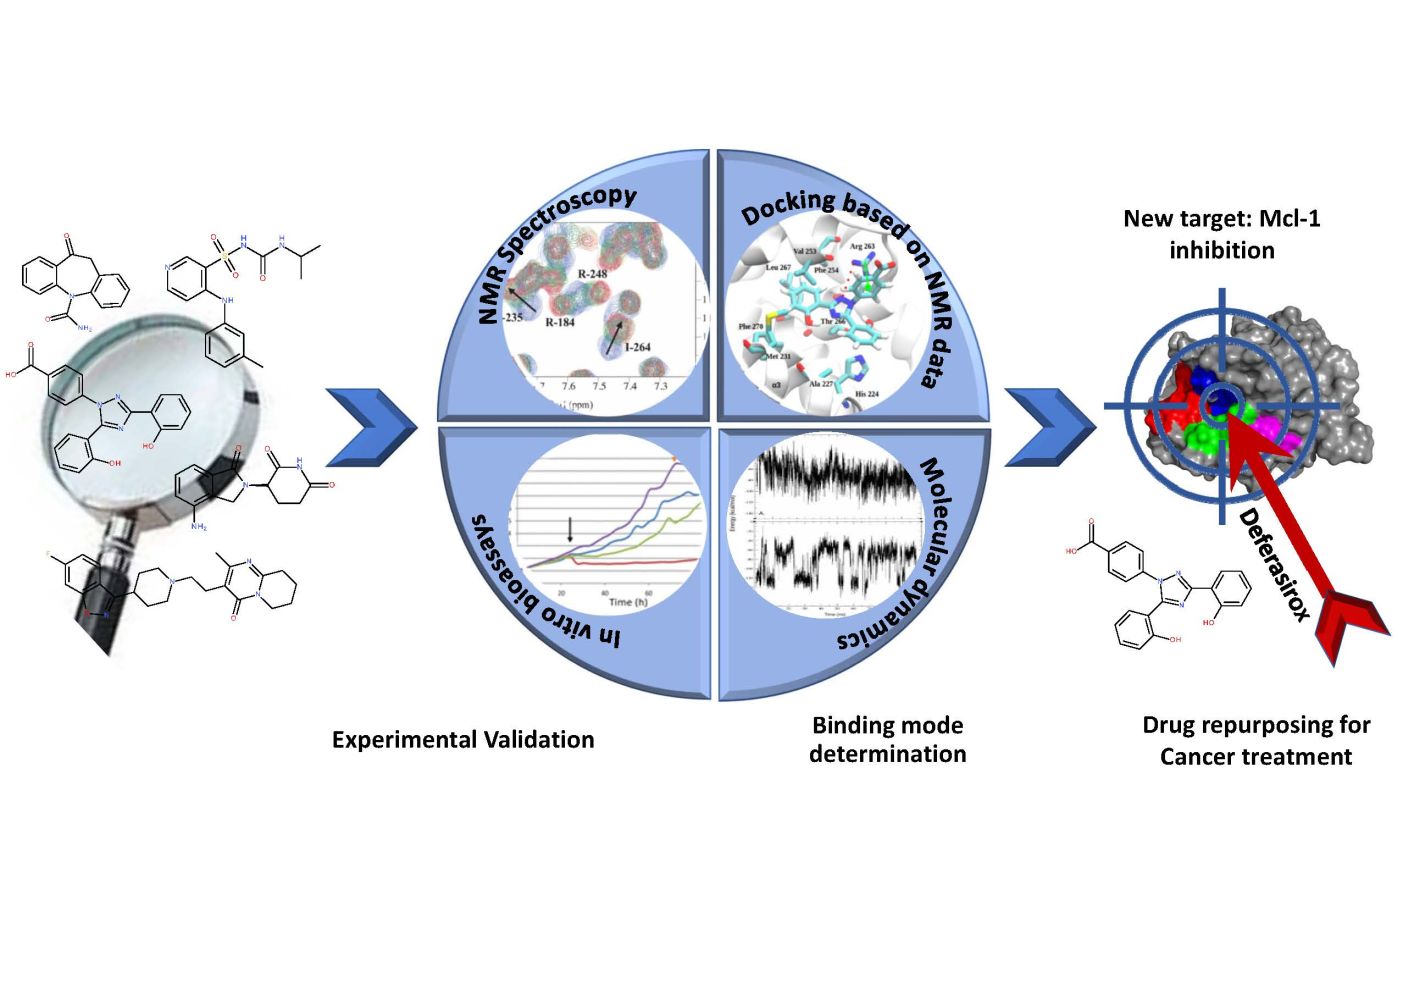
Introduction: With the aim of repositioning commercially available drugs for the inhibition of the anti-apoptotic myeloid cell leukemia protein, Mcl-1, implied in various cancers, five molecules, highlighted from a published theoretical screening, were selected to experimentally validate their affinity toward Mcl-1.
Results: A detailed NMR study revealed that only two of the five tested drugs, Torsemide and Deferasirox, interacted with Mcl-1. NMR data analysis allowed the complete characterization of the binding mode of both drugs to Mcl-1, including the estimation of their affinity for Mcl-1. Biological assays evidenced that the biological activity of Torsemide was lower as compared to the Deferasirox, which was able to efficiently and selectively inhibit the anti-apoptotic activity of Mcl-1. Finally, docking and molecular dynamics led to a 3D model for the Deferasirox:Mcl-1 complex and revealed the positioning of the drug in the Mcl-1 P2/P3 pockets as well as almost all synthetic Mcl-1 inhibitors. Interestingly, contrary to known synthetic Mcl-1 inhibitors which interact through Arg263, Deferasirox, establishes a salt bridge with Lys234.
Conclusion: Deferasirox could be a potential candidate for drug repositioning as Mcl-1 inhibitor.
Keywords: drug repurposing, Mcl-1, Deferasirox, NMR, docking, dynamics
Graphical Abstract:
Introduction
Drug approval by the Food and Drug Administration (FDA) requires around 10 months, and the total drug development cost is estimated to be between $868 million and $1.241 billion USD.1 Advancing strategies to reduce drug development time, lower costs and improve success rates are essential. Drug repurposing is one such strategy. Also known as drug re-tasking or drug reprofiling, this approach describes the process that seeks to discover new indications for an existing drug that are not previously referenced and not currently investigated or prescribed.2–5
The fact that drug repurposing is based on drugs with previous clinical approval has major benefits: data related to toxicology, preclinical safety, pharmacokinetics, and tolerance in healthy volunteers are already available for such compounds. A number of successes have been achieved in therapeutic areas such as sildenafil, an antihypertensive drug, for erectile dysfunction.3
Drug repurposing can be conveniently achieved using two strategies named activity-based drug repositioning and computational drug repositioning. The activity-based drug repositioning refers to the application of actual drugs for screening. In contrast, computational approaches are largely data-driven; they involve systematic analysis of public databases of any type (gene expression, chemical structure …) and use of bioinformatics tools, to systematically identify interaction networks between drugs and protein targets, which can then lead to the formulation of repurposing hypotheses.5–8
In oncology, drug repurposing has drawn also particular attention and it has become now a powerful alternative for discovering and developing novel anticancer drug candidates.7,9 The discovery of new anticancer drugs allows a rapid increasing of the drugs’ number that can take part in combinatorial therapies.
In 2017, Glantz-Gashai et al published an in-silico drug repurposing study related to the oncology field.10 They have computationally screened a data set of all US Food and Drug Administration (FDA) approved drugs and a data set containing 2.3 million lead-like molecules randomly selected for the ZINC database against the anti-apoptotic Myeloid Cell Leukemia-1 protein (Mcl-1). Mcl-1 is a pro-survival member of the Bcl-2 protein family regulating the cell death.11,12 Mcl-1 is overexpressed in many human cancers.13 Restoring apoptosis and thus promoting tumor cell death is of significant therapeutic interest. Therefore, several small-molecules inhibiting Mcl-1 were developed during the last decade and are in clinical tests.14–23
Based on docking technique carried out on conformation ensembles, generated either by normal mode analysis (6 conformations), or by molecular dynamics (4 conformations) or from nuclear magnetic resonance data (20 conformations), Glantz-Gashai et al identified potential Mcl-1 ligands.10 From each screening, the top 10 ligands exhibiting the most favorable average binding energies were selected, resulting in 30 ligands in total. The 30 FDA-approved drugs predicted as potentially interacting with Mcl-1 were compared with their clinical use and half of them are already clinically used for cancer treatment by acting on other targets, thus promoting the idea that the other half of potential drugs could also be acting as anticancer agents.10 This in-silico study highlighted a set of FDA-approved drugs as potential Mcl-1 inhibitors and exposed them to the scientific community for further investigation (in vitro and in vivo activity evaluations).
In this context, we have focused on the validation of this theoretical study through experimental evidence. For this purpose, we selected five drugs from the 30 identified as potential inhibitors of Mcl-1 protein, to prove and characterize their interaction with Mcl-1 protein, and to verify the possibility of repositioning them in cancer treatment. The choice of the five molecules (Oxcarbazepine, Deferasirox, Risperidone, Lenalidomide and Torsemide) (Table 1) was based mainly on (i) their predicted binding Gibbs energy,10 and (ii) their solubility in aqueous media according to the Drug Bank database.24 Interestingly, Deferasirox was selected in two screenings on FDA-approved drugs: the one carried out on normal mode ensemble as well as the one on molecular dynamics ensemble.
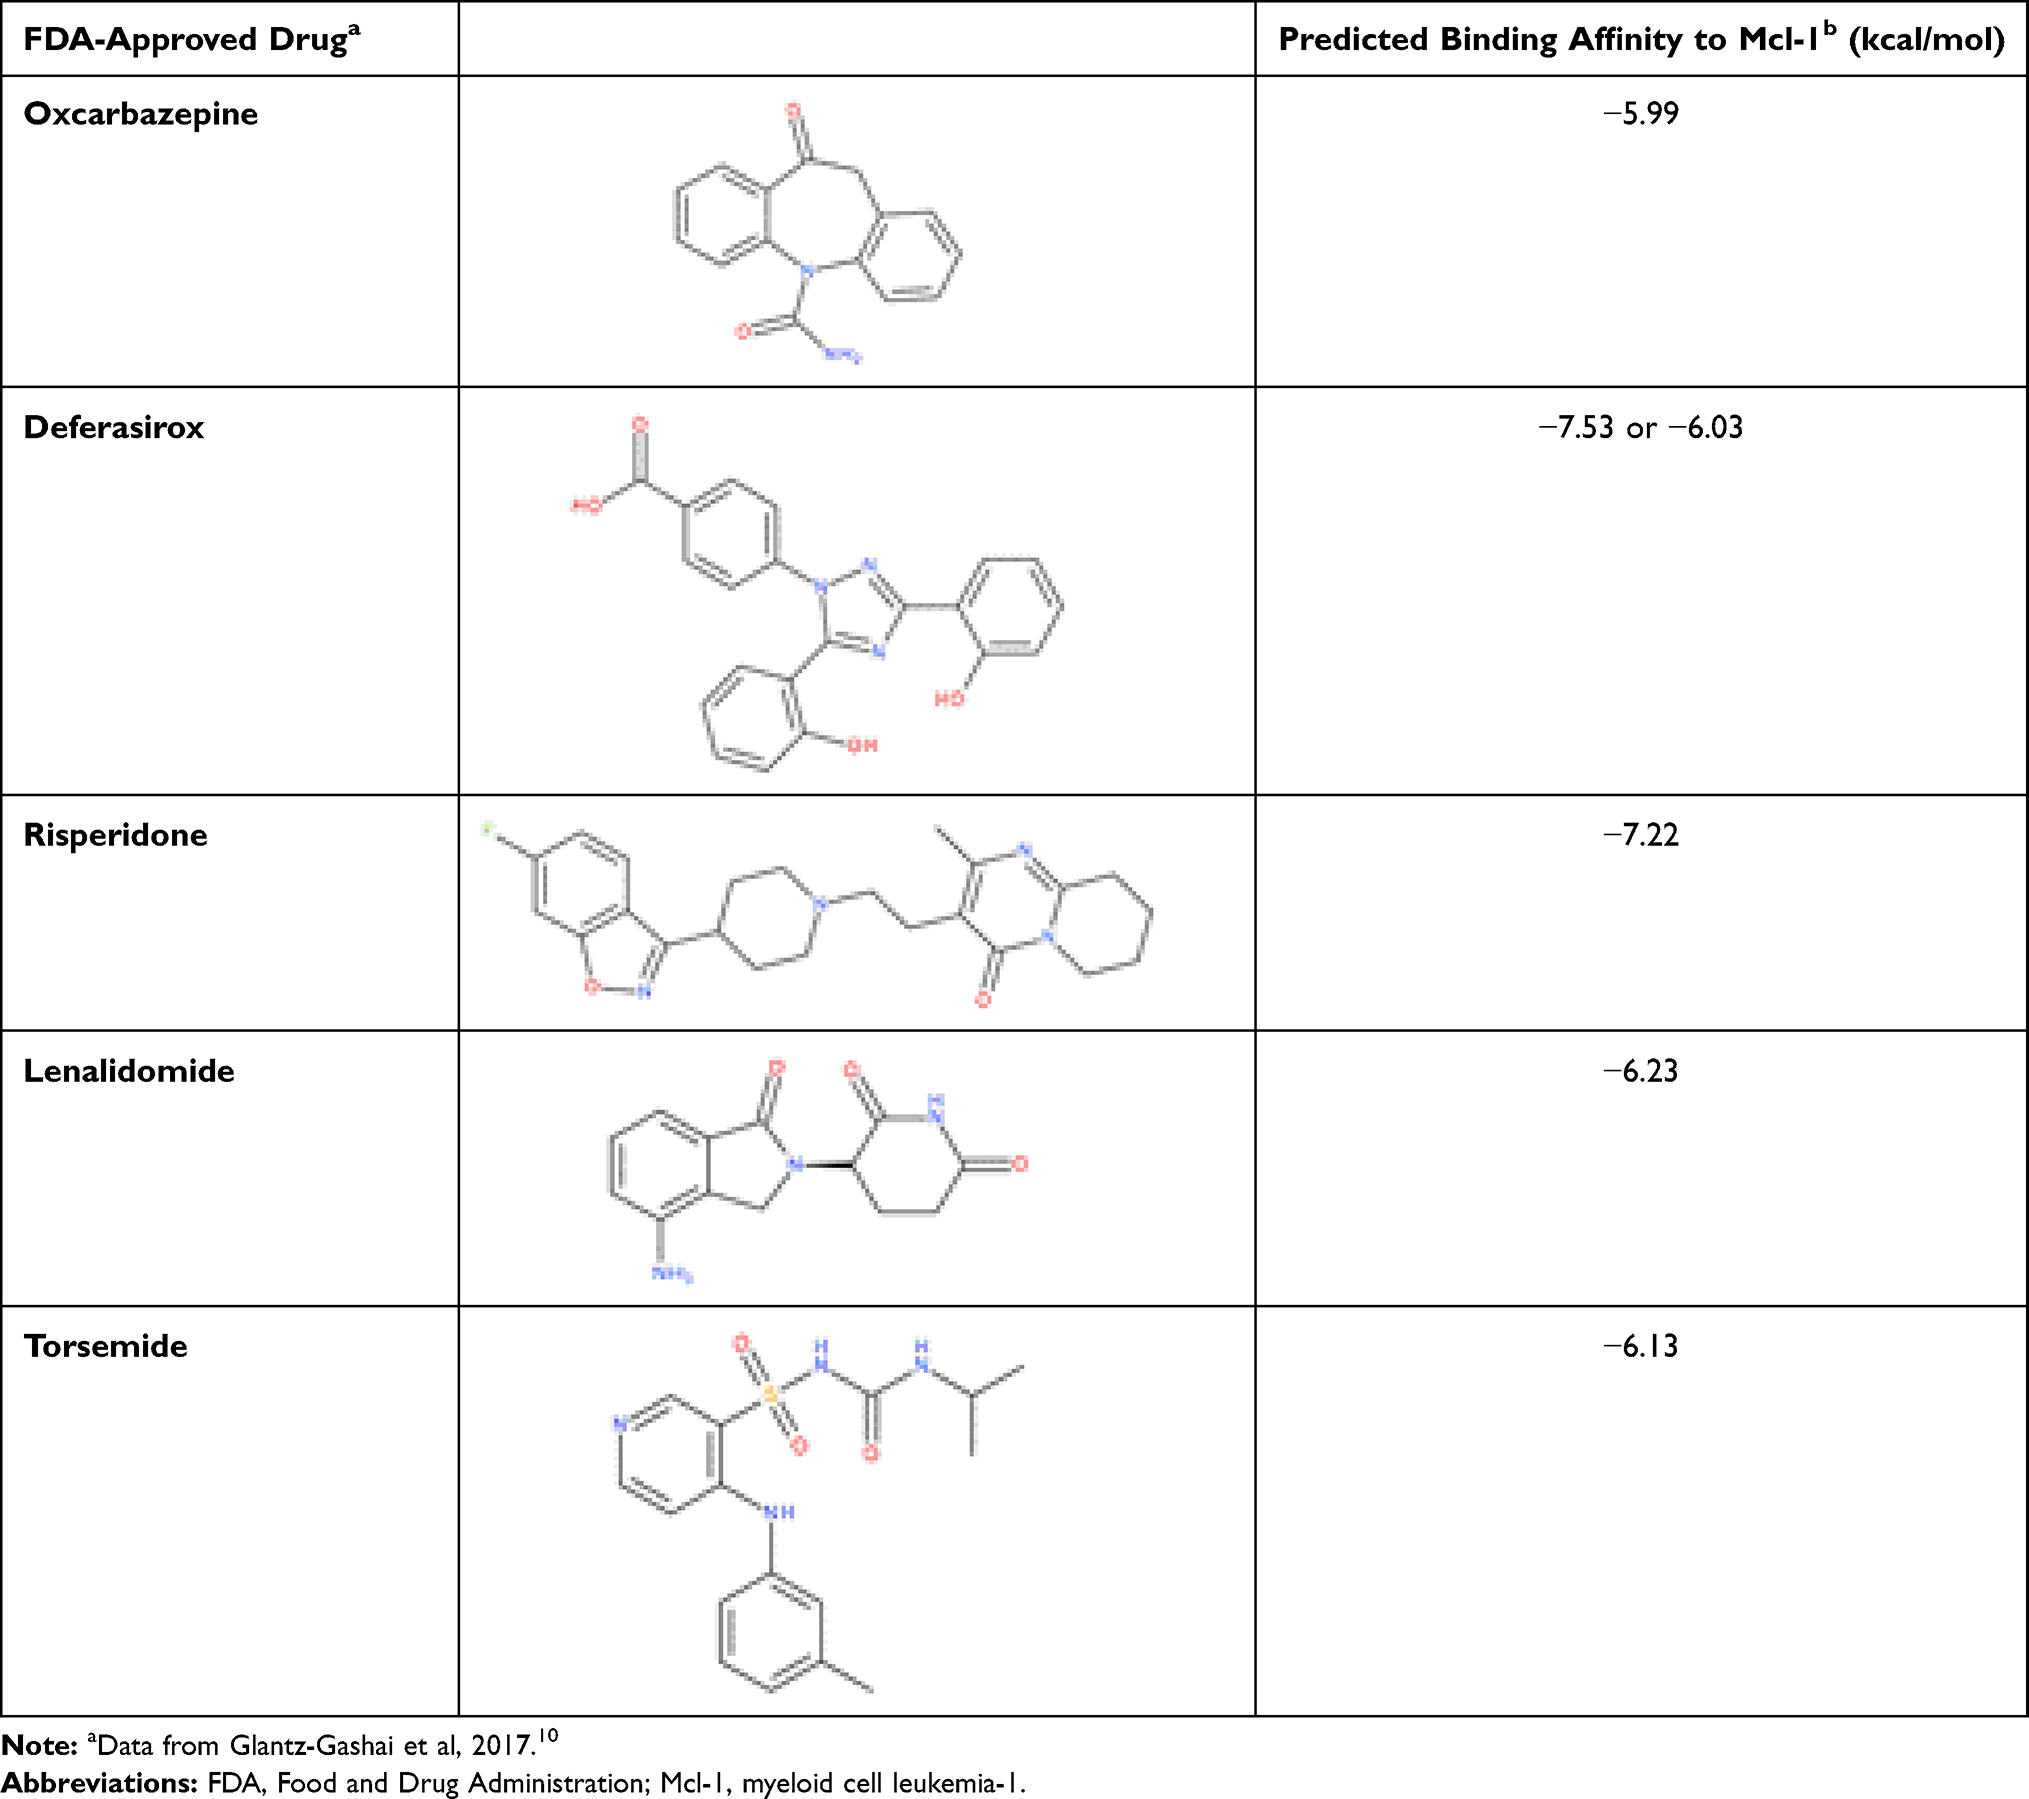 |
Table 1 The FDA-Drugs Experimentally Evaluated in This Study |
Oxcarbazepine, a tricyclic compound with histaminergic and serotoninergic activity, is used to control pain, depression and as an antiemetic in cancer patients. Deferasirox is an oral iron chelator used to reduce chronic iron overload.25 Recently, Deferasirox was found to induce apoptosis of multiple myeloma cells via the inhibition of proline-rich tyrosine kinase 2 (Pyk2), which is known to promote tumor growth in multiple myeloma.26 Risperidone is an atypical antipsychotic with serotonin and dopaminergic activity.27 Lenalidomide is a structural analogue of the rhodamine derivative, BH3I, developed by Degterev et al.28 The BH3I molecule has a micromolar affinity for the BH3 domain of Mcl-1 protein. Lenalidomide is already associated with cancer treatment: it induces apoptosis and is used in the treatment of multiple myeloma and myelodysplastic syndromes.29,30 Finally, Torsemide, is a pyridine-sulfonylurea diuretic mainly used in the management of edema associated with congestive heart failure.31 It is interesting to note that Torsemide has some structural similarities with ABT-737,32 a promising drug inhibiting Bcl-2 and Bcl-xL another two anti-apoptotic proteins of Bcl-2 family, particularly through the presence of benzyl-sulfonyl-amide moiety.
Nuclear magnetic resonance (NMR), a powerful tool to characterize protein–ligand interactions in solution under near physiological conditions,33–35 was used to probe interactions at the atomic level between the five chosen drugs and Mcl-1. Biological assays were then carried out on the confirmed compounds from NMR study to demonstrate their in vitro action on the ovarian cancer cells. Molecular modelling study guided by NMR observations allowed us to predict the binding mode of Deferasirox and Torsemide. Finally, the most potent of the tested molecules according to the assays results is Deferasirox.
Materials and Methods
Chemicals and Recombinant Mcl-1 for NMR Studies
Oxcarbazepine, Risperidone, Lenalidomide and Torsemide were purchased from Sigma-Aldrich and Deferasirox from VWR. Soluble labelled 15N Mcl-1 (172–327) was produced following a previously published protocol.36
NMR Experiments
The backbone assignment of Mcl-1 resonances was carried out in our previous work.36
To highlight the interaction and carry out the titration experiments between each drug and the labeled 15N Mcl-1, two sets of samples were prepared. The first set contained 600 µL of a uniformly 15N labeled Mcl-1 solution prepared at 50 µM in PBS buffer (20 mM, 130 mM NaCl, 2 mM DTT, pH 7, 5% D2O, v/v). The second set contained 15N labeled Mcl-1 and drugs at Ligand/Protein (L/P0) ratio of 20/1 in PBS buffer (20 mM, 130 mM NaCl, 2 mM DTT, pH 7, 5% D2O, v/v) at a concentration of 50 µM for protein and 1 mM for drugs.
For Torsemide and Deferasirox, the titration series were incremented in steps of 1 or 2 molar equivalents of the ligand. To do this, adequate volumes of each sample were mixed to obtain the following ratios L/P0 (0/1 – 1/1 – 2/1 – 3/1 – 4/1 – 6/1 – 8/1 – 10/1 – 12/1 – 14/1 – 16/1 – 17/1 – 18/1 – 19/1 – 20/1).
NMR spectra were recorded at 298K on a Bruker Avance III 600 MHz spectrometer equipped with a triple resonance cryoprobe {1H, 13C, 15N} including shielded z-gradients.
The interaction between 15N Mcl-1 and drugs was characterized by recording 2D 1H-15N HSQC experiments37 for each ratio L/P0 described above.
2D 1H-15N HSQC spectra were collected with 128 indirect points, 1152 direct points using spectral width of 40 ppm (F2, 15N) and 12 ppm (F1, 1H), respectively, and 64 scans. A one-second relaxation delay was used, and quadrature detection in the indirect dimension was obtained with states-time proportional phase incrementation (TPPI) phase cycling.38 Before Fourier transformation, linear prediction (LP) was applied in the indirect dimension (Forward LP on a complex data mode, Number of LP coefficients, and Number of points for LP were set to 64 and 32, respectively). The time domain data were zero filled (size of the real spectrum was 2048×512 points) and apodized by Sine Squared function. Data were acquired and processed using Topspin 3.5 software (Bruker Biospin).
Protein spectra were analyzed using Sparky for signal assignment,39 CCPNMR40 and TITAN41 for the estimation of KD and koff.
For a given 1H-15N HSQC cross peak, proton and nitrogen chemical shift perturbation induced by drug binding was defined as the combined difference between the corresponding chemical shifts in the bound and in the free states. The combined chemical shift perturbations (CCSP) were calculated from the 1H and 15N shift coordinates of the cross peaks using Equation (1):

where  and
and  are the observed chemical shift differences along the proton and nitrogen dimensions, respectively, with respect to the Mcl-1 free 1H-15N HSQC spectrum.
The dissociation constant (KD) was then obtained by monitoring the chemical shift changes of the backbone amide as a function of ligand concentration using a binding model with 1:1 stoichiometry42 in CCPNMR software40 (Equation 2).
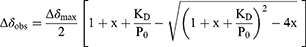
where ∆δobs is the change in the observed shift from the free state and fitted ∆δmax is the maximum change in chemical shifts for the given peak, x is the molar L/P0 ratio and P0 is the total concentration of the labelled protein.
1H-15N HSQC spectra were also analyzed by the TITAN program41 using a two-state binding mode. Mcl-1 concentration, drugs concentrations and NMR acquisition parameters were provided as inputs for the data fitting. Ten peaks with significant CCSPs were chosen to be fitted for each titration experiment. Error analysis was performed by the bootstrap re-sampling module in the program with 100 re-sampled spectra.
Biological Assays
Cell Culture and Treatment
IGROV1-R10 cells were obtained as previously described from IGROV1 cell line,43 itself kindly provided by Dr. Jean Bénard (Institut Gustave Roussy, Villejuif, France). This cell line was cultured in RPMI 1640 medium supplemented with 2 mM GlutamaxTM, 25 mM HEPES, 10% fetal calf serum, and 33 mM sodium bicarbonate (Fisher Scientific, Illkirch, France). The atmosphere was maintained at 37°C and 5% CO2. 550,000 cells were seeded in 25 cm2 flasks. After 24 h, exponentially growing cells were exposed to Deferasirox or Torsemide (0.1 to 50 µM) as single agents or in combination with ABT-737 (5 µM) or S63845 (1 µM) for 48 h.
Real Time Cell Imaging
Six thousand cells were seeded in 96-well plates in appropriate media. Cells were maintained at 37°C and 5% CO2 and monitored using an IncuCyte® S3 (Essen BioScience) and baseline images were taken using 10x objective. Phase-contrast images were acquired in real time every 2 hours from a single region per well. The live-cell phase contrast images were used to calculate confluence using the IncuCyte® software, and to provide morphology information.
Morphological Observation of the Cell Nuclei
Both detached and adherent cells were pooled after trypsinization, applied to a polylysine-coated glass slide by cytocentrifugation and fixed with a solution of ethanol/chloroform/acetic acid (6:3:1) after treatment. Preparations were then incubated for 15 min at room temperature with 1 μg/mL DAPI solution (Boehringer Mannheim-Roche, Mannheim, Germany), washed in distilled water, mounted under a coverslip in Mowiol (Calbiochem) and analyzed under a fluorescence microscope (BX51, Olympus, Rungis, France).
Target Expression and Apoptosis Induction Analysis by Western Blot
Cells were rinsed with ice-cold PBS, suspended in a lysis buffer [RIPA: NaCl 150 mM, Tris (pH 8) 50 mM, Triton X100 1%, PMSF 4 mM, EDTA 5 mM, NaF 10 mM, NaPPi 10 mM, Na3VO4 1 mM, aprotinin 0.5 µL/mL and 4.6 mL ultra-pure water] and incubated on ice for 30min. Lysates were collected after centrifugation (13200 g, 10 min, 4°C) and protein concentrations were determined using the Bradford assay (Bio-Rad, Hercules, USA). Equal amounts of protein (25 µg) were separated by SDS-PAGE on a 4–15% gradient polyacrylamide Mini-PROTEAN® TGX™ precast gel (Bio-Rad) and transferred to PDVF membranes (Bio-Rad). Membranes were blocked 1 hour at room temperature with 5% (v/v) non-fat dry milk in TBS with 0.05% (v/v) Tween 20 (T-TBS). Membranes were then incubated overnight at 4°C with the appropriate antibodies, listed above. Membranes were then washed with T-TBS and incubated for 1 hour with the appropriate secondary antibody. Signals were revealed using Enhance ChemiLuminescence substrate (ECL) Prime Western Blot detection reagent (GE Healthcare Life Sciences) and the ImageQuant® Las4000Series (GE Healthcare Life Sciences).
Antibodies used: anti-Caspase 3 (#9662), anti-PARP (#9542), (Cell Signaling Technology), anti-Actin (#MAB1501) (Merck Millipore).
Apoptotic Events Quantification Using Flow Cytometry
Adherent and floating cells were pooled by trypsinisation, washed with phosphate-buffered saline (PBS) and fixed with ethanol 70%. Cells were then centrifuged at 2000 r.p.m. for 5 min and incubated for 30 min at 37°C in PBS, to allow the release of low molecular weight DNA. Cell pellets were stained with propidium iodide using the DNA Prep Coulter Reagent Kit (Beckman Coulter). Samples were analyzed using Gallios flow cytometer (Beckman Coulter) and cell cycle distribution was determined using Gallios software (Beckman-Coulter).
FPA Experiments
Carboxy-fluorescein labeled peptide (5‐FAM‐EDIIRNIARHLAQVGDSMDR‐NH2) and Bim-WT peptide (H-Ahx-DMRPEIWIAQELRRIGDEFNAYYAR-OH) were purchased from GENEPEP and used without further purification. Mcl-1 (172–327) was produced following a previously published protocol.36 FPA measurements were carried out in 96-well, black, flat-bottom plates (Greiner Bio-One) using the Biotek microplate reader Synergy 2. All assays were conducted in assay buffer containing 20 mM Na2HPO4 (pH 7.4), 50 mM NaCl, 2 μM EDTA, 0.05% Pluronic F-68. For IC50 determination, compounds were diluted in DMSO in a 8-point, serial dilution scheme, added to assay plates and were incubated with 100 nM Mcl-1 for two hours. Then, to measure inhibition of Mcl-1/FAM-Bid interaction, 15 nM 5-FAM-Bid peptide was added and plates were incubated for two hours at room temperature. For each experiment, a negative control containing Mcl-1 and 5-FAM-Bid peptide (equivalent to 0% inhibition), and a positive control containing Mcl-1, 5-FAM-Bid peptide, and 10 μM Bim-WT peptide (equivalent to 100% inhibition) were included on each assay plate. Each point was duplicated and each experiment was performed in two biological replicates. The change in polarization was measured and used to calculate an IC50 (inhibitor concentration at which 50% of bound peptide is displaced), by fitting the inhibition data using GraphPad Prism 6 software to a sigmoidal, 4PL, X is log(concentration). This was converted into a binding dissociation constant (Ki) according to the formula described by Nikolovska-Coleska et al.44
Docking and Molecular Dynamics Simulations
Docking
Mcl-1 X-ray structure (PDB ID 3WIX),45 with the ligand removed, was prepared using Schrödinger’s Protein Preparation Wizard (PrepWizard)46 and used for the molecular docking. The Schrödinger’s Protein Preparation Wizard generated tautomer with hydrogen on Nε2 nitrogen for His224 and His277 and tautomer with hydrogen on Nδ1 nitrogen for His252 and His320. The Deferasirox and Torsemide starting X-ray structures were fetched from the Cambridge Structural Database (CCDC N°872554 and CCDC N°795036).47–49 The protonation state of Deferasirox and Torsemide at pH = 7 was checked, and a deprotonated carboxylic group form was used in our modelling study of Deferasirox.
Docking was performed using the EA Dock DSS docking software50 through the swissDock server.51 In a nutshell, the binding modes are generated on all found binding cavities, and the CHARMM22 force-field is used to compute the binding energies. Then, the best interacting modes are post-processed using the implicit solvation model FACTS (Fast Analytical Continuum Treatment of Solvation)52 to include the desolvation effect of ligand binding. Finally, the clustering of the binding modes is performed using a 2 radius, with a maximum of 8 binding modes per cluster.
Generated binding mode clusters from docking study were analyzed visually and two poses were retained depending on the orientation of the Deferasirox and Torsemide in the binding groove, and their interaction with Mcl-1’s main hotspots observed in the NMR study.
Molecular Dynamics Simulations and Noncovalent Interactions Analysis
The stability of the two selected binding poses for each ligand was then assessed using unbiased molecular dynamics simulations of 100 ns. All simulations were performed using NAMD 2.12 software.53 The all-atom CHARMM 36m forcefield54,55 was applied for the protein and CGENFF56 for ligands. The CHARMM-GUI server57 was used to prepare the starting systems. Each system was solvated using the TIP3P explicit water model58 within a rectangular box; the box size ensured that the simulated complex was at a minimum distance of 10 Å from the edge. 0.15 M of NaCl was added to neutralize the total charge of the system. Periodic boundary conditions were applied to the systems using the IMAGE algorithm. Van der Waals interactions were truncated using a force switching function between 10 and 12 Å and the Particle Mesh Ewald (PME)59 was used to calculate long-range electrostatic interactions. All bonds involving hydrogen atoms were restrained by the SHAKE algorithm.
The systems underwent energy minimization in 10,000 steps. Next, the minimized systems were heated to 300 K and the dynamics were temperature-equilibrated during 50 ps via heating reassignment under NVT conditions. Finally, the systems ran freely for 100 ns under NPT conditions with a 2 fs time step. Langevin dynamics with a damping coefficient of 1 ps−1 were used to maintain the system temperature and the Nosé-Hoover Langevin piston was used to maintain a 1 atm pressure. Production trajectories were saved every 10 ps and resulted in 10,000 frames. These trajectories were analyzed using VMD60 and the Pycontact software61 for noncovalent interactions.
In order to account for noncovalent interactions and their evolution during the trajectory, a geometrical approach was used. In the first place, the interatomic distance matrix between ligand and the protein atoms was computed. Then, a cutoff distance of 5 was applied to consider an interaction and a sigmoid function, f(d), scored the interaction along the distance as follows (equation 3):61
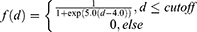
The interaction score, resulting from this sigmoid function was afterward encoded to an intensity color gradient per time unit.
Results & Discussion
NMR Analysis
We used an NMR approach based on the observation of protein signals to probe ligand binding to Mcl-1, to define protein hotspots and to quantify the binding affinity of each of the five chosen drugs for Mcl-1 (estimation of dissociation constant values KD).
For this purpose, we expressed and purified 15N-labeled Mcl-1 and recorded 2D 1H-15N HSQC experiments in the absence and presence of each of the 5 ligands. The NMR assignment of Mcl-1 backbone resonances in the free form was previously obtained from the analysis of 1H, 15N, and 13C triple resonance experiments.36,62
As shown in Figure 1, the presence of 20 molar equivalents of Risperidone, Lenalidomide, or Oxcarbazepine did not result in any modification of the 2D 1H-15N HSQC spectrum of the protein. Mcl-1 amide cross peaks showed neither significant chemical shift perturbations nor changes in intensities, reflecting the lack of interaction between these 3 compounds and the protein.
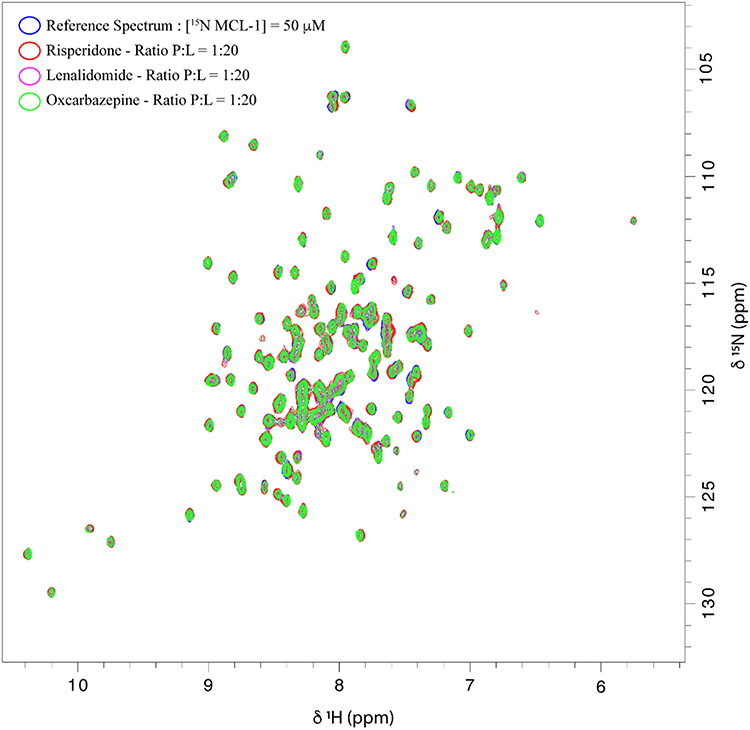 |
Figure 1 Overlay of 1H-15N HSQC spectra obtained for 15N-Mcl-1 in the absence and presence of Risperidone, Lenalidomide or Oxcarbazepine. |
The discrepancy between the computational study previously performed by Glantz-Gashai et al10 and this experimental validation can be due to different aspects. It is known that the scoring functions employed during the docking studies have some weakness, leading to discrepancies between docking and in vitro screening accuracy.63 The widely used docking programs predict ligand positions in the target similar to these observed by X-ray crystallography or NMR, but their scoring function does not necessarily rank it as the best. In addition, in the AutoDockVina program employed by Glantz-Gashai et al,10 the binding site in the protein is predefined by a box and so the choice of its position as well as its size could influence the results because it forces the ligands to position inside it. Furthermore, the success of docking depends also on the choice of protein structure conformation used in docking. For example, we previously demonstrated that Mcl-1 adopts an equilibrium between several conformations in its apo state but the opening of the P2 pocket, crucial for the synthetic ligands binding is only induced by the ligand presence.64
The situation is different in the case of Torsemide and Deferasirox, which induce significant chemical shift perturbations (CSP) in the 1H-15N HSQC spectrum of the protein. We therefore focused on the characterization of the interaction between Mcl-1 and these two compounds separately.
Mcl-1: Torsemide
The comparison of 1H-15N HSQC spectra recorded in the absence and presence of 20 molar equivalent of Torsemide (Figure 2) allowed us to calculate combined CSP values (CCSP) for each protein residue (Figure 3A) and to identify protein regions involved in the ligand binding.
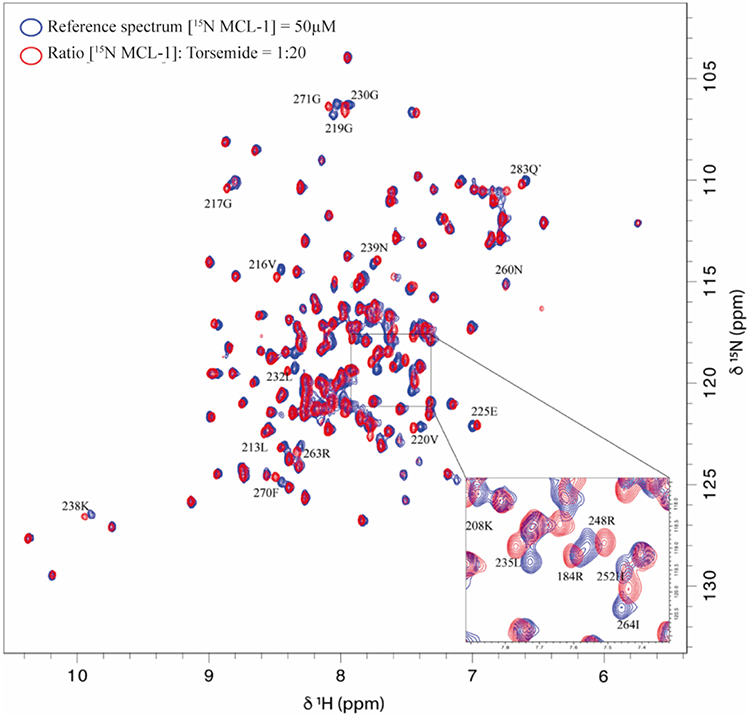 |
Figure 2 Overlay of 1H-15N HSQC spectra obtained for 15N -Mcl-1 in the absence and presence of Torsemide. |
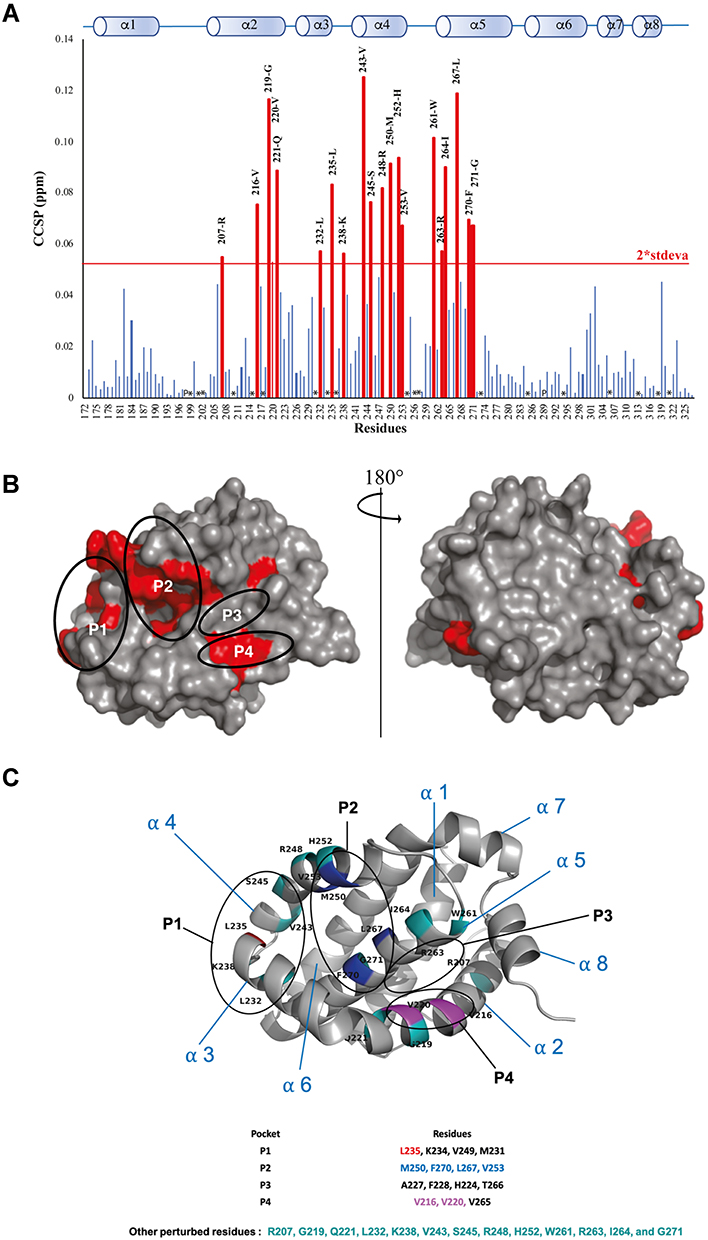 |
Figure 3 (A) Measured Combined Chemical Shifts Perturbation (CCSP) of the Mcl-1 amide functions after the addition of Torsemide (ratio 15N-Mcl-1:Torsemide 1:20). (P) presence of Proline. (*) Undetermined. (B) The most perturbed residues on the surface of the Mcl-1 protein. (C) The cartoon representation of Mcl-1 structure with annotation of most perturbed residues (red=residues from P1, Blue=residues from P2, Purple= residues from P4, Green=other residues). |
As shown in Figure 3A and B, protein residues exhibiting the highest CCSP values are mostly localized in the canonical BH3 binding groove of Mcl-1 and include Leu267, Trp261, His252, Met250, Ile264, Leu235, Leu232, Phe270, Val253, Val216, Gly219, Glu221, Val220 and Arg263. These residues form a continuous surface on only one side of the protein and are mainly located at and around hydrophobic pockets P1, P2, and P4 of the Mcl-1 canonical binding site.36
Large CCSP values were also observed for residues Val243, Ser245, and Arg248 of helix α4 that are close to hotspot residues Met250, His252, and Val253 in the Mcl-1 structure (Figure 3C). The perturbation of Lys238 in the loop α3-α4 (Figure 3C) is likely due to a conformational rearrangement induced by its spatial proximity with the P1 hydrophobic pocket.
The contact surface formed by the perturbed residues is much larger compared to the size of the Torsemide, ie, in a 1:1 stoichiometry model, and the Torsemide could unlikely occupy simultaneously both hydrophobic pockets P2 and P4. Thus, the chemical shift changes of P4 residues Val216, Gly219, Val220, and Glu221 may result from a direct binding to Torsemide or from their spatial proximity with the P2 hydrophobic pocket.
NMR titration experiments were also conducted to quantify the binding affinity (KD) for Torsemide. NMR crosspeaks of the 1H-15N HSQC spectrum showed linear concentration-dependent chemical shift changes upon addition of increasing amounts of the ligand (Figure 4A), indicating a fast exchange regime on the NMR chemical shift time scale.42 In this case, the evolution of the 1H-15N chemical shifts with the protein/Torsemide molar ratio can be fitted to determine apparent thermodynamic affinities at the residue level (Figure 4B). Apparent KD for the most perturbed residues were estimated in the millimolar range, with an average value of 1 mM.
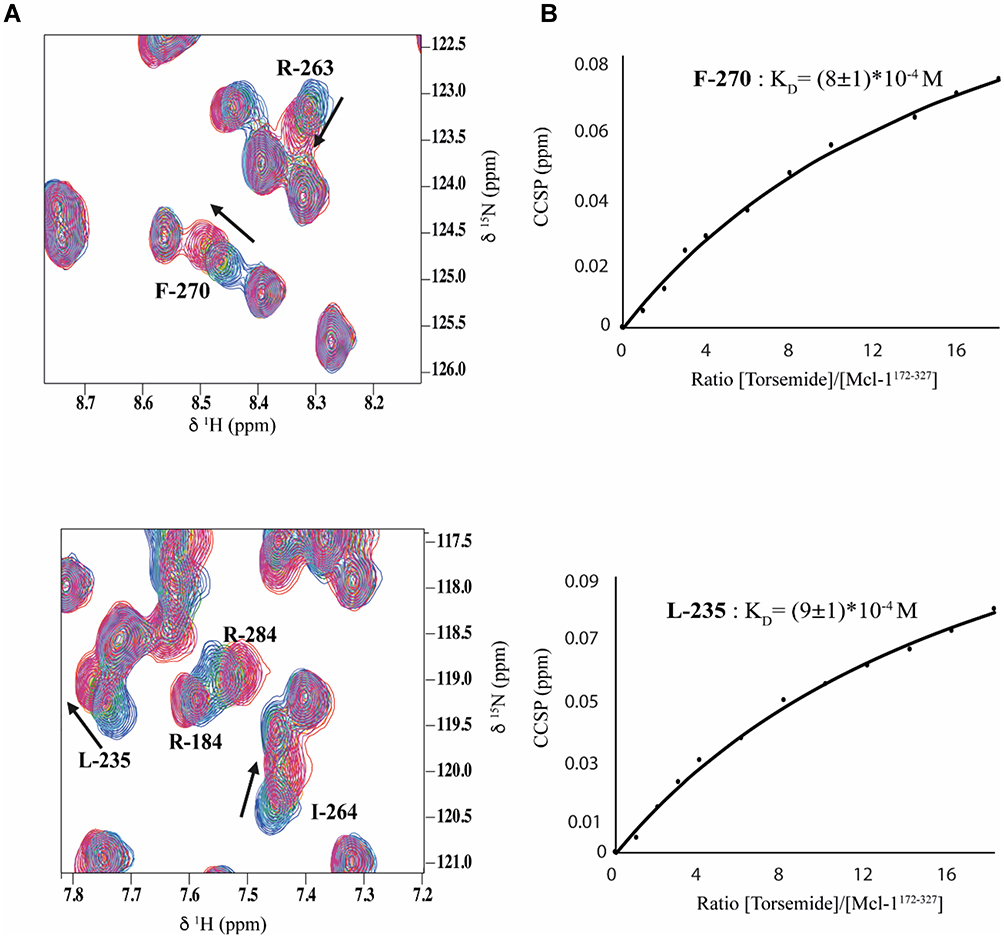 |
Figure 4 Overlay of 1H-15N HSQC spectra (expanded views) obtained for 15N-Mcl-1 in the absence and presence of increasing amounts of Torsemide (various L/P0 ratio). Chemical shift modifications of residues F-270, R-263, L-235, R-184, R-284 and I-264 (A), are indicated by black arrows. (B) Titration curves for F-270 and L-235 and KD estimation of each residue using Equation (2). |
2D line-shape analyses of the NMR crosspeaks, carried out using the TITAN software,41 allowed the estimation of the kinetic (koff) and thermodynamic (KD) constants. Interestingly, it revealed a slow koff value (818 ± 8 s−1) and a low residence time τ of 1.2 ms (τ = 1/koff). These values are consistent with the low affinity of Torsemide for the Mcl-1 protein.
Mcl-1: Deferasirox
Using the same approach, the analysis of 1H-15N HSQC spectra of Mcl-1 recorded in the absence and presence of increasing amounts of Deferasirox also revealed significant chemical shift perturbations (Figure 5). This observation reflects the presence of an interaction between this drug and Mcl-1. The highest CCSP values correspond to residues located either in the hydrophobic pockets (P1: Lys234, Leu235/ P2: Val253, Leu267, Phe270/ P3: Phe228/ P4: Val216, Val220) or in the areas surrounding them (Gly219, Arg263, Val243, Ile264, Asp256, Trp261, Asp236, Gly271, Arg248, Gly217, Lys238, Thr259 and Leu232) (Figure 6A and B).
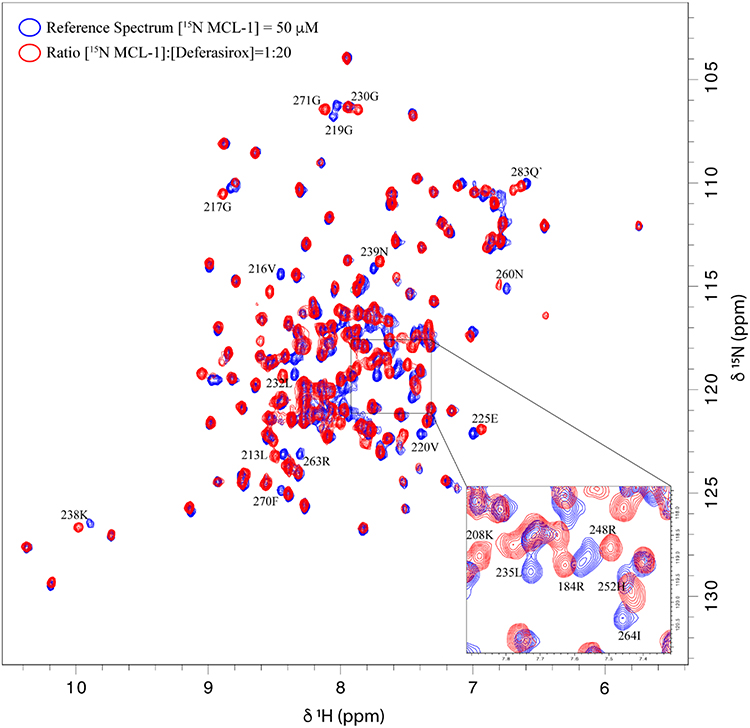 |
Figure 5 Overlay of 1H-15N HSQC spectra obtained for 15N-Mcl-1 in the absence and presence of Deferasirox. |
 |
Figure 6 (A) Measured Combined Chemical Shifts Perturbation (CCSP) of the Mcl-1 amide functions after the addition of Deferasirox (ratio 15N-Mcl-1:Deferasirox 1:20). (P) presence of Proline. (*) Undetermined. (B) The most perturbed residues on the surface of the Mcl-1 protein. (C) The cartoon representation of Mcl-1 structure with annotation of most perturbed residues (red=residues from P1, Blue=residues from P2, Purple= residues from P4, Green=other residues). |
As observed for Torsemide, the mapping of the residues, perturbed by Deferasirox on the surface of Mcl-1, reveals a continuous contact zone on the same side of the protein centered on pocket P2 (Figure 6B and C). However, the observed CCSP values were higher for Deferasirox compared to Torsemide, suggesting that Deferasirox has a higher affinity for Mcl-1 protein.
Accordingly, a dissociation constant (KD) of approximately 300 µM was extracted from the fitting of CCSP values as a function of protein/ligand molar ratio, confirming that Mcl-1 shows a 3-fold greater affinity for Deferasirox than for Torsemide (Figure 7).
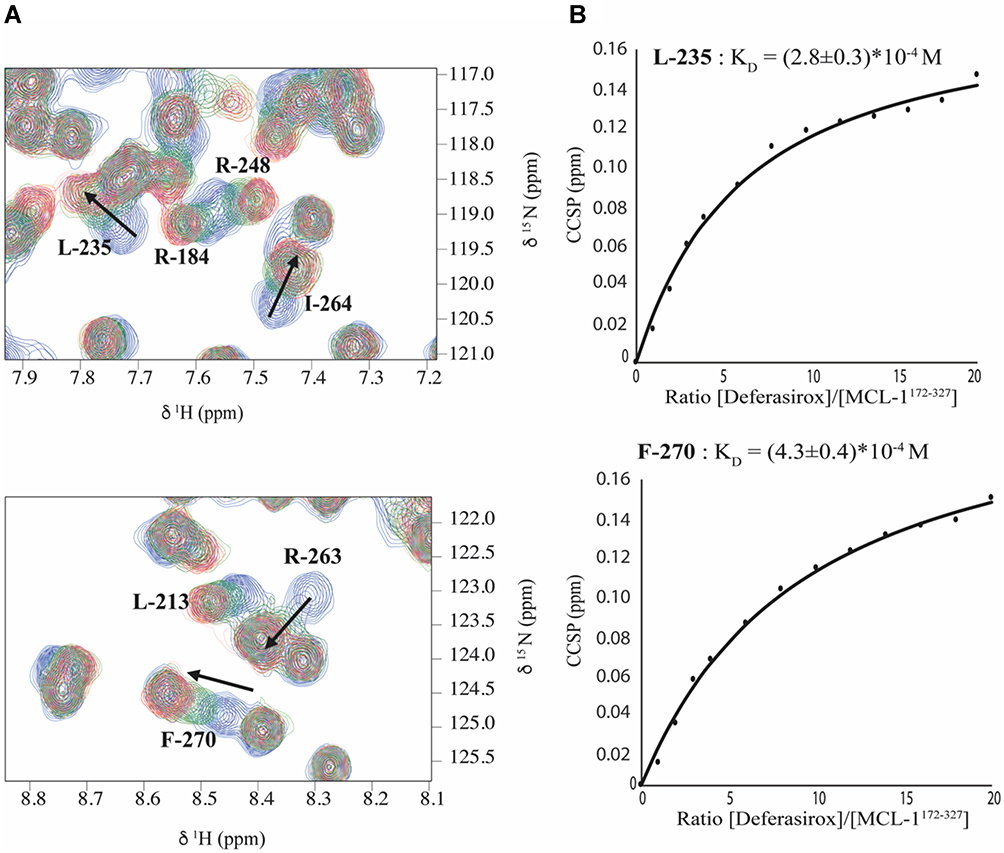 |
Figure 7 Overlay of 1H-15N HSQC spectra (expanded views) obtained for 15N-Mcl-1 in the absence and presence of increasing amounts of Deferasirox (various L/P0 ratio). Chemical shift modifications of residues L-235, R-184, R-248, I-264, L-213, R-263 and F-270 (A), are indicated by black arrows. (B) Titration curves for L-235 and F-270 and KD estimation of each residue using Equation 2. |
The koff, KD and τ values of 368 ± 8 s−1, 262 µM and 2.71 ms, respectively, were also calculated using the TITAN software and reflect the higher affinity of Deferasirox for the Mcl-1 protein.
As for Torsemide and other previously studied ligands, it was observed that the identified contact surface is larger compared to the Deferasirox size (Figure 6C). This suggests that some NMR perturbations induced by Deferasirox could be related to an indirect effect of the interaction.36
Biological Assay
We next performed biological assays to validate the effect of Deferasirox and Torsemide on Mcl-1 anti-apoptotic activity. The chemoresistant IGROV1-R10 ovarian cancer cell line was used since it is known to be in a steady state for apoptosis entry following concomitant Mcl-1 and Bcl-xL inhibition as previously described.65 Mcl-1 inhibition by the molecules is assessed by a treatment of IGROV1-R10 cells in combination with ABT-737, a well-known Bcl-xL inhibitor. In this context, Mcl-1 inhibitors induce massive apoptosis as shown by the effect of the combination of the selective Mcl-1 inhibitor S63845 with ABT-737 on IGROV1-R10 cells (Figure S1).
We first investigated the effect of both compounds from 0.1 to 50 µM on IGROV1-R10 cells by real-time imaging in 96-well plates. Deferasirox did not induce cytotoxic effects as single agent even at 50 µM. In contrast, Torsemide at 50 µM decreases proliferation as single agent.
Deferasirox and Torsemide have then been tested in association with ABT-737 to confirm their potential activity and selectivity on Mcl-1 suggested by NMR studies.
For Deferasirox, 25 µM appeared as the optimal concentration to obtain the best cytotoxic effect in combination with ABT-737 (Figure 8). A concentration-dependent slowed down proliferation was suggested by the reduced cell confluency. Moreover, cell detachment and cell shrinking were observed when Deferasirox was combined to ABT-737.
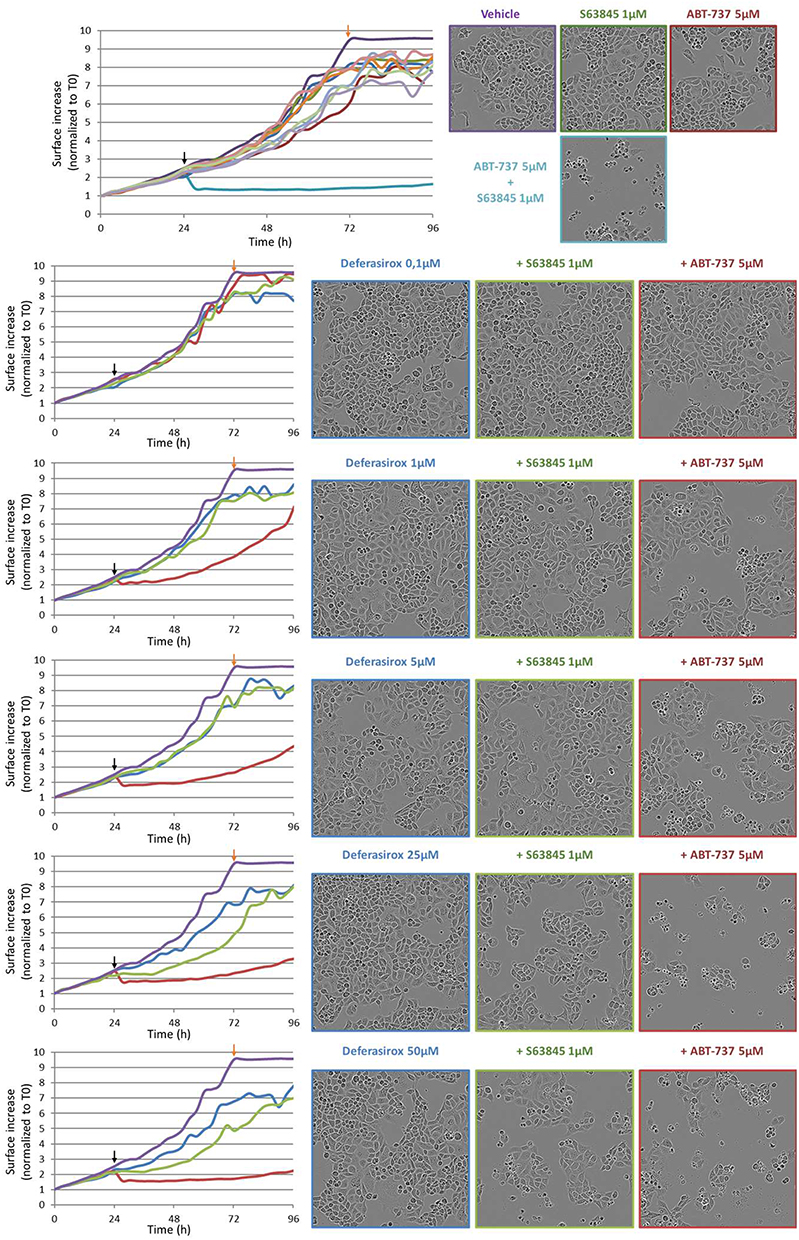 |
Figure 8 Time and concentration effect of Deferasirox combined with ABT-737 5μM or S63845 1 μM on IGROV1-R10 cell line. Black arrows correspond to treatment time and Orange arrows highlight the 48h exposure time, corresponding to photos. |
The selective activity of the compounds on Mcl-1 as compared to Bcl-xL, was also evaluated using a combination with S63845. Selectivity for Mcl-1 should result in a massive apoptosis induction in combination with ABT-737 but not with S63845. Conversely, if the molecule is able to bind to Bcl-xL and inhibits its activity, cells will undergo apoptosis in combination with S63845. In our experiments, Deferasirox did not induce cytotoxic effect when combined to S63845, suggesting its specificity for Mcl-1 as compared to Bcl-xL (Figure 8).
In contrast, Torsemide appeared as a less potent Mcl-1 Inhibitor. Indeed, at 25µM, only a weak cytotoxic effect is observed in combination with ABT-737. At 50 µM, Torsemide exerts a cytotoxic effect when combined to ABT-737, but also a marked cytostatic effect as a single agent (Figure 9).
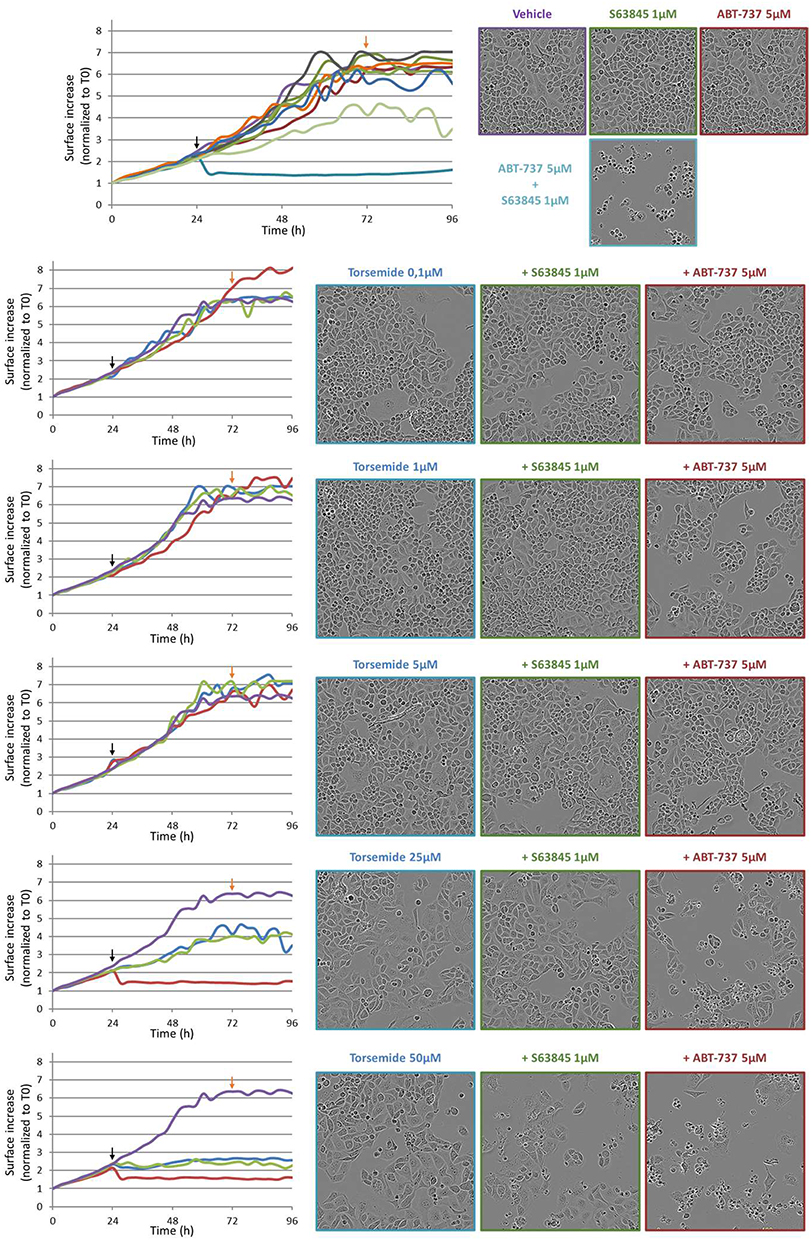 |
Figure 9 Time and concentration effect of Torsemide combined with ABT-737 5 µM or S63845 1 µM on IGROV1-R10 cell line. Black arrows correspond to treatment time and Orange arrows highlight the 48 h exposure time, corresponding to photos. |
In order to complete these results and to demonstrate the apoptotic nature of cell death, we observed cells and nuclear morphologies as well as DNA content histograms (cell cycle repartition). After a 48h exposure, neither 25 µM Deferasirox nor 25 µM Torsemide induced apoptosis as single agents (Figure 10). When they were combined to S63845, little or no modification of cells and nuclei morphologies or DNA content histograms were observed, strongly suggesting that the molecules are not able to inhibit Bcl-xL, as expected. In contrast, when Deferasirox was combined to ABT-737, a great number of floating and shrunk cells was observable, suggesting a high level of cell death. The observation of nuclei morphologies after DAPI staining showed numerous nuclear condensations and fragmentations evocative of apoptotic cell death, as well as the appearance of a sub-G1 peak (Figure 10A). Lastly, Western blot revealed an intense PARP and Caspase 3 cleavages only in cells exposed to the Deferasirox/ABT-737 combination, confirming the apoptotic nature of cell death (Figure 10). In contrast, the combination of Torsemide with either ABT-737 or S63845 did not exert more effect than the one observed with the molecules used separately.
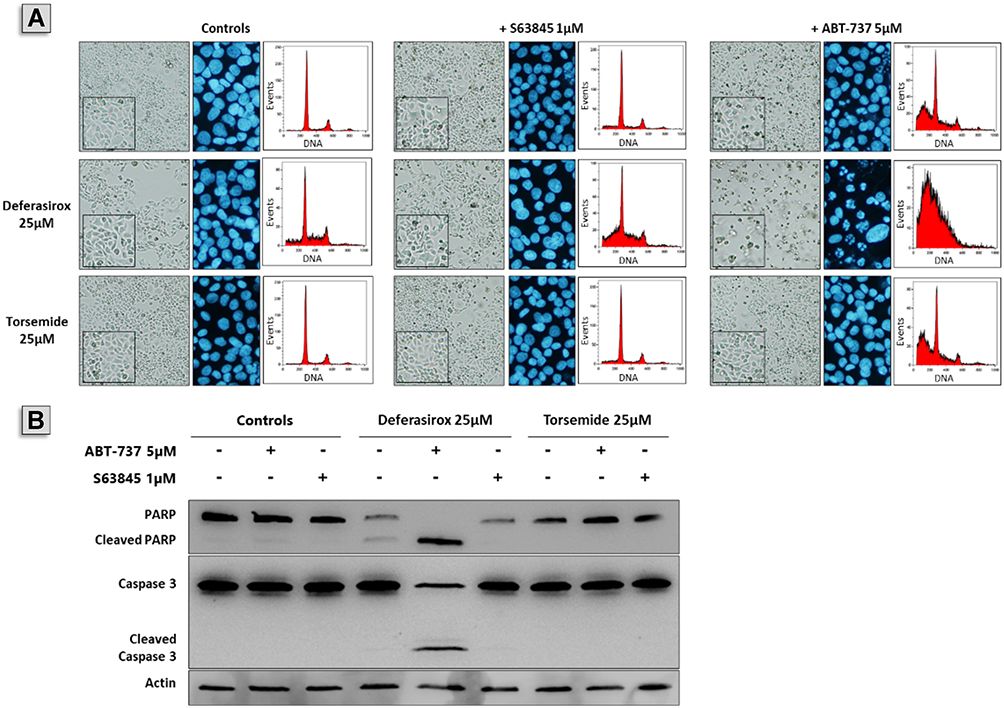 |
Figure 10 Effect of Deferasirox and Torsemide in combination with ABT-737 or S63845 on apoptosis on IGROV1-R10 cell line. Twenty-four hours after seeding, IGROV1-R10 ovarian cancer cells were exposed to 25 μM Deferasirox or Torsemide for 48 h in absence or presence of 5 μM ABT-737 or 1 μM S63845. (A) Effects of Deferasirox or Torsemide on cellular morphology, DNA content and nuclear morphology. (B) PARP and caspase 3 cleavage was assessed by Western blot in order to visualize apoptosis induction. |
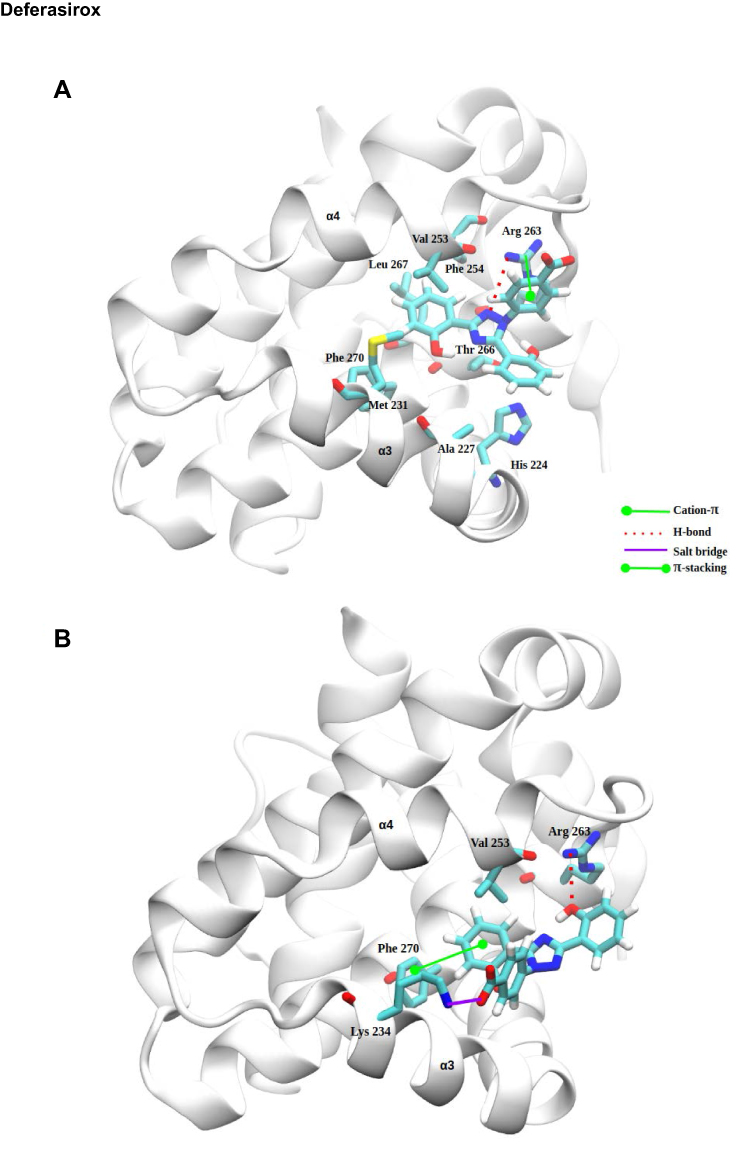 |
Figure 11 Continued. |
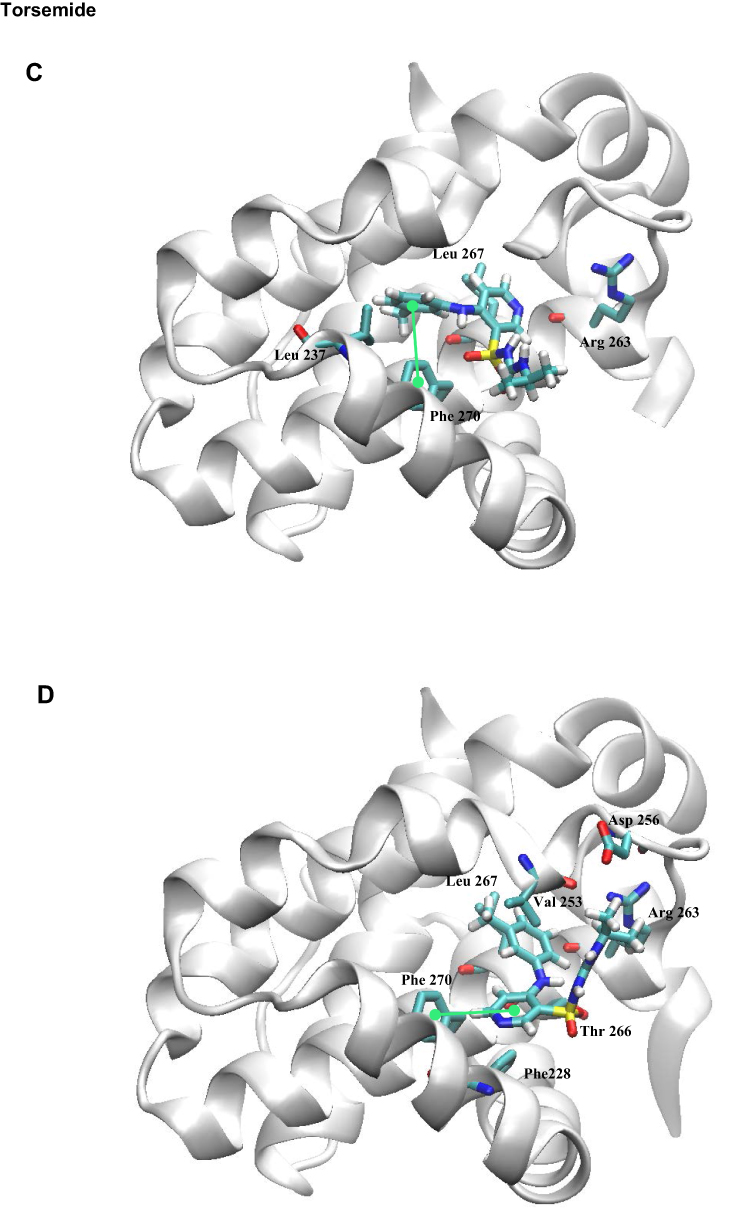 |
Figure 11 Docking binding poses of Deferasirox in Mcl-1; (A) Pose 1; (B) Pose 2 and of Torsemide; (C) Pose 1 and (D) Pose 2. |
Taken together, our results showed that Deferasirox is able to efficiently inhibit Mcl-1 in a dose and time-dependent manner with optimal conditions reached with 25 µM and a 48 h exposure. The biological activity of Torsemide seems to be lower as compared to the one of Deferasirox since a 50 µM concentration is required to observe similar effects, this concentration being itself associated to a cytostatic effect of Torsemide used as a single agent.
Competition Binding Assays by FPA
In order to determine if the mechanism of Deferasirox killing IGROV1-R10 in combination with ABT-737 is through inhibiting Mcl-1, and to see the effect of Deferasirox on disrupting Mcl-1 interactions with pro-apoptotic partners like Bid, competition binding assays using Fluorescence polarization anisotropy (FPA) were carried out. The results confirmed a direct interaction between Mcl-1 and Deferasirox and evidenced that Deferasirox was able to disrupt interactions between Mcl-1 with Bid. An inhibition close to 60% (at 600 µM) was observed and IC50 and Ki values of 368 ± 45 µM and 83 ± 10 μM, respectively, were obtained for Deferasirox (Figure S2).
Torsemide was also tested. As expected, a weaker inhibition close to 20% was observed at a concentration of 600 µM. This inhibition was too weak to allow the estimation of IC50 and Ki values.
Deferasirox and Torsemide Binding Modes Through Molecular Modeling
To elucidate, in detail, the binding modes of Torsemide and Deferasirox in Mcl-1, a docking study followed by molecular dynamics simulation was carried out. Three X-ray structures of Deferasirox47,66,67 and Torsemide49 are available in the Cambridge Structural Database. The three structures of Deferasirox are closely related and share a common intramolecular H-bond between one hydroxyl group and the nitrogen atom of the triazole group. We docked the Deferasirox X-ray structure (CCDC N°872554) and Torsemide one (CCDC N°795036) to the Mcl-1 model (PDB ID: 3WIX) using swissDock server. We applied the blind docking approach during which ligands binding poses in the vicinity of all Mcl-1 cavities were generated. For Deferasirox, among 29 clusters resulting from docking, only one was elsewhere than in the canonical binding site (Figure S3A). While for Torsemide, a total of 56 clusters were generated and 4 clusters were outside of the canonical binding site (Figure S3B). None of the Torsemide clusters nor Deferasirox ones occupied the P4 pocket. We retained two binding poses of Deferasirox and two of Torsemide from the docking results, based on the perturbed residues revealed by the NMR study. In the case of Deferasirox, the conservation of the intramolecular H-bond in Deferasirox was also regarded during the selection. The selected poses for both ligands corresponded to cluster 1 centroid and cluster 2 centroid, two most energy-favorable clusters from docking, and they are shown in Figure 11.
In the selected poses, Torsemide interacted with Mcl-1 through hydrophobic contacts occurring principally in Mcl-1 P2 pocket and through a π-stacking of its phenol ring with Phe270 (Figure 11C and D). In pose 1, Torsemide interacted with Leu235 and Leu267 while in pose2 the hydrophobic contacts were more numerous (Phe228, Val253, Phe254, Asp256, Thr266 and Leu267). The Val253, Phe270, Leu267, residues forming P2 pocket, were identified as strongly perturbed in NMR analysis. No H-bond was detected between Torsemide and Mcl-1 in both poses, corroborating the experimentally observed weak affinity of Torsemide.
In selected Deferasirox pose1 (Figure 11A), the one phenol ring of Deferasirox was placed in the Mcl-1 P2 pocket, in agreement with NMR observations, while the benzoate anion was oriented towards Arg263, one of the residues detected as strong perturbed during the NMR experience. Deferasirox interacted with the Arg263 via π-cation interaction between the guanidinium group and the phenol ring, and an H-bond with the triazole nitrogen ring. Stabilizing hydrophobic contacts were also formed with Val253, Phe254 and Leu267. Val 253 and Leu 267 were also strongly perturbed in NMR study.
Concerning the second binding mode (pose2 – Figure 11B), it was the other phenol ring that was positioned in the Mcl-1 P2 pocket and the benzoate anion was returned to the opposite site of the Mcl-1 binding groove, towards Lys234, another residue revealed as strong perturbed in NMR study. Deferasirox established a salt bridge with Lys234, an H-bond with Arg263 and a π-π stacking interaction with Phe270. Hydrophobic contacts were made with Val253.
Binding modes extracted from molecular docking are suitable to establish the first guess, but the dynamical nature and stability of the noncovalent interactions are not considered. Hence, we complemented our analysis by including the dynamical nature of the noncovalent interactions during the MD simulations. As shown in Figure 12 the primarily predicted interactions varied during the MD simulations.
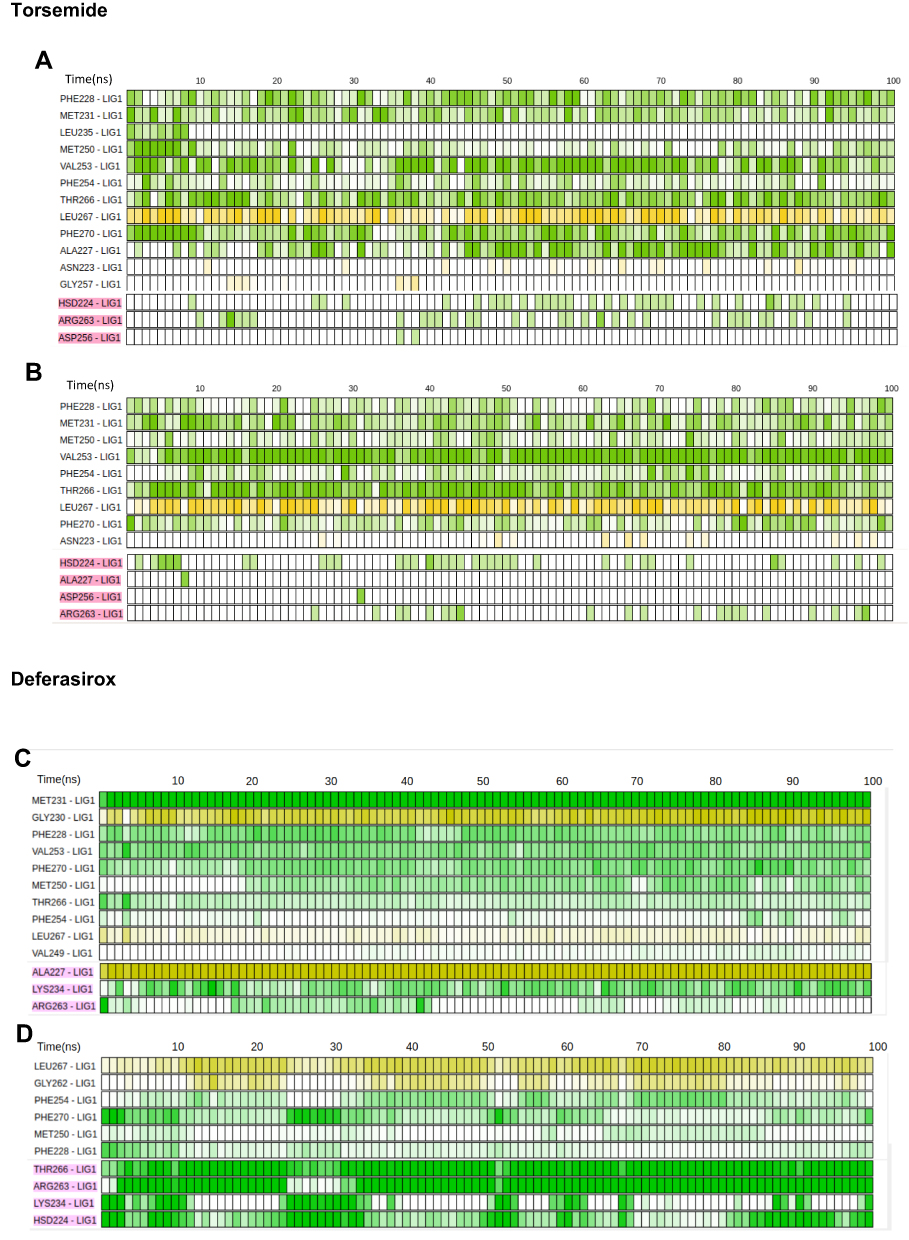 |
Figure 12 Key interacting residues (sorted using the mean lifetime of the interaction) and dynamical evolution of noncovalent interactions for MD simulation of pose 1 (A) and pose 2 (B) of Torsemide and pose 1 (C) and pose 2 (D) of Deferasirox complexes. Each cell accounts for 1ns; yellow cell indicates an interaction through the protein’s backbone; green cell indicates an interaction through the sidechain. A color gradient was used in order to account for the interaction distance. Hydrogen bonds and electrostatic interactions are colored in pink. |
During the dynamics of Torsemide pose1 and pose2, the Torsemide remained fixed by its phenol ring in the Mcl-1 P2 pocket, its aliphatic chain was very flexible and at the same time came close to Arg263 or His224 to form an H-bond. However, it failed to establish a stable interaction with Mcl-1 along the dynamics (Figure 12A and B). To be able to establish electrostatic interactions with Arg263 or His224 Torsemide must come out of the cavity and hydrophobic contacts with P2 pocket decreased (Figure S4 and Supplementary Video 1). 12 residues-maintained hydrophobic contacts with Torsemide in pose1 during the simulation and the main contributing residues were Val 253, Thr266, Leu267 (main chain) and Phe270. For pose 2 binding mode, 9 residues maintained the contact with Torsemide and the main contributing residues were Val253, Thr266 and Leu267 (main chain). As the Torsemide aliphatic chain did not establish a stable H-bond interaction, the detected electrostatic contacts were punctual. Our dynamic study therefore suggests that Torsemide is able to simultaneously establish the H-bond interaction with Arg263 (or other charged residue) and fully occupy the P2 pocket, which can explain its weak affinity (Figure 13A). The main anchoring point of Torsemide in Mcl-1 is the P2 pocket according to the modelling results, which is in agreement with NMR observations. The P2 pocket residues were observed mostly among most perturbed residues highlighted by NMR. Then, a propagation effect could explain the detected perturbation of residues in P2 pocket vicinity and that of Arg263. The simulations suggest that the observed perturbation of P1 pocket residues (Leu232, Leu235 and Lys238) is related to fluctuation of α3-α4 loop then the direct Torsemide binding effect.
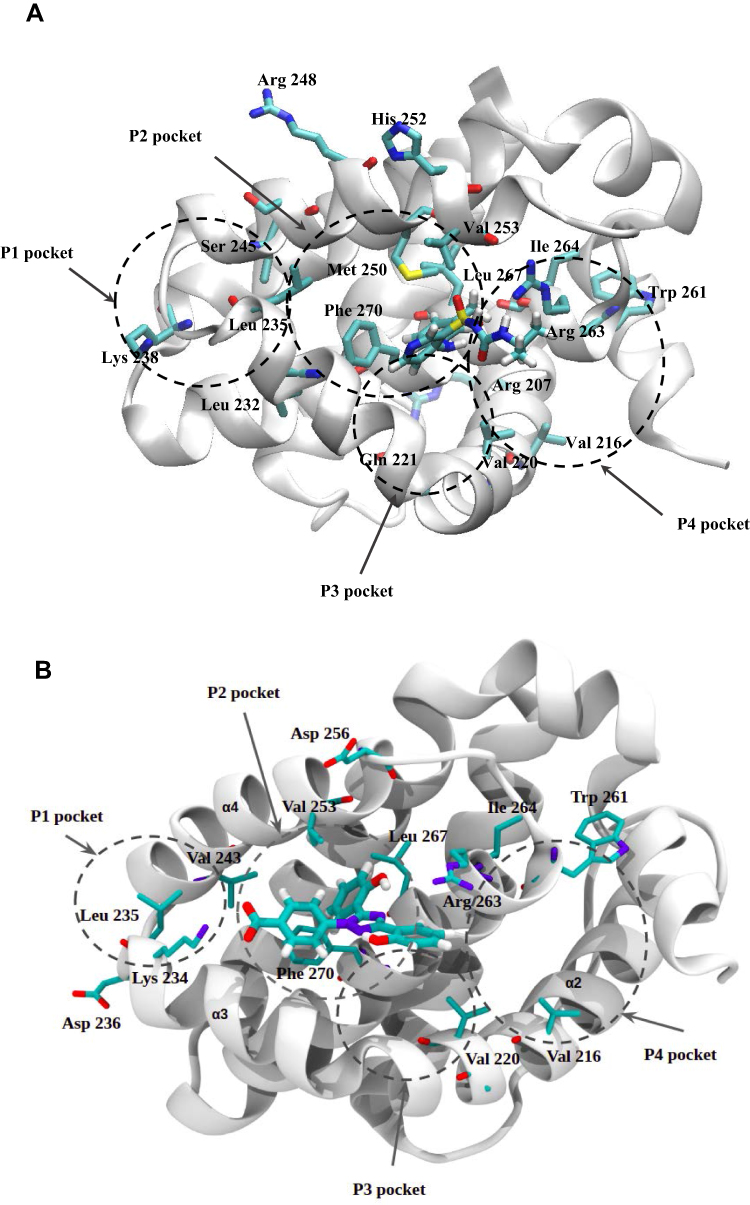 |
Figure 13 (A) Torsemide-Mcl-1 binding mode (end of pose 1 simulation). (B) Deferasirox-Mcl-1 binding mode (end of the pose 2 simulation). Mcl-1 perturbed residues by Torsemide and Deferasirox from NMR study are shown in licorice representation (residue CCSP > 0.10 ppm). |
Moreover, the NMR data suggested an interaction with Gly219, Val220 and Val216, part of the P4 pocket, for both ligands. This observation was also highlighted from similar NMR data reported by Mady et al,68 for a set of Mcl-1 inhibitors. These interactions at the P4 pocket might rise from a non-direct effect due to the presence of aromatic rings (ring-current effect) as we have previously discussed for Pyridoclax36 for instance. Another explanation might be derived from two steps binding process: the ligands form a pre-encounter complex at the P4 pocket (Val216 and Gly219) in the first place and shift afterwards to the P2/P3 pocket interface as a second step. This two-step binding process was proposed for Bcl-xL (another anti-apoptotic protein) and reported by the work of Krishnamoorthy et al,69 using NMR chemical shift data and J-Surface mapping.
For pose 1 the Deferasirox turned on itself at the beginning of the dynamics bringing the carboxylate group towards Lys234 (Figure S5 and Supplementary Video 2). 13 residues-maintained contacts with Deferasirox during the MD simulation (Figure 12C and D). Among them, the main contributing residues to the interaction with Deferasirox were Met231 and Gly230 (backbone), Phe228, Val253 through hydrophobic contacts. Hydrogen bonds with Arg263, Lys234 side chains, as well as an electrostatic interaction with Ala227 (backbone) were noticed.
For pose 2 binding mode, the Deferasirox oscillated around the pose from docking during the MD simulation and 10 residues maintained the contact with it. The residues: Leu267 (backbone), Gly262 (backbone), Phe254, Phe270 established hydrophobic contacts, while Thr266, His224, Arg263 and Lys234 side chains established hydrogen bonds.
Interestingly, the presence of an intramolecular H-bond in Deferasirox has been preserved along both dynamics (Figure S6). The contacts established by Deferasirox were more preserved and stronger along the dynamics compared to Torsemide (Figure 12). The Deferasirox electrostatic interactions were more important in agreement with its observed higher affinity.
A more detailed description of Deferasirox dynamics with Mcl-1 is provided in Supplementary Video 2. Overall, Deferasirox interacts with Mcl-1’s binding groove by establishing contacts with P2 and P3 pockets (Figure 13B). The most interacting residues in pose 2 MD simulation are in an overall good agreement with the most perturbed residues determined by NMR chemical shifts.
Combining the MD simulations and NMR chemical shifts, we propose the following binding mode for Deferasirox with Mcl-1 protein (Figure 13B). As discussed above, Deferasirox interacts directly with the P2/P3 pockets establishing noncovalent interactions (hydrophobic interactions). The observed perturbation of P1 pocket residues (Leu235 and Asp236) is due to the interaction with the Lys234 through a salt bridge (propagation effect). Finally, the perturbation of Val220 and Val216 residues, part of the P4 pocket could be due to either the well-known ring-current effect for aromatic rings (mediated by the presence of the aromatic ring nearby the P4 pocket) or a result of two steps binding mechanism, not highlighted for moment in the docking.
Conclusion
In this study, the interaction between Mcl-1 and five drugs already used for other therapeutic indications and highlighted in literature as potential Mcl-1 inhibitor (Oxcarbazepine, Deferasirox, Risperidone, Lenalidomide and Torsemide) were experimentally characterized by NMR.
NMR analysis showed that only two of the five tested molecules, Torsemide and Deferasirox, interact with Mcl-1. The interaction sites evidenced by NMR for these two drugs are mainly centered on around the P2 hydrophobic pocket, Deferasirox showing a stronger affinity for Mcl-1 (KD~300µM) than Torsemide (KD~1mM).
Biological assays confirmed that Deferasirox was able to inhibit Mcl-1 efficiently and selectively in a dose and time-dependent manner with optimal dose of 25µM for a 48 h exposure treatment. The biological activity of Torsemide was lower as compared to the Deferasirox one since a 50 µM concentration was required to observe similar effects.
FPA competition assays confirmed that Deferasirox was able to disrupt interactions between Mcl-1 with Bid, a pro-apoptotic partner of Mcl-1. An inhibition close to 60% (at 600 µM) was observed and IC50 and Ki values of 368 ± 45 µM and 83 ± 10 μM, respectively, were obtained for Deferasirox. A weaker inhibition close to 20% (at 600 µM) was observed with Torsemide.
Finally, combining the MD simulations and NMR chemical shift perturbation analysis, we proposed a binding mode for Deferasirox with Mcl-1 protein. Deferasirox interacts directly with the P2/P3 pockets, as well as almost all synthetic Mcl-1 inhibitors, establishing noncovalent hydrophobic interactions. However, contrary to most synthetic Mcl-1 inhibitors, Deferasirox interacts through a salt bridge with Lys234 and not with Arg263. The Torsemide binds to P2 pocket and our simulations suggest that it is able to simultaneously interact with P2 pocket and form an H-bond with Arg263. It oscillates between these two binding spots.
In conclusion, this work evidenced the complementarity of computational and experimental approaches in drug repositioning. Combining both approaches, we showed that Deferasirox could be a potential candidate for drug repositioning as Mcl-1 inhibitor.
Acknowledgments
This work has been partially supported by Normandie Université (NU), the Région Normandie, the Centre National de la Recherche Scientifique (CNRS), Université de Rouen Normandie (URN), INSA Rouen Normandie, Labex SynOrg (ANR-11-LABX-0029), Innovation Chimie Carnot (I2C). Part of this work was performed using computing resources of CRIANN (Normandy, France) as well as the European Community (FEDER) for the molecular modeling software.
We thank Christophe Denoyelle and Emilie Brotin from ImpedanCELL platform for real-time imaging experiments. The IncuCyte S3 device was acquired thanks to the support of the French State and the ‘Normandy County Council’ (Contrat de Plan Etat Région - CPER INNOVONS). This work was also supported by the “Conseil Régional de Basse Normandie” and European Union (The ONCOTHERA European project “Normandy Network for innovative therapeutics in oncology” which is co-funded by the Normandy County Council, the European Union within the framework of the Operational Programme ERDF/ESF 2014-2020), by the French State (CPER Innovons 2), the University of Caen Normandie and Inserm. HP is a recipient of a doctoral fellowship from the French Ministry for Higher Education and Research.
Author Contributions
ABA, ASVC, MS and HO conceived the studies; ABA and MS performed NMR studies; DR and LC have carried out the production and purification of the labeled Mcl-1172−327 domain; HP, LW and LP have carried out bioassays; MJ carried out FPA experiments; MB, GC and JSO performed docking and dynamics simulations; ABA, JSO, and MS wrote the article with corrections from all co-authors. So, all authors made substantial contributions to conception and design, acquisition of data, or analysis and interpretation of data; took part in drafting the article or revising it critically for important intellectual content; agreed to submit to the current journal; gave final approval of the version to be published; and agree to be accountable for all aspects of the work.
Disclosure
The authors report no conflicts of interest in this work.
References
1. Ciociola AA, Cohen LB, Kulkarni P, et al. How drugs are developed and approved by the FDA: current process and future directions. Am J Gastroenterol. 2014;109(5):620–623. doi:10.1038/ajg.2013.407
2. Ashburn TT, Thor KB. Drug repositioning: identifying and developing new uses for existing drugs. Nat Rev Drug Discov. 2004;3(8):673–683. doi:10.1038/nrd1468
3. Oprea TI, Bauman JE, Bologa CG, et al. Drug repurposing from an academic perspective. Drug Discov Today Ther Strateg. 2011;8(3–4):61–69. doi:10.1016/j.ddstr.2011.10.002
4. Langedijk J, Mantel-Teeuwisse AK, Slijkerman DS, Schutjens M-HDB. Drug repositioning and repurposing: terminology and definitions in literature. Drug Discov Today. 2015;20(8):1027–1034. doi:10.1016/j.drudis.2015.05.001
5. Pushpakom S, Iorio F, Eyers PA, et al. Drug repurposing: progress, challenges and recommendations. Nat Rev Drug Discov. 2019;18(1):41–58. doi:10.1038/nrd.2018.168
6. Hurle MR, Yang L, Xie Q, Rajpal DK, Sanseau P, Agarwal P. Computational drug repositioning: from data to therapeutics. Clin Pharmacol Ther. 2013;93(4):335–341. doi:10.1038/clpt.2013.1
7. Shim JS, Liu JO. Recent advances in drug repositioning for the discovery of new anticancer drugs. Int J of Biol Sci. 2014;10(7):654–663. doi:10.7150/ijbs.9224
8. Luo H, Li M, Yang M, Wu F-X, Li Y, Wang J. Biomedical data and computational models for drug repositioning: a comprehensive review. Brief Bioinform. 2021;22(2):1604–1619. doi:10.1093/bib/bbz176
9. Hernandez JJ, Pryszlak M, Smith L, et al. Giving drugs a second chance: overcoming regulatory and financial hurdles in repurposing approved drugs as cancer therapeutics. Front Oncol. 2017;7:273. doi:10.3389/fonc.2017.00273
10. Glantz-Gashai Y, Meirson T, Reuveni E, Samson AO. Virtual screening for potential inhibitors of Mcl-1 conformations sampled by normal modes, molecular dynamics, and nuclear magnetic resonance. Drug Des Devel Ther. 2017;11:1803–1813. doi:10.2147/DDDT.S133127
11. Gelinas C, White E. BH3-only proteins in control: specificity regulates MCL-1 and BAK-mediated apoptosis. Genes Dev. 2005;19(11):1263–1268. doi:10.1101/gad.1326205
12. Shore GC, Warr MR. Unique biology of Mcl-1: therapeutic opportunities in cancer. Curr Mol Med. 2008;8(2):138–147. doi:10.2174/156652408783769580
13. Beroukhim R, Mermel CH, Porter D, et al. The landscape of somatic copy-number alteration across human cancers. Nature. 2010;463(7283):899–905. doi:10.1038/nature08822
14. Beekman AM, Howell LA. Small-molecule and peptide inhibitors of the pro-survival protein Mcl-1. ChemMedChem. 2015;11(8):802–813. doi:10.1002/cmdc.201500497
15. Belmar J, Fesik SW. Small molecule Mcl-1 inhibitors for the treatment of cancer. Pharmacol Ther. 2015;145:76–84. doi:10.1016/j.pharmthera.2014.08.003
16. Abid M, Sonawane YA, Contreras JI, Rana S, Natarajan A. Recent advances in cancer drug development: targeting induced myeloid cell leukemia-1 (Mcl-1) differentiation protein. Curr Med Chem. 2017;24(40):4488–4514. doi:10.2174/0929867324666170912092659
17. Ashkenazi A, Fairbrother WJ, Leverson JD, Souers AJ. From basic apoptosis discoveries to advanced selective BCL-2 family inhibitors. Nat Rev Drug Discov. 2017;16(4):273–284. doi:10.1038/nrd.2016.253
18. Wan Y, Dai N, Tang Z, Fang H. Small-molecule Mcl-1 inhibitors: emerging anti-tumor agents. Eur J Med Chem. 2018;146:471–482. doi:10.1016/j.ejmech.2018.01.076
19. Hird AW, Tron AE. Recent advances in the development of Mcl-1 inhibitors for cancer therapy. Pharmacol Ther. 2019;198:59–67. doi:10.1016/j.pharmthera.2019.02.007
20. Senichkin VV, Streletskaia AY, Gorbunova AS, Zhivotovsky B, Kopeina GS. Saga of Mcl-1: regulation from transcription to degradation. Cell Death Differ. 2020;27(2):405–419. doi:10.1038/s41418-019-0486-3
21. Rasmussen ML, Taneja N, Neininger AC, et al. MCL-1 inhibition by selective BH3 mimetics disrupts mitochondrial dynamics causing loss of viability and functionality of human cardiomyocytes. iScience. 2020;23(4):101015. doi:10.1016/j.isci.2020.101015
22. Ball S, Borthakur G. Apoptosis targeted therapies in acute myeloid leukemia: an update. Expert Rev Hematol. 2020;13(12):1373–1386. doi:10.1080/17474086.2020.1852923
23. Wood KC. Overcoming MCL-1-driven adaptive resistance to targeted therapies. Nat Commun. 2020;11(1):531. doi:10.1038/s41467-020-14392-z
24. Wishart DS, Knox C, Guo AC, et al. DrugBank: a knowledgebase for drugs, drug actions and drug targets. Nucleic Acids Res. 2008;36(suppl 1):D901–D906. doi:10.1093/nar/gkm958
25. Yang LPH, Keam SJ, Keating GM. Deferasirox: a review of its use in the management of transfusional chronic iron overload. Drugs. 2007;67(15):2211–2230. doi:10.2165/00003495-200767150-00007
26. Kamihara Y, Takada K, Sato T, et al. The iron chelator deferasirox induces apoptosis by targeting oncogenic Pyk2/β-catenin signaling in human multiple myeloma. Oncotarget. 2016;7:39. doi:10.18632/oncotarget.11830
27. Möller HJ. Risperidone: a review. Expert Opin on Pharmacother. 2005;6(5):803–818. doi:10.1517/14656566.6.5.803
28. Degterev A, Lugovskoy A, Cardone M, et al. Identification of small-molecule inhibitors of interaction between the BH3 domain and Bcl-xL. Nat Cell Biol. 2001;3(2):173–182. doi:10.1038/35055085
29. Maier SK, Hammond JM. Role of lenalidomide in the treatment of multiple myeloma and myelodysplastic syndrome. Ann Pharmacother. 2006;40(2):286–289. doi:10.1345/aph.1G170
30. Mark TM, Bowman IA, Rossi AC, et al. Thalidomide, clarithromycin, lenalidomide and dexamethasone therapy in newly diagnosed, symptomatic multiple myeloma. Leuk Lymphoma. 2014;55(12):2842–2849. doi:10.3109/10428194.2014.896005
31. Friedel HA, Buckley MM-T. Torasemide: a review of its pharmacological properties and therapeutic potential. Drugs. 1991;41(1):81–103. doi:10.2165/00003495-199141010-00008
32. van Delft MF, Wei AH, Mason KD, et al. The BH3 mimetic ABT-737 targets selective Bcl-2 proteins and efficiently induces apoptosis via Bak/Bax if Mcl-1 is neutralized. Cancer Cell. 2006;10(5):389–399. doi:10.1016/j.ccr.2006.08.027
33. Meyer B, Peters T. NMR spectroscopy techniques for screening and identifying ligand binding to protein receptors. Angew Chem Int Ed Engl. 2003;42(8):864–890. doi:10.1002/anie.200390233
34. Cala O, Guillière F, Krimm I. NMR-based analysis of protein–ligand interactions. Anal Bioanal Chem. 2014;406(4):943–956. doi:10.1007/s00216-013-6931-0
35. Orts J, Gossert AD. Structure determination of protein-ligand complexes by NMR in solution. Methods. 2018;138–139:3–25. doi:10.1016/j.ymeth.2018.01.019
36. Bourafai-Aziez A, Sebban M, Benabderrahmane M, et al. Binding mode of Pyridoclax to myeloid cell leukemia-1 (Mcl-1) revealed by nuclear magnetic resonance spectroscopy, docking and molecular dynamics approaches. J Biomol Struct Dyn. 2020;38(14):4162–4178. doi:10.1080/07391102.2019.1680434
37. Mori S, Abeygunawardana C, Johnson MO, Vanzijl PCM. Improved sensitivity of HSQC spectra of exchanging protons at short interscan delays using a new fast HSQC (FHSQC) detection scheme that avoids water saturation. J Magn Reson B. 1995;108(1):94–98. doi:10.1006/jmrb.1995.1109
38. Marion D, Wüthrich K. Application of phase sensitive two-dimensional correlated spectroscopy (COSY) for measurements of 1H-1H spin-spin coupling constants in proteins. Biochem Biophys Res Commun. 1983;113(3):967–974. doi:10.1016/0006-291X(83)91093-8
39. Lee W, Tonelli M, Markley JL. NMRFAM-SPARKY: enhanced software for biomolecular NMR spectroscopy. Bioinformatics. 2015;31(8):1325–1327. doi:10.1093/bioinformatics/btu830
40. Skinner SP, Fogh RH, Boucher W, Ragan TJ, Mureddu LG, Vuister GW. CcpNmr AnalysisAssign: a flexible platform for integrated NMR analysis. J Biomol NMR. 2016;66(2):111–124. doi:10.1007/s10858-016-0060-y
41. Waudby CA, Ramos A, Cabrita LD, Christodoulou J. Two-dimensional NMR lineshape analysis. Sci Rep. 2016;6:24826. doi:10.1038/srep24826
42. Williamson MP. Using chemical shift perturbation to characterise ligand binding. Prog Nucl Magn Reson Spectrosc. 2013;73:1–16. doi:10.1016/j.pnmrs.2013.02.001
43. Poulain L, Lincet H, Duigou F, et al. Acquisition of chemoresistance in a human ovarian carcinoma cell is linked to a defect in cell cycle control. Int J Cancer. 1998;78(4):454–463. doi:10.1002/(sici)1097-0215(19981109)78:4<454::aid-ijc11>3.0.co;2-6
44. Nikolovska-Coleska Z, Wang R, Fang X, et al. Development and optimization of a binding assay for the XIAP BIR3 domain using fluorescence polarization. Anal Biochem. 2004;332:261. doi:10.1016/j.ab.2004.05.055
45. Tanaka Y, Aikawa K, Nishida G, et al. Discovery of potent Mcl-1/Bcl-xL dual inhibitors by using a hybridization strategy based on structural analysis of target proteins. J Med Chem. 2013;56(23):9635–9645. doi:10.1021/jm401170c
46. Sastry GM, Adzhigirey M, Day T, Annabhimoju R, Sherman W. Protein and ligand preparation: parameters, protocols, and influence on virtual screening enrichments. J Comput Aided Mol Des. 2013;27(3):221–234. doi:10.1007/s10822-013-9644-8
47. Fun H-K, Chantrapromma S, Dayananda AS, Yathirajan HS, Thomas S. 4-[3,5-Bis(2-hy-droxy-phen-yl)-1H-1,2,4-triazol-1-yl]benzoic acid dimethyl-formamide monosolvate. Acta Crystallogr Sect E Struct Rep Online. 2012;68(Pt 3):o792–o793. doi:10.1107/S1600536812005806
48. Groom CR, Bruno IJ, Lightfoot MP, Ward SC. The Cambridge structural database. Acta Cryst B. 2016;72(2):171–179. doi:10.1107/S2052520616003954
49. Gutman A, Etinger M, Goldring D, Pertzikov B, Nisnevich G. CCDC 795036: experimental crystal structure determination; 2011.
50. Grosdidier A, Zoete V, Michielin O. Fast docking using the CHARMM force field with EADock DSS. J Comput Chem. 2011;32(10):2149–2159. doi:10.1002/jcc.21797
51. Grosdidier A, Zoete V, Michielin O. SwissDock, a protein-small molecule docking web service based on EADock DSS. Nucleic Acids Res. 2011;39:W270–W277. doi:10.1093/nar/gkr366
52. Zoete V, Grosdidier A, Cuendet M, Michielin O. Use of the FACTS solvation model for protein-ligand docking calculations. Application to EADock. J Mol Recognit. 2010;23(5):457–461. doi:10.1002/jmr.1012
53. Phillips JC, Braun R, Wang W, et al. Scalable molecular dynamics with NAMD. J Comput Chem. 2005;26(16):1781–1802. doi:10.1002/jcc.20289
54. Huang J, MacKerell AD. CHARMM36 all-atom additive protein force field: validation based on comparison to NMR data. J Comput Chem. 2013;34(25):2135–2145. doi:10.1002/jcc.23354
55. Huang J, Rauscher S, Nawrocki G, et al. CHARMM36m: an improved force field for folded and intrinsically disordered proteins. Nat Methods. 2017;14(1):71–73. doi:10.1038/nmeth.4067
56. Vanommeslaeghe K, Hatcher E, Acharya C, et al. CHARMM general force field: a force field for drug-like molecules compatible with the CHARMM all-atom additive biological force fields. J Comput Chem. 2009;31(4):671–690. doi:10.1002/jcc.21367
57. Lee J, Cheng X, Swails JM, et al. CHARMM-GUI input generator for NAMD, GROMACS, AMBER, OpenMM, and CHARMM/OpenMM simulations using the CHARMM36 additive force field. J Chem Theory Comput. 2016;12(1):405–413. doi:10.1021/acs.jctc.5b00935
58. Jorgensen WL, Jenson C. Temperature dependence of TIP3P, SPC, and TIP4P water from NPT Monte Carlo simulations: seeking temperatures of maximum density. J Comput Chem. 1998;19(10):1179–1186. doi:10.1002/(SICI)1096-987X(19980730)19:10<1179::AID-JCC6>3.0.CO;2-J
59. Darden T, York D, Pedersen L. Particle mesh Ewald: an N ⋅log(N) method for Ewald sums in large systems. J Chem Phys. 1993;98(12):10089–10092. doi:10.1063/1.464397
60. Humphrey W, Dalke A, Schulten K. VMD: visual molecular dynamics. J Mol Graph. 1996;14(1):
61. Scheurer M, Rodenkirch P, Siggel M, et al. PyContact: rapid, customizable, and visual analysis of noncovalent interactions in MD simulations. Biophys J. 2018;114(3):577–583. doi:10.1016/j.bpj.2017.12.003
62. Liu G, Poppe L, Aoki K, Yamane H, Lewis J, Szyperski T. High-quality NMR structure of human anti-apoptotic protein domain Mcl-1(171–327) for cancer drug design. PLoS One. 2014;9(5):e96521. doi:10.1371/journal.pone.0096521
63. Bissantz C, Folkers G, Rognan D. Protein-based virtual screening of chemical databases. 1. evaluation of different docking/scoring combinations. J Med Chem. 2000;43(25):4759–4767. doi:10.1021/jm001044l
64. Benabderrahmane M, Bureau R, Voisin-Chiret AS, Sopkova-de Oliveira Santos J. Insights into Mcl-1 conformational states and allosteric inhibition mechanism from molecular dynamics simulations, enhanced sampling, and pocket crosstalk analysis. J Chem Inf Model. 2020;60(6):3172–3187. doi:10.1021/acs.jcim.0c00315
65. Brotin E, Meryet-Figuière M, Simonin K, et al. Bcl-x L and MCL-1 constitute pertinent targets in ovarian carcinoma and their concomitant inhibition is sufficient to induce apoptosis. Int J Cancer. 2010;126(4):885–895. doi:10.1002/ijc.24787
66. Steinhauser S, Heinz U, Bartholomä M, Weyhermüller T, Nick H, Hegetschweiler K. Complex formation of ICL670 and related ligands with Fe III and Fe II: complex formation of ICL670 and related ligands with Fe III and Fe II. Eur J of Inorg Chem. 2004;2004(21):4177–4192. doi:10.1002/ejic.200400363
67. Zhang Y, Yang H, Ma H, et al. Excitation wavelength dependent fluorescence of an ESIPT triazole derivative for amine sensing and anti‐counterfeiting applications. Angew Chem Int Ed Engl. 2019;58(26):8773–8778. doi:10.1002/anie.201902890
68. Mady ASA, Liao C, Bajwa N, et al. Discovery of Mcl-1 inhibitors from integrated high throughput and virtual screening. Sci Rep. 2018;8(1):10210. doi:10.1038/s41598-018-27899-9
69. Krishnamoorthy J, Yu VCK, Mok Y-K. Auto-FACE: an NMR based binding site mapping program for fast chemical exchange protein-ligand systems. PLoS One. 2010;5(2):e8943. doi:10.1371/journal.pone.0008943
 © 2021 The Author(s). This work is published and licensed by Dove Medical Press Limited. The
full terms of this license are available at https://www.dovepress.com/terms.php
and incorporate the Creative Commons Attribution
- Non Commercial (unported, v3.0) License.
By accessing the work you hereby accept the Terms. Non-commercial uses of the work are permitted
without any further permission from Dove Medical Press Limited, provided the work is properly
attributed. For permission for commercial use of this work, please see paragraphs 4.2 and 5 of our Terms.
© 2021 The Author(s). This work is published and licensed by Dove Medical Press Limited. The
full terms of this license are available at https://www.dovepress.com/terms.php
and incorporate the Creative Commons Attribution
- Non Commercial (unported, v3.0) License.
By accessing the work you hereby accept the Terms. Non-commercial uses of the work are permitted
without any further permission from Dove Medical Press Limited, provided the work is properly
attributed. For permission for commercial use of this work, please see paragraphs 4.2 and 5 of our Terms.