Back to Journals » Risk Management and Healthcare Policy » Volume 16
Drivers of Individual and Regional Variation in CMS Hierarchical Condition Categories Among Florida Beneficiaries
Authors Jacobs M, Morris E, Haleem Z, Mandato N ![]() , Marlow NM, Revere L
, Marlow NM, Revere L ![]()
Received 4 January 2023
Accepted for publication 31 May 2023
Published 10 June 2023 Volume 2023:16 Pages 1011—1022
DOI https://doi.org/10.2147/RMHP.S401474
Checked for plagiarism Yes
Review by Single anonymous peer review
Peer reviewer comments 3
Editor who approved publication: Dr Jongwha Chang
Molly Jacobs,1 Earl Morris,2 Zuhair Haleem,1 Nicholas Mandato,3 Nicole M Marlow,1 Lee Revere1
1Department of Health Services Research Management and Policy, University of Florida, Gainesville, FL, USA; 2Department of Pharmaceutical Outcomes and Policy, University of Florida, Gainesville, FL, USA; 3Department of Biology, University of Florida, Gainesville, FL, USA
Correspondence: Lee Revere, Email [email protected]
Objective: To explore hierarchical condition categories (HCC) risk score variation among Florida Fee for Service (FFS) Medicare beneficiaries between 2016 and 2018.
Data Sources: This study analyzed HCC risk score variation using Medicare claims data for Florida beneficiaries enrolled in Parts A & B between 2016 and 2018.
Study Design: The CMS methodology analyzed HCC risk score variation using annual mean county- and beneficiary-level risk score changes. The association between variation and beneficiary characteristics, diagnoses, and geographic location was characterized using mixed-effects negative binomial regression models.
Data Collection: Not applicable.
Principal Findings: Counties in the Northeast [marginal effect (ME)=− 0.003], Central (ME=− 0.021), and Southwest (ME=− 0.009) Florida have relatively lower mean risk scores. A higher number of lifetime (ME=0.246) and treatable (ME=0.288) conditions were associated with higher county-level risk scores, while more preventable conditions (ME=− 0.249) were associated with lower risk scores. Counties with older beneficiaries (ME=0.015) and more Blacks (ME=0.070) have higher risk scores, while having female beneficiaries reduced risk scores (ME=− 0.005). Individual risk scores did not vary by age (ME=0.000), but Blacks (ME=0.001) had higher rates of variation relative to Whites, while other races had comparatively lower variation (ME=− 0.003). In addition, individuals diagnosed with more lifetime (ME=0.129), treatable (ME=0.235), and preventable (ME=0.001) conditions had higher risk score variation. Most condition-specific indicators showed small associations with risk score changes; however, metastatic cancer/acute leukemia, respirator dependence/tracheostomy, and pressure ulcers of the skin were significantly associated with both types of HCC risk score variation.
Conclusion: Results showed demographics, HCC condition classifications (ie, lifetime, preventable, and treatable), and some specific conditions were associated with higher variation in mean county-level and individual risk scores. Results suggest consistent coding and reductions in the prevalence of certain treatable or preventable conditions could reduce the county and individual HCC risk score year-to-year change.
Keywords: risk score, hierarchical condition category, HCC, medical coding
Plain Language Summary
What is Known on this Topic
- HCC risk scores have financial implications for risk-based and value-based contracting.
- HCC risk scores depend highly on provider coding and beneficiary access to care.
What This Study Adds
- Significant variation exists in annual HCC risk scores at the county and individual beneficiary levels.
- Demographic characteristics influence county-level and individual risk scores.
Introduction
Hierarchical Condition Categories (HCCs) are used by the Centers for Medicare and Medicaid Services (CMS) as part of a risk-adjustment model that identifies individuals with severe acute or chronic conditions and assigns them a corresponding risk score.1 The CMS HCC-based risk adjustment is prospective, whereby diagnoses in one year are used to predict costs in the subsequent year. The statistical model accounts for age, sex, Medicaid eligibility, and diagnoses. Diagnoses are grouped into condition categories based on similarity in predicted costs and clinical relationships. Hierarchies are applied to the condition categories, and the most severe and costly category is used in the risk adjustment.2 Thus, the eighty-six HCC codes represent chronic health and severe acute conditions with similar clinical complexity and expected annual care costs.3 The most prevalent HCCs include major depressive and bipolar disorders, asthma and pulmonary disease, diabetes, heart arrhythmias, congestive heart failure, breast and prostate cancer, and rheumatoid arthritis.4 Each HCC-based risk score estimates a beneficiary’s expected costs relative to the mean beneficiary; a risk score of 1.0 reflects the expected Medicare-incurred expenditures for a beneficiary. Beneficiaries would be considered less healthy and, therefore, more costly, with a risk score greater than 1.0. CMS HCC risk scores can range from 0 to 20; the values in our study were between 0.28 and 16.93.1 Prior research explored the limitations of the HCC risk score, including the model’s reliance on provider coding,5–9 low predictability of actual expenditures,10–14 and susceptibility to increasing overall CMS cost if beneficiaries join Medicare Advantage (MA) plans.15–17
Studies note that significant variation exists in HCC risk scores at the individual and regional levels.18,19 However, research has shown that they remain relatively stable over time at the national level. For example, Sorace et al noted that while many beneficiaries had multiple diagnoses making them more costly and riskier, these diagnoses’ combinations remained relatively stable between 2007 and 2009.20 However, this aggregate stability in risk scores over time does not imply that individual conditions or condition categories do not vary. For example, Mu et al showed that among beneficiaries with end-stage renal disease (ESRD), the Western region of the US had the lowest score between 2006 and 2009, and the HCC score fell annually in every region.21 Conversely, between 2012 and 2017, the average HCC risk score of beneficiaries with a psychiatric condition increased substantially.22 Failure to accurately document the type and severity of conditions leads to coding irregularities, negatively impacting providers engaged in CMS value-based payment models.6,9,23,24 Although the linkage between HCC risk score and providers’ reimbursement rates incentivizes coding accuracy, this evidence suggests that providers and regions suffer from coding variations.
This study explores HCC risk score variation among Florida FFS Medicare beneficiaries between 2016 and 2018 with a focus on the individual beneficiary (ie, changes in the risk score for the same individual across years) and county-level (ie, county-level mean risk score in each year) variation. The relationship between HCC risk score variation and geographic location, demographics, and documented HCCs are explored to elucidate changes in health conditions at the individual and county level while controlling for demographic attributes. First, we evaluate stability in the mean HCC risk score for individuals and clustered counties (regions). Second, we test how the HCC risk score variation is associated with diagnosed treatable, preventable, or lifetime conditions across counties and by individuals. Results highlight irregular risk scores and may inform providers and insurers seeking to maintain beneficiary health and manage expected costs.
Methods
Data
Our sample consists of 876,872 aged Florida Medicare beneficiaries continuously enrolled in Parts A and B from 2016 to 2018. This time period was selected because the data were readily available through the author’s institution at the time of this research. Access to Medicare claims data was provided by the University of Florida (UF.) Center for Drug Evaluation and Safety (CoDES) and distributed through the Research Data Assistance Center (ResDAC). Use of CMS data is guided by Medicare Data Use Agreements (DUA) and cannot be replicated or distributed externally. These data included 100% of Medicare inpatient, skilled care nursing facility, and hospice care claims (Part A), outpatient care (Part B), and prescription drugs claims (Part D) for the state of Florida. This study focused on FFS claims generated between 2016 and 2018, totaling >8 million lives, which contain care-related elements such as admission and discharge dates, diagnosis and procedure codes, source of care, date of death, and basic individual characteristics. Since beneficiaries classified as dual eligible, disabled, or end-stage renal disease utilize a different HCC scoring mechanism, this analysis was limited to only those categorized as aged. All analysis was conducted under the supervision of the University of Florida Institutional Review Board and adhered to the privacy and security standards thereof.
Covariate Construction
Medicare claims contain demographic information, which was used to create individual-level covariates. Individual age was calculated using birth and included as a discrete indicator. Sex was included as a binary indicator assuming a value of one if female and zero otherwise. Due to inconsistent racial and ethnic identification, detailed disaggregation was impossible. Therefore, the analysis utilized three categories–White, Black, and Other–where Other includes Asian, Native American, and Multiracial groups. While we would have preferred to disaggregate Other into specific groupings, the Office of the Inspector General cautions users that CMS race and ethnicity data are less accurate for some groups, particularly for beneficiaries identified as American Indian/Alaska Native, Asian/Pacific Islander, or Hispanic which limits the robustness and validity of the analysis.25 Furthermore, Medicare’s enrollment data on race and ethnicity are inconsistent with Federal data collection standards, which limits generalizability with other federally collected measures.
Finally, beneficiaries were clustered into regions—Northwest, Northeast, Central, Southwest, and Southeast—based on their county of residence. County-level and individual analyses were conducted to account for geographic homogeneity within counties.26,27 Studies have shown significant spatial clustering in demographic, income, and health status characteristics.28,29
Three additional variables were created to classify the type of HCC diagnosis: lifetime, preventable, and treatable These classifications capture the temporal nature of the HCC, allowing the identification of potential coding irregularities. Conditions classified as lifetime are those that, once diagnosed, should be consistently and continually coded (ie, HIV, amputation). Preventable conditions are potentially avoidable, while treatable conditions may change with time. Thus, preventable and treatable conditions may justifiably be coded one year and not the next (ie, cancer, stroke, or non-permanent injury), or variation in these condition classifications may suggest improvements in population health management. However, beneficiary changes in the coding of a lifetime condition indicate inconsistent coding or no access to care. Finally, some HCCs are classified into multiple categories depending on their severity and morbidities (Appendix 1 and 2 illustrate the coding schema and conditions included in each category). Additionally, the most prevalent conditions within each category were included as binary variables in the regression model to evaluate their individual significance. Annual beneficiary-level counts of the total number of HCCs and the total number in each condition category were created.
HCC Risk Score
Using the same methodology employed by CMS, individual HCC risk scores were calculated each year using statistical programs published by CMS. These programs utilize data elements from beneficiary claims files, including beneficiary-level demographic and clinical conditions, to calculate a raw risk score. Following the practice of CMS, raw risk scores were normalized such that the mean national assignable FFS risk score year equals 1.0, ensuring consistency in the FFS risk score year to year.
Statistical Analyses
Analyses employed two dependent variables, county-level and individual-beneficiary HCC risk score variation. County-level variation is calculated as the mean of all FFS beneficiaries residing in each county. In addition, regional indicators for Northwest, Northeast, Central, Southwest, and Southeast Florida residents were identified to assess differences by geographic area. Individual beneficiary variation is quantified as an annual change in a beneficiary’s risk score. Annual changes were calculated as the absolute value to increase the interpretability of the results.
Descriptive statistics were calculated for all model variables and compared across years. Negative binomial regression models were specified to assess the relationship between within and across beneficiary variation and age, race, sex, region of residence, the total number of diagnosed HCCs, total lifetime condition diagnoses, total preventable condition diagnoses, and total treatable condition diagnoses. Covariates were chosen based on the availability of information within CMS claims data and a review of the current literature evaluating potentially significant determinants of beneficiary’s risk score.3,7 In addition, we included the most prevalent conditions in the model to evaluate further the relationship between risk scores and HCCs. To do this, we identified the top ten most prevalent HCCs within each category: lifetime, preventable, and treatable Because some conditions, such as vascular disease, appear in multiple categories, twenty-six unique conditions were included in the model. A negative binomial mixed-effects regression was chosen after examining the distribution of risk scores and evaluating variability in individual-level risk score change. The significant overdispersion of HCC risk scores and large variance (relative to the outcome mean) suggested a negative binomial model would best fit the outcome. Finally, mean marginal effect values (ME) were provided to indicate the relative magnitude of each covariate to the actual HCC risk score. ME provides a more interpretable value than the negative binomial regression coefficient. ME indicates the predicted change in risk score corresponding to the covariate of interest when all other values are held at their mean. To ensure the robustness of estimates, models were built sequentially using a chunk-wise strategy. First, fixed demographic covariates were included, followed by geographic and time indicators. Count variables for treatable, preventable, and lifetime conditions were added next, and finally, individual condition variables were included in the estimation. After each “chunk” was added, model diagnostics were examined, and goodness-of-fit was assessed. While multicollinearity is always a concern when analyses include demographic, health, and contextual characteristics, using variant, count, and binary indicator variables ensured minimal multicollinearity. Furthermore, potentially collinear variables (namely demographic characteristics) were only used as controls, thus not impacting the variables of interest. Standard model diagnostic statistics were conducted to validate the modeling strategy and covariate inclusion. Given the large number of covariate estimates, these values were not included in the tables but will be provided upon request. Equation 1 illustrates the county-level model. Equation 2 shows the individual-level model where XHCC represents a vector of the ten most prevalent preventable, treatable, and lifetime conditions, and t indicates time as the year. Both regressions were performed with SAS.30


Results
Descriptive statistics (Table 1) showed that the mean age of all Florida beneficiaries was 74.4 (sd=7.1), 75.4 (sd=7.1), and 76.4 (sd=7.1) years old in 2016, 2017, and 2018 respectively, with ages ranging from 65 to 110. The mean risk score increased slightly from 1.35 (sd=1.2) in 2016 to 1.5 (sd=1.3) in 2017 to 1.7 (sd=1.5) in 2018. The racial and gender distributions remained the same across time, with females (59.4%) and Whites (88.6%) constituting most of the sample (Males 40.6%; Blacks 4.8%; Other Races 6.5%). Beneficiaries were concentrated in the Southwest (34.3%) and Southeast (27.9%) of Florida, with smaller representation in the other regions (Northwest 5.0%; Northeast 13.7%; Central 14.4%). Figure 1 depicts the mean annual risk score by region, by year, showing higher risk scores in the south. The mean number of conditions increased yearly in each region, with the rate of increase slightly higher in the Southeast and Southwest. Similarly, each beneficiary’s total count of diagnosed lifetime, preventable, and treatable conditions increased slightly yearly (Figure 2). Specifically, the mean number of lifetime conditions per beneficiary grew from 1.33 in 2016 to 1.61 in 2018.
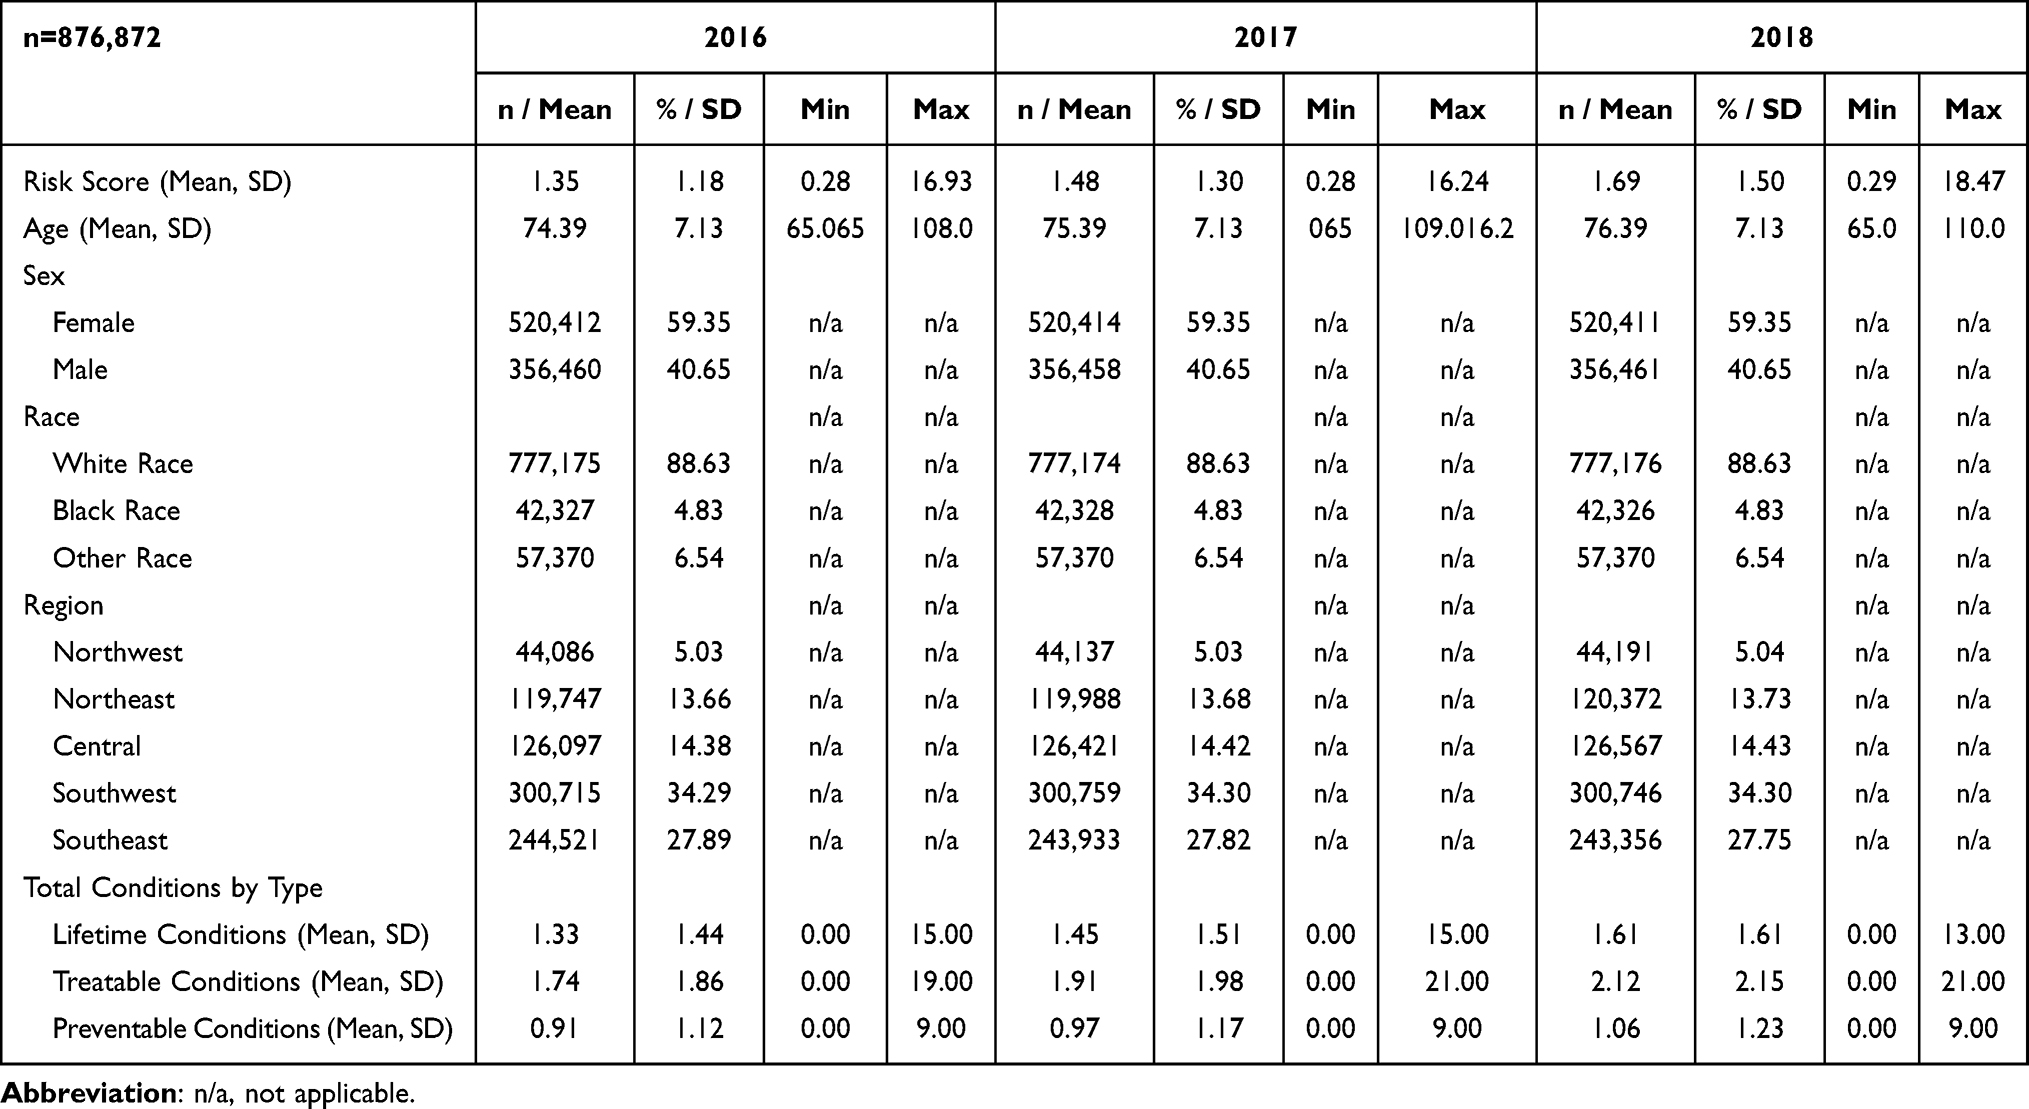 |
Table 1 Beneficiary Characteristics by Year |
 |
Figure 1 Mean HCC Risk Score by Region: 2016, 2017, 2018. |
 |
Figure 2 Mean Treatable, Lifetime, and Preventable Diagnoses. |
Treatable conditions increased from 1.74 in 2016 to 2.12 in 2018, while the mean per beneficiary number of preventable conditions increased from 0.91 to 1.06 in the same period. Figure 2 also shows the annual county-level change in the mean number of conditions by category and region. The Northeast had the lowest rate of increase for lifetime (1.24 to 1.49) and treatable (1.66 to 2.02) conditions, while the Northwest had the lowest growth in preventable (0.89 to 1.04) conditions.
Results from the county-level variation model (Table 2) show the relationship between the mean annual county-level risk score and its residents’ sex, race, and age composition, as well as the county-level prevalence of preventable, treatable, and lifetime conditions. Relative to those in the Southeast, counties in the Northeast, Central, and Southwest regions of Florida had comparatively lower mean risk scores (β = −0.006, −0.013, and −0.013, respectively) than counties elsewhere (ME = −0.003, −0.031, −0.009, respectively). In contrast, counties in the Northwest region had higher mean risk scores (β= 0.01, ME = 0.006). Older mean age (β= 0.016, ME=0.015) and a higher proportion of Black (β= 0.058, ME=0.070) beneficiaries were associated with higher mean county-level risk scores, while a higher proportion of female beneficiaries was associated with lower scores (β= −0.015; ME=−0.005). In addition, a higher mean number of lifetime and treatable conditions was associated with a higher county-level risk score. In comparison, a higher mean number of preventable conditions was correlated with a lower county-level mean risk score (ME = 0.246, 0.288, and −0.249 for lifetime, treatable and preventable, respectively). Exploration of specific conditions showed higher county-level mean risk scores are associated with metastatic cancer/acute leukemia (β= 0.681, ME=2.179) and respirator dependence/tracheostomy status (β= 0.107, ME=1.896). Additionally, pressure ulcers of the skin with necrosis (ME=1.172), as well as pressure ulcers of the skin with full-thickness (ME=1.255), partial thickness (ME=1.147), or unspecified stage (ME=1.125) indicated significantly higher county-level mean risk score. However, necrosis was associated with a lower score. Treatable conditions, namely vascular disease with complications (ME=−0.115), vascular disease (ME=−0.253), and dementia without complications (ME=−0.176), were associated with a comparatively lower county-level mean risk score.
 |
Table 2 Annual County Level Variation in HCC Risk Scorea |
In the individual-beneficiary model (Table 3), regression models evaluated year-to-year changes in individual-level risk scores. Results show significant variation in HCC risk across the state of Florida. Compared to the Southeast, beneficiaries residing in the Northeast (β= −0.009, ME=−0.005), Central (β=−0.007, ME=−0.003), and Southwest (β= −0.014, ME=−0.006) had less variation in their HCC risk scores. In contrast, those in the Northwest (β= 0.007, ME=0.007) had larger annual risk score variation. Results also suggest that risk score variation did not increase appreciably with age (ME=0.000). However, compared to Whites, Blacks (β=0.019, ME=0.001) had higher annual risk score variation, while other races had comparatively lower variation (β= −0.009, ME=−0.003). Females (β= −0.019, ME=−0.002) had less annual variation than males. Individuals with a greater number of a lifetime, treatable, and preventable diagnoses had higher year-to-year risk score variation (β=0.164, 0.206, 0.029, respectively; ME = 0.129, 0.235, 0.001, respectively). While most of the 26 condition-specific indicators showed relatively small associations with individual-level risk score variation, metastatic cancer/acute leukemia (ME=1.320) and respirator dependence/ tracheostomy status (ME=1.326) were associated with larger risk score variation. Other notable exceptions which were associated with lower risk score variation included dementia without complications (β=0.025, ME=−0.040), polyneuropathy (β=0.096, ME=−0.012), and vascular disease (β=0.083, ME = −0.084).
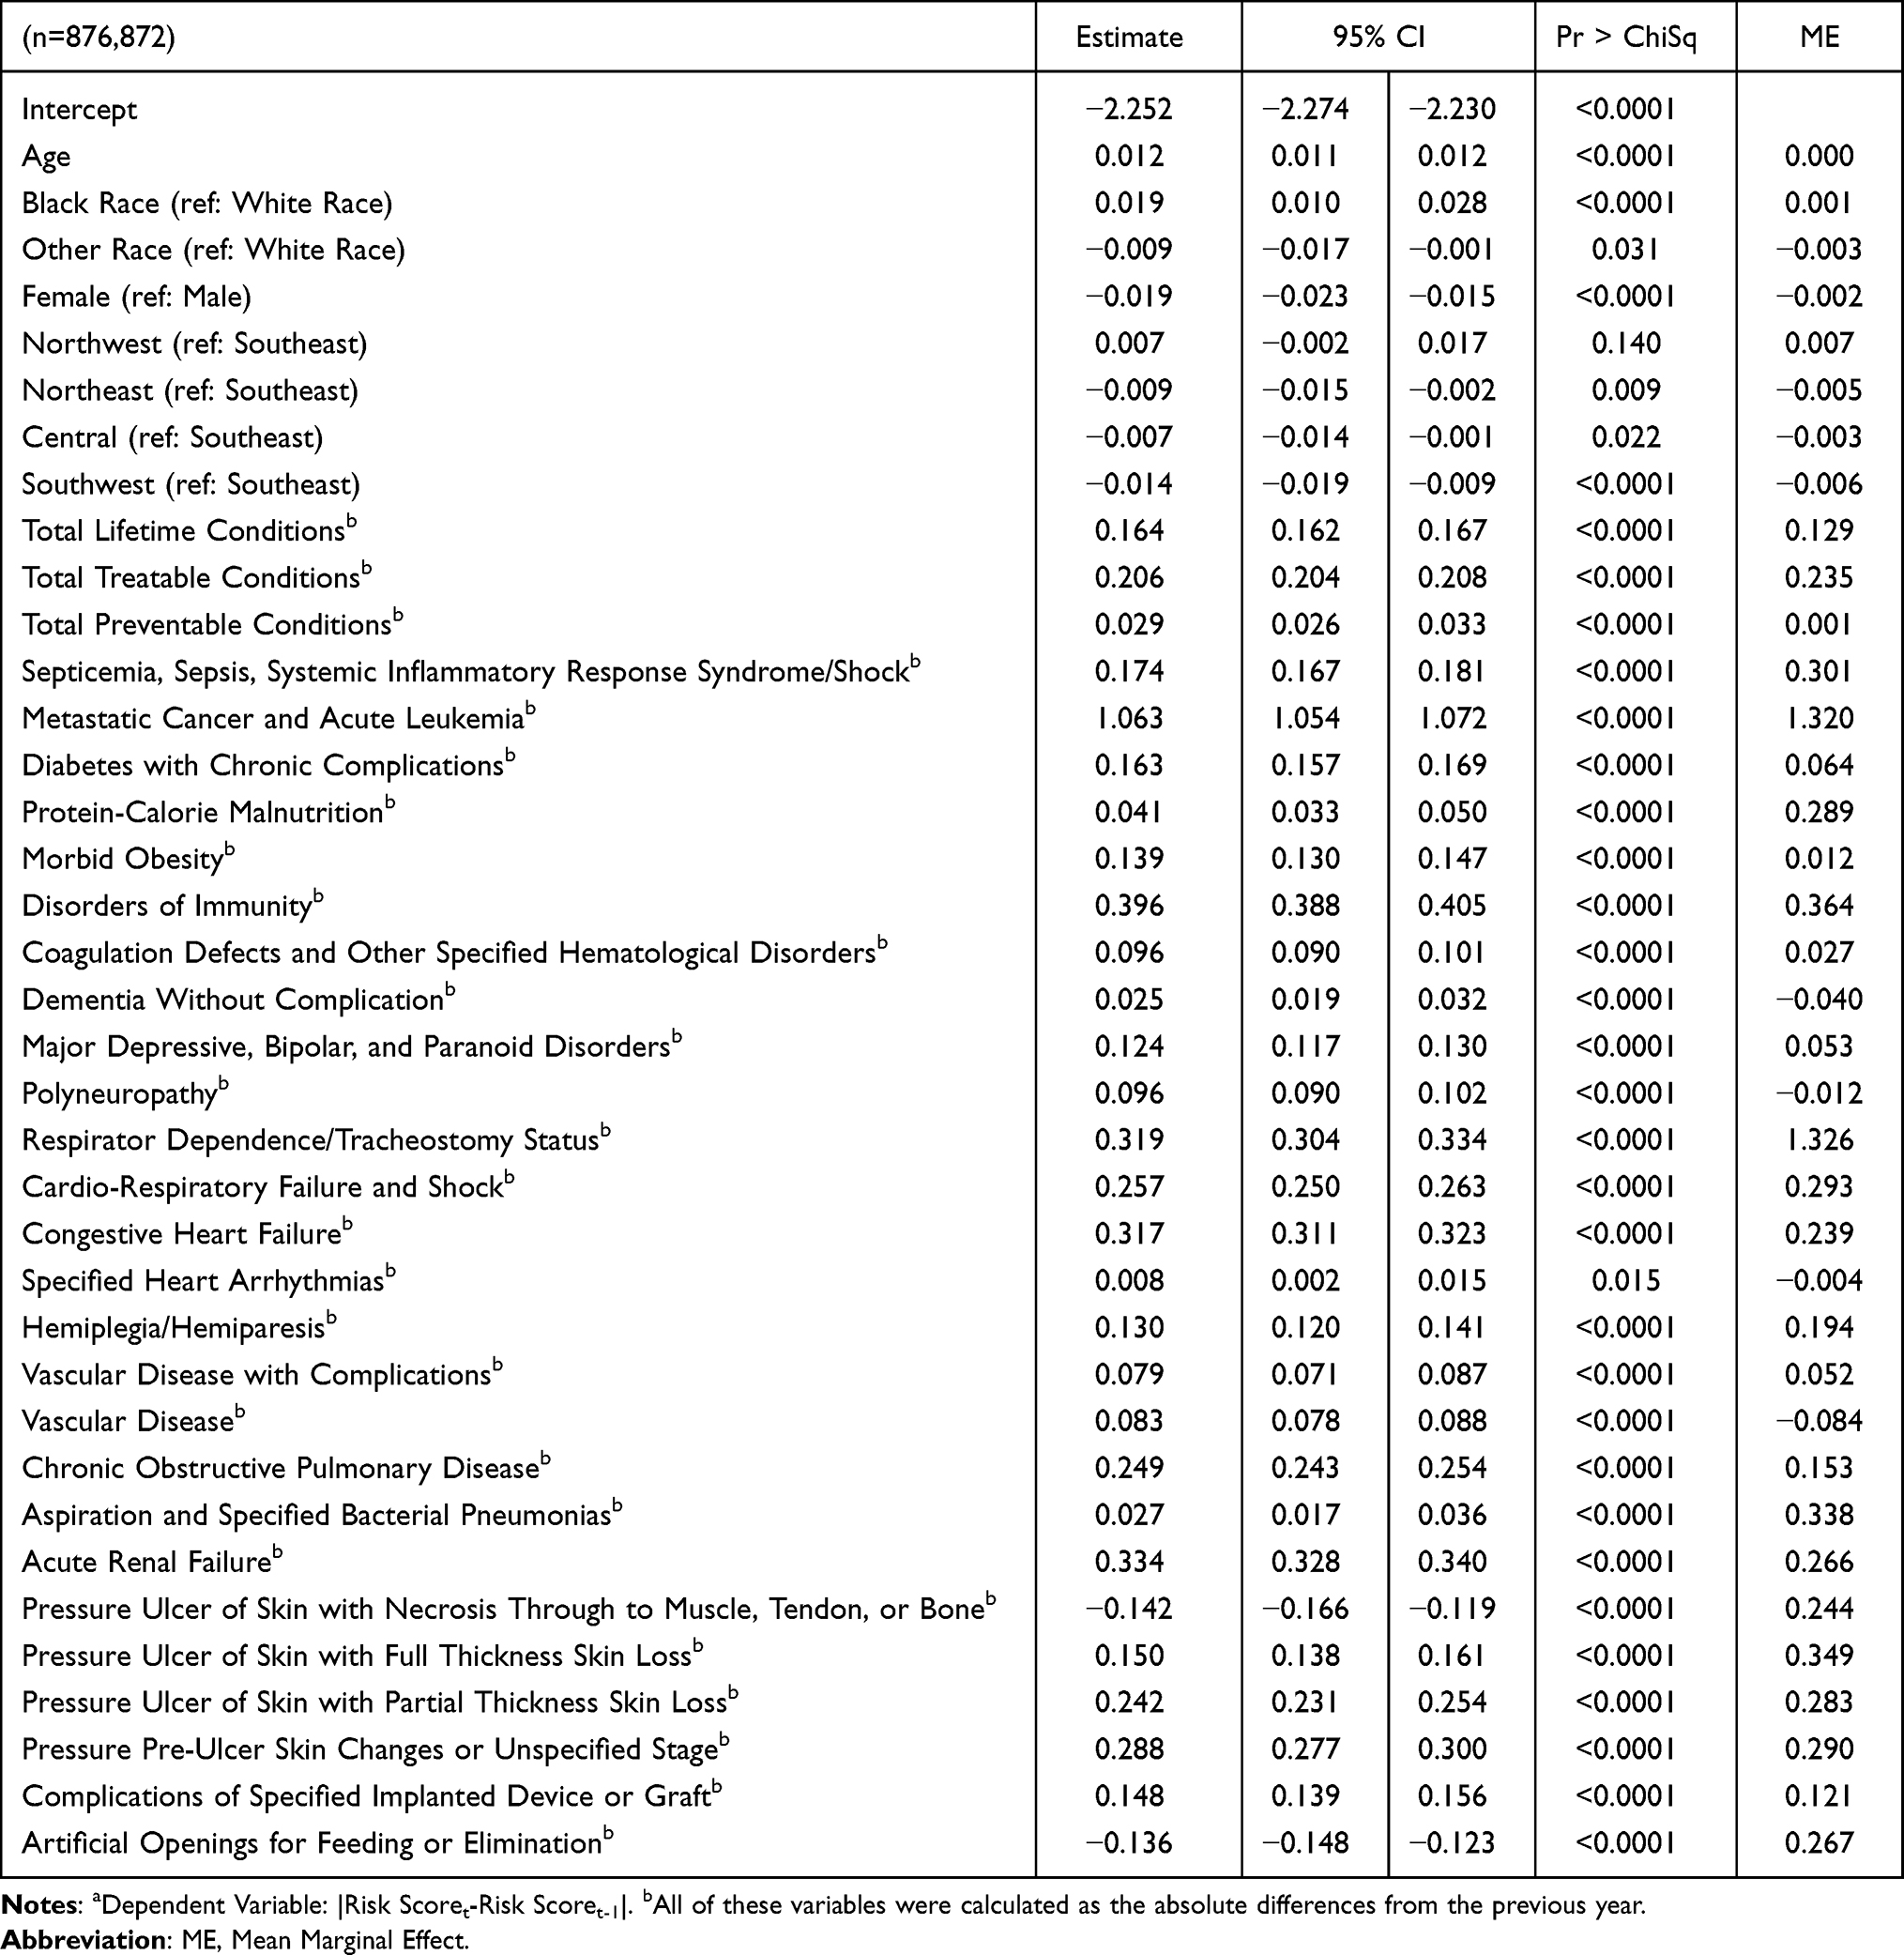 |
Table 3 Annual Individual Beneficiary Variation in HCC Risk Scorea |
Discussion
To date, few studies have been conducted using a 100% Medicare sample, and only a handful of those were able to assess longitudinal trends. This study evaluated HCC risk scores for Medicare beneficiaries in Florida between 2016 and 2018, quantifying variation across time, diagnoses, region, and demographic groups. These results elucidate various sources of HCC variation, which, to date, often remain unexplained.31,32
Annual individual variation in HCC risk score can be due to actual changes in their health, lack of access to medical services, or missed/inaccurate medical coding. However, these changes in the individual-level risk score have financial implications for insurers and providers seeking to manage risk (ie, MSSP) and improve patient health. Operationally, optimizing electronic medical record functions and educating providers leads to more accurate condition coding and, subsequently, more appropriate compensation for quality care.5,8,22,23 Consistent, accurate coding should reduce individual-level variation in HCC risk scores, particularly for lifetime and clinically manageable preventable conditions. While risk scores are likely to vary with treatable condition diagnoses, variation driven by those treatable conditions that are preventable or HCCs that indicate worsening or persistent severity point to opportunities for improved care.
In addition to inefficiencies in coding, year-to-year variation in individual-level risk scores could suggest inequity in access to care since Medicare claims are only filed when beneficiaries visit a provider, and we are unable to evaluate the equity of access. While claims data cannot accurately be used to assess access to healthcare, they do reflect the utilization of health services among FFS beneficiaries. Blacks had more significant annual variations, while other racial groups had lower annual changes, possibly indicating access concerns. At the county level, a higher prevalence of non-Whites was significantly correlated with comparatively higher annual mean risk scores. These findings provide insight into the relationship between race and risk score. More research is needed to ascertain if the regional differences are due to homogeneity in community-level health behaviors, coding practice differences across counties, and access to (or willingness to access) care. That is, beneficiaries may not seek care annually, thereby not having an HCC coded from one year to the next. More importantly, these findings reinforce that health care is “local” and highlight the need for regional approaches to population health management. Providers and insurers entering risk-sharing arrangements may need different strategies for different markets, even within one state such as Florida.
Our findings show counties with older mean age, a higher proportion of non-whites, and those in the Southeast and Northwest had significantly higher risk scores than those with a comparatively younger population. After controlling for demographics and clinical conditions (HCCs), mean risk scores in the Northwest and Southwest are roughly 2.7% higher than in other regions. Higher mean risk scores suggest some commonality in risk scores among beneficiaries living in a similar area, possibly due to regional norms such as provider coding habits or community/healthcare infrastructure. Similarly, age is correlated with higher county-level risk scores, possibly due to regional attitudes that negatively influence healthy behaviors.
The total number of preventable conditions was not correlated with significant year-to-year variations or higher county-level means, suggesting beneficiaries are not getting the condition or their condition status is not changing. At a glance, these findings could imply adequate disease prevention activities; however, a detailed review of the individual preventable conditions (shown in Table 3) shows that individuals who acquire a preventable condition have a significant increase in both risk score level and variation. In addition, although the mean number of preventable conditions is associated with a comparatively lower mean county risk score, a more detailed review of specific preventable HCCs shows that nine of the ten listed conditions (see Table 3) are associated with a significant increase in variation and mean county risk score. Therefore, providers and insurers might develop care management strategies to improve health and manage risk, such as pressure ulcers, to prevent conditions known to increase risk scores (ie, reduce health).
Not surprisingly, the total number of treatable conditions is correlated with higher annual individual-level variation and county-level mean scores. Given that many conditions listed as treatable are also preventable, providers may be able to influence the prevalence of many treatable conditions through appropriate condition monitoring and preventative care. In addition, identifying condition-specific indicators might help identify prevalent indicators that could be used to develop mitigation strategies or interventions for at-risk beneficiaries. As expected, a higher mean number of lifetime conditions is associated with more significant annual individual change and county-level risk scores. For most specific conditions, the directional change in risk score does not differ substantially between the two models. However, the marginal effect is almost double when evaluating county-level risk scores—indicating that the magnitude of the level is two times greater than the associated delta. The magnitude of the ME may reinforce the hypothesis of homogeneity in diagnosing and preventing chronic conditions within a county.
Limitations
While these results provide insight into the HCC risk score among Florida Medicare beneficiaries, this analysis has several limitations. First, this study cannot determine if risk score changes were due to health status changes, lack of access to annual care, or inefficiencies in coding. Second, some beneficiary conditions may be undiagnosed, untreated, or unreported in the CMS data files and are not represented in the study. Third, HCC differences due to local-level health infrastructure, availability of healthcare providers, or accessibility of treatment facilities are not captured in the claims data and could account for some of the observed variations. Fourth, the presence of MA plans in the region may influence access to care and coding practices for all beneficiaries who receive care in the market. Finally, individuals may have supplemental healthcare coverage, influencing their decision to treat a condition and receive services not billed to CMS.
Summary
This paper evaluates variation in HCC risk score on multiple levels. While results from individual-level analyses showed changes over time among all demographic and condition groups, findings from the county-level analysis suggested that spatial clustering exists within counties but does not extend beyond individual regions of Florida. This study contributes to ongoing discussions about the role of risk adjustment in reimbursement. While variation in HCC risk scores could result from coding inefficiencies, declining individual-level health, or unequal healthcare access/utilization, variation in HCC risk scores impacts the financial solvency of providers and insurers. However, identifying conditions and condition categories associated with HCC variability provides opportunities for target care management to prevent or mitigate the condition’s severity. Similarly, results may guide treatment practices by identifying conditional, regional, and demographic characteristics associated with higher risk and resulting healthcare expenditures.
Acknowledgments
The authors would like to acknowledge the University of Florida, College of Pharmacy, Center for Drug Evaluation and Safety for access to the data. The authors would like to acknowledge Scott Vouri, Pharm.D., Ph.D. BCGP for his expertise in Medicare claims data and Jeff West, MHA for his expertise in risk-based contracting.
Funding
The authors received internal funding from UF Health to support this research.
Disclosure
The authors report no conflicts of interest in this work.
References
1. CMS. 2011 report: evaluation of the CMS-HCC risk adjustment model. CMS. Available from: https://www.cms.gov/Medicare/Health-Plans/MedicareAdvtgSpecRateStats/Risk-Adjustors-Items/Evaluation2011.
2. HHS. Risk adjustment methodology an overview of risk adjustment. in: module 1: risk adjustment introduction and overview. HHS. Available from: https://www.hhs.gov/guidance/sites/default/files/hhs-guidance-documents/prep-act-guidance.pdf.
3. Centers for Medicare & Medicaid Services (CMS), HHS. Medicare program; medicare shared savings program; accountable care organizations—revised benchmark rebasing methodology, facilitating transition to performance-based risk, and administrative finality of financial calculations. final rule. Fed Regist. 2016;81(112):37949–38017.
4. Sorace J, Wong HH, Worrall C, Kelman J, Saneinejad S, MaCurdy T. The complexity of disease combinations in the Medicare population. Popul Health Manag. 2011;14(4):161–166. doi:10.1089/pop.2010.0044
5. Chernew ME, Carichner J, Impreso J, et al. Coding-driven changes in measured risk in accountable care organizations. Health Aff. 2021;40(12):1909–1917. doi:10.1377/hlthaff.2021.00361
6. Hayford TB, Burns AL. Medicare advantage enrollment and beneficiary risk scores: difference-in-differences analyses show increases for all enrollees on account of market-wide changes. Inquiry. 2018;55. doi:10.1177/0046958018788640
7. Kronick R, Welch P. Measuring coding intensity in the medicare advantage program. Medicare Medicaid Res Rev. 2014;4(2). doi:10.5600/mmrr.004.02.sa06
8. Lissenden B, Amin K, Drury K, et al. A comparison of health risk and costs across private insurance markets. RTI; 2022. Available from: https://www.rti.org/publication/comparison-health-risk-and-costs-across-private-insurance-markets.
9. Markovitz AA, Hollingsworth JM, Ayanian JZ, et al. Risk adjustment in the medicare ACO program deters coding increases but may lead ACOs to drop high-risk beneficiaries. Health Aff. 2019;38(2):253–261. doi:10.1377/hlthaff.2018.05407
10. Dorr DA, Ross RL, Cohen D, et al. Primary care practices’ ability to predict future risk of expenditures and hospitalization using risk stratification and segmentation. Johns Hopkins University; 2021. Available from: https://jhu.pure.elsevier.com/en/publications/primary-care-practices-ability-to-predict-future-risk-of-expendit.
11. Hyer MJ, White S, Cloyd J, et al. Can we improve the prediction of adverse surgical outcomes? Development of a surgical complexity score using a novel machine learning technique. J Am Coll Surg. 2020;230(1):43–52e1. doi:10.1016/j.jamcollsurg.2019.09.015
12. Johnston KJ, Wen H, Joynt Maddox KE. Relationship of a claims-based frailty index to annualized medicare costs. Ann Intern Med. 2020;172(8):533. doi:10.7326/m19-3261
13. Park S, Basu A. Improving risk adjustment with machine learning: accounting for service-level propensity scores to reduce service-level selection. Health Serv Outcomes Res Methodol. 2021;21(3):363–388. doi:10.1007/s10742-020-00239-z
14. Rose S. A machine learning framework for plan payment risk adjustment. Health Serv Res. 2016;51(6):2358–2374. doi:10.1111/1475-6773.12464
15. Chen J, Ellis RP, Toro KH, Ash AS. Mispricing in the medicare advantage risk adjustment model. Inquiry. 2015;52:004695801558308. doi:10.1177/0046958015583089
16. McWilliams JM, Najafzadeh M, Shrank WH, Polinski JM. Association of changes in medication use and adherence with accountable care organization exposure in patients with cardiovascular disease or diabetes. JAMA Cardiol. 2017;2(9):1019. doi:10.1001/jamacardio.2017.2172
17. Morrisey MA, Kilgore ML, Becker DJ, Smith W, Delzell E. Favorable selection, risk adjustment, and the medicare advantage program. Health Serv Res. 2012;48(3):1039–1056. doi:10.1111/1475-6773.12006
18. Bianco C, Jamialahmadi O, Pelusi S, et al. Non-invasive stratification of hepatocellular carcinoma risk in non-alcoholic fatty liver using polygenic risk scores. J Hepatol. 2021;74(4):775–782. doi:10.1016/j.jhep.2020.11.024
19. Song Y, Skinner J, Bynum J, Sutherland J, Wennberg JE, Fisher ES. Regional variations in diagnostic practices. N Engl J Med. 2010;363(1):45–53. doi:10.1056/nejmsa0910881
20. Sorace J, Millman M, Bounds M, et al. Temporal variation in patterns of comorbidities in the medicare population. Popul Health Manag. 2013;16(2):120–124. doi:10.1089/pop.2012.0045
21. Mu Y, Chin AI, Kshirsagar AV, Zhang Y, Bang H. Regional and temporal variations in comorbidity among US dialysis patients: a longitudinal study of medicare claims data. Inquiry. 2018;55. doi:10.1177/0046958018771163
22. Han A, Carayannopoulos AG. Comprehensive analysis of trends in medicare utilization and reimbursement in physical medicine & rehabilitation: 2012 to 2017. PMR. 2022;14(10):1188–1197. doi:10.1002/pmrj.12692
23. Bleser WK, Saunders RS, Muhlestein DB, McClellan M. Why do accountable care organizations leave the medicare shared savings program? Health Aff. 2019;38(5):794–803. doi:10.1377/hlthaff.2018.05097
24. Jacobs PD, Kronick R. The effects of coding intensity in medicare advantage on plan benefits and finances. Health Serv Res. 2020;56(2):178–187. doi:10.1111/1475-6773.13591
25. Inaccuracies in Medicare’s race and ethnicity data hinder the ability to assess health disparities. In: OEI-02-21-00100 06- 15-2022; 2022. Available from: https://oig.hhs.gov/oei/reports/OEI-02-21-00100.asp.
26. Lochner KA, Shoff CM. County-level variation in prevalence of multiple chronic conditions among medicare beneficiaries, 2012. Prev Chronic Dis. 2015;12(E07). doi:10.5888/pcd12.140442
27. Li Q, Rahman M, Gozalo P, Keohane LM, Gold MR, Trivedi AN. Regional variations: the use of hospitals, home health, and skilled nursing in traditional medicare and medicare advantage. Health Aff. 2018;37(8):1274–1281. doi:10.1377/hlthaff.2018.0147
28. Sun F. Rurality and opioid prescribing rates in US counties from 2006 to 2018: a spatiotemporal investigation. Soc Sci Med. 2022;296:114788. doi:10.1016/j.socscimed.2022.114788
29. Paro A, Hyer JM, Diaz A, Tsilimigras DI, Pawlik TM. Profiles in social vulnerability: the association of social determinants of health with postoperative surgical outcomes. Surgery. 2021;170(6):1777–1784. doi:10.1016/j.surg.2021.06.001
30. SAS Institute Inc. SAS® 9.4 Statements: Reference. Cary, NC: SAS Institute Inc.; 2013.
31. Reschovsky JD, Hadley J, Romano PS. Geographic variation in fee-for-service medicare beneficiaries’ medical costs is largely explained by disease burden. Med Care Res Rev. 2013;70(5):542–563. doi:10.1177/1077558713487771
32. Schuldt RF, Lallier ALM, Chen HF, Tilford JM. Geographic variation in medicare home health expenditures. Am J Manag Care. 2022;28(7):322–328. doi:10.37765/ajmc.2022.89179
 © 2023 The Author(s). This work is published and licensed by Dove Medical Press Limited. The
full terms of this license are available at https://www.dovepress.com/terms
and incorporate the Creative Commons Attribution
- Non Commercial (unported, 3.0) License.
By accessing the work you hereby accept the Terms. Non-commercial uses of the work are permitted
without any further permission from Dove Medical Press Limited, provided the work is properly
attributed. For permission for commercial use of this work, please see paragraphs 4.2 and 5 of our Terms.
© 2023 The Author(s). This work is published and licensed by Dove Medical Press Limited. The
full terms of this license are available at https://www.dovepress.com/terms
and incorporate the Creative Commons Attribution
- Non Commercial (unported, 3.0) License.
By accessing the work you hereby accept the Terms. Non-commercial uses of the work are permitted
without any further permission from Dove Medical Press Limited, provided the work is properly
attributed. For permission for commercial use of this work, please see paragraphs 4.2 and 5 of our Terms.