")
Back to Journals » Journal of Inflammation Research » Volume 15
Downregulation of TIGIT Expression in FOXP3+Regulatory T Cells in Acute Coronary Syndrome
Authors Xiong X, Luo Z, Zhou H, Duan Z, Niu L, Zhang K, Huang G, Li W
Received 26 November 2021
Accepted for publication 28 January 2022
Published 22 February 2022 Volume 2022:15 Pages 1195—1207
DOI https://doi.org/10.2147/JIR.S351364
Checked for plagiarism Yes
Review by Single anonymous peer review
Peer reviewer comments 4
Editor who approved publication: Professor Ning Quan
Xinlin Xiong,1– 3 Zhenhua Luo,4,5 Haiyan Zhou,3 Zonggang Duan,1 Li Niu,3 Kai Zhang,1 Guangwei Huang,1 Wei Li1,3
1Clinical College, Guizhou Medical University, Guiyang City, Guizhou Province, People’s Republic of China; 2Department of Cardiology, Chengdu University Affiliated Hospital, Chengdu City, Sichuan Province, People’s Republic of China; 3Department of Cardiology, Guizhou Medical University Affiliated Hospital, Guiyang City, Guizhou Province, People’s Republic of China; 4NHC Key Laboratory of Pulmonary Immune-related Diseases, Guizhou Provincial People’s Hospital, Guiyang City, Guizhou Province, People’s Republic of China; 5Department of Central Lab, Guizhou Provincial People’s Hospital, Guiyang City, Guizhou Province, People’s Republic of China
Correspondence: Wei Li, Email [email protected]
Objective: Little is currently known on the role of T-cell immunoglobulin and ITIM domain (TIGIT) expression in Foxp3+ regulatory T cells (TIGIT+Tregs) in acute coronary syndrome (ACS) patients. The aim of this study was to investigate the role and alterations of TIGIT+Tregs in ACS patients.
Methods: We enrolled 117 subjects, including 61 ACS patients, 26 chronic coronary syndrome (CCS) patients, and 30 control subjects without coronary artery disease. The quantification of TIGIT+Tregs was determined by flow cytometry; serum interleukin-6 (IL-6) and transforming growth factor-β (TGF-β) were also measured.
Results: TIGIT+Tregs expression was significantly lower in ACS patients compared with CCS and control patients (P< 0.05). The expression of TIGIT+Tregs was comparable in patients with and without traditional risk factors (P> 0.05). Logistic regression analysis revealed that TIGIT+Tregs levels are independent predictors of ACS (P< 0.01). Receiver-operating characteristic (ROC) curve analysis showed the expression levels of TIGIT+Tregs had a discriminative power for ACS (P< 0.01). IL-6 levels were increased (P< 0.01), while TGF-β was decreased in ACS patients compared with CCS and control patients (P< 0.01). Meanwhile, an inverse correlation between IL-6 and TIGIT+Tregs was observed (P< 0.01), while a positive correlation between TGF-β and TIGIT+Tregs was found (P< 0.05).
Conclusion: TIGIT+Tregs levels are significantly reduced in ACS, accompanied by upregulated IL-6 and downregulated TGF-β expression. The downregulated TIGIT+Tregs are independent predictors of ACS. These findings suggest that TIGIT+Tregs may have an anti-inflammatory and protective effect on ACS, and its decreased expression may be associated with atherosclerotic plaque destabilization.
Keywords: T-cell immunoglobulin and ITIM domain, regulatory T cell, acute coronary syndrome, inflammation
Introduction
Acute coronary syndrome (ACS) is a clinical disease with high morbidity and mortality all over the word.1–3 It is mainly characterized by atherosclerotic plaque instability, rupture, and thrombosis. Inflammation is involved in plaque destabilization.4 A body of studies have shown that some inflammatory predictors are associated with cardiac conditions such as stable coronary artery disease, acute coronary syndrome, and collateral development in coronary arteries.5–7 Besides, inflammatory-immune cells play prominent roles in the process of atherosclerosis.8 In this regard, immune cells have been documented to participate in the process of atherosclerosis. Abnormal expression of some molecules on immune cells has been associated with immune cells dysfunction and regulation of the corresponding immune response.9 CD4+ T cells are divided into helper T (Th) cells and regulatory T cells (Tregs). The imbalance between Th cells and Tregs contributes to erosion and plaque rupture in coronary artery atherosclerosis, leading to thrombosis and ACS.10 An increasing body of evidence shows an increase in Th cells such as Th1, Th17, and Th22 in ACS, while Tregs are downregulated.10–13 Tregs play a key role in regulating immune homeostasis and maintaining immune tolerance. Moreover, Tregs form part of a heterogeneous population with diverse phenotypes.14 Accumulating evidence demonstrates that Tregs can be defined by many regulatory molecules phenotypically, such as glycoprotein A repetitions predominant (GARP),15 cytotoxic T lymphocyte antigen 4 (CTLA-4),16 glucocorticoid-induced TNFR related protein (GITR),17 T cell immunoglobulin and ITIM domain (TIGIT).18 These molecules have been identified as characteristic markers of Tregs.
TIGIT, an inhibitory immune checkpoint molecule and a receptor of the Ig superfamily, consists of an extracellular IgV domain, a type 1 transmembrane domain, and a cytoplasmic tail containing ITIM and an immunoglobulin tail tyrosine (ITT) motif, and is expressed mainly on activated T cells, memory T cells, NK cells, and Tregs.18 The role of TIGIT expression on immune cells, including T cells and natural killer cells, has been explored in several diseases; TIGIT expression on lymphocytes is reportedly altered in autoimmune diseases and cancer. In systemic lupus erythematosus (SLE), and rheumatoid arthritis (RA), TIGIT expression is downregulated on NK cells and upregulated on CD4+ T cells.19–22 TIGIT expression on NK cells is upregulated in gastric and colon cancers.19 Moreover, decreased TIGIT expression on CD4+T cells has been documented in psoriasis,23 and aplastic anemia.24 The TIGIT expression in FOXP3+Tregs (TIGIT+Tregs) are a distinct subset of Tregs that can mediate T cell responses via cell to cell contact-dependent manner and secretion of cytokines.25 A study found that TIGIT+Tregs were decreased in SLE compared with healthy individuals, suggesting that changes in TIGIT+Treg levels may be associated with immune disorders.22 Another study showed that TIGIT+Tregs, upregulated in tumor-infiltrating lymphocytes, can inhibit antitumor immune responses.26
However, to the best of our knowledge, the role and alterations of TIGIT+Tregs in ACS have not been investigated. Accordingly, The aim of this study was to investigate the role and alterations of TIGIT+Tregs in ACS patients and to enhance our understanding of TIGIT+Tregs in ACS patients and provide the basis for future studies.
Patients and Methods
Patients
In this study, 117 subjects were enrolled from May 2021 to September 2021. Informed consent was obtained from all participants. Ethical approval for the research was obtained from the Ethics Committee of Guizhou Medical University Affiliated Hospital. This study was also in compliance with the Declaration of Helsinki. All enrolled subjects underwent diagnostic coronary angiography and were divided into three groups according to the European Society of Cardiology (ESC) guidelines for patients with or without persistent ST-segment elevation and chronic coronary syndromes (CCS): The acute coronary syndrome (ACS) group (n=61) (45 men and 16 women, mean age 61.31±12.95 years) including patients with acute ST-segment elevation ACS (STEACS) and non-ST-segment elevation ACS (NSTEACS), the chronic coronary syndrome (CCS) group (n=26) consisting of 18 men and 8 women, with a mean age of 64.58±10.50 years and the control group (n=30), consisting of 16 men and 14 women, with a mean age of 58.57±11.60 years. The diagnostic criteria for ACS and CCS were based on cardiac troponins T levels, clinical manifestation, electrocardiogram alteration, and coronary angiography results.1,2,27 The inclusion criteria for ACS included acute chest discomfort at rest or on minimal exertion with the presence of electrocardiogram alterations (ST-segment elevation or depression, T-wave inversion, flat T waves, or pseudonormalization of T waves) and/or an increase and/or decrease of high-sensitivity cardiac troponin T with at least one value above the 99th percentile of the upper reference limit. The inclusion criteria for CCS consisted of patients with typically stable exertional chest discomfort, asymptomatic and minor stable symptomatic patients with coronary artery disease during periodic follow-up or asymptomatic coronary artery disease patients detected by screening. Besides, in all selected ACS and CCS patients, the lumen stenosis of any major epicardial coronary artery was greater than or equal to 50%, confirmed by coronary angiography. The control group consisted of patients with normal coronary artery angiography and without typical exertional chest discomfort complaints and the history of atherosclerotic cardiovascular disease. Subjects with the following past medical histories were excluded: human immunodeficiency virus infection, cancer, severe liver disease, serious infection, severe valvular heart disease, severe heart failure, dissection of the aorta, rheumatic disease, current immunosuppressive therapy, chronic inflammatory diseases, uremia or dialysis, mental disorders.
Data Collection
Clinical data of patients during their hospital stay were collected from medical records, which included categorical and continuous variables such as age, gender, treatment, body mass index (BMI), medical history, lipids profiles. In addition, coronary angiography results were also collected.
Blood Samples Collection
Peripheral blood samples were obtained from patients before coronary angiography. Samples were collected without anticoagulants (5mL) or with heparinized tubes (3mL). The serum was separated by centrifugation for 15 min at 1000 X g. The supernatant was then aliquoted and stored at -80°C until analysis. The anticoagulant blood with heparin was used for flow cytometry analysis.
Flow Cytometry Analysis
Whole blood was analyzed using cell surface staining. Antibodies against the following antigens were added to the whole blood: CD3 (BD Pharmingen), CD4 (BD Pharmingen), CD25 (BD Pharmingen), CD56 (BDPharmingen), CD127 (Biolegend), and TIGIT (Biolegend). After incubation at room temperature for 30min, erythrocytes were lysed by adding a red blood cell lysate. After washing, the stained cells were analyzed with FACSCalibur cytometer (BD celesta) using Diva software. The data were then analyzed using FlowJo software (TreeStar).
The Detection of the Levels of TGF-β and IL-10
After serum samples stored in the −80°C refrigerator were thawed, the serum concentrations of IL-6 (Multiscience, China) and TGF-β1 (Multiscience, China) were measured by enzyme-linked immunosorbent assay (ELISA) according to the manufacturer’s instructions. The IL-6 and TGF-β1 concentrations were determined according to a standard curve.
Statistical Analysis
The normal distribution was analyzed by the Kolmogorov–Smirnov test. Continuous variables following normal distribution were expressed as mean±SD. Non-parametric continuous variables were expressed as medians with the interquartile range (IQR), and categorical variables were expressed as percentages and compared by the chi-square test. The Student’s t-test was used to compare TIGIT+Tregs levels between groups with and without traditional risk factors. Comparison of normally distributed variables among three groups was performed by one-way ANOVA, followed by LSD’s test. Comparisons of non-parametric variables among three groups were determined by the Kruskal–Wallis test. Univariable and multivariable logistic regression analyses were performed to identify predictors of ACS. The receiver operating characteristic (ROC) analysis was used to examine the discriminatory power of TIGIT+Tregs for ACS. Spearman correlation analysis was performed to assess the correlation between cytokine levels and TIGIT+Tregs. Multiple stepwise regression analysis was performed to investigate the relationship between TIGIT+Tregs and IL-6 and TGF-β expression. Statistical analysis was carried out using SPSS26.0. A P-value <0.05 was statistically significant.
Results
Patients Characteristics
There were no significant differences in demographic variables (age and gender), BMI, diabetes mellitus, and hypertension among the three groups (see Table 1). However, a higher smoking prevalence was observed in ACS patients than in CCS and control patients (P=0.027). There was a significant difference in history of revascularization, angiotensin-converting enzyme inhibitors/angiotensin receptor blockers (ACEI/ARB) use and β-blockers use among the three groups (P≤0.001). The total cholesterol (TC) and low-density lipoprotein cholesterol (LDL-C) levels were significantly higher in the ACS patients compared with CCS patients (P<0.001). The basic clinical characteristics of the three groups are presented in Table 1.
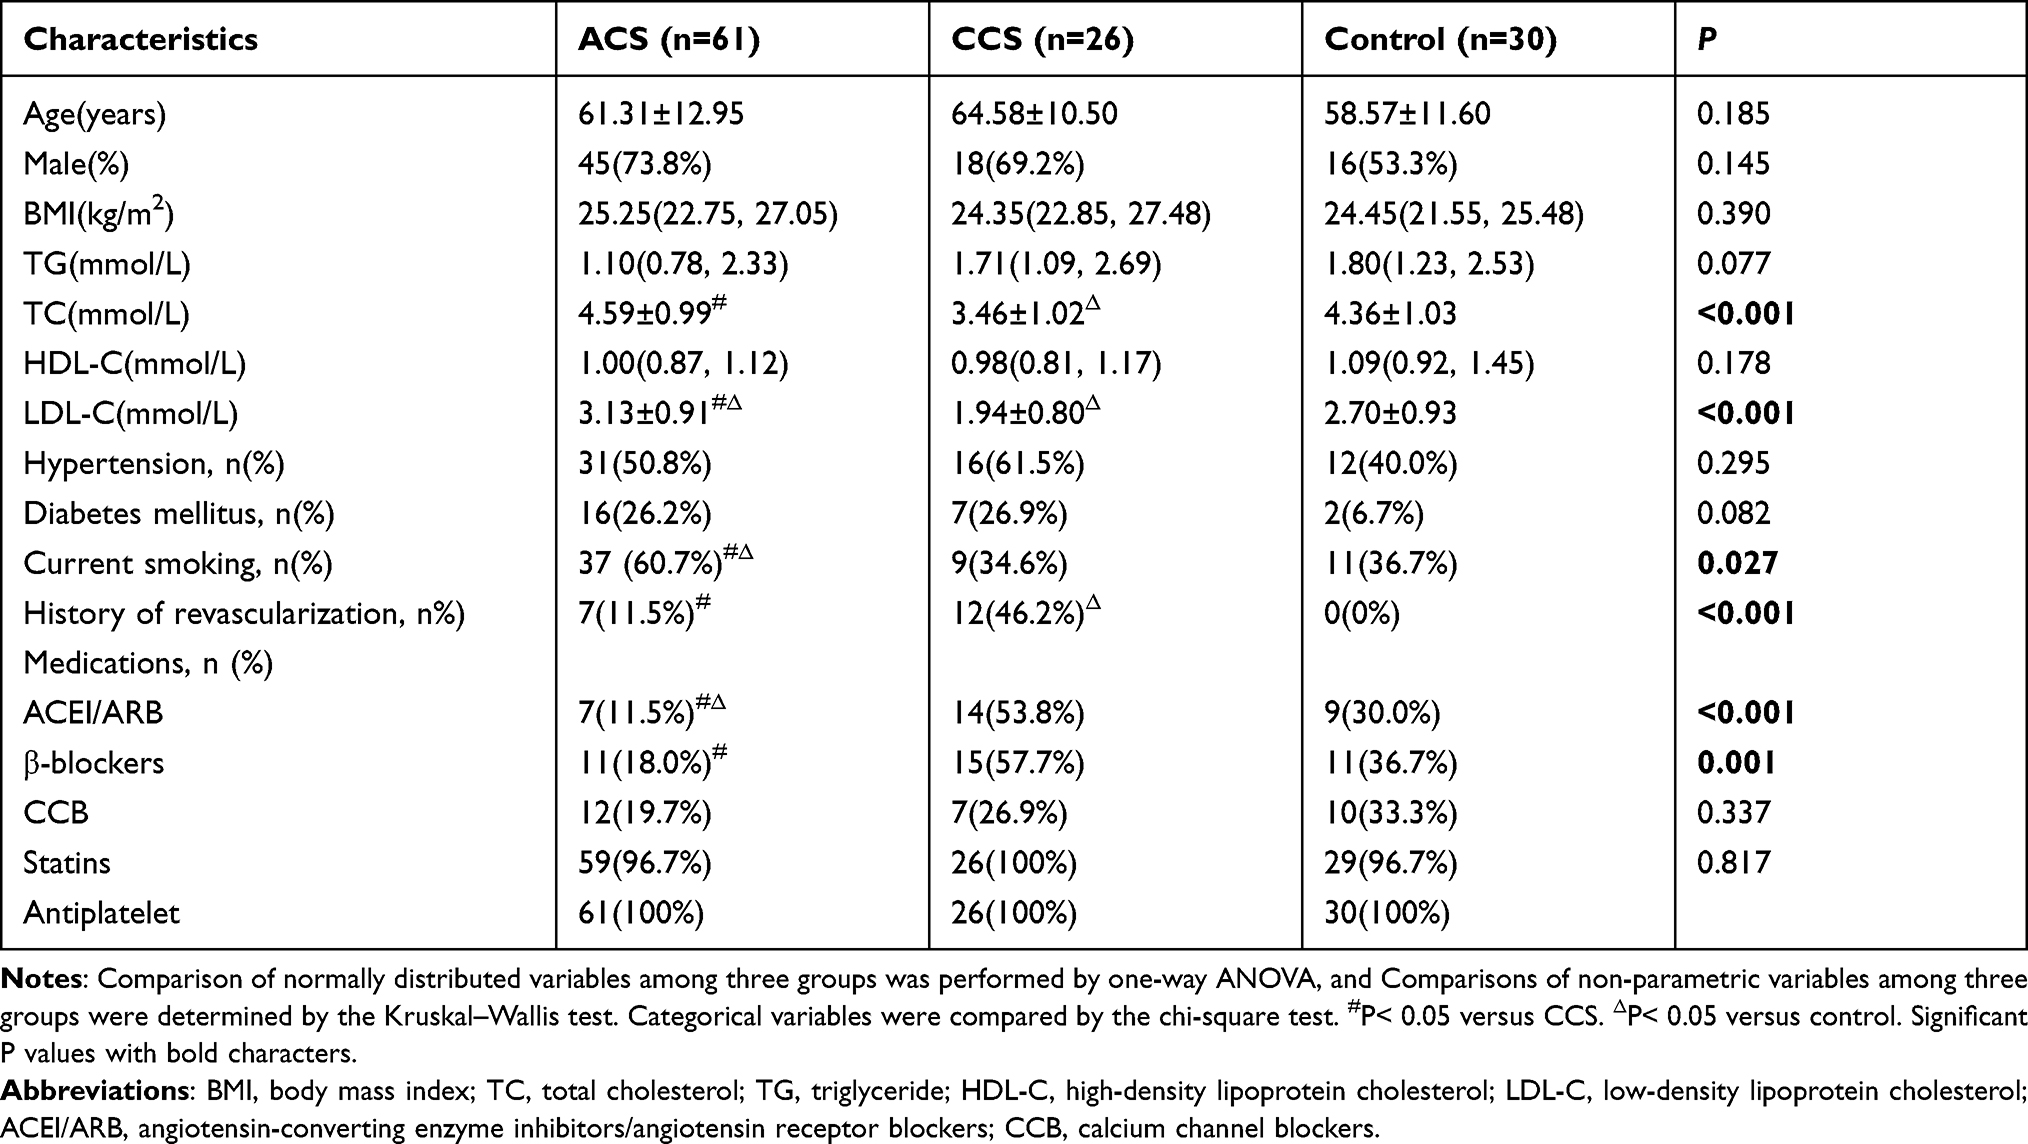 |
Table 1 Clinical Characteristics of Patients |
TIGIT+Tregs Levels Were Downregulated in ACS Patients
We investigated the levels of TIGIT+Tregs, FOXP3+Tregs, and CD4+TIGIT+T cells in all patients. The gating strategy of TIGIT+Tregs, FOXP3+Tregs, and CD4+TIGIT+T cells were presented in Figure 1. As shown in Figure 2, the TIGIT+Tregs expression levels were significantly lower in ACS patients than in CCS and control patients (Figure 2A). There was no difference in TIGIT+Tregs expression between CCS and control patients (Figure 2A). No significant difference was found in the levels of CD4+TIGIT+ T cells and FOXP3+Tregs among the three groups (Figure 2B and C).
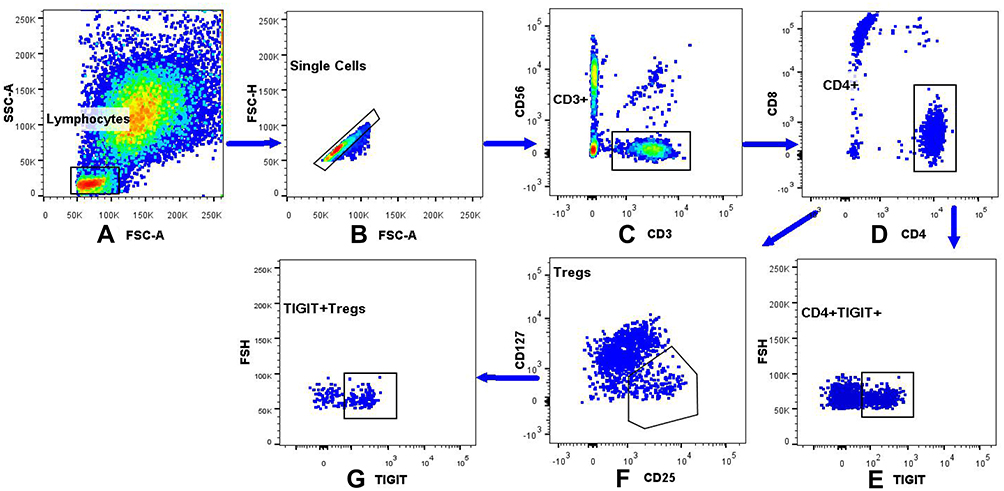 |
Figure 1 The gating strategy of the TIGIT+Tregs, FOXP3+Tregs, CD4+TIGIT+ in peripheral blood lymphocytes. (A) The lymphocytes were gated based on the light scatter properties on forward scatter (FSC) and side scatter (SSC) dot plots. (B) Cellular adhesions were excluded based on FSC-A and FSC-H. (C) CD3+CD56- cells were identified by gating on the CD3+CD56-cells on a CD3/CD56 dot plot. (D) CD4+CD8- were identified by gating on the CD4+CD8-cells on a CD4/CD8 dot plot. (E) Dot plot analysis of CD4+TIGIT+ derived from gated CD4+/CD8-cells population. (F) FOXP3+Tregs were identified by gating on the CD25+CD127low/-cells arised from CD4+CD8-T cells. (G) Dot plot analysis of the TIGIT+Tregs derived from gated FOXP3+Tregs. |
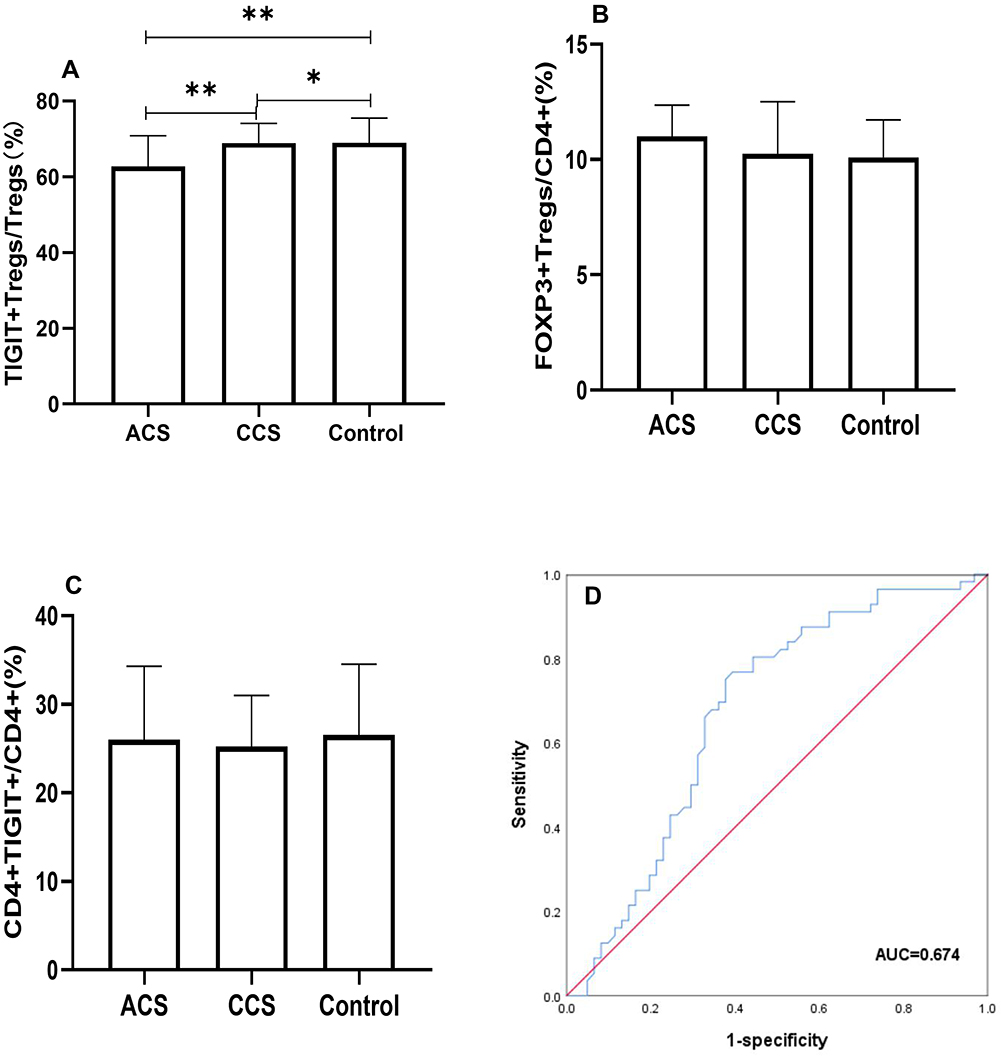 |
Figure 2 Comparison of TIGIT+Tregs, FOXP3+Tregs, CD4+TIGIT+ among three groups. (A) Differential distribution of TIGIT+Tregs among three groups were observed (**Indicates P<0.05; *Indicates P>0.05). (B) FOXP3+Tregs and (C) CD4+TIGIT+ were insignificantly altered (P>0.05). (D) ROC curve of TIGIT+Tregs in ACS patients, the cut-off value of TIGIT+Tregs was 64.35% (P<0.01). |
The Levels of TIGIT+Tregs Were Comparable in Patients with and without Traditional Risk Factors
All subjects were separated into two groups based on traditional risk factors, including age, gender, hypertension, diabetes mellitus, and smoking status. The patients were divided into two groups based on the median age (62 years) (age group 1:≥62 years, age group 2 <62 years). As shown in Figure 3, there were no significant differences in TIGIT+Tregs levels in gender (males vs females) and age (age group 1 vs age group 2). Similar results were observed when patients were stratified according to their history of hypertension, diabetes mellitus, and smoking status (see Figure 3). The above results suggested that TIGIT+Tregs were not associated with traditional risk factors.
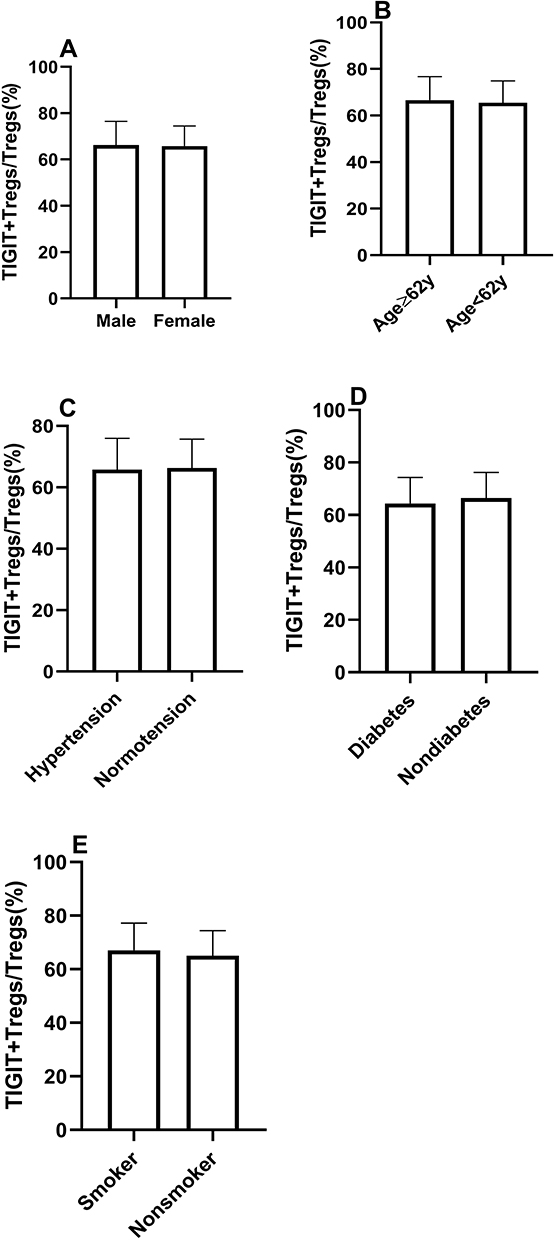 |
Figure 3 The similar distribution of TIGIT+Tregs in patients with traditional risk factors. (A) The frequency of TIGIT+Tregs according to gender. (B) The frequency of TIGIT+Tregs according to age. (C) The frequency of TIGIT+Tregs according to history of hypertension. (D) The frequency of TIGIT+Tregs according to history of diabetes. (E) The frequency of TIGIT+Tregs according to the smoking status. (Ps>0.05). |
The Decrease in TIGIT+Treg Levels Was an Independent Predictor of ACS
We performed logistic regression analysis to examine the association between TIGIT+Tregs and ACS. During univariate analysis (see Table 2), TIGIT+Tregs levels were negatively associated with ACS [odds ratio (OR) = 0.939; 95% confidence interval (CI)=0.899–0.980, P=0.004]. After adjusting for gender, age, and BMI during multivariate analysis, the adjusted OR was 0.933 (95% CI=0.893–0.976, P=0.002)(see Model 2 in Table 3). Further after adjusting for hypertension, diabetes mellitus, smoking status, and history of revascularization, the relationship between TIGIT+Treg levels and ACS remained statistically significant [OR = 0.921, 95% CI = 0.877–0.968, P=0.001](see Model 3 in Table 3). Finally, when other variables such as ACEI/ARB use, β-blocker use, and lipids profiles including TG, HDL-C, LDL-C were added to the model (see model 5 in Table 3), a significant correlation was found between TIGIT+Tregs levels and the presence of ACS [OR=0.902, 95% CI=0.849–0.958, P=0.001]. The OR values of TIGIT+Tregs in the different regression models are presented in Table 3. Furthermore, receiver-operating characteristic (ROC) curve analysis was used to evaluate the discriminative power of TIGIT+Tregs for ACS. As presented in Figure 2D, the ROC curve revealed that the cut-off value of TIGIT+Tregs to identify ACS was 64.35% (area under the curve (AUC) value was 0.674 for ACS) with a sensitivity and specificity of 76.8% and 60.7%, respectively, indicating that the decline in TIGIT+Tregs enables the discrimination of ACS.
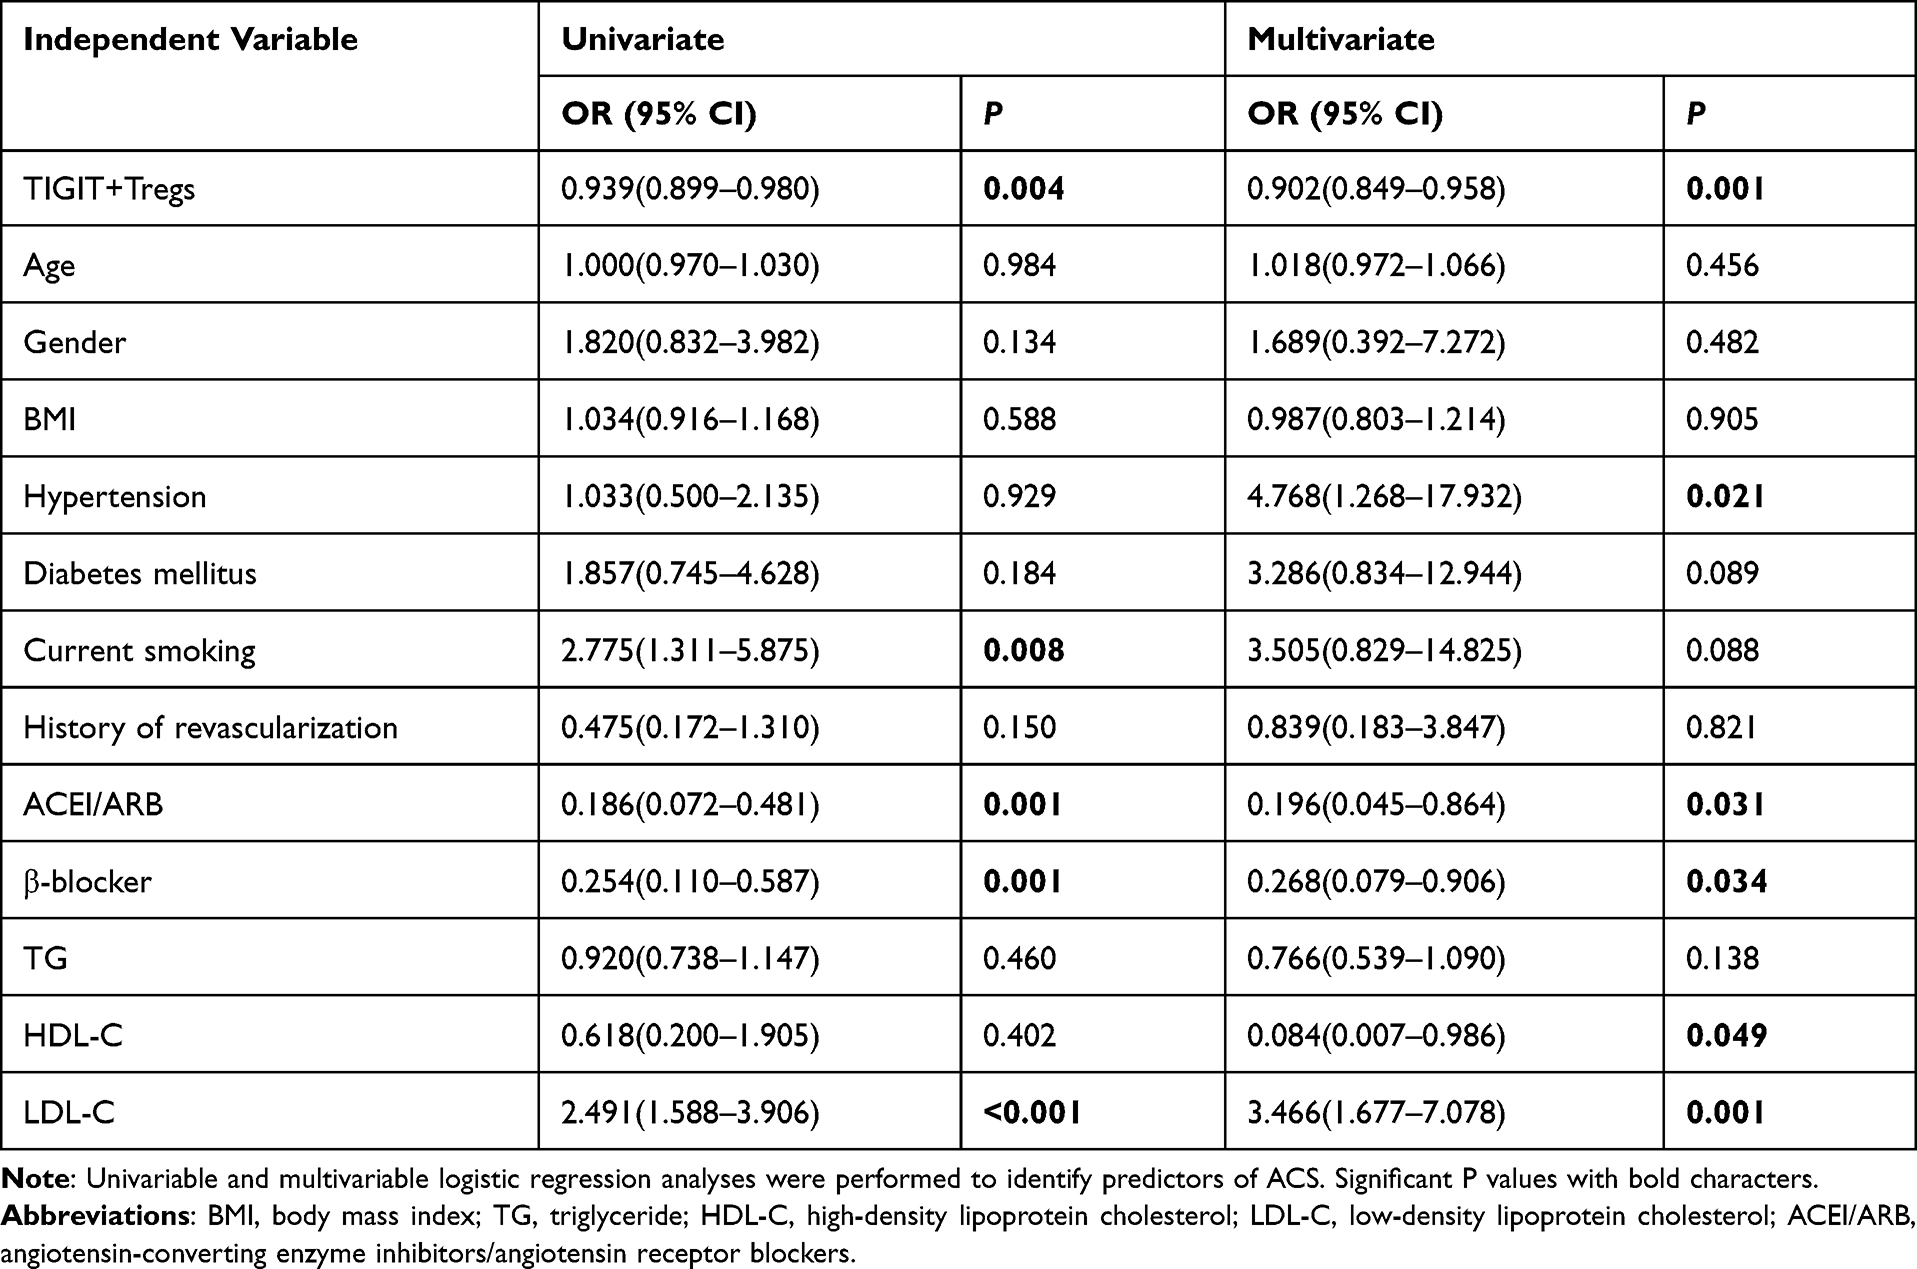 |
Table 2 The Association of Clinical Variable with ACS |
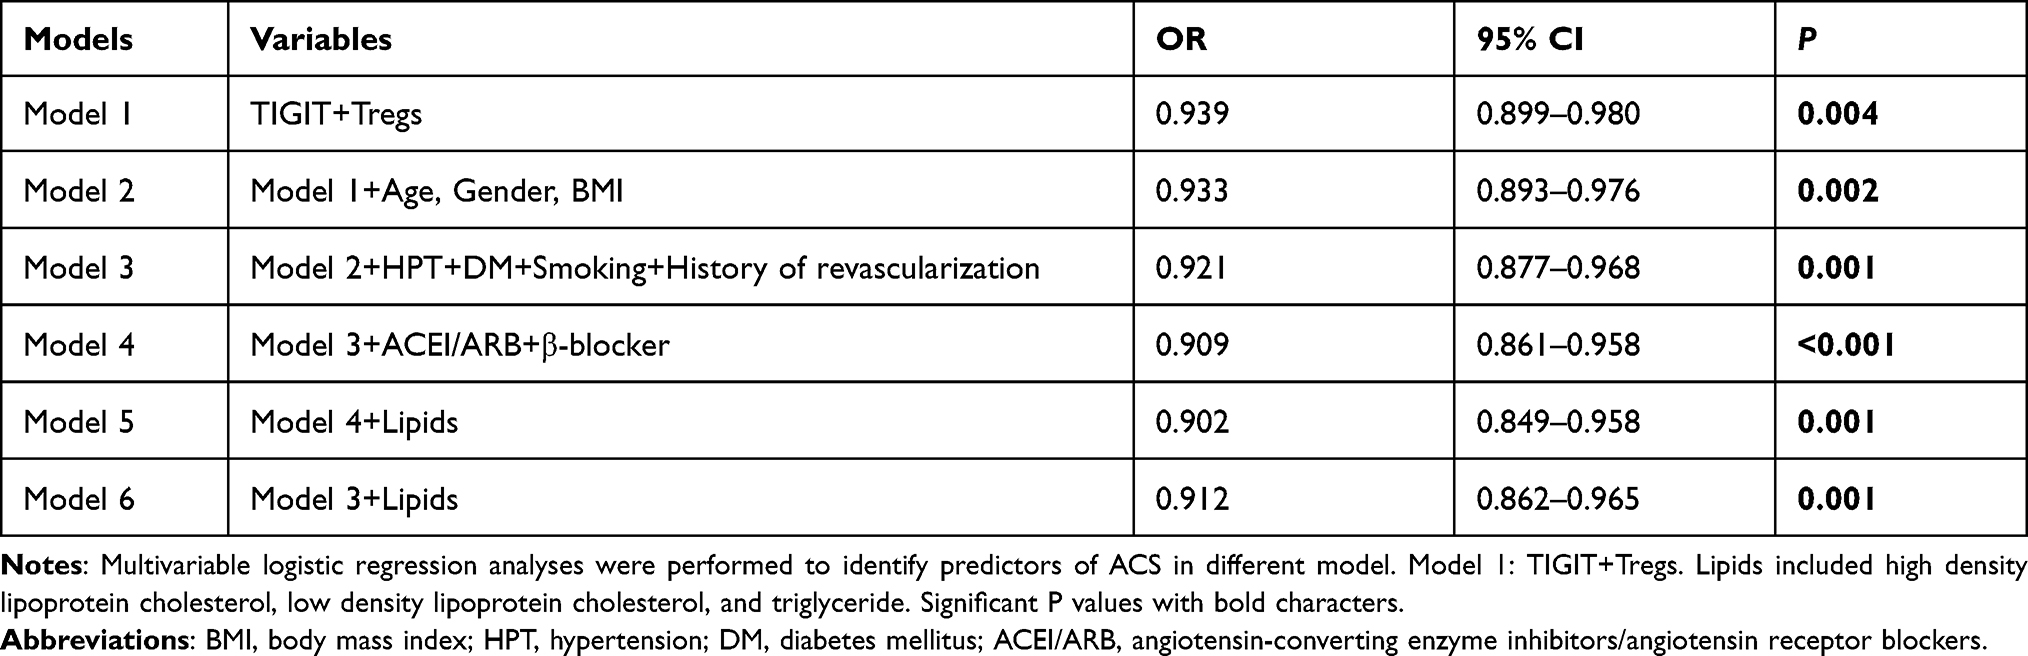 |
Table 3 The Independent Association of TIGIT+Tregs with ACS in Different Model |
Elevated IL-6 and Reduced TGF-β Expression Levels in ACS Patients
We compared the serum IL-6 and TGF-β levels among the three groups. As shown in Figure 4, the IL-6 levels were significantly increased in the ACS group than in the CCS and the control groups (Figure 4A). There was no significant difference in IL-6 expression between the CCS and the control groups (Figure 4A). The TGF-β levels were significantly reduced in the ACS group compared with the CCS and the control groups (Figure 4B). The TGF-β levels were comparable between the CCS and control groups (Figure 4B).
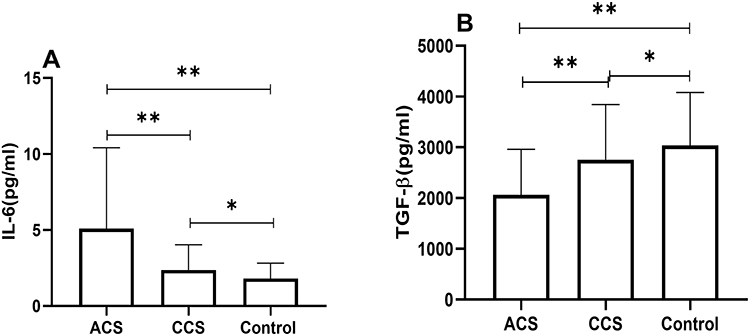 |
Figure 4 Comparison of IL-6 (A), TGF-β (B) among three groups (**Indicates P < 0.01; *Indicates P >0.05). |
The Correlation of TIGIT+Tregs with IL-6 and TGF-β Level
Spearman correlation analysis showed that IL-6 expression was negatively correlated with TIGIT+Tregs levels (Figure 5A). The expression of TGF-β was positively correlated with TIGIT+Tregs (Figure 5B). To determine the association between TIGIT+Tregs levels with IL-6 and TGF-β, we also carried out multivariable stepwise regression analysis. The TIGIT+Tregs were the dependent variable, while the independent variables included age, BMI, gender, current smoking, hypertension, diabetes mellitus, history of revascularization, lipid profiles, ACEI/ARB use, and β-blockers use. Results showed TIGIT+Tregs levels were negatively correlated with IL-6 levels (Standardization coefficient β=−0.364, p < 0.01) and positively correlated with TGF-β levels (Standardization coefficient β= 0.191, p < 0.05).
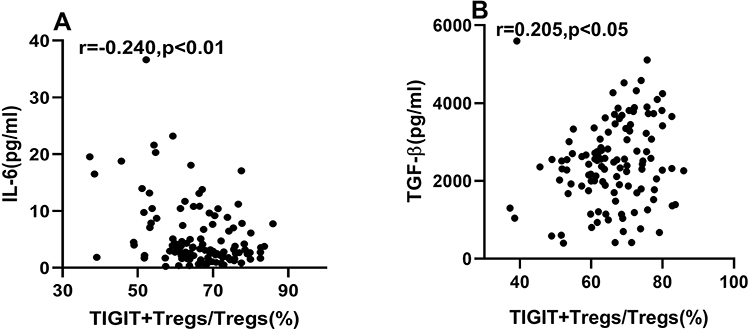 |
Figure 5 Correlations of TIGIT+Tregs with IL-6 and TGF-β. (A) Spearman correlation analysis between TIGIT+Tregs and IL-6. (B) Spearman correlation analysis between TIGIT+Tregs and TGF-β. |
Discussion
In current study, we demonstrated for the first time that TIGIT+Tregs decreases in ACS patients. TIGIT+Tregs have been extensively characterized by researchers.18,28 TIGIT+Tregs represent a functionally distinct subset of Tregs in both humans and mice because of their higher inhibitory capacity compared with TIGIT-Tregs. Intriguingly, TIGIT+Tregs have been shown to exert an inhibitory effect via secretion of soluble fibrinogen-like protein 2 (sFGLl2), by which TIGIT+ Tregs can inhibit the Th1 and Th17 cell responses.18 In the present study, we demonstrated that TIGIT+Tregs were significantly downregulated in ACS patients. We also found that the TIGIT+Tregs had a significant discriminative power for ACS by ROC curve analysis. Besides, logistic regression analysis showed that the TIGIT+Tregs level was an independent predictor of ACS, indicating that TIGIT+Tregs may play an important role during the onset of ACS. Taken together, these results indicate that TIGIT+Tregs may be a sensitive subset of Tregs in ACS, and its decrease may be involved in atherosclerotic plaque instability. Liu et al reported that the sFGL2 levels were reduced in ACS patients compared to patients with stable angina and normal coronary arteries.29 Moreover, sFGL2 has been reported to be positively associated with levels of CD4+CD25+FOXP3+Tregs,29 suggesting that sFGL2 might be an inhibitory effector molecule of TIGIT+Tregs in ACS.18 Accordingly, TIGIT can be regarded as a specific marker of FOXP3+Tregs in ACS patients.
It has been established that the expression of FOXP3 on CD4+ cells can be used as a typical marker of Tregs.30 Low expression and absence of CD127 expression on CD4+CD25+Tregs can serve as an alternative to FOXP3 expression on CD4+CD25+ T cells.31 FOXP3+Tregs have been documented in many diseases such as organ transplantation, systemic lupus erythematosus, cancer, and ACS.29,32–34 FOXP3+Tregs have also been reported extensively in mouse models of atherosclerosis and coronary artery disease patients. Interestingly, the Tregs expansion was found to inhibit the progression of atherosclerotic lesions in mouse models,35,36 while the loss of Tregs facilitates atherogenesis,37 indicating the close relationship between FOXP3+Tregs and atherosclerosis. In coronary artery disease patients, especially those with ACS, the level of FOXP3+Tregs is reduced compared with control and CCS patients.30 Similar results were also found by another study,13 suggesting that FOXP3+Tregs are linked to atherosclerotic plaque instability in ACS.13 However, contrasting results have been reported in the literature. Lü et al and Jiang et al found that FOXP3+Tregs remained unchanged in ACS patients.38,39 Consistently, we found that FOXP3+Tregs were not altered in ACS patients. However, TIGIT+Tregs were decreased. The findings demonstrate poor stability and repeatability of the quantification of FOXP3+ as a biomarker of identifying alteration of Tregs compared with TIGIT+Tregs in ACS patients. Furthermore, FOXP3+Tregs include different molecular phenotypes with specialized functions.40 Other distinctive markers of Tregs such as glycoprotein A repetitions predominant (GARP), Helios have also been identified. The relationship among these molecules in ACS needs to be further elucidated.15,39
In ACS, the increases in activated Th1 and Th17 are accompanied by increases in cytokine IFN-γ and IL-17, respectively. Their elevations are related to plaque instability and onset of ACS.13,41 Therefore, developing a therapeutic strategy for inhibiting Th1, Th17 could protect against plaque destabilization and rupture. Interestingly, some studies have shown that activating the TIGIT signaling pathway prohibited T cell responses including Th1, Th2, Th9, Th17, and reduced corresponding cytokine IFN-Υ, IL-13, IL-9, IL-17 production through a T cell-intrinsic manner.42,43 What’s more, the mechanism of action of TIGIT+Tregs may involve the TIGIT-CD155 pathway. CD155, expressed on monocytes, T cells, and dendritic cells (DCs), is a ligand for TIGIT; the engagement of TIGIT+Tregs with CD155 can induce IL-10 secretion by DCs, and promote tolerogenic DCs that inhibited effector T cell responses, including T cells proliferation and cytokine IFN-Y production.25,44 TIGIT+Tregs can also secrete sFGL2 that inhibits Th1 and Th2 responses.18
In addition, it is well known that macrophages can be divided into two major subtypes termed pro-inflammatory M1 macrophage and anti-inflammatory M2 macrophage. Macrophages play an important role in atherosclerosis progression and plaque rupture in ACS.45 A high M1/M2 ratio has been correlated with plaque instability. The activation of the TIGIT-CD155 pathway can cause a shift from M1 macrophages to M2 macrophages, which attenuates plaque instability.45–47 These results suggest that decreased TIGIT+Tregs might impair the immunosuppressive and anti-inflammatory function of Tregs in ACS.
The imbalance between pro-inflammatory and anti-inflammatory responses is well acknowledged to participate in the pathogenesis of ACS.48 TGF-β, produced by Tregs, is also an immune-inhibitory and anti-inflammatory cytokine.49,50 TGF-β contributes to atherosclerotic plaque stabilization.8,50 However, IL-6, secreted by many cells including macrophages and dendritic cells, is a pro-inflammatory cytokine and pro-atherosclerotic factor in atherosclerosis; an increase in IL-6 has been associated with vulnerable plaques.51–53 Increased IL-6 levels are also correlated with future myocardial infarction.54 In the present study, we found that the TGF-β level was reduced and IL-6 level increased in ACS patients compared to CCS and control patients, consistent with the literature.39,55 Meanwhile, we found that TIGIT+Tregs were downregulated in ACS, and an inverse association between IL-6 and TIGIT+Tregs was observed. In contrast, a positive correlation between TGF-β and TIGIT+Tregs was found. Overall, these findings reflect that TIGIT+Tregs may exert an anti-inflammatory and protective effect in ACS, and its decrease may be associated with plaque destabilization. Thus, developing a therapeutic strategy for up-regulation of TIGIT+Tregs in CAD patients may contribute to protect against plaque destabilization and ACS occurrence in clinical practice, which may be an attractive approach for CAD in the future.
The mechanisms underlying the decline in TIGIT+Treg levels remain unclear. Evidence from the literature suggests that IL-6 could reduce foxp3+ Tregs, whereas IL-6 blockade leads to opposite results.56 Moreover, IL-6 could suppress TGF-β-induced Treg differentiation.57 Although our study consistently demonstrated a correlation between TIGIT+Tregs and cytokines (IL-6 and TGF-β), little is known on the mechanisms by which IL-6 and TGF-β mediate TIGIT expression on FXOP3+Tregs. In contrast, given that TIGIT+Tregs induce immunoregulatory and anti-inflammatory effects via exerting negative immune responses, it remains unknown whether TIGIT+Tregs can regulate the production of IL-6 and TGF-β.
There were some limitations in our study, emphasizing that our results should be interpreted with caution. First of all, the sample size was not large enough. In addition, this was a cross-sectional single-center study. Moreover, a suppression function assay of TIGIT+Tregs was not performed to confirm the importance of TIGIT+Tregs in the ACS microenvironment. Besides, the regulatory relationship between TIGIT+Tregs and cytokines such as IL-6, TGF-β was clarified, warranting further studies. Finally, the association between decreased levels of TIGIT+Tregs in ACS patients and prognosis was not investigated.
In summary, this is the first study to demonstrate that TIGIT+Tregs are significantly decreased in ACS, accompanied by elevated IL-6 and reduced TGF-β levels. Decreased levels of TIGIT+Tregs may play a prominent role in the discrimination and independent prediction of ACS. Meanwhile, the present study also showed a correlation between decreased TIGIT+Tregs and IL-6 and TGF-β level changes. The above findings provide novel insights on the anti-inflammatory and protective effect of TIGIT+Tregs in ACS, and the decrease in TIGIT+ Tregs may be associated with the destabilization of atherosclerotic plaques.
Ethical Approval
This study was approved by the Ethics Committee of Guizhou Medical University Affiliated Hospital.
Disclosure
The authors declare that they have no conflicts of interest.
References
1. Ibanez B, James S, Agewall S, et al. 2017 ESC Guidelines for the management of acute myocardial infarction in patients presenting with ST-segment elevation: the Task Force for the management of acute myocardial infarction in patients presenting with ST-segment elevation of the European Society of Cardiology (ESC). Eur Heart J. 2018;39(2):119–177. doi:10.1093/eurheartj/ehx393
2. Collet JP, Thiele H, Barbato E, et al. 2020 ESC Guidelines for the management of acute coronary syndromes in patients presenting without persistent ST-segment elevation. Eur Heart J. 2021;42(14):1289–1367. doi:10.1093/eurheartj/ehaa575
3. Ralapanawa U, Sivakanesan R. Epidemiology and the magnitude of coronary artery disease and acute coronary syndrome: a narrative review. J Epidemiol Glob Health. 2021;11(2):169–177. doi:10.2991/jegh.k.201217.001
4. Lawler PR, Bhatt DL, Godoy LC, et al. Targeting cardiovascular inflammation: next steps in clinical translation. Eur Heart J. 2021;42(1):113–131. doi:10.1093/eurheartj/ehaa099
5. Sincer I, Gunes Y, Mansiroglu AK, Cosgun M, Aktas G. Association of mean platelet volume and red blood cell distribution width with coronary collateral development in stable coronary artery disease. Postepy Kardiol Interwencyjnej. 2018;14(3):263–269. doi:10.5114/aic.2018.78329
6. Sincer I, Gunes Y, Mansiroglu AK, Aktas G. Differential value of eosinophil count in acute coronary syndrome among elderly patients. Aging Male. 2020;23(5):958–961. doi:10.1080/13685538.2019.1643310
7. Sincer I, Mansiroglu AK, Erdal E, Cosgun M, Aktas G, Gunes Y. Could platelet distribution width predict coronary collateral development in stable coronary artery disease? North Clin Istanb. 2020;7(2):112–117. doi:10.14744/nci.2019.47374
8. Chistiakov DA, Orekhov AN, Bobryshev YV. Immune-inflammatory responses in atherosclerosis: role of an adaptive immunity mainly driven by T and B cells. Immunobiology. 2016;221(9):1014–1033. doi:10.1016/j.imbio.2016.05.010
9. Libby P, Lichtman AH, Hansson GK. Immune effector mechanisms implicated in atherosclerosis: from mice to humans. Immunity. 2013;38(6):1092–1104. doi:10.1016/j.immuni.2013.06.009
10. Saigusa R, Winkels H, Ley K. T cell subsets and functions in atherosclerosis. Nat Rev Cardiol. 2020;17(7):387–401. doi:10.1038/s41569-020-0352-5
11. Mao X, Zhu R, Zhang F, et al. IL-37 plays a beneficial role in patients with acute coronary syndrome. Mediators Inflamm. 2019;2019:9515346. doi:10.1155/2019/9515346
12. Lin YZ, Wu BW, Lu ZD, et al. Circulating Th22 and Th9 levels in patients with acute coronary syndrome. Mediators Inflamm. 2013;2013:635672. doi:10.1155/2013/635672
13. Cheng X, Yu X, Ding YJ, et al. The Th17/Treg imbalance in patients with acute coronary syndrome. Clin Immunol. 2008;127(1):89–97. doi:10.1016/j.clim.2008.01.009
14. Mohr A, Malhotra R, Mayer G, Gorochov G, Miyara M. Human FOXP3+ T regulatory cell heterogeneity. Clin Transl Immunol. 2018;7(1):e1005. doi:10.1002/cti2.1005
15. Meng K, Zhang W, Zhong Y, et al. Impairment of Circulating CD4⁺CD25⁺GARP⁺ regulatory T cells in patients with acute coronary syndrome. Cell Physiol Biochem. 2014;33(3):621–632. doi:10.1159/000358639
16. Mitsuiki N, Schwab C, Grimbacher B. What did we learn from CTLA-4 insufficiency on the human immune system? Immunol Rev. 2019;287(1):33–49. doi:10.1111/imr.12721
17. Kumar P, Bhattacharya P, Prabhakar BS. A comprehensive review on the role of co-signaling receptors and Treg homeostasis in autoimmunity and tumor immunity. J Autoimmun. 2018;95:77–99. doi:10.1016/j.jaut.2018.08.007
18. Joller N, Lozano E, Burkett PR, et al. Treg cells expressing the coinhibitory molecule TIGIT selectively inhibit proinflammatory Th1 and Th17 cell responses. Immunity. 2014;40(4):569–581. doi:10.1016/j.immuni.2014.02.012
19. Wang F, Hou H, Wu S, et al. TIGIT expression levels on human NK cells correlate with functional heterogeneity among healthy individuals. Eur J Immunol. 2015;45(10):2886–2897. doi:10.1002/eji.201545480
20. Luo Q, Li X, Fu B, et al. Decreased expression of TIGIT in NK cells correlates negatively with disease activity in systemic lupus erythematosus. Int J Clin Exp Pathol. 2018;11(5):2408–2418.
21. Luo Q, Deng Z, Xu C, et al. Elevated Expression of Immunoreceptor Tyrosine-Based Inhibitory Motif (TIGIT) on T Lymphocytes is Correlated with Disease Activity in Rheumatoid Arthritis. Med Sci Monit. 2017;23:1232–1241. doi:10.12659/msm.902454
22. Mao L, Hou H, Wu S, et al. TIGIT signalling pathway negatively regulates CD4+ T-cell responses in systemic lupus erythematosus. Immunology. 2017;151(3):280–290. doi:10.1111/imm.12715
23. Wang FF, Wang Y, Wang L, Wang TS, Bai YP. TIGIT expression levels on CD4+ T cells are correlated with disease severity in patients with psoriasis. Clin Exp Dermatol. 2018;43(6):675–682. doi:10.1111/ced.13414
24. Zhang T, Wang J, Zhou X, et al. Increased expression of TIGIT on CD4+ T cells ameliorates immune-mediated bone marrow failure of aplastic anemia. J Cell Biochem. 2014;115(11):1918–1927. doi:10.1002/jcb.24862
25. Anderson AC, Joller N, Kuchroo VK. Lag-3, Tim-3, and TIGIT: co-inhibitory receptors with specialized functions in immune regulation. Immunity. 2016;44(5):989–1004. doi:10.1016/j.immuni.2016.05.001
26. Kurtulus S, Sakuishi K, Ngiow SF, et al. TIGIT predominantly regulates the immune response via regulatory T cells. J Clin Invest. 2015;125(11):4053–4062. doi:10.1172/JCI81187
27. Knuuti J, Wijns W, Saraste A, et al. 2019 ESC Guidelines for the diagnosis and management of chronic coronary syndromes. Eur Heart J. 2020;41(3):407–477. doi:10.1093/eurheartj/ehz425
28. Lee DJ. The relationship between TIGIT+ regulatory T cells and autoimmune disease. Int Immunopharmacol. 2020;83:106378. doi:10.1016/j.intimp.2020.106378
29. Liu K, Li T, Huang S, et al. The reduced soluble fibrinogen-like protein 2 and regulatory T cells in acute coronary syndrome. Exp Biol Med (Maywood). 2016;241(4):421–425. doi:10.1177/1535370215612138
30. Deng G, Song X, Greene MI. FoxP3 in Treg cell biology: a molecular and structural perspective. Clin Exp Immunol. 2020;199(3):255–262. doi:10.1111/cei.13357
31. Liu W, Putnam AL, Xu-Yu Z, et al. CD127 expression inversely correlates with FoxP3 and suppressive function of human CD4+ T reg cells. J Exp Med. 2006;203(7):1701–1711. doi:10.1084/jem.20060772
32. Atif M, Conti F, Gorochov G, Oo YH, Miyara M. Regulatory T cells in solid organ transplantation. Clin Transl Immunol. 2020;9(2):e01099. doi:10.1002/cti2.1099
33. Schmidt A, Rieger CC, Venigalla RK, et al. Analysis of FOXP3+ regulatory T cell subpopulations in peripheral blood and tissue of patients with systemic lupus erythematosus. Immunol Res. 2017;65(2):551–563. doi:10.1007/s12026-017-8904-4
34. Wing JB, Tanaka A, Sakaguchi S. Human FOXP3+ regulatory T Cell heterogeneity and function in autoimmunity and cancer. Immunity. 2019;50(2):302–316. doi:10.1016/j.immuni.2019.01.020
35. Dinh TN, Kyaw TS, Kanellakis P, et al. Cytokine therapy with interleukin-2/anti-interleukin-2 monoclonal antibody complexes expands CD4+CD25+Foxp3+ regulatory T cells and attenuates development and progression of atherosclerosis. Circulation. 2012;126(10):1256–1266. doi:10.1161/CIRCULATIONAHA.112.099044
36. Foks AC, Frodermann V, Ter Borg M, et al. Differential effects of regulatory T cells on the initiation and regression of atherosclerosis. Atherosclerosis. 2011;218(1):53–60. doi:10.1016/j.atherosclerosis.2011.04.029
37. Klingenberg R, Gerdes N, Badeau RM, et al. Depletion of FOXP3+ regulatory T cells promotes hypercholesterolemia and atherosclerosis. J Clin Invest. 2013;123(3):1323–1334. doi:10.1172/JCI63891
38. Lü CX, Xu RD, Cao M, et al. FOXP3 demethylation as a means of identifying quantitative defects in regulatory T cells in acute coronary syndrome. Atherosclerosis. 2013;229(1):263–270. doi:10.1016/j.atherosclerosis
39. Jiang L, Chen F, Hu X, et al. Decreased helios expression in regulatory T Cells in acute coronary syndrome. Dis Markers. 2017;2017:7909407. doi:10.1155/2017/7909407
40. Attias M, Al-Aubodah T, Piccirillo CA. Mechanisms of human FoxP3+ Treg cell development and function in health and disease. Clin Exp Immunol. 2019;197(1):36–51. doi:10.1111/cei.13290
41. Ji QW, Guo M, Zheng JS, et al. Downregulation of T helper cell type 3 in patients with acute coronary syndrome. Arch Med Res. 2009;40(4):285–93. doi:10.1016/j.arcmed.2009.04.002
42. Lozano E, Dominguez-Villar M, Kuchroo V, Hafler DA. The TIGIT/CD226 axis regulates human T cell function. J Immunol. 2012;188(8):3869–3875. doi:10.4049/jimmunol.1103627
43. Joller N, Hafler JP, Brynedal B, et al. Cutting edge: TIGIT has T cell-intrinsic inhibitory functions. J Immunol. 2011;186(3):1338–1342. doi:10.4049/jimmunol.1003081
44. Yu X, Harden K, Gonzalez LC, et al. The surface protein TIGIT suppresses T cell activation by promoting the generation of mature immunoregulatory dendritic cells. Nat Immunol. 2009;10:48–57. doi:10.1038/ni.1674
45. Momtazi-Borojeni AA, Abdollahi E, Nikfar B, Chaichian S, Ekhlasi-Hundrieser M. Curcumin as a potential modulator of M1 and M2 macrophages: new insights in atherosclerosis therapy. Heart Fail Rev. 2019;24(3):399–409. doi:10.1007/s10741-018-09764-z
46. Libby P, Pasterkamp G, Crea F, Jang IK. Reassessing the mechanisms of acute coronary syndromes. Circ Res. 2019;124(1):150–160. doi:10.1161/CIRCRESAHA.118.311098
47. Chen X, Lu PH, Liu L, et al. TIGIT negatively regulates inflammation by altering macrophage phenotype. Immunobiology. 2016;221(1):48–55. doi:10.1016/j.imbio.2015.08.003
48. Munjal A, Khandia R. Atherosclerosis: orchestrating cells and biomolecules involved in its activation and inhibition. Adv Protein Chem Struct Biol. 2020;120:85–122. doi:10.1016/bs.apcsb.2019.11.002
49. Kuan R, Agrawal DK, Thankam FG. Treg cells in atherosclerosis. Mol Biol Rep. 2021;48(5):4897–4910. doi:10.1007/s1103021-06483-x
50. Ou HX, Guo BB, Liu Q, et al. Regulatory T cells as a new therapeutic target for atherosclerosis. Acta Pharmacol Sin. 2018;39(8):1249–1258. doi:10.1038/aps.2017.140
51. Shindo A, Tanemura H, Yata K, et al. Inflammatory biomarkers in atherosclerosis: pentraxin 3 can become a novel marker of plaque vulnerability. PLoS One. 2014;9(6):e100045. doi:10.1371/journal.pone.0100045
52. Hedin U, Matic LP. Recent advances in therapeutic targeting of inflammation in atherosclerosis. J Vasc Surg. 2019;69(3):944–951. doi:10.1016/j.jvs.2018.10.051
53. Tanaka T, Narazaki M, Kishimoto T. Interleukin (IL-6) Immunotherapy. Cold Spring Harb Perspect Biol. 2018;10(8):a028456. doi:10.1101/cshperspect.a028456
54. Zegeye MM, Andersson JSO, Wennberg P, Repsilber D, Sirsjö A, Ljungberg LU. IL-6 as a mediator of the association between traditional risk factors and future myocardial infarction: a Nested Case-Control Study. Arterioscler Thromb Vasc Biol. 2021;41(4):1570–1579. doi:10.1161/ATVBAHA.120.315793
55. Padilla-Gutiérrez JR, Valdés-Alvarado E, Rodríguez-Reyes SC, et al. Transforming Growth Factor Beta (TFG-β) Concentration Isoforms are Diminished in Acute Coronary Syndrome. Cell Biochem Biophys. 2018;76(3):433–439. doi:10.1007/s12013-018-0849-2
56. Yoshida H, Hashizume M, Suzuki M, Mihara M. Anti-IL-6 receptor antibody suppressed T cell activation by inhibiting IL-2 production and inducing regulatory T cells. Eur J Pharmacol. 2010;634(1–3):178–183. doi:10.1016/j.ejphar.2010.02.026
57. Schinnerling K, Aguillón JC, Catalán D, Soto L. The role of interleukin-6 signalling and its therapeutic blockage in skewing the T cell balance in rheumatoid arthritis. Clin Exp Immunol. 2017;189(1):12–20. doi:10.1111/cei.12966
 © 2022 The Author(s). This work is published and licensed by Dove Medical Press Limited. The full terms of this license are available at https://www.dovepress.com/terms.php and incorporate the Creative Commons Attribution - Non Commercial (unported, v3.0) License.
By accessing the work you hereby accept the Terms. Non-commercial uses of the work are permitted without any further permission from Dove Medical Press Limited, provided the work is properly attributed. For permission for commercial use of this work, please see paragraphs 4.2 and 5 of our Terms.
© 2022 The Author(s). This work is published and licensed by Dove Medical Press Limited. The full terms of this license are available at https://www.dovepress.com/terms.php and incorporate the Creative Commons Attribution - Non Commercial (unported, v3.0) License.
By accessing the work you hereby accept the Terms. Non-commercial uses of the work are permitted without any further permission from Dove Medical Press Limited, provided the work is properly attributed. For permission for commercial use of this work, please see paragraphs 4.2 and 5 of our Terms.