")
Back to Journals » Journal of Inflammation Research » Volume 17
Downregulation of ST6GAL2 Correlates to Liver Inflammation and Predicts Adverse Prognosis in Hepatocellular Carcinoma
Authors Liu R, Yu X, Cao X, Wang X, Liang Y , Qi W, Ye Y, Zao X
Received 10 November 2023
Accepted for publication 25 January 2024
Published 1 February 2024 Volume 2024:17 Pages 565—580
DOI https://doi.org/10.2147/JIR.S437291
Checked for plagiarism Yes
Review by Single anonymous peer review
Peer reviewer comments 2
Editor who approved publication: Professor Ning Quan
Ruijia Liu,1,2,* Xudong Yu,1,* Xu Cao,1,2 Xuyun Wang,3 Yijun Liang,2 Wenying Qi,1,2 Yong’an Ye,1,2 Xiaobin Zao1,2,4
1Dongzhimen Hospital, Beijing University of Chinese Medicine, Beijing, 100700, People’s Republic of China; 2Institute of Liver Diseases, Dongzhimen Hospital, Beijing University of Chinese Medicine, Beijing, 100700, People’s Republic of China; 3Beijing Hospital of Traditional Chinese Medicine, Capital Medical University, Beijing, People’s Republic of China; 4Key Laboratory of Chinese Internal Medicine of Ministry of Education and Beijing, Dongzhimen Hospital, Beijing University of Chinese Medicine, Beijing, 100700, People’s Republic of China
*These authors contributed equally to this work
Correspondence: Xiaobin Zao, Assistant Researcher, Key Laboratory of Chinese Internal Medicine of Ministry of Education and Beijing, Dongzhimen Hospital, Beijing University of Chinese Medicine, 5 Haiyuncang Road, Dongcheng District, Beijing, 100700, People’s Republic of China, Tel +86-10-8401-3194, Email [email protected]
Purpose: ST6 Beta-Galactoside Alpha-2,6-Sialyltransferase 2 (ST6GAL2), a member of the sialic acid transferase family, is differentially expressed in diverse cancers. However, it remains poorly understood in tumorigenesis and impacts on immune cell infiltration (ICI) in hepatocellular carcinoma (HCC).
Patients and Methods: Herein, the expression, diagnosis, prognosis, functional enrichment, genetic alterations, immune characteristics, and targeted drugs of ST6GAL2 in HCC were researched by conducting bioinformatics analysis, in vivo, and in vitro experiments.
Results: ST6GAL2 was remarkably decreased in HCC compared to non-tumor tissues, portending a poor prognosis associated with high DNA methylation levels. Functional enrichment and GSVA analyses revealed that ST6GAL2 might function through the extracellular matrix, PI3K-Akt signaling pathways, and tumor inflammation signature. We found that ST6GAL2 expression was proportional to ICI, immunostimulator, and immune subtypes. ST6GAL2 expression first increased and then decreased during the progression of liver inflammation to HCC. The dysfunctional experiment indicated that ST6GAL2 might exert immunosuppressive effects during HCC progression through regulating ICI. Several broad-spectrum anticancer drugs were obtained by drug sensitivity prediction analysis of ST6GAL2.
Conclusion: In conclusion, ST6GAL2 was a reliable prognostic biomarker strongly associated with ICI, and could be a potential immunotherapeutic target for HCC.
Keywords: hepatocellular carcinoma, ST6GAL2, prognosis, immune cell infiltration, biomarker
Introduction
Cancer has been a significant public health challenge in developing and developed countries, with nearly 19.3 million new cases of cancer and 10.0 million deaths from cancer each year.1 During tumorigenesis, aberrant glycosylation on cell surfaces has been recognized to exert an essential role as glycans are involved in many cancer-related events.2 Among the glycosylation changes, the alteration of sialic acid processing is significant in regulating cell metastasis, cell apoptosis, cell-cell interaction, recognition, immune cell activation, inflammatory responses, and viral immune escape.3–9 It has been reported that aberrant terminal sialylation of specific proteins in cancer cells was crucial in cancer progression and significantly impacted malignant phenotypes.10,11 On the other hand, sialylation of receptors and effector proteins in immune cells could regulate downstream signaling activity, and aberrant sialylation is related to an immune-dysfunction tumor microenvironment (TME) that also exerts a critical role during the cancer process.12–14
The abnormal sialylation in cancer is mainly regulated by sialyltransferase (STs), which made studies on STs become the current research hotspot.15,16 STs are kinds of sialic acid-dependent glycosyltransferases that transfer sialic acids to the terminal hydroxyl of glycoprotein and glycolipid oligosaccharide chains, and excessive sialylation of the terminal glycocalyx usually causes aberration of intercellular adhesion, metastasis, invasion of tumor cells, and infiltration of immune cells.17,18 Moreover, altered glycosylation can modulate the inflammatory response, directly affecting immunosuppression, and indirectly enhancing immune checkpoints to cause immune escape and facilitate tumor progress.4,19
Twenty distinct human STs have so far been discovered, and they can be classified into four families: ST3GAL, ST6GAL, ST6GALNAC, and ST8SIA.20 Among them, the ST6GAL group contains two members of beta-galactoside α 2,6-sialyltransferase including ST6GAL1 and ST6GAL2, which could catalyze the synthesizing of alpha 2, sialylated N-glycans, a representative form of salivary acidification.4 Different from ST6GAL1, there were fewer studies of ST6GAL2, which exhibited a very tissue-specific expression pattern.21 Functionally, ST6GAL2 mainly exhibited 2.6-sialyltransferase activity toward glycoproteins and oligosaccharides that have the LacdiNAc structure (GalNAcβ1-4GlcNAc) and Galβ1-4GlcNAc sequence at the nonreducing end of their carbohydrate groups as acceptor substrates. However, it had little or no effect against certain glycoproteins and glycolipids.22,23 For the regulation of ST6GAL genes, the researchers have found, contrary to expectations, the majority of miRNAs upregulate ST6GAL1 and α-2,6-sialylation in a variety of cancer cells, in contrast, miRNAs that regulate ST6GAL2 were predominantly downregulatory.24 On the relationship between ST6GAL2 and cancers, there are fewer reports at the moment. Overexpression of ST6GAL2 could promote follicular thyroid cancer development in vivo and in vitro.25,26 Moreover, ST6GAL2 expression was also found to be associated with glioma development and has been considered a therapeutic target and prognostic biomarker.27
Our previous studies initially suggested that ST6GAL2 was notably downregulated in hepatocellular carcinoma (HCC).28 However, its role in tumorigenesis and impacts on immune cell infiltration (ICI) in HCC remain unclear. Thus, we further performed in vivo experiments, in vitro experiments, and bioinformatics analysis to detect the expression of ST6GAL2 in HCC and to analyze the potential role of ST6GAL2 in HCC, including expression characteristics, diagnostic and prognostic value, enrichment analysis, and genetic alterations. Subsequently, we investigated ST6GAL2’s role in immunotherapy and its potential as a therapeutic target by studying its association with ICI and immune checkpoint genes.
Materials and Methods
Data Acquisition
Raw RNA-seq and clinicopathological datasets of 33 tumor types from TCGA and GTEx databases were acquired from UCSC Xena (http://xena.ucsc.edu/).29 Gene expression profile of the original datasets (GSE25097 GSE83148 GSE84044 GSE114564 GSE6764) was derived from the GEO (https://www.ncbi.nlm.nih.gov/geo/). Immunohistochemical staining data from the HPA database (http://www.proteinatlas.org).
Analysis of ST6GAL2 Expression in Public Databases
ST6GAL2’s differential expression in normal and tumor tissues was explored via the GEPIA platform (http://gepia.cancer-pku.cn/index.html).30 Subsequently, the folds of ST6GAL2 mean values in normal and cancer tissues were calculated and presented in table form.
Diagnostic and Survival Analysis of ST6GAL2 in Cancers
Receiver operating characteristic (ROC) curves could predict the diagnostic ability of ST6GAL2. We selected tumor types with AUC above 0.7 for demonstration by “pROC” and “ggplot2” R packages. The Kaplan-Meier mapper platform (https://www.kmplot.com) was utilized to assess the survival value of ST6GAL2 in various tumors. Nomogram and calibration were employed to investigate the impact of clinical characteristics on the prognosis of tumor patients, using “rms” and “survival” R packages.31
Genomic Alteration Analysis of ST6GAL2 in TCGA-HCC Samples
Methylation and copy number variation (CNV) data for ST6GAL2 were retrieved from the MEXPRESS database (https://mexpress.be/).32,33 We selected the HCC dataset cg25725843 for analysis, including analyzing correlation with ST6GAL2 mRNA expression and methylation and analyzing the differential expression of ST6GAL2 methylation level in different tissues. The mutation data were downloaded and visualized via the “map tools” R package.
Differentially Expression Genes (DEGs) and Enrichment Analysis
The “DESeq2” R package and “ggplot2” R were utilized to screen the DEGs of ST6GAL2 and draw the volcano map, respectively.34 The enrichment analyses of ST6GAL2-DEGs encoding proteins were conducted by the “cluster Profiler” and “org.Hs.eg.db” R packages.35 In addition, the hub genes were screened using the Molecular Complex Detection (MCODE) plugin and MCC algorithm of CytoHubba in Cytoscape. The final hub genes of the DEGs were determined by plotting a Venn diagram to represent the relationship between the gene datasets obtained by the above two methods.
Immune-Related Characteristics of ST6GAL2 in TCGA-HCC Samples
The enrichment scores of 10 HCC-infiltrating immune cells between different ST6GAL2 expression groups were evaluated by the GSVA R package.36 In HCC samples, the ssGSEA algorithm was used to calculate Spearman’s association between infiltrating immune cells and ST6GAL2 expression. TISIDB database was utilized to evaluate the correlations between ST6GAL2 expression and immunostimulator or immune inhibitor in HCC.37 We also selected two immune checkpoints from HCC with the most vital correlation points with ST6GAL2 expression for further analysis.
Immunotherapy and Sensitive Drug Prediction Analysis of ST6GAL2
TISMO (http://tismo.cistrome.org)38 and TIDE (http://tide.dfci.harvard.edu) were used to assess the ST6GAL2 expression levels before and after ICB treatment in different cohorts and its ability to predict immunotherapy response. In addition, we applied the Genomics of Drug Sensitivity in Cancer (GDSC) database for drug sensitivity prediction of ST6GAL2.39
Animals and HCC Rat Model
Twelve 8-week-old male Wistar rats, weighing 273.4 ± 8.415 g (Mean ± SD) were purchased from Beijing Vital River Laboratory Animal Technology Co. Ltd (license: SCXK (Beijing) 2016–0006). The study was conducted by the Chinese National Standard for Laboratory Animals (GB14925-2010) and the ARRIVE guidelines. The Experimental Animal Ethics Committee of Dongzhimen Hospital, Beijing University of Traditional Chinese Medicine (No. 21–10) approved the study. The HCC rat model was constructed by intraperitoneal injection of diethylnitrosamine (Psaitong, N60001, 50 mg/kg/week, CN). The rats were randomly divided into control and model groups. The control rats were treated with saline by intraperitoneal injection. After sixteen weeks, the rats were sacrificed and livers were obtained for the next experiments.
Cell Culture and Stimulation
Human normal hepatocyte cell line LO2, human hepatic stellate cell line LX2, and human HCC cell lines (Huh7, HepG2, and HepG2.215) were purchased from the American Typical Culture Collection (Manassas, VA, USA) and cultured in Dulbecco’s Modified Eagle’s medium (DMEM) containing 10% fetal bovine serum (FBS), 100 U/mL penicillin and 100 μg/mL streptomycin. 37°C, 5% CO2, and humidity (between 50% and 60%) made up the culturing environment. Lipopolysaccharide (LPS, Solarbio, L8880, CN) was used to activate LO2 and LX2 cells for 24 hours with 100 ng/mL of final concentration.
Plasmids and Transfection
A human ST6GAL2 cDNA clone (NM_032528, 1590bp) was constructed into a GV657 vector, which can express wild-type ST6GAL2 protein with a Flag-tag in the C terminal. All plasmids were transfected into cells using lipofectamine 2000 (Invitrogen, Carlsbad, CA) following the instructions.
Cell Viability Assay
A total of 1×10⁴ cells were seeded in 96-well plates for duplications, after being incubated for 24 and 72 hours, a CCK-8 assay kit (Solarbio, CN) was carried out to assess the ability of cell growth by measuring the absorbance at the wavelength of 450 nm by the TECAN infinite M200 Multimode microplate reader (Tecan, Mechelen, Belgium).
Quantitative Reverse Transcription-PCR (qRT-PCR)
The qRT-PCR procedure and the associated kits were consistent with our previous study.40 The gene primer sequence is listed in Table 1.
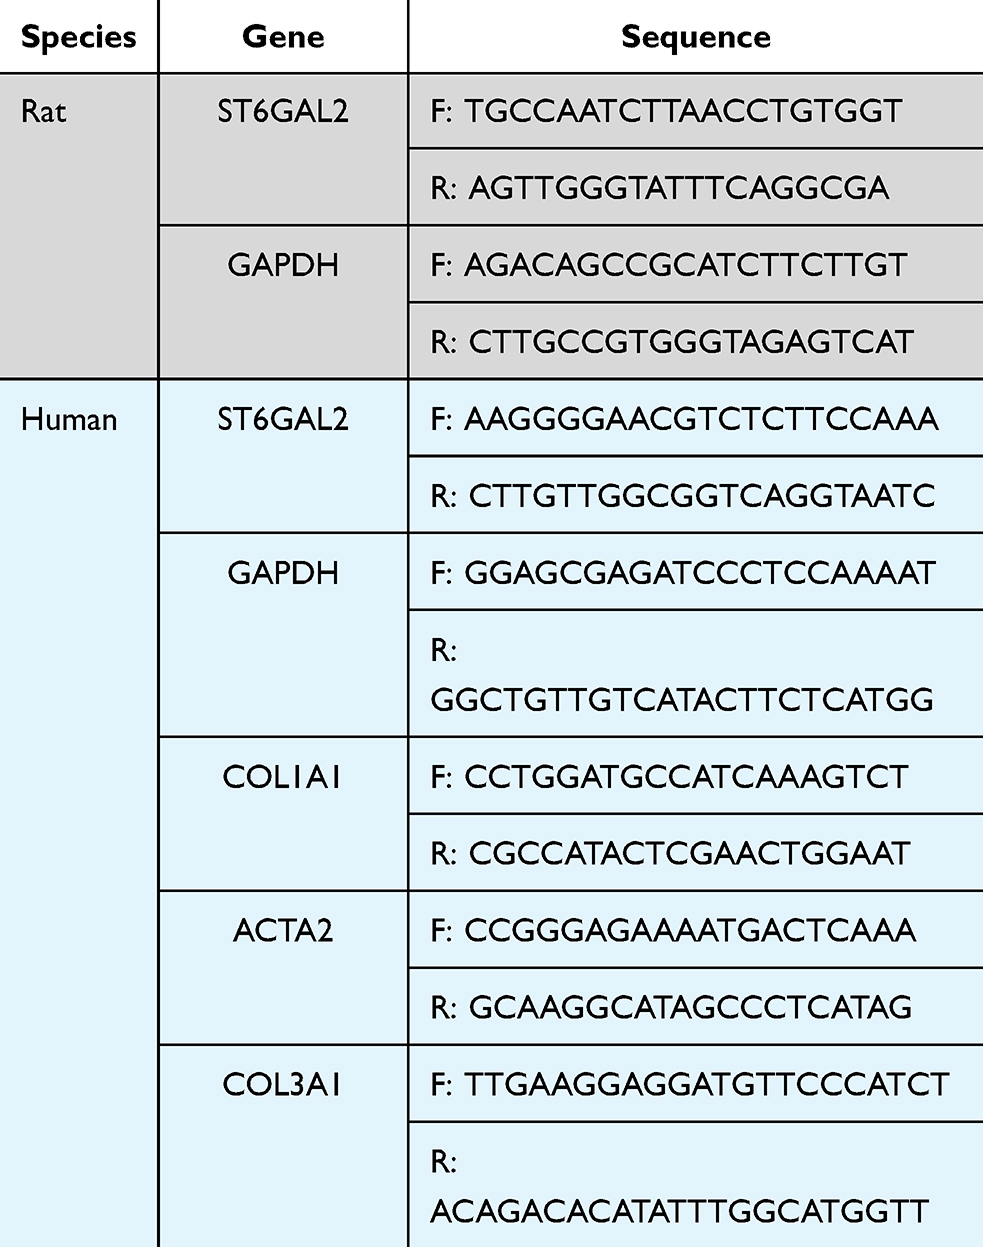 |
Table 1 The Gene Primer Sequence Was Used for qRT-PCR |
Western Blot
The procedure and reagents used in this Western blot (WB) experiment were consistent with previous studies.40 For Western blot, the protein lysates were separated by 10% sodium dodecyl sulfate-polyacrylamide gel electrophoresis (SDS-PAGE) (Epizyme Biomedical Technology, PG112, CN) and then electrophoretically transferred onto the polyvinylidene fluoride membranes (Epizyme Biomedical Technology, WJ001, CN). The antibodies utilized in this study were rabbit anti-ST6GAL2 (Proteintech, 28367-1-AP, 1:1000, US), mouse anti-GAPDH (MBL, M171-3, 1:5000, JPN), and mouse anti-β-ACTIN (Proteintech, 66009-1-Ig, 1:5000, US). Image J software was employed for subsequent analysis.
Statistics
The t-test and Wilcoxon rank sum test were utilized to compare the differences between the groups. Paired samples t-test was used for the comparison of differences between paired samples. All correlation analyses were performed using Spearman’s method. |R| > 0.1 was considered as correlations and P < 0.05 was considered statistically significant.
Results
ST6GAL2 Expression in HCC
In comparison to normal tissues, ST6GAL2 was downregulated in 15 cancer tissues, whereas it was increased in 12 other cancers (Figure 1A). Subsequently, we calculated the fold change of ST6GAL2 expression among normal and cancer tissues. Figure 1B demonstrated that ST6GAL2 was notably lower expressed in HCC tissues than average (fold = 0.133, P < 0.001). Besides, in paired specimens, ST6GAL2 in HCC tissues was notably downregulated than in adjacent tissues (P < 0.0001) (Figure 1C). The GSE25097 dataset, which contained sequencing data from 519 human liver samples,41 also demonstrated the downregulation of ST6GAL2 mRNA in HCC (Figure 1D). We further detected ST6GAL2 expression in the liver tissues of normal and HCC rats. According to qRT-PCR and WB analyses, ST6GAL2 expression was lower in HCC tissues than in normal tissues (Figure 1E and F). Immunohistochemical staining results from the HPA database were consistent with our findings (Figure 1G).
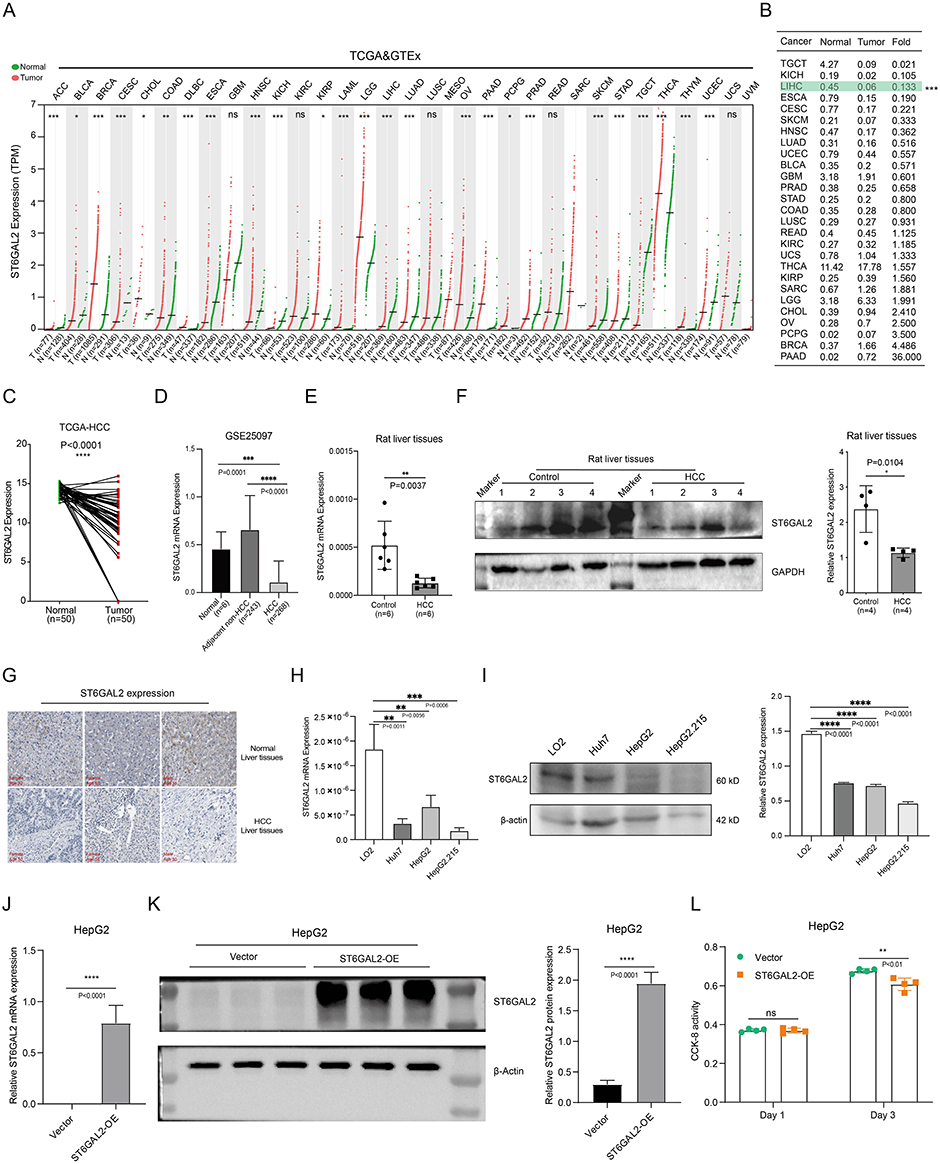 |
Figure 1 Expression of ST6GAL2 in HCC. (A) The ST6GAL2 mRNA expression of tumor and normal tissues in the TCGA and GTEx databases. (B) The folds of mean values of ST6GAL2 expression between normal and tumor tissues in different types of cancer. (C) ST6GAL2 expression in HCC (n = 50) and its paired adjacent tissues (n = 50). (D) The ST6GAL2 mRNA expression in normal (n = 10), adjacent non-HCC (n = 243), and HCC human liver tissues (n = 268) in the GSE25097 dataset. (E) The ST6GAL2 mRNA expression levels in normal liver tissues (n = 6) and HCC rat liver tissues (n = 6), GAPDH as the internal reference. (F) The ST6GAL2 protein expression in normal liver tissues (n = 4) and HCC rat liver tissues (n = 4), GAPDH as the internal reference. (G) The ST6GAL2 protein expression in normal and HCC liver tissues in the HPA database. (H, I) ST6GAL2 expression in normal hepatocytes and hepatoma cell lines on both mRNA and protein levels. (J, K) The vector and ST6GAL2 over-expression plasmids were transfected into HepG2 cells, and the mRNA expression of ST6GAL2 (J) and protein expression of ST6GAL2 (K) were detected. (L) After the vector and ST6GAL2 over-expression plasmids were transfected into HepG2 cells for 24 hours and 72 hours, the cell viability was detected by CCK-8 assay. *p < 0.05, **p < 0.01, ***p < 0.001, ****p < 0.0001. |
In addition, ST6GAL2 was markedly decreased in hepatoma cell lines (Huh7, HepG2, HepG2.215) compared to normal hepatocyte cell line LO2 by qRT-PCR and WB analyses (Figure 1H and I). To further explore the effect of ST6GAL2 expression on the cell viability of hepatoma cells, we constructed the ST6GAL1 over-expression plasmid and transfected it into HepG2 cells (Figure 1J and K). The results showed that ST6GAL2 overexpression did not affect the cell viability of HepG2 in 24 hours, while inhibited the cell viability of HepG2 in 72 hours (Figure 1L).
Diagnostic and Prognostic Value of ST6GAL2
The diagnostic utility of ST6GAL2 was assessed for different tumor types using ROC curve analysis. ST6GAL2 had a high clinical diagnostic value for HCC (AUC: 0.893, Cl: 0.863–0.923) (Figure 2A). In addition, ST6GAL2 also had an excellent diagnostic value (AUC>0.7) in 16 other tumors (Figure S1). Subsequently, the Kaplan-Meier survival analysis suggested high ST6GAL2 expression was related to good overall survival (OS) in HCC patients (Figure 2B). Furthermore, ST6GAL2 expression levels were remarkably related to OS in the other six tumors (Figure S2). The nomogram demonstrated the predictive ability of ST6GAL2 in combination with multiple clinical prognostic factors in HCC. A higher point on the nomogram represented a worse prognostic factor, which indicated that the nomograms may be better models for predicting survival in HCC patients than individual prognostic factors (Figure 2C and D).
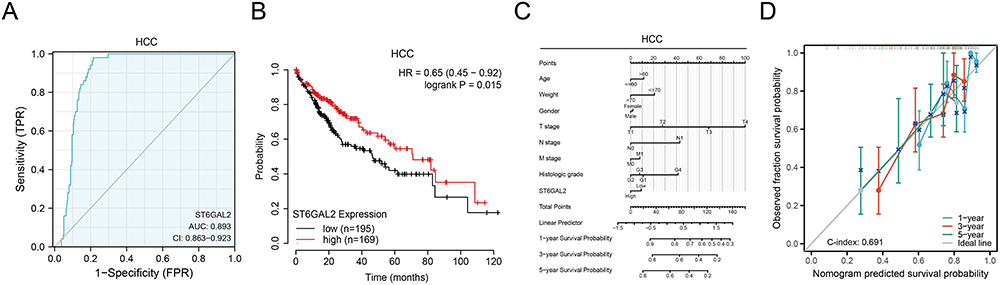 |
Figure 2 The diagnosis and prognosis value of ST6GAL2 in HCC. (A) The receiver operating characteristic curve of ST6GAL2 expression in HCC (n = 424). (B) The overall survival (OS) analysis between ST6GAL2 expression and HCC. (C) A nomogram that combines ST6GAL2 and other prognostic factors in HCC. (D) The calibration curve of the nomogram. |
Genetic Alterations of ST6GAL2 in HCC
In HCC, ST6GAL2 expression was not significantly different in the gene copy number variation (CNV) gain and deletion groups (Figure 3A). Subsequently, we found that a negative correlation existed between ST6GAL2 gene methylation and ST6GAL2 mRNA expression in HCC (r = −0.246, P < 0.0001) (Figure 3B). Meanwhile, the methylation level of the ST6GAL2 gene was notably higher in HCC tissues than in normal and paracancerous tissues (Figure 3C and D). Furthermore, the mutational landscape of ST6GAL2 in HCC was further explored. We found that 271 (75.7%) of 358 HCC samples had gene mutations, among which missense mutation was the most common variant classification, SNP was the most common variant type, and C>T was the most significant single-nucleotide variant (SNV) class (Figure 3E). The Waterfall plot showed that the genes with high mutation frequency were TP53, TTN CTNNB1, etc. (Figure 3F).
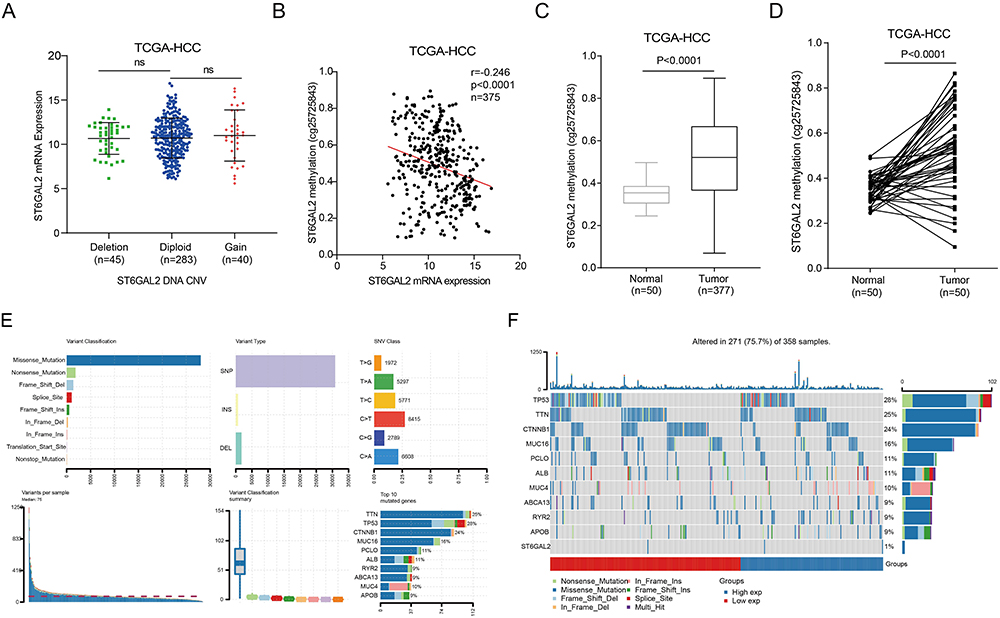 |
Figure 3 Genetic alterations of ST6GAL2 in HCC. (A) The ST6GAL2 mRNA expression in tumor tissues of gene copy neutral (n = 283), deletion (n = 45), and duplication (n = 40) groups in the TCGA-HCC database. ns: no significant difference. (B) The correlation between ST6GAL2 mRNA expression and gene methylation in HCC. (C) The ST6GAL2 methylation levels in HCC (n = 377) and its adjacent liver tissues (n = 50). (D) The ST6GAL2 methylation levels in HCC (n = 50) and its paired adjacent tissues (n = 50). (E) The information of variant classification, variant type, SNV class, variants per sample, variant classification summary, and top 10 mutated genes in HCC. (F) The mutation distribution of the top 10 mutated genes in ST6GAL2 high and low groups in HCC. |
Functional Enrichment Analysis of ST6GAL2-Related Differentially Expressed Genes (DEGs) in HCC
According to the expression of ST6GAL2, we first divided TCGA-HCC samples into ST6GAL2 low and high expression groups. Between the two groups, 562 DEGs were retrieved, comprising 115 downregulated DEGs and 447 upregulated DEGs (Figure 4A). There were 417 protein-encoding genes among the DEGs, and we then performed the Gene Ontology (GO) and Kyoto Encyclopedia of Genes and Genomes (KEGG) functional enrichment analysis. The GO analysis revealed that these DEGs were mainly enriched in extracellular structure organization, collagen−containing extracellular matrix, and extracellular matrix structural constituents (Figure 4B). These DEGs were mainly related to the PI3K-Akt signaling pathway, human papillomavirus infection, focal adhesion, protein digestion and absorption, and ECM-receptor interaction pathways (Figure 4C). Subsequently, we constructed two hub gene sets from these DEGs by cytoscape’s MCODE component and cytoscape’s cytoHubba component, respectively (Figure 4D, 4E). We took the intersection of these two gene sets and finally obtained 17 overlapped hub genes (Figure 4F). Subsequently, we revealed a remarkable positive association between ST6GAL2 and all 17 hub genes (Figure S3A). In addition, the enrichment analysis results of 17 hub genes were similar to those of ST6GAL2-DEGs (Figure S3B). These results suggested that ST6GAL2 might regulate the PI3K-Akt signaling pathway and the ECM receptor pathway through the hub genes, as mentioned above, which ultimately affected the progression of HCC.
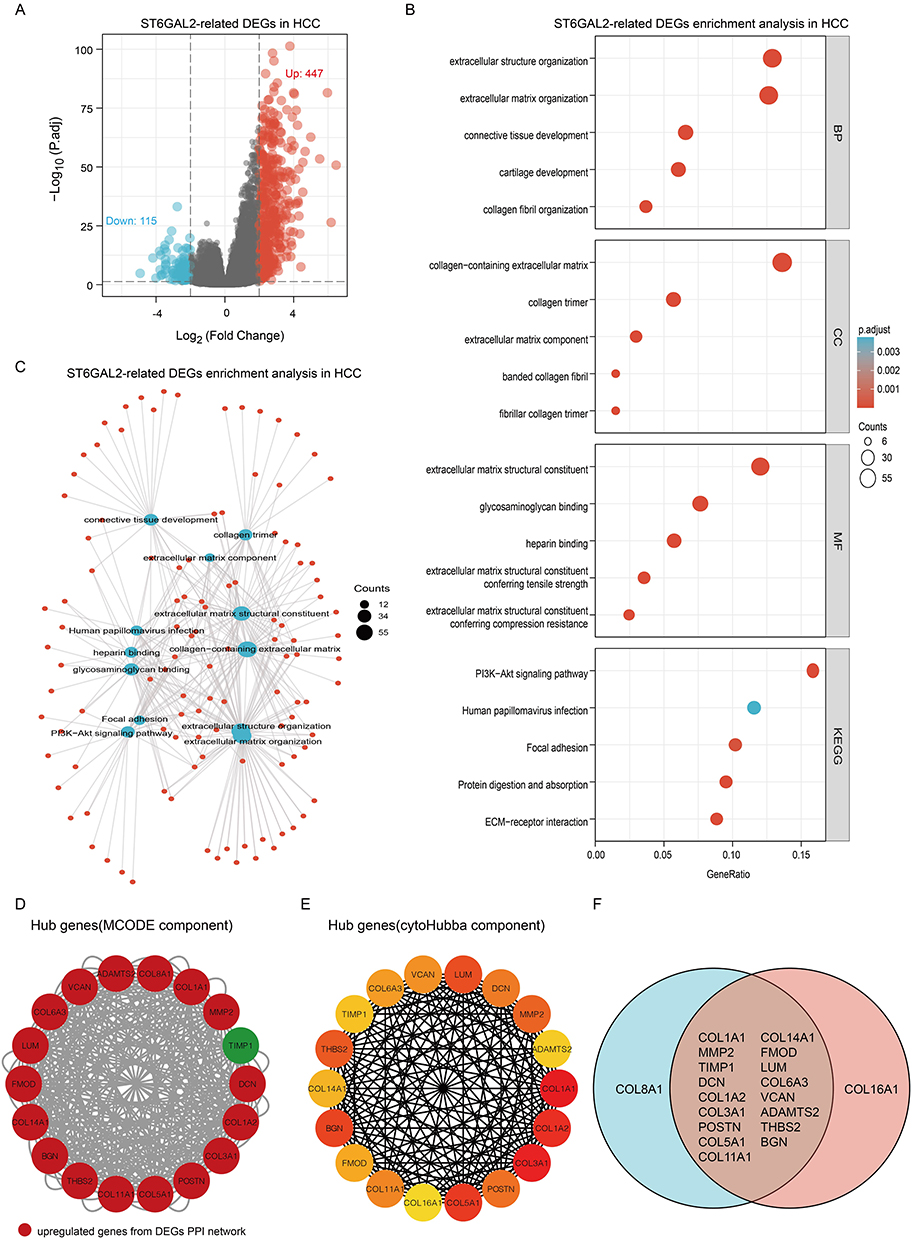 |
Figure 4 Functional enrichment analysis of ST6GAL2-related DEGs in HCC. (A) Volcano plot of ST6GAL2 related DEGs. (B, C) GO and KEGG functional enrichment analysis of ST6GAL2-related DEGs. (D) Hub genes were selected from the PPI network of ST6GAL2-related DEGs by the MCODE component (red: upregulated DEGs genes of the PPI network). (E) Hub genes were selected from the PPI network of ST6GAL2-related DEGs by the cytoHubba component. (F) The intersection of two sets of hub genes. |
ST6GAL2 Regulates Immune Cell Infiltration (ICI) in HCC
For ICI analysis, a higher enrichment score indicates that the immune cell is more abundant in the sample analyzed.42 For HCC, the enrichment scores of B cells, T cells, CD8+ T cells, TFH cells, DCs, macrophages, mast cells, neutrophils, and NK cells were remarkably upregulated in high ST6GAL2 expression group compared with low ST6GAL2 expression group (Figure 5A) and positively correlated to ST6GAL2 expression (Figure 5B). The detailed information on association analysis between ST6GAL2 and gene markers of immune cells or different types of T cells was in Tables S1 and S2. Because immunomodulators have a large impact on the immunological microenvironment, we investigated the relationship between ST6GAL2 and immunostimulator/immune inhibitor in HCC. Results suggested that ST6GAL2 was positively related to most immunomodulators in HCC (Figure 5C). Among the immunostimulators, ST6GAL2 positively correlated with TMEM173 and CXCL12 in HCC (Figure 5D).
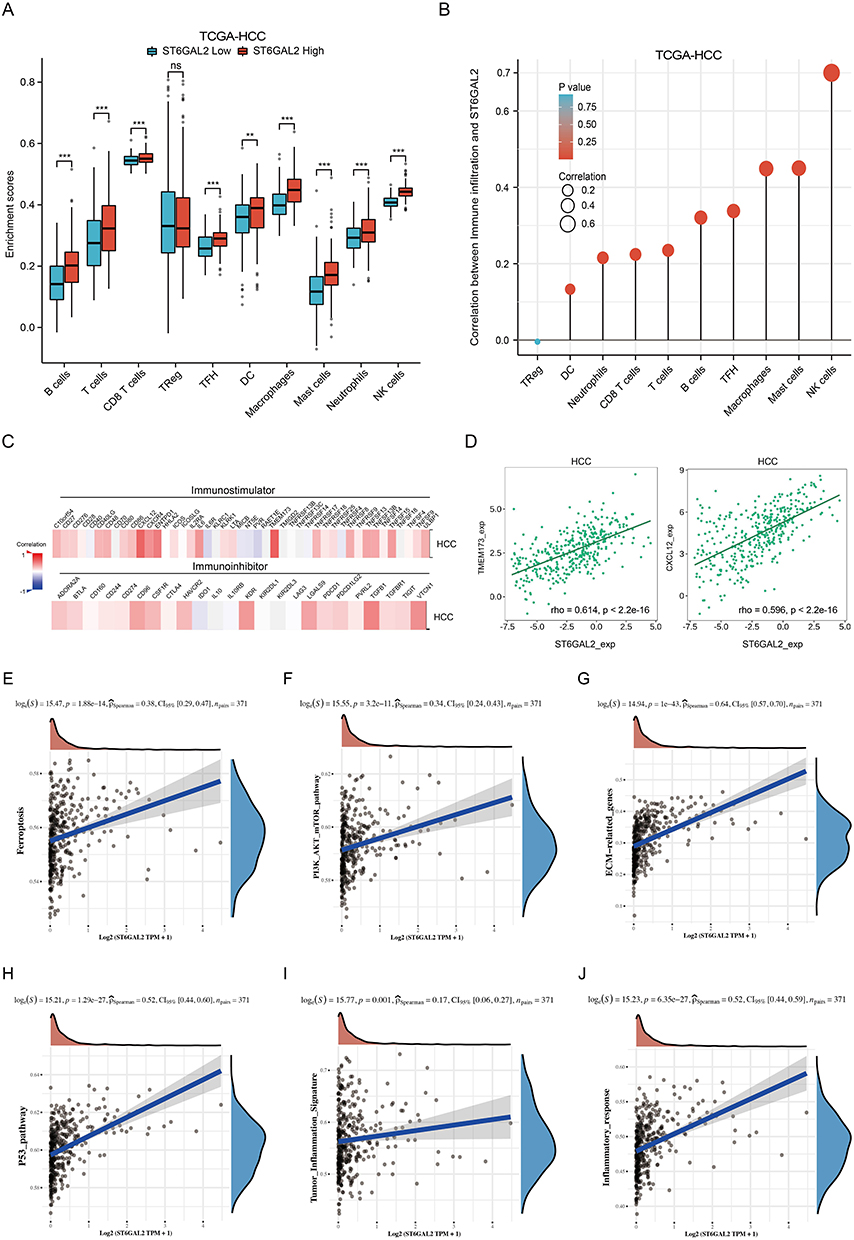 |
Figure 5 ST6GAL2 expression correlates with immune cell infiltration. (A) Immune cell infiltration levels of high- and low-ST6GAL2 expression groups in HCC. (B) Correlation between ST6GAL2 mRNA expression and immune cell infiltration in HCC. (C) Correlation between ST6GAL2 mRNA expression and immunostimulators or immunoinhibitors in HCC. (D) Correlation between ST6GAL2 mRNA expression and TMEM173 and CXCL12 in HCC. (E-J) The relationship between ST6GAL2 and ferroptosis (E), PI3K-AKT (F), ECM (G), P53 (H), tumor inflammation signature (I), and inflammatory response (J) pathways. **p < 0.01, ***p < 0.001, ns: no significant difference. |
Consequently, GSVA analysis suggested that ST6GAL2 was remarkably positively related to ferroptosis, PI3K-AKT, ECM, and P53 pathways, indicating that ST6GAL2 was significant in the invasion and migration of HCC (Figure 5E-H). Moreover, ST6GAL2 also displayed a remarkably positive relation to tumor inflammation signature and inflammatory response pathways, indicating that ST6GAL2 was strongly correlated with ICI in HCC (Figure 5I and J).
ST6GAL2’s Expression Correlates to Liver Inflammation
Next, we investigated how ST6GAL2 expression is linked to inflammation in the liver. First, the correlation of ST6GAL2 with serum hepatic inflammatory indicators of alanine aminotransferase (ALT) and aspartate aminotransferase (AST) was analyzed in two GEO datasets.43,44 In both the GSE83148 and GSE84044 datasets, ST6GAL2 was more highly expressed in the ALT- and AST-high-level group than in the ALT- and AST-low-level group (Figure 6A-D).
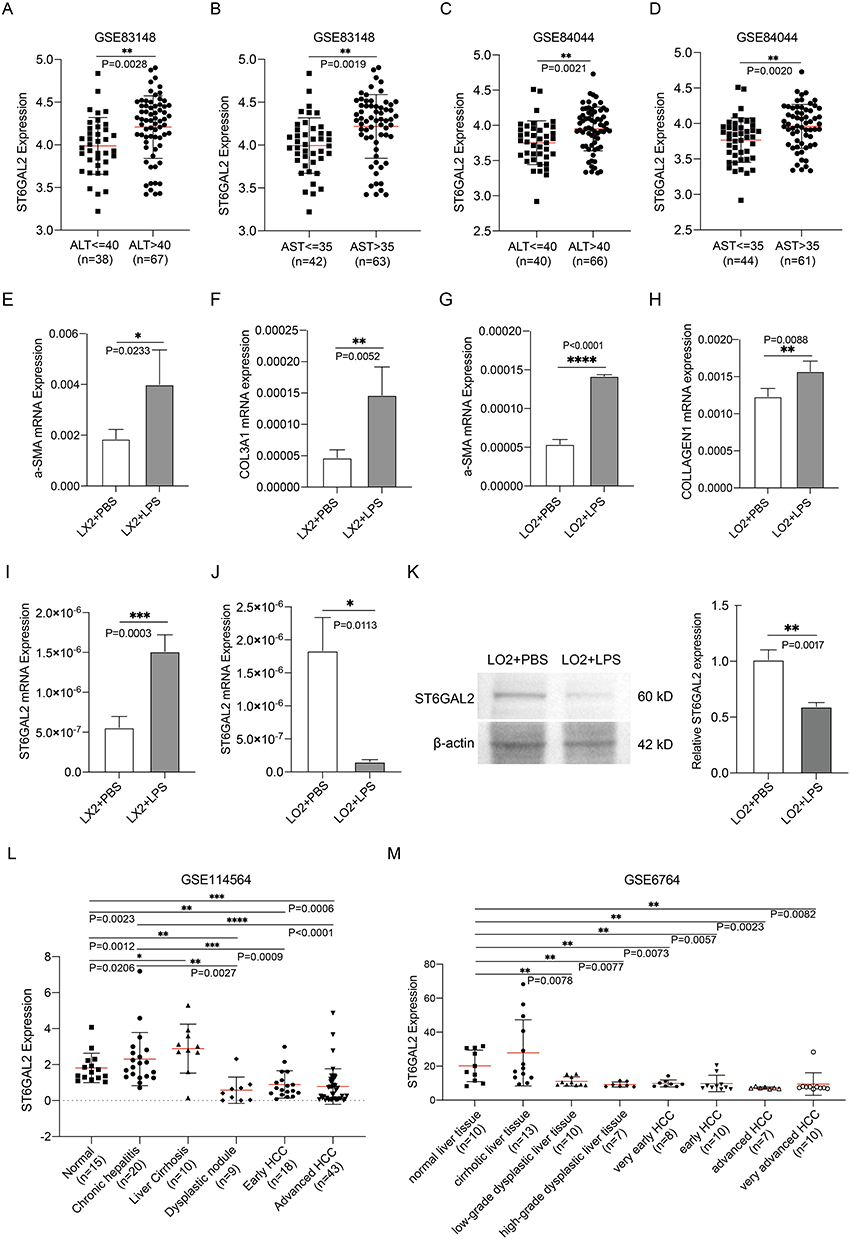 |
Figure 6 ST6GAL2’s expression correlates to the liver inflammation. (A-D) Correlation between ST6GAL2 mRNA expression and ALT, and AST levels in the GSE83148 and GSE84044 databases. (E-H) Changes in ACTA2, COL3A1, and COL1A1 expression in LX2 and LO2 cells after stimulation by LPS. (I-K) Changes in ST6GAL2 mRNA and protein expression in LX2 and LO2 cells after stimulated by LPS. (L) ST6GAL2 expression of normal liver, chronic hepatitis, liver cirrhosis, early HCC, and advanced HCC in GSE114564 dataset. (M) ST6GAL2 expression of normal liver, cirrhotic livers, low-grade dysplastic liver, high-grade dysplastic liver, very early HCC, early HCC, advanced HCC, and very advanced HCC in GSE6764 dataset. *p < 0.05, **p < 0.01, ***p < 0.001, ****p < 0.0001. |
To further validate the above speculation, we stimulated LX2 and LO2 cells with lipopolysaccharide (LPS) respectively, and detected the expression of ST6GAL2. After LPS stimulation, ACTA2, COL1A1, and COL3A1 mRNA expression were significantly elevated in LX2 and LO2 cells, which indicated inflammatory response occurrence (Figure 6E-H). Moreover, ST6GAL2 was notably upregulated in LX2 cells and downregulated in LO2 cells upon LPS stimulation (Figure 6I-K). Since HCC develops over time,45 we looked into how ST6GAL2 levels changed at various stages of liver disease. We discovered that ST6GAL2 was increased in the inflammatory stage and progressively decreased after entering the cancer stage (Figure 6L and M). The above results suggested that ST6GAL2 might be related to liver inflammation and influenced the procession of HCC.
Immunotherapy Response and Sensitivity Drug Prediction for ST6GAL2
To comprehensively evaluate the promise of ST6GAL2 as a novel immune-related target, we explored the response of ST6GAL2 to ICB therapy in different cohorts. The results showed that ST6GAL2 significantly predicted immunotherapeutic response in 2 mouse immunotherapy cohorts (Figure 7A). Next, results compared with recognized immunotherapy response biomarkers showed that in 7 of 25 immunotherapy cohorts, the AUC for ST6GAL2 alone exceeded 0.5. Furthermore, ST6GAL2 showed the same predictive value as B. clonality (Figure 7B). Sensitivity drug prediction results suggested that ST6GAL2 was positively related to 17-AAG, AZD8055, and Phenformin in the GDSC database (Figure 7C). The immunosuppressive milieu could be reversed by 17-AAG as an immunogenic cell death inducer, facilitating checkpoint blockade treatment.46
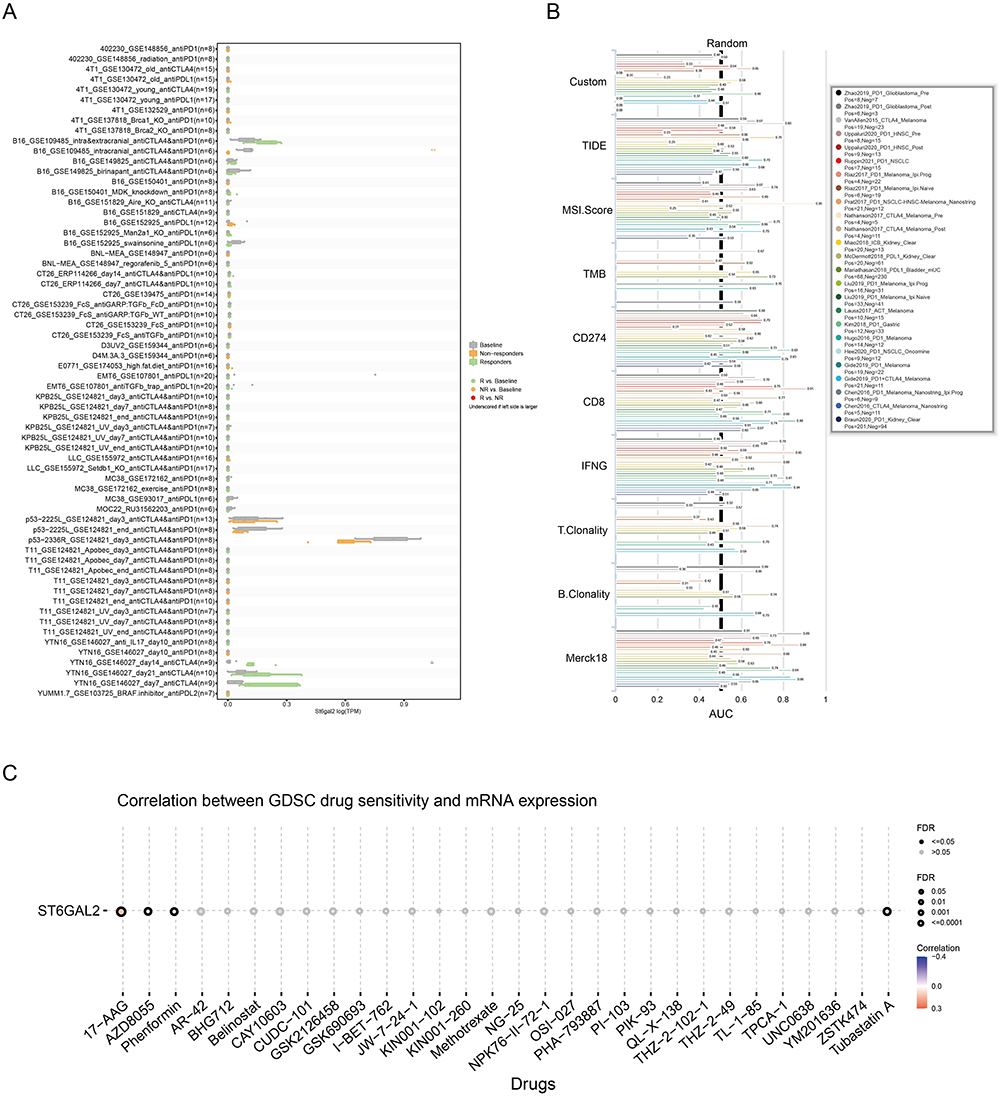 |
Figure 7 Immunotherapy response, biomarker evaluation, and sensitive drug prediction of ST6GAL2 in pan-cancer. (A, B) Immunotherapy response (A) and biomarker evaluation (B) of ST6GAL2 in immunotherapy cohorts. (C) Sensitive drug prediction of ST6GAL2 in pan-cancer based on the GDSC dataset. |
Discussion
Existing studies have demonstrated that abnormal sialylation was a common alteration in tumors and could affect tumor cell invasion, dissociation, angiogenesis, metastasis, immune modulation, and cell-matrix interactions.2,4,47 In recent years, ST6GAL2, a key regulator of sialylation, has gradually gained attention in carcinogenesis, but its function has yet to be elucidated. Here, we first found that in tissue levels, the expression of ST6GAL2 significantly downregulated in HCC, which predicted a poorer prognosis for HCC patients. At the cell level, we found that compared to the normal hepatocytes, ST6GAL2 is downregulated in hepatoma cells. Overexpressed ST6GAL2 in hepatoma cells exerted an inhibiting effect on cell viability, which indicated that ST6GAL2 might exert anti-HCC function by regulating hepatoma cells’ proliferation. However, there should be more in vitro and in vivo experiments to study.
To explain ST6GAL2 expression change in HCC, we analyzed epigenetic modification and genic change of ST6GAL2 and found that a strong inverse relationship between ST6GAL2 expression and gene methylation in HCC existed. Meanwhile, aberrant DNA methylation is an essential epigenetic regulator driving tumor progression, and DNA methylation analysis could be a novel adjunct to improve the accuracy of pathological diagnosis.48 Thus, ST6GAL2 gene methylation is also a potential pathological diagnostic indicator in HCC, which needs further study.
Our enrichment analysis indicated that ST6GAL2 might impact the development of HCC by regulating the ECM. It has been confirmed that ECM promotes cancer growth and spread by promoting cancer cell proliferation, migration, invasion, angiogenesis, and immune evasion.49 For HCC, overproduction of ECM components increases stromal stiffness and thus causes an increase in VEGF expression in HCC cells, thereby increasing cancer development and aggressiveness.50 In addition, ECM sclerosis promoted cancer drug resistance, suggesting that ECM hardness was a determinant of response to pathway-targeted anticancer agents.49 Focal adhesion and PI3K-Akt signaling pathways were also enriched, which were involved in regulating HCC growth, metabolism, proliferation, and metastasis.51–53 Focal adhesion signaling mediates ECM signaling to tumor cells and promotes activation of the PI3K-Akt signaling pathway, thereby increasing glycolysis and regulating tumor cell metabolism.54,55 These results further revealed that ST6GAL2’s function in tumors was correlated to regulating ECM and downstream signaling pathways.
TME is essential for tumorigenesis, development, metastasis, and therapeutic response, and the infiltration and activation status of immune cells could greatly influence their function.56,57 The higher density of tumor-infiltrating T and B cells was related to smaller tumor size, good differentiation, and better clinical outcomes in HCC.58,59 The closeness of tumor-infiltrating T and B cells contributed to a better prognosis for HCC patients.60 In addition, the immune-high subtype in the immune microenvironment of HCC is distinguished by increased infiltration of B and T cells.61 For DC, it is a central player in adaptive immune response, which can reduce cancer progression and improve patients’ survival by inducing B cell and T cell responses.62 Besides, positive associations existed between ST6GAL2 expression and infiltration of neutrophils, macrophages, NK cells, and mast cells. However, the regulation of ST6GAL2 in intrahepatic immune cells and HCC TME should be further explored in vivo and in vitro experiments.
We also found that in the hepatitis stage, ST6GAL2 expression was positively correlated to the levels of liver inflammation at the tissue level. Furthermore, at the cell level, ST6GAL2 expression was significantly upregulated in LPS-stimulated LX2 cells. Based on this, we speculated that downregulated ST6GAL2 exerted an inhibiting inflammation effect during the transformation of inflammation to HCC, and accompanied by a disrupted immune homeostasis in the liver. Meanwhile, the strong association between ST6GAL2 and ICB indicated that ST6GAL2 might be a promising target for immunotherapeutic response. The drug sensitivity prediction analysis on ST6GAL2 demonstrated that it was a promising target for cancer therapy and could contribute to studying anti-cancer drug resistance mechanisms.
Conclusions
In conclusion, ST6GAL2 is significantly downregulated in HCC tissues and has a high diagnostic and prognostic value for HCC and a close relationship with tumor immunity regulatory mechanisms. This evidence suggested that ST6GAL2 has the potential to be a viable target for cancer immunotherapy as well as a novel immune-related biomarker for HCC diagnosis and prognosis.
Data Sharing Statement
The datasets presented in this study can be found in online repositories. The names of the repository/repositories can be found in the article. The article and Supplementary materials include all data generated or analyzed during this study. Further inquiries can be directed to the corresponding author.
Ethics Approval and Informed Consent
The study was conducted according to the guidelines of the Declaration of Helsinki, and approved by the Institutional Review Board of the Animal Research Ethics Board of Beijing University of Chinese medicine Dongzhimen Hospital (Approval No: 21-10). The study was carried out in compliance with the ARRIVE guidelines. Research on human data was approved by the Ethics Committee of Dongzhimen Hospital Affiliated to Beijing University of Chinese Medicine as exempt from ethical review on the grounds that the activity of using bioinformatics methods to study publicly available data does not cause harm to humans, does not involve sensitive personal information or commercial interests, and therefore the research does not require ethical approval.
Funding
This work was supported by the Fundamental Research Funds for the Central Universities, Beijing University of Chinese Medicine (No. 2021-JYB-XJSJJ-055), Wu Jieping Medical Foundation Clinical Research Special Grant Fund (No. 601574sb), and Horizontal Research Funds of Dongzhimen Hospital, Beijing University of Chinese Medicine (HX-DZM-202343).
Disclosure
The authors declare no conflicts of interest in this work.
References
1. Sung H, Ferlay J, Siegel RL, et al. Global Cancer Statistics 2020: GLOBOCAN Estimates of Incidence and Mortality Worldwide for 36 Cancers in 185 Countries. CA Cancer J Clin. 2021;71(3):209–249. doi:10.3322/caac.21660
2. Chandler KB, Costello CE, Rahimi N. Glycosylation in the Tumor Microenvironment: implications for Tumor Angiogenesis and Metastasis. Cells. 2019;8(6). doi:10.3390/cells8060544
3. Pearce OM, Läubli H. Sialic acids in cancer biology and immunity. Glycobiology. 2016;26(2):111–128. doi:10.1093/glycob/cwv097
4. Reily C, Stewart TJ, Renfrow MB, Novak J. Glycosylation in health and disease. Nat Rev Nephrol. 2019;15(6):346–366.
5. Matsubara N, Imamura A, Yonemizu T, et al. CD22-Binding Synthetic Sialosides Regulate B Lymphocyte Proliferation Through CD22 Ligand-Dependent and Independent Pathways, and Enhance Antibody Production in Mice. Front Immunol. 2018;9:820. doi:10.3389/fimmu.2018.00820
6. Giovannone N, Liang J, Antonopoulos A, et al. Galectin-9 suppresses B cell receptor signaling and is regulated by I-branching of N-glycans. Nat Commun. 2018;9(1):3287. doi:10.1038/s41467-018-05770-9
7. Tsai CH, Tzeng SF, Chao TK, et al. Metastatic Progression of Prostate Cancer Is Mediated by Autonomous Binding of Galectin-4-O-Glycan to Cancer Cells. Cancer Res. 2016;76(19):5756–5767. doi:10.1158/0008-5472.CAN-16-0641
8. Tzeng SF, Tsai CH, Chao TK, et al. O-Glycosylation-mediated signaling circuit drives metastatic castration-resistant prostate cancer. FASEB j;2018. fj201800687. doi:10.1096/fj.201800687
9. Chou CH, Huang MJ, Chen CH, et al. Up-regulation of C1GALT1 promotes breast cancer cell growth through MUC1-C signaling pathway. Oncotarget. 2015;6(8):6123–6135. doi:10.18632/oncotarget.3045
10. Isaji T, Im S, Kameyama A, Wang Y, Fukuda T, Gu J. A complex between phosphatidylinositol 4-kinase IIα and integrin α3β1 is required for -glycan sialylation in cancer cells. J Biol Chem. 2019;294(12):4425–4436. doi:10.1074/jbc.RA118.005208
11. Lee M, Park JJ, Ko YG, Lee YS. Cleavage of ST6Gal I by radiation-induced BACE1 inhibits Golgi-anchored ST6Gal I-mediated sialylation of integrin β1 and migration in colon cancer cells. Radiat Oncol. 2012;7:47. doi:10.1186/1748-717X-7-47
12. Oswald DM, Zhou JY, Jones MB, Cobb BA. Disruption of hepatocyte Sialylation drives a T cell-dependent pro-inflammatory immune tone. Glycoconjugate J. 2020;37(3):395–407. doi:10.1007/s10719-020-09918-y
13. Wu Q, Yang Y, Xie D, et al. The sialylation profile of IgG determines the efficiency of antibody directed osteogenic differentiation of iMSCs by modulating local immune responses and osteoclastogenesis. Acta Biomater. 2020;114:221–232. doi:10.1016/j.actbio.2020.07.055
14. Lin WD, Fan TC, Hung JT, et al. Sialylation of CD55 by ST3GAL1 Facilitates Immune Evasion in Cancer. Cancer Immunol Res. 2021;9(1):113–122. doi:10.1158/2326-6066.CIR-20-0203
15. Bhide GP, Colley KJ. Sialylation of N-glycans: mechanism, cellular compartmentalization and function. Histochem Cell Biol. 2017;147(2):149–174. doi:10.1007/s00418-016-1520-x
16. Vajaria BN, Patel KR, Begum R, Patel PS. Sialylation: an Avenue to Target Cancer Cells. Pathol Oncol Res. 2016;22(3):443–447. doi:10.1007/s12253-015-0033-6
17. Perez S, Fu CW, Li WS. Sialyltransferase Inhibitors for the Treatment of Cancer Metastasis: current Challenges and Future Perspectives. Molecules. 2021;26(18):5673. doi:10.3390/molecules26185673
18. Dall’Olio F, Chiricolo M. Sialyltransferases in cancer. Glycoconjugate J. 2001;18(11–12):841–850. doi:10.1023/a:1022288022969
19. Mereiter S, Balmaña M, Campos D, Gomes J, Reis CA. Glycosylation in the Era of Cancer-Targeted Therapy: where Are We Heading? Cancer Cell. 2019;36(1):6–16. doi:10.1016/j.ccell.2019.06.006
20. Hugonnet M, Singh P, Haas Q, von Gunten S. The Distinct Roles of Sialyltransferases in Cancer Biology and Onco-Immunology. Int J Med. 2021;12.
21. Krzewinski-Recchi MA, Julien S, Juliant S, et al. Identification and functional expression of a second human beta-galactoside alpha 2,6-sialyltransferase, ST6Gal II. Eur J Biochem. 2003;270(5):950–961. doi:10.1046/j.1432-1033.2003.03458.x
22. Takashima S, Tsuji S, Tsujimoto M. Comparison of the enzymatic properties of mouse beta-galactoside alpha 2,6-sialyltransferases, ST6Gal I and II. J Biochem. 2003;134(2):287–296. doi:10.1093/jb/mvg142
23. Rohfritsch PF, Joosten JAF, Krzewinski-Recchi M-A, et al. Probing the substrate specificity of four different sialyltransferases using synthetic beta-D-Galp-(1-->4)-beta-D-GlcpNAc-(1-->2)-alpha-D-Manp-(1-->O) (CH(2))7CH3 analogues general activating effect of replacing N-acetylglucosamine by N-propionylglucosamine. Biochim Biophys Acta. 2006;1760(4):685–692. doi:10.1016/j.bbagen.2005.12.012
24. Jame-Chenarboo F, Ng HH, Macdonald D, Mahal LK. High-Throughput Analysis Reveals miRNA Upregulating α-2,6-Sialic Acid through Direct miRNA-mRNA Interactions. ACS Cent. Sci. 2022;8(11):1527–1536. doi:10.1021/acscentsci.2c00748
25. Xu G, Chen J, Wang G, et al. Resveratrol Inhibits the Tumorigenesis of Follicular Thyroid Cancer via ST6GAL2-Regulated Activation of the Hippo Signaling Pathway. Mol Ther Oncolytics. 2020;16:124–133. doi:10.1016/j.omto.2019.12.010
26. Liang L, Xu J, Wang M, et al. LncRNA HCP5 promotes follicular thyroid carcinoma progression via miRNAs sponge. Cell Death Dis. 2018;9(3):372. doi:10.1038/s41419-018-0382-7
27. Liang A, Zhou B, Sun W. Integrated genomic characterization of cancer genes in glioma. Cancer Cell Int. 2017;17(1):90. doi:10.1186/s12935-017-0458-y
28. Liu RJ, Cao X, Liang YJ, Du HB, Zao XB, Ye YA. ST6GAL2 IS A NOVEL PROGNOSTIC BIOMARKER AND ITS EXPRESSION CORRELATES TO IMMUNE CELL INFILTRATION IN HEPATOCELLULAR CARCINOMA. HEPATOLOGY. 2022;76:S1339–S1339.
29. Vivian J, Rao AA, Nothaft FA, et al. Toil enables reproducible, open source, big biomedical data analyses. Nat Biotechnol. 2017;35(4):314–316. doi:10.1038/nbt.3772
30. Li C, Tang Z, Zhang W, Ye Z, Liu F. GEPIA2021: integrating multiple deconvolution-based analysis into GEPIA. Nucleic Acids Res. 2021;49(W1):W242–W246. doi:10.1093/nar/gkab418
31. Liu J, Lichtenberg T, Hoadley KA, et al. An Integrated TCGA Pan-Cancer Clinical Data Resource to Drive High-Quality Survival Outcome Analytics. Cell. 2018;173(2).
32. Koch A, Jeschke J, Van Criekinge W, van Engeland M, De Meyer T. MEXPRESS update 2019. Nucleic Acids Res. 2019;47(W1):W561–W565. doi:10.1093/nar/gkz445
33. Koch A, De Meyer T, Jeschke J, Van Criekinge W. MEXPRESS: visualizing expression, DNA methylation and clinical TCGA data. BMC Genomics. 2015;16(1):636. doi:10.1186/s12864-015-1847-z
34. Love MI, Huber W, Anders S. Moderated estimation of fold change and dispersion for RNA-seq data with DESeq2. Genome Biol. 2014;15(12):550. doi:10.1186/s13059-014-0550-8
35. Yu G, Wang LG, Han Y, He QY. clusterProfiler: an R package for comparing biological themes among gene clusters. Omics. 2012;16(5):284–287. doi:10.1089/omi.2011.0118
36. Hänzelmann S, Castelo R, Guinney J. GSVA: gene set variation analysis for microarray and RNA-seq data. BMC Bioinf. 2013;14(1):7. doi:10.1186/1471-2105-14-7
37. Ru B, Wong CN, Tong Y, et al. TISIDB: an integrated repository portal for tumor-immune system interactions. Bioinformatics. 2019;35(20):4200–4202. doi:10.1093/bioinformatics/btz210
38. Zeng Z, Wong CJ, Yang L, et al. TISMO: syngeneic mouse tumor database to model tumor immunity and immunotherapy response. Nucleic Acids Res. 2022;50(D1):D1391–D1397. doi:10.1093/nar/gkab804
39. Liu C-J, F-F H, Xie G-Y, et al. GSCA: an integrated platform for gene set cancer analysis at genomic, pharmacogenomic and immunogenomic levels. Brief Bioinform. 2022. doi:10.1093/bib/bbac310
40. Liu R, Cao X, Liang Y, et al. Downregulation of ST6GAL1 Promotes Liver Inflammation and Predicts Adverse Prognosis in Hepatocellular Carcinoma. J Inflamm Res. 2022;15:5801–5814. doi:10.2147/JIR.S385491
41. Neumann O, Kesselmeier M, Geffers R, et al. Methylome analysis and integrative profiling of human HCCs identify novel protumorigenic factors. Hepatology. 2012;56(5):1817–1827. doi:10.1002/hep.25870
42. Zuo S, Wei M, Wang S, Dong J, Wei J. Pan-Cancer Analysis of Immune Cell Infiltration Identifies a Prognostic Immune-Cell Characteristic Score (ICCS) in Lung Adenocarcinoma. Front Immunol. 2020;11:1218. doi:10.3389/fimmu.2020.01218
43. Zhou W, Ma Y, Zhang J, et al. Predictive model for inflammation grades of chronic hepatitis B: large-scale analysis of clinical parameters and gene expressions. Liver Int. 2017;37(11):1632–1641. doi:10.1111/liv.13427
44. Wang M, Gong Q, Zhang J, et al. Characterization of gene expression profiles in HBV-related liver fibrosis patients and identification of ITGBL1 as a key regulator of fibrogenesis. Sci Rep. 2017;7(1):43446. doi:10.1038/srep43446
45. Wurmbach E, Chen Y-B, Khitrov G, et al. Genome-wide molecular profiles of HCV-induced dysplasia and hepatocellular carcinoma. Hepatology. 2007;45(4):938–947. doi:10.1002/hep.21622
46. Liu Y, Qiu N, Shen L, et al. Nanocarrier-mediated immunogenic chemotherapy for triple negative breast cancer. J Control Release. 2020;323:431–441. doi:10.1016/j.jconrel.2020.04.040
47. Pinho SS, Reis CA. Glycosylation in cancer: mechanisms and clinical implications. Nat Rev Cancer. 2015;15(9):540–555. doi:10.1038/nrc3982
48. Papanicolau-Sengos A, Aldape K. DNA Methylation Profiling: an Emerging Paradigm for Cancer Diagnosis. Ann Rev Pathol. 2022;17:295–321. doi:10.1146/annurev-pathol-042220-022304
49. Jiang Y, Zhang H, Wang J, Liu Y, Luo T, Hua H. Targeting extracellular matrix stiffness and mechanotransducers to improve cancer therapy. J Hematol Oncol. 2022;15(1):34. doi:10.1186/s13045-022-01252-0
50. Dong Y, Xie X, Wang Z, et al. Increasing matrix stiffness upregulates vascular endothelial growth factor expression in hepatocellular carcinoma cells mediated by integrin β1. Biochem Biophys Res Commun. 2014;444(3):427–432. doi:10.1016/j.bbrc.2014.01.079
51. Wu Y, Zhang Y, Qin X, Geng H, Zuo D, Zhao Q. PI3K/AKT/mTOR pathway-related long non-coding RNAs: roles and mechanisms in hepatocellular carcinoma. Pharmacol Res. 2020;160:105195. doi:10.1016/j.phrs.2020.105195
52. Ma XL, Shen MN, Hu B, et al. CD73 promotes hepatocellular carcinoma progression and metastasis via activating PI3K/AKT signaling by inducing Rap1-mediated membrane localization of P110β and predicts poor prognosis. J Hematol Oncol. 2019;12(1):37. doi:10.1186/s13045-019-0724-7
53. Sun F, Wang J, Sun Q, et al. Interleukin-8 promotes integrin β3 upregulation and cell invasion through PI3K/Akt pathway in hepatocellular carcinoma. J Exp Clin Cancer Res. 2019;38(1):449. doi:10.1186/s13046-019-1455-x
54. Vander Heiden MG, Cantley LC, Thompson CB. Understanding the Warburg effect: the metabolic requirements of cell proliferation. Science. 2009;324(5930):1029–1033. doi:10.1126/science.1160809
55. Elstrom RL, Bauer DE, Buzzai M, et al. Akt stimulates aerobic glycolysis in cancer cells. Cancer Res. 2004;64(11):3892–3899. doi:10.1158/0008-5472.CAN-03-2904
56. Fu T, Dai L-J, S-Y W, et al. Spatial architecture of the immune microenvironment orchestrates tumor immunity and therapeutic response. J Hematol Oncol. 2021;14(1):98. doi:10.1186/s13045-021-01103-4
57. Gajewski TF, Schreiber H, Fu Y-X. Innate and adaptive immune cells in the tumor microenvironment. Nat Immunol. 2013;14(10):1014–1022. doi:10.1038/ni.2703
58. Zhang Z, Ma L, Goswami S, et al. Landscape of infiltrating B cells and their clinical significance in human hepatocellular carcinoma. Oncoimmunology. 2019;8(4):56.
59. Hofmann M, Tauber C, Hensel N, Thimme R. CD8(+) T Cell Responses during HCV Infection and HCC. J Clin Med. 2021;10(5):991. doi:10.3390/jcm10050991
60. Garnelo M, Tan A, Her Z, et al. Interaction between tumour-infiltrating B cells and T cells controls the progression of hepatocellular carcinoma. Gut. 2017;66(2):342–351. doi:10.1136/gutjnl-2015-310814
61. Kurebayashi Y, Ojima H, Tsujikawa H, et al. Landscape of immune microenvironment in hepatocellular carcinoma and its additional impact on histological and molecular classification. Hepatology. 2018;68(3):1025–1041. doi:10.1002/hep.29904
62. Verneau J, Sautés-Fridman C, Sun CM. Dendritic cells in the tumor microenvironment: prognostic and theranostic impact. Semin Immunol. 2020;48:101410. doi:10.1016/j.smim.2020.101410
 © 2024 The Author(s). This work is published and licensed by Dove Medical Press Limited. The full terms of this license are available at https://www.dovepress.com/terms.php and incorporate the Creative Commons Attribution - Non Commercial (unported, v3.0) License.
By accessing the work you hereby accept the Terms. Non-commercial uses of the work are permitted without any further permission from Dove Medical Press Limited, provided the work is properly attributed. For permission for commercial use of this work, please see paragraphs 4.2 and 5 of our Terms.
© 2024 The Author(s). This work is published and licensed by Dove Medical Press Limited. The full terms of this license are available at https://www.dovepress.com/terms.php and incorporate the Creative Commons Attribution - Non Commercial (unported, v3.0) License.
By accessing the work you hereby accept the Terms. Non-commercial uses of the work are permitted without any further permission from Dove Medical Press Limited, provided the work is properly attributed. For permission for commercial use of this work, please see paragraphs 4.2 and 5 of our Terms.