")
Back to Journals » OncoTargets and Therapy » Volume 12
Downregulation of GBAS regulates oral squamous cell carcinoma proliferation and apoptosis via the p53 signaling pathway
Authors Wang X, Bai Y, Han Y, Meng J , Liu H
Received 7 March 2019
Accepted for publication 29 April 2019
Published 17 May 2019 Volume 2019:12 Pages 3729—3742
DOI https://doi.org/10.2147/OTT.S207930
Checked for plagiarism Yes
Review by Single anonymous peer review
Peer reviewer comments 2
Editor who approved publication: Dr Federico Perche
Xing Wang,1 Yuting Bai,2,3 Ying Han,1 Jian Meng,2 Hongwei Liu1
1Department of Oral Medicine, Peking University School and Hospital of Stomatology, Beijing, People’s Republic of China; 2Department of Oromaxillofacial-Head and Neck Surgery, Affiliated Xuzhou Hospital, College of Medicine, Southeast University, Xuzhou, JiangSu, People’s Republic of China; 3Department of Oral Medicine, Xuzhou Medical University, Xuzhou, JiangSu, People’s Republic of China
Purpose: Oral squamous cell carcinoma (OSCC) is the most common and severe type of head and neck malignancy. The mechanisms by which OSCC arises depend on changes in a number of different factors and genes and the clinicopathological stage of the tumors. Better understanding the possible mechanisms of OSCC would help to identify a new target for molecular targeted therapy. The current study was focused on elucidating the significance of the glioblastoma-amplified sequence (GBAS) on malignant behaviors in OSCC, including proliferation and apoptosis.
Patients and methods: In this study, we measured the levels of mRNA in OSCC and normal oral tissue samples using Affymetrix microarrays. We examined GBAS expression in OSCC tissues and the effect of GBAS knockdown on cell proliferation and apoptosis in vitro and in vivo. The mechanisms underlying GBAS were investigated.
Results: In the present study, GBAS expression was substantially elevated in the majority of tested OSCC tissues. Further, knockdown of GBAS using lentiviral-delivered shRNA in cells had significant effects on cell proliferation, apoptosis and the cell cycle. A xenograft model was also used to assess the tumorigenicity of the GBAS knockdown on OSCC cells in vivo. Mechanistically, GBAS activated p53 signaling by regulating the mRNA and protein expression of CHEK1, AKT1, AKT2 and Bax. Finally, we also investigated the expression of GBAS in patients with OSCC, and the data revealed that GBAS expression was correlated with the rates of relapse and tumor grade.
Conclusion: Our studies provide evidence that GBAS regulates OSCC cell proliferation and apoptosis via p53 signaling, which may be a candidate biomarker for the prognosis and treatment of OSCC.
Keywords: oral squamous cell carcinoma, GBAS, apoptosis, p53 signaling pathway
Introduction
Currently, sharp increases in cancer rates have been described. According to 29 cancer group reports, the global incidence of cancer has increased by approximately 10% between 1990 and 2016.1 Oral squamous cell carcinoma (OSCC) is the most common type of oral cancer, and 160,000 new OSCC cases have emerged in Asia.2 Numerous mutations in oncogenes and tumor suppressors, as well as the alterations in gene expression profiles, likely lead to the maladjustment of the cellular metabolism function in cancer cells. The focus of OSCC therapy has shifted to targeted therapy particularly in the roles of tumor cell proliferation and apoptosis at the genetic level. As more cancer-related genes and biomarkers are discovered, the curative effects of targeted therapy have enhanced the treatment of advanced OSCC. However, the mortality and recurrence rate of patients with OSCC remains high.3,4 Therefore, further elucidation of the molecular mechanisms might lead to novel therapeutic strategies for OSCC and improve the prognosis.
Human chromosome 7 is the first completed metacentric chromosome, and more than 153 million base pairs of this chromosome have already been explored.5 The genomic sequence has been associated with a number of diseases including cancer, diabetes, cystic fibrosis, obesity and so on.6–9 Glioblastoma-amplified sequence (GBAS), also named 4-nitrophenylphosphatase domain and non-neuronal SNAP25-like protein homolog 2 (NIPSNAP2), a newly identified gene located on chromosome 7p12, encodes a protein that contains identifiable signal peptide, transmembrane motifs and two tyrosine phosphorylation sites.10 To date, some studies have described gene functions. As a member of the NIPSNAP family, GBAS has a mitochondrial targeting sequence (MTS) in the amino terminus, which is involved in the regulation of vesicle transport.11 In 2012, a role in transcriptional regulation was confirmed in a study by Brittain et al that identified a novel function for GBAS in a neuronal cell line and demonstrated its expression is closely related to CREB signaling and several downstream signals, which has been linked to Ca2+ influx.12 Additionally, increasing evidence indicates that GBAS may play critical roles in the genesis, progress and prognosis of human cancers via gene co-amplification.10 The gene is amplified in approximately 40% of glioblastomas. A previous study used RegulomeDB to predict the influence of single nucleotide polymorphisms (SNPs) on the expression of GBAS protein in tissue samples from patients with surgically resected early-stage non-small cell lung cancer (NSCLC).13 As far as we know, the deregulation of proliferation and apoptosis is generally considered a genetic marker of tumorigenesis. However, the biological function and molecular mechanism of GBAS remains unclear on this front.
Research had proved that unsatisfactory therapeutic outcomes and the poor prognosis associated with OSCC are related to some aberrantly activated signaling pathways, such as the p53 signaling pathway.14,15 The p53 signaling pathway is one of the most frequently activated signal transduction pathways in oral cancer but also in many other types of cancer and is responsible for the apoptosis and mitosis of tumor cells. Furthermore, the tumor suppressor gene p53 could regulate the expression of many apoptosis-related genes such as Puma, Noxa, Bax, Apaf1, Fas, Bcl-2.16,17
In the present study, we report that GBAS expression is significantly upregulated in OSCC and clinical tissues. We subsequently observed that knockdown of GBAS inhibited cell viability, induced apoptosis of OSCC cells in vitro and disturbed the process of tumorigenesis in vivo. Moreover, we propose that one of the mechanisms of action of GBAS is through regulating the p53 signaling pathway, which is important in the development of OSCC. Our findings suggest that this gene could be a novel therapeutic target for OSCC.
Material and methods
Cell lines and cell culture
Human oral cancer cell lines that included CAL-27 and Tca-8113 were purchased from the Cell Resource Center, Shanghai Institute for Biological Sciences, Chinese Academy of Science (Shanghai, China). Oral cancer cell lines were cultured in Dulbecco’s modified Eagle’s medium (Gibco, Invitrogen, Carlsbad, CA, USA) supplemented with 10% fetal bovine serum (Gibco) and 1% penicillin-streptomycin. Cells were incubated in a 37C°, 5% CO2 humidified incubator.
Human tissue samples
The study was conducted in accordance with the Declaration of Helsinki, and the protocol was approved by the Ethics Committee of The College of Medicine, Affiliated Xuzhou Hospital, Southeast University (2009XL002). A group of 73 patients with histologically proven OSCC was recruited from September 2011 to July 2016. After surgical resection, the OSCC tissues and matched adjacent tissues samples were frozen and stored in liquid nitrogen until further use. Tumor, node, metastasis (TNM) stage was determined according to the classification of the World Health Organization (WHO). All the participants provided written informed consent for participating prior to surgery. In addition, an OSCC tissue microarray was obtained from the Shanghai Biochip Company Ltd. (Shanghai, China).
Immunohistochemical (IHC) assay
Sections of OSCCs and adjacent normal oral tissues were prepared. After deparaffinization, antigen retrieval was performed by a heated antigen retrieval solution and incubated overnight with mouse anti-human GBAS monoclonal antibody (OriGene Technologies, Rockville, MD, USA) diluted 1:150 and followed by Rhodamine-conjugated secondary antibodies (Bioworld Technology, St. Paul, MN, USA). The anti-GBAS antibody was validated by the Human Protein Atlas (
RNA extraction and reverse transcription-quantitative polymerase chain reaction (RT-qPCR) analysis
Total RNA was extracted from cells using the TRIzol® reagent (Pufei, Cat. No. 3101–100, Shanghai, China) and cDNA was prepared by M-MLV Reverse Transcriptase (Promega, Cat. No. M1705, Madison, WI, USA). The cDNA generated was used as a template for the RT-qPCR reaction using SYBR Green Master Mixture (Takara, Otsu, Japan). The sequence of GBAS primers was as follows: 5ʹ-TTCGTAAGGCAAGAAGTGAC-3ʹ (forward) and 5ʹ-GTCGGAGTTGGTAAGACCTG-3ʹ (reverse). Glyceraldehyde-3-phosphate dehydrogenase (GAPDH) was used as an internal reference and the primer sequence was 5ʹ-TGACTTCAACAGCGACACCCA-3ʹ (forward) and 5ʹ-CACCCTGTTGCTGTAGCCAAA-3ʹ (reverse). The differences between samples were calculated using the 2-DCt values.
Vectors, retroviral infection and transfection
The human GBAS gene-specific short hairpin RNA (shRNA) sequence was 5ʹ-TTCGTAAGGCAAGAAGTGAC-3ʹ (designed by Shanghai Genechem, Shanghai, China). A lentivirus (hU6-MCS-CMV-EGFP) that expressed the negative sequence was used as a negative lentivirus control (sh-Ctrl). The sequence was 5ʹ-TTCTCCGAACGTGTCACGT-3ʹ. The process of shRNA constructs consisted of synthesizing and cloning into the pGCSIL-green fluorescent protein (GFP) plasmid vector. Subsequently, shRNA transfection was generated in 293T packaging cells according to the protocol provided by the manufacturer. For lentivirus transfection, CAL-27 and Tca-8113 cells were seeded into 6-well plates at 3×10⁵ cells per cm2 and infected with GBAS-specific shRNA lentivirus or control lentivirus at a multiplicity of infection of 10. The efficiency was confirmed via fluorescence microscopy to observe the cells transfected with the GFP lentivirus 72 h after transfection.
Western blotting assay
The cells were lysed in RIPA buffer supplemented with protease inhibitor and phosphatase inhibitor cocktails (Thermo Fisher Scientific, Inc.). The protein concentration was then measured with a BCA Protein Assay Kit (Beyotime, Shanghai, China). The total proteins were separated with SDS-PAGE and then electrically transferred to a PVDF membrane (Millipore, Billerica, MA, USA). After blocking with 5% skim milk, the membranes were incubated with specific primary antibodies at 4C° overnight. The membranes were washed with TBST and incubated with a secondary antibody for 1.5 h at room temperature. Finally, the membranes were incubated in Pierce™ ECL Western Blotting Substrate (Thermo Fisher Scientific, Inc.) before visualization. The primary antibodies used were as follows: mouse anti-GBAS (1:200, OriGene, TA505590, Rockville, MD, USA), rabbit anti-AKT1 (1:300, Abcam, ab183758, Cambridge, MA, USA), mouse anti-AKT2, rabbit anti-Bax (1:300, Abcam, ab175354 and ab32503, Cambridge, MA, USA), mouse anti-CHEK1 (1:300, CST, 2360, Danvers, MA, USA), and mouse anti-GAPDH (1:2000, Santa-Cruz, sc-32,233, Dallas, TX, USA). GAPDH was used as an internal reference.
Cell proliferation assays
CAL-27 and Tca-8113 cells were seeded into 96-well plates at the density of 2×10³ cells per well. Cells were incubated at 37 °C with 5% CO2 and then quantified autonomously once a day for 5 days. The proliferation of cells was assessed by the Celigo Imaging Cytometer (Nexcelom Bioscience, Lawrence, MA, USA).
MTT assay
An MTT kit (Genview Cat. No. JT343, Beijing, China) was used for the cell proliferation assay, according to the manufacturer’s instructions. Cells were inoculated into 96-well plates and 20 μL MTT reagent at a concentration of 5 mg/mL were added to each well and incubated for 4 h. After discarding the culture supernatant, 10 μL of dimethyl sulfoxide were added to dissolve formazan crystals. The absorbance was measured using a microplate reader (Tecan Infinite M200, Männedorf, Switzerland) at 490/570 nm.
Cell apoptosis analysis
The Annexin V-allophycocyanin (APC) apoptosis detection kit (eBioscience, Cat. No. 88–8007, San Diego, CA, USA) was used to detect cell apoptosis. OSCC cells transfected with GBAS-specific shRNA lentivirus or control lentivirus were harvested by trypsinization and resuspended in 1X binding buffer at a final density of 1×10⁶ cells per mL. After centrifugation, the deposits of cells were mixed with 10 μL Annexin V-APC and incubated for 15 min at room temperature. All the samples were assayed and quantified using a Guava EasyCyte Flow Cytometer (Millipore, Hayward, CA, USA).
Cell cycle analysis
CAL-27 and Tca-8113 cells were fixed in ice-cold 75% ethanol and kept at 4 °C 1 h. The cells were then washed once with D-Hanks solution and resuspended with a cocktail of propidium iodide (PI, cat. no. P4170, Sigma-Aldrich, Shanghai, China), RNase concentrate (cat. no. EN0531, Fermentas), and D-Hanks solution at a ratio of 25:10:1,000. Flow cytometric data were acquired and analyzed using a FACSCalibur flow cytometer and CellQuest Research Software (BD Biosciences, San Diego, CA, USA).
In vivo xenograft tumor assay
Four-week-old female BALB/c nude mice were purchased from Vital River Laboratory Animal Technology Co., Ltd (Beijing, China). All the procedures were performed in accordance with the specifications of an approved animal protocol of the Institutional Animal Care and Use Committee of the Peking University Health Science Center (LA2018-70). Pretreated CAL-27 cells (5x10⁶) transfected with PSC14835 (NC) or LVpFU-GW-012PSC68722-1 (KD) were suspended in 200 μL PBS and then injected subcutaneously into the right axilla of nude mice (n = 10). After 8 days, the resulting tumors were measured with a caliper twice weekly. The tumor volume was calculated using the formula V=3.14/6 x length x width.2 On day 26, the tumors were detected by the IVIS Imaging System (PerkinElmer, Waltham, MA, USA), the animals were euthanized, and the tumors were excised and weighed. The total radiant efficiency (photons/sec)/(μW/cm2) was determined by the Living Image software for the defined ROI area.
DNA microarray analysis
Total RNA extracted from the samples was screened for differentially expressed genes using an Agilent RNA 6000 Nano Kit (Santa Clara, CA, USA). The labeled RNA synthesis and hybridization to the Affymetrix GeneChip PrimeView Human Gene Expression Array was performed according to the manufacturer’s instructions (Genechip 3ʹIVT express kit). The differentially expressed genes between the GBAS-specific shRNA and sh-Ctrl groups with FDR <0.05 and a fold change >1.5 were considered to be significantly differentially expressed. A pathway enrichment analysis was performed for all the significant differentially expressed genes using the Ingenuity Pathway Analysis (QIAGEN Redwood City,
Statistical analysis
All the data were analyzed using the SPSS 17.0 Software (SPSS, Chicago, IL, USA) and GraphPad Prism version 5.0 (GraphPad Software, San Diego, CA, USA). The data are presented as the mean ± SD deviation and have been performed independently in triplicate. The continuous variables were compared using the two-tailed t-test and Mann–Whitney U test. The expression data of GBAS and clinicopathologic characteristics concerning OSCC were downloaded from The Cancer Genome Atlas (TCGA). A P-value of less than 0.05 indicated a statistically significant difference.
Results
Aberrant upregulation of GBAS in OSCC tissues and the association with cancer progression and poor prognosis
First, the mRNA expression profiles were analyzed between OSCCs and adjacent normal tissues. Compared with the adjacent normal tissues group, 1,002 genes were downregulated and 519 were upregulated in OSCC tissues. The log2 values of differentially regulated genes were normalized by Z-score and represented as a heat map (Figure 1A). The bioinformatics analysis showed that some genes may play a vital role in the proliferation of OSCC. To observe the effect of the genes on the proliferation of human OSCC, 17 genes were then silenced in OSCC cells and identified by high-content screening (Figure 1B). Compared with the control group, the cell proliferation rate was significantly inhibited in the experimental group of GBAS and TMEM5 knockdown (Figure 1B, C) cells. According to the gene annotation and uncharted gene function, we hypothesized the GBAS gene could be a potential target for abnormal regulation associated with OSCC, and there were no published reports found. After the GBAS-shRNA was transfected, the expression of GBAS in OSCC cells was measured by qRT-PCR. As is shown in Figure 1D, the expression level of GBAS mRNA significantly declined in the GBAS-shRNA group in contrast to that of the control group (P<0.01).
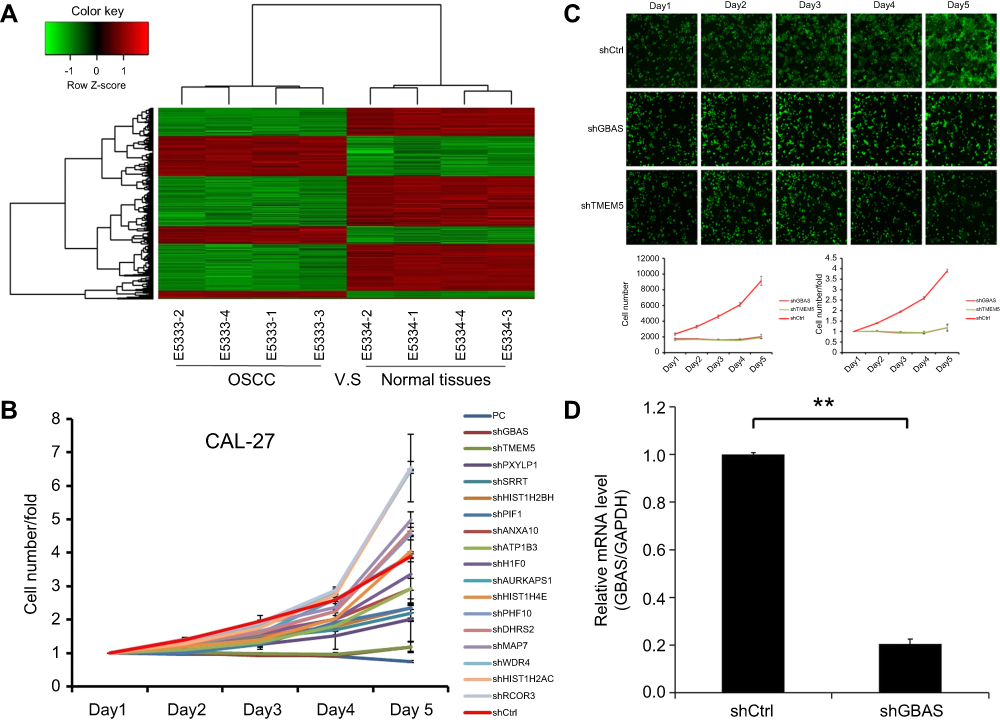 | Figure 1 Affymetrix microarray and high-content screening identified GBAS as a critical gene in the progression of OSCC.Notes: (A) Heat map showing gene expression profiles. Each row represents a gene and each column represents a sample. Red indicates high expression, whereas green indicates low expression. (B) A total of 17 genes were selected for validation by high-content screening. (C) Representative fluorescence images of high-content screening for GBSA and TMEM5. (D) The mRNA expression of GBSA by the qRT-PCR, **P<0.01.Abbreviations: OSCC, oral squamous cell carcinoma; GBAS, glioblastoma amplified sequence; TMEM5, transmembrane protein 5. |
A total of 73 patients, with a mean age of 57.8 years (range 27 to 84), were enrolled in the study. The clinical data available were gender, age, TNM stage, tumor size, tumor grade, lymph node metastasis, distant metastasis and local recurrence, as well as the IHC staining for GBAS shown in Table 1. In the present study, the expression level of GBAS in OSCC tissues from 73 patients was significantly higher than that in normal adjacent tissues (Figure 2). Furthermore, the clinicopathological analysis indicated that GBAS was significantly correlated with tumor differentiation (P=0.002) and local recurrence (P<0.01) in patients with OSCC. However, there was no significant relationship between GBAS expression levels and other features (P>0.05, Table 1). In summary, these findings suggest a novel potential link implicating GBAS with tumor growth and progression of OSCC.
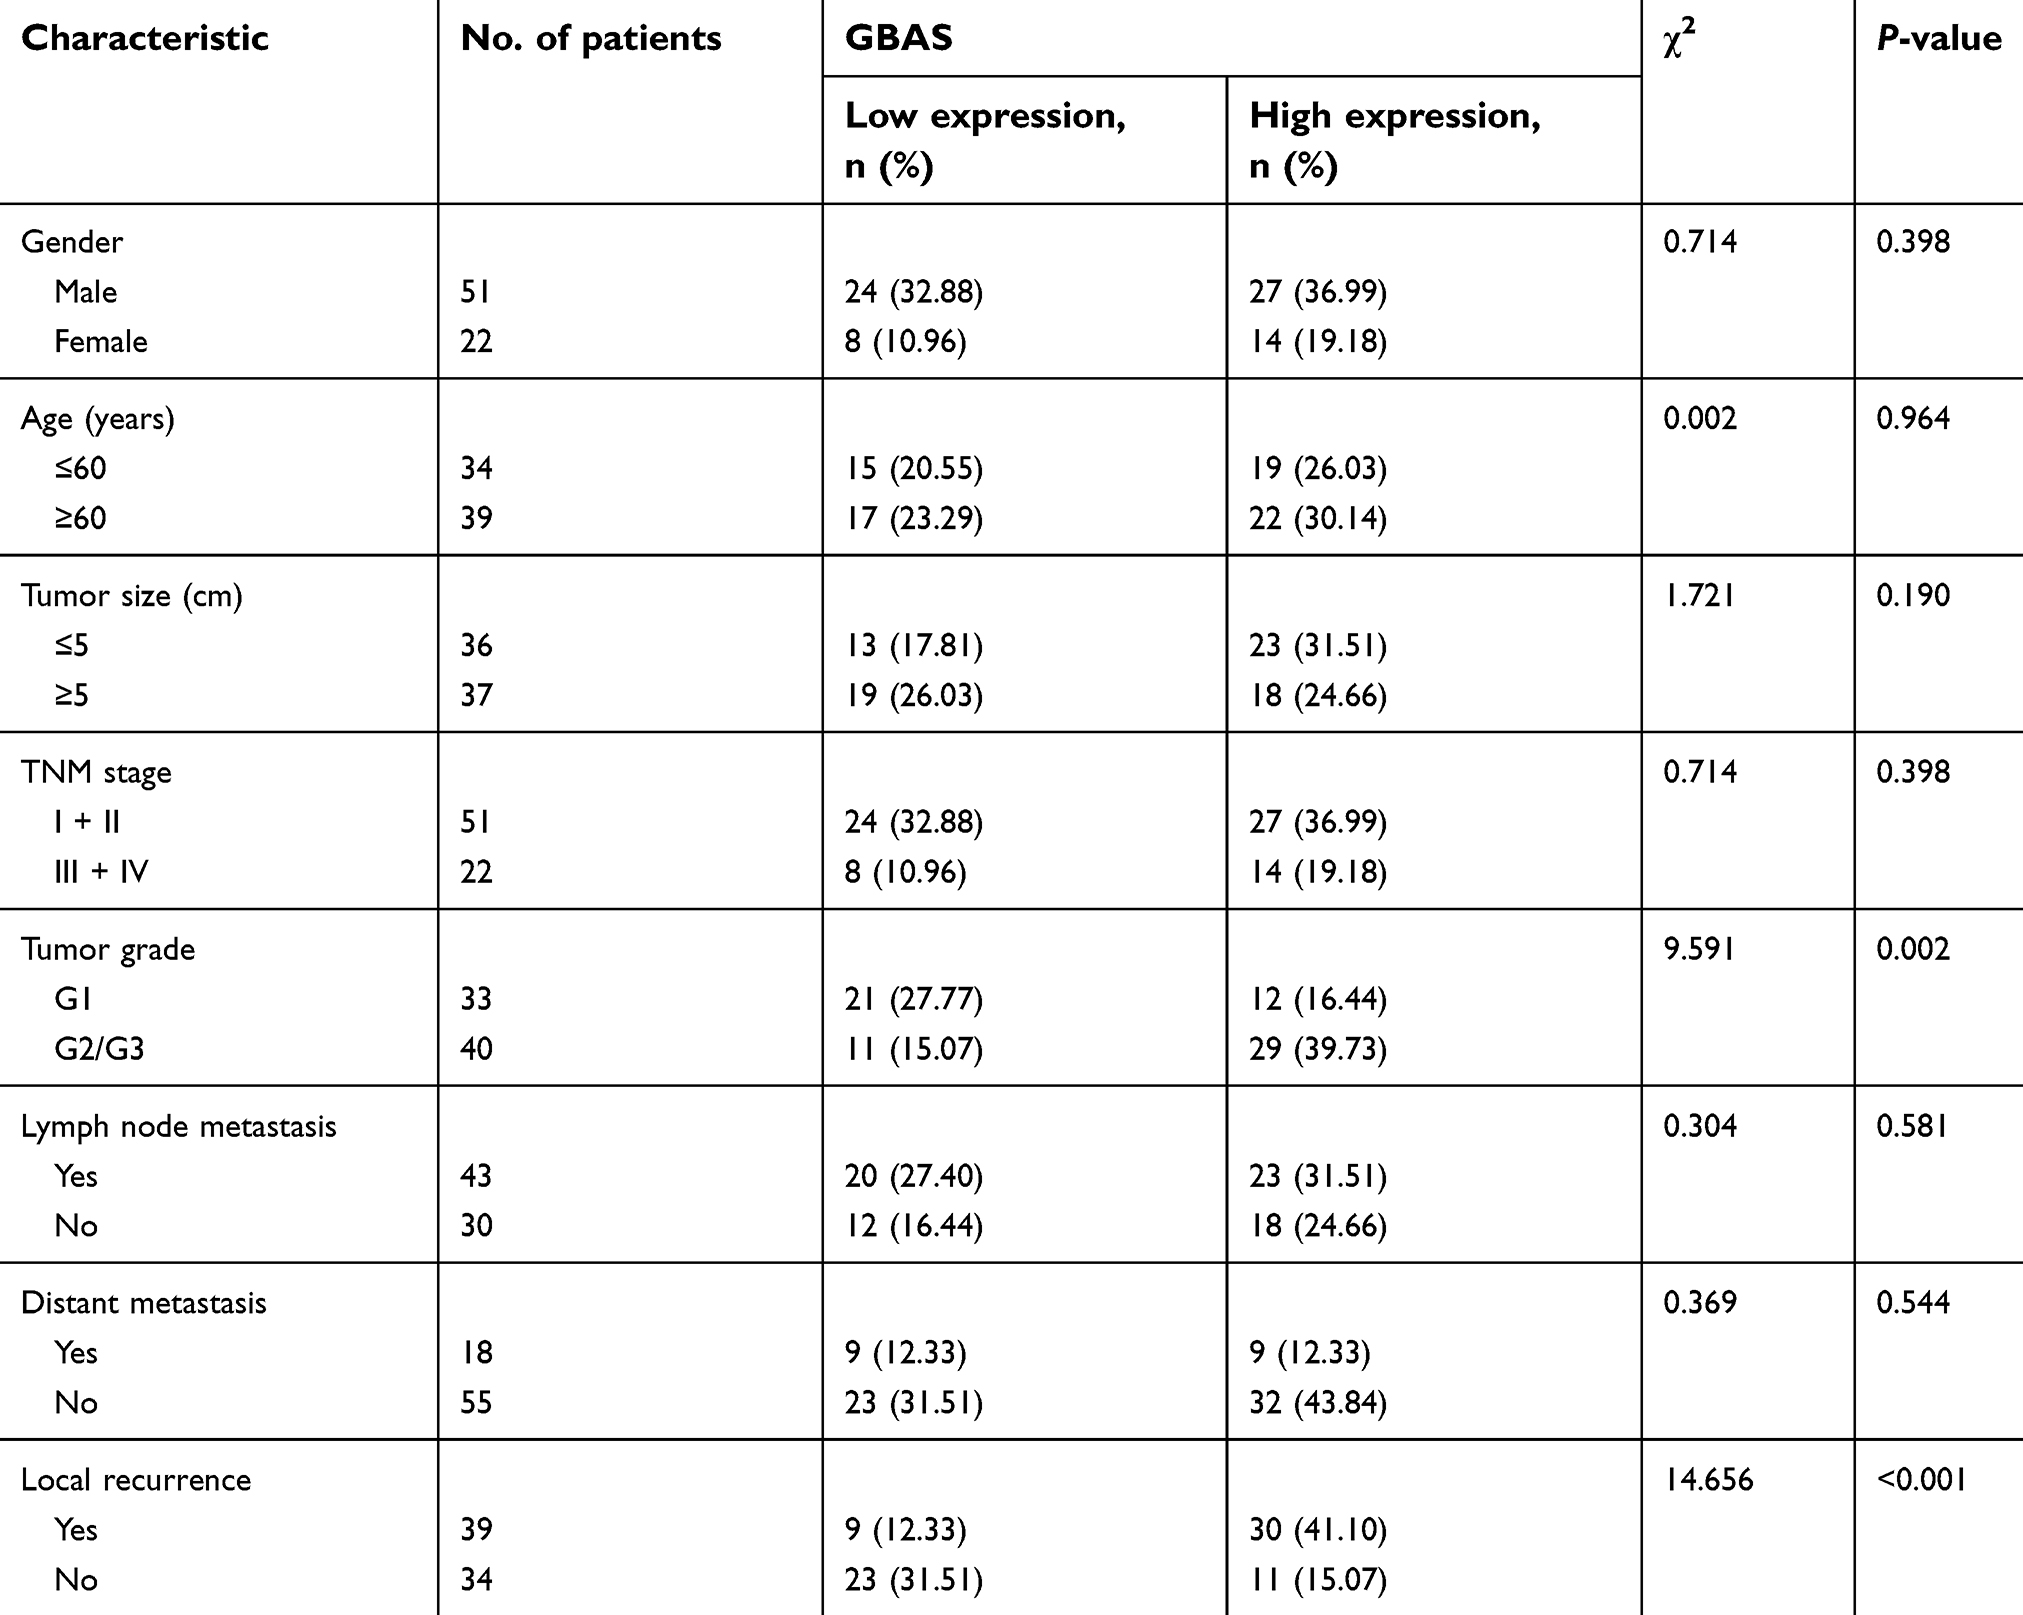 | Table 1 Association between GBAS expression and the clinicopathological characteristics in OSCC patients |
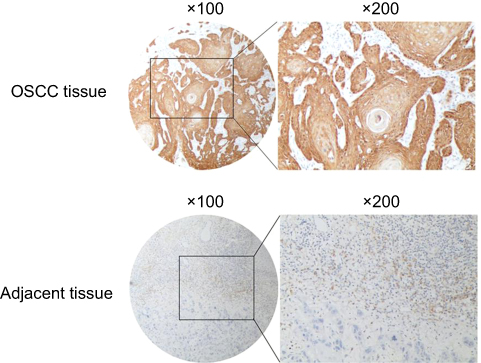 | Figure 2 Representative figures of immunohistochemical staining for GBAS in OSCC tissues and paired adjacent normal tissue.Abbreviation: OSCC, oral squamous cell carcinoma. |
Knockdown of GBAS inhibits cell growth and proliferation in OSCC cell lines
GBAS knockdown in OSCC cell lines was established using a lentiviral delivery system, and the efficiency of gene knockdown was verified at both the protein and mRNA levels. The MTT assay demonstrated that compared with the control cells, cell growth was significantly suppressed in CAL-27 and Tca-8113 cells with stable knockdown of GBAS by shRNA transfection at different time points (P<0.01; Figure 3A, B). Additionally, the Celigo analysis results also showed that cells treated with sh-GBAS were less viable than cells treated with sh-Ctrl using a fluorescence imaging system (P<0.01; Figure 3C, D).
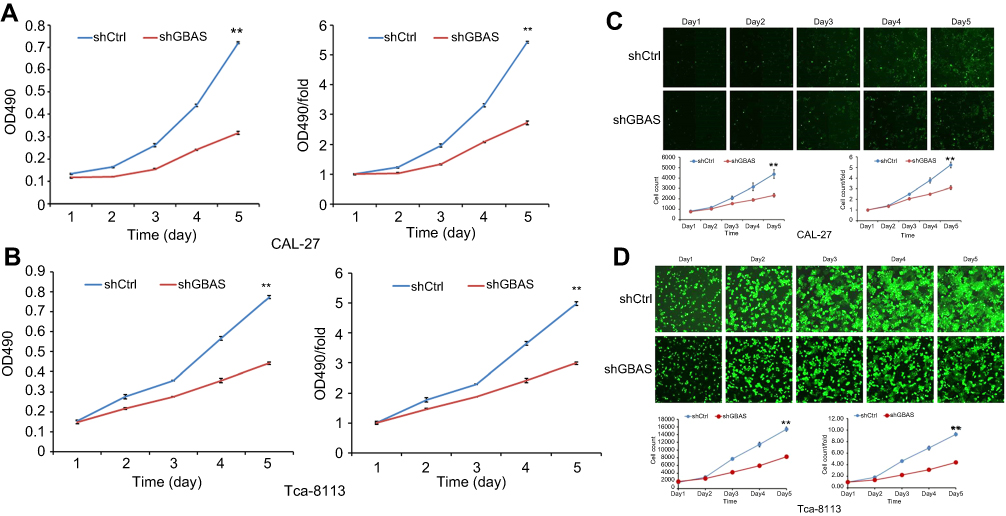 | Figure 3 Knockdown of GBAS inhibits the cell viability of 2 OSCC cell lines (CAL-27, Tca-8113).Notes: (A, B) MTT assay showed that the cell viability of CAL-27 (A) and Tca-8113 (B) was significantly inhibited after decreasing the expression of GBAS by sh-GBAS. (C, D) Celigo analysis was used to determine the cell viability of CAL-27 (C) and Tca-8113 (D) by the treatment of sh-GBAS. In all above experiments, the data were performed independently in triplicate and presented as mean ± SD, **P<0.01.Abbreviations: OSCC, oral squamous cell carcinoma; GBAS, glioblastoma amplified sequence. |
Knockdown of GBAS induces apoptosis and inhibits cell cycle progression in OSCC cell lines
The fact that multiple forms of apoptosis account for cancer cell death and that these individual forms of cell apoptosis have different mechanisms in different tissues makes assessing cell apoptosis complicated. To evaluate the influence of GBAS knockdown on the apoptosis of OSCC cells, flow cytometry and AnnexinV staining were performed. Compared with controls, knockdown by sh-GBAS significantly increased the proportion of apoptotic cells in CAL-27 (3.10±0.07% vs 9.70±0.21%, P<0.01; Figure 4A) and Tca-8113 (4.31±0.22% vs 27.87±0.41%, P<0.01; Figure 4B). The results revealed that the introduction of sh-GBAS significantly increased the induction of apoptosis in OSCC cells. Furthermore, flow cytometry was used to explore whether GBAS also regulates the cell cycle. Data proved that sh-GBAS induced a dramatic alteration in the cell cycle distribution in both CAL-27 and Tca-8113 cells. As shown in Figure 4C, the cell ratio in the G1 phase increased significantly (P<0.01) and the cell ratio in the S and G2/M phase decreased significantly in the sh-GBAS group in comparison with that in the control group of CAL-27 cells (P<0.05). The inhibition of GBAS gene expression arrested CAL-27 cells in the G1 phase, at the same time the cell ratio was reduced in the S and G2/M phases, resulting in the increase of CAL-27 cells being inhibited. In Tca-8113 cells, we also found that the S phase cell fraction was significantly decreased and induced a G2/M cell cycle arrest (P<0.01; Figure 4D). Compared with the control cells, the sh-GBAS cells are characterized by cell cycle arrest and dysregulation.
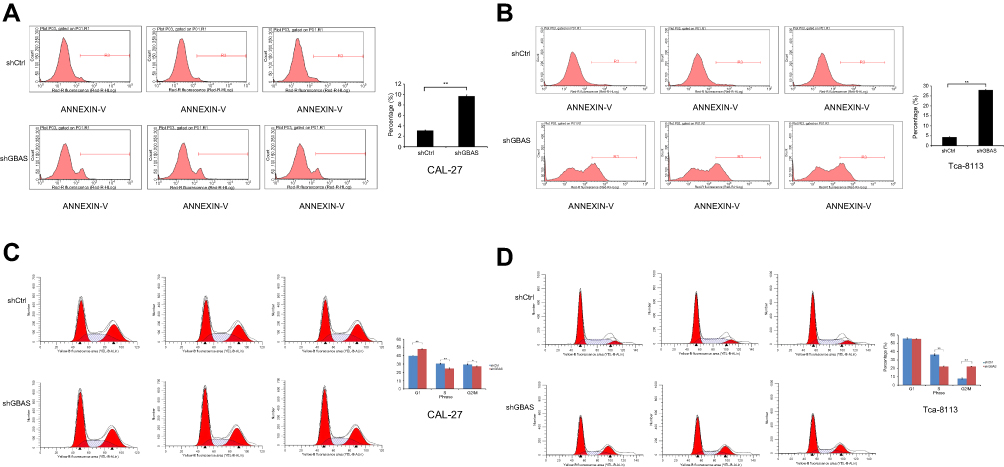 | Figure 4 4 Knockdown of GBAS influences the cell viability of 2 OSCC cell lines (CAL-27, Tca-8113).Notes: (A, B) Apoptosis was determined by flow cytometry assays in CAL-27 (A) and Tca-8113 (B) with GBAS silence and control cells. The apoptotic rate was calculated as the percentage of Annexin FITC positive cell. (C, D) Flow cytometry was also used to analysis the cell cycle of CAL-27 (C) and Tca-8113 (D) by the treatment of sh-GBAS. In all above experiments, the data were performed independently in triplicate and presented as mean ± SD, *P<0.05 and **P<0.01.Abbreviations: OSCC, oral squamous cell carcinoma; GBAS, glioblastoma amplified sequence; FITC: fluorescein isothiocyanate. |
Knockdown of GBAS contributes to OSCC progression in vivo
To investigate the in vivo oncogenic role of GBAS in OSCC, we first established a xenograft tumor model of CAL-27 cells in Balb/c nude mice. First, the negative control (NC) and GBAS knockdown (KD) OSCC cells transfected with GBAS shRNA lentiviruses were injected in the subcutaneous tissue at the right armpit of nude mice. As shown in Figure 5A, compared with the NC group, tumor growth in the KD group was significantly suppressed. The final tumor volume at 26 days was 1628.21±375.62 mm3 in the NC group, whereas the volume in the KD group was 162.21±44.19 mm3 (P<0.01; Figure 5B). After sacrifice, the average tumor weight of the NC group was significantly heavier than that in the KD group, which presented no tumor growth (Figure 5C). To determine the tumor growth in vivo, we utilized the xenograft model of OSCC by injection of firefly luciferase transduced CAL-27 cells into the right armpit. Images taken from mice representing the groups reveal a markedly reduced fluorescent signal in GBAS knockdown mice relative to that of the NC mice at the end of the experiments (total radiant efficiency: 9.09×10⁷ vs 2.08×10⁹, respectively, p = 0.003; Figure 5D, E). The findings seemed to be consistent with the in vitro results, and the knockdown of GBAS expression diminished OSCC cell growth in vivo.
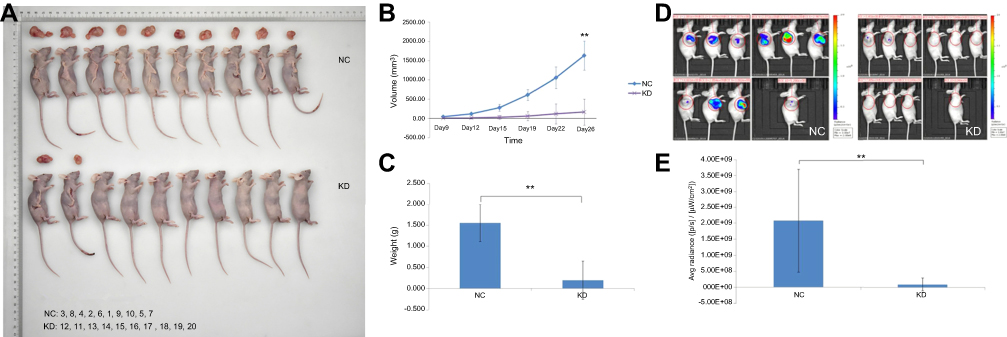 | Figure 5 Knockdown of GBAS in CAL-27 cells inhibited tumorigenicity in nude mice. sh-GBAS or sh-Ctrl transfected cells were transplanted into inoculated subcutaneously into nude mice for up to 26 days (n = 10).Note: (A) After scarification, xenograft tumors in vivo and excised tumors were recorded. (B) Tumor volume was estimated based on the following equation: volume =1/2 × (largest diameter) × (smallest diameter)2 and data were shown as mean ± SD (n = 10 in each group), **P<0.01. (C) Tumor weight was obtained at the end of experiment and was displayed as mean ± SD (n = 10 in each group), **P<0.01. (D) Tumor growth was systemically administered and monitored by FI. At the end of the experiments, tumor tissues were exposed to FI. Images represent the radiant efficiency. (E) Regions of interest calculated for the tumor and results were expressed as total radiant efficiency ([p/s]/[μW/cm2]), **P<0.01.Abbreviations: GBAS, glioblastoma amplified sequence; NC, normal control; KD, knockdown; Avg, average; FI, fluorescence imaging. |
Network identification and functional enrichment analysis of GBAS
Upon analyzing the differential expression pattern of genes in the GBAS knockdown cells and negative control cells, the present study identified a number of key genes including eukaryotic translation elongation factor 1 (EEF1), checkpoint kinase 1 (CHEK1) and AKT2, which were significantly downregulated, in addition to TP53, Bax and Fas cell surface death receptor (FAS), which were significantly upregulated in OSCC (Figure 6A). An Affymetrix GeneChip PrimeView Human Gene Expression Array was also adopted to discover changes in expression of the proteasome pathway-related gene set. The findings indicated that the differentially expressed genes were involved in carcinogenesis pathways. Following GBAS function and pathway enrichment analysis, some fundamental biological signaling pathways, such as p53 signaling, interferon signaling and the sumoylation pathway were potentially regulated (Z-score≥2). Surprisingly, some differentially expressed genes related to the pathogenesis of OSCC and also lead to the subsequent response of the p53 signaling pathway.
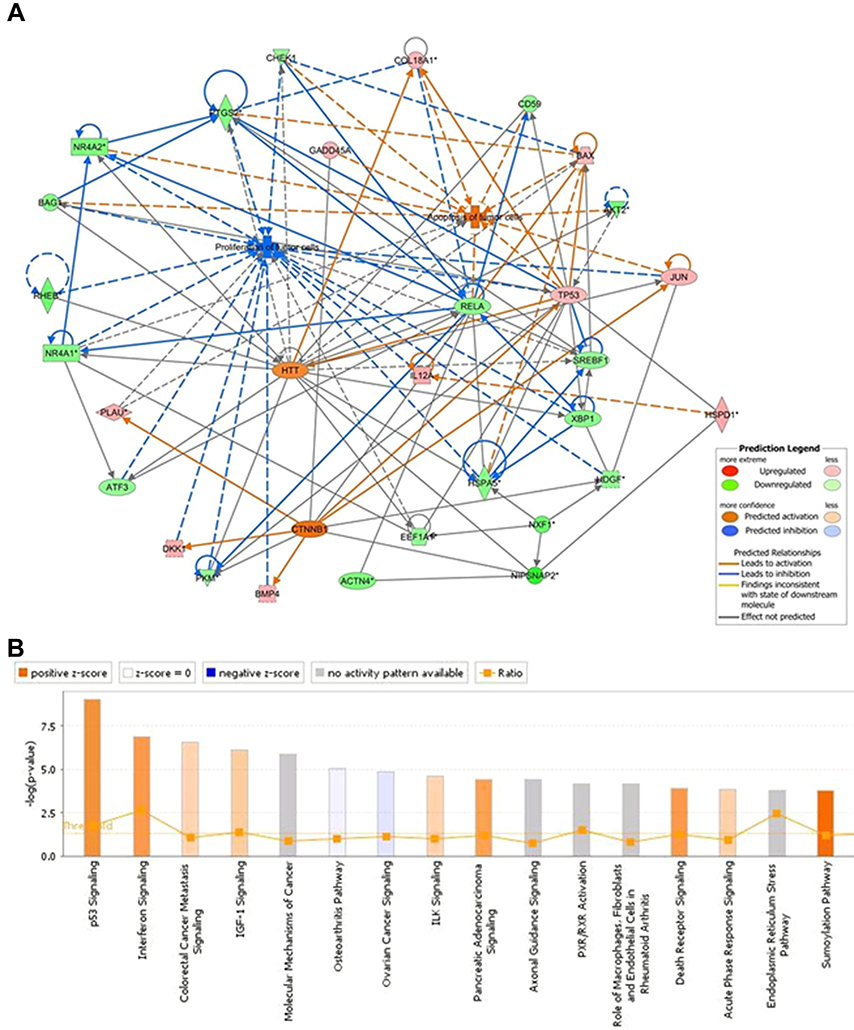 | Figure 6 IPA identified proteins networks showing inter-relationships and pathways.Note: (A) Network analysis revealed that some genes may be activated by GBAS (NIPSNAP2) and its partners. Binding partner proteins were uploaded into the IPA and the top biological networks generated a global view. (B) The altered pathways were demonstrated. Orange marks indicated activated (Z-score>0) and the blue marks indicated suppressed pathways (Z-score<0).Abbreviations: GBAS, glioblastoma amplified sequence; IPA, ingenuity pathway analysis; NIPSNAP2, 4-nitrophenylphosphatase domain and non-neuronal SNAP25-like protein homolog 2. |
Knockdown of GBAS interferes the p53 signaling pathway in OSCC
Based on the above analysis, we hypothesize that GBAS downregulation may suppress the p53 signaling pathway. p53 signaling is a key player in mammalian cancer development. Activation of the transcription factor p53 through DNA damage or other stress can result in cell cycle arrest, apoptosis, or both. In agreement with this hypothesis, we detected CHEK1 expression and a series of the downstream genes in the p53 signaling pathway, for instance, AKT1, AKT2 and Bax. As illustrated in Figure 7A, the results of the present study demonstrated that p53-associated proteins AKT1, AKT2, Bax and CHEK1 levels had a certain degree of difference in the GBAS-silenced cells compared with those in the control cells. Additionally, we performed qRT-PCR to determine mRNA expression levels, which also supports the above results (Figure 7B). Therefore, these results not only verified the hypothesis but also laid out the potential mechanism of GBAS in OSCC.
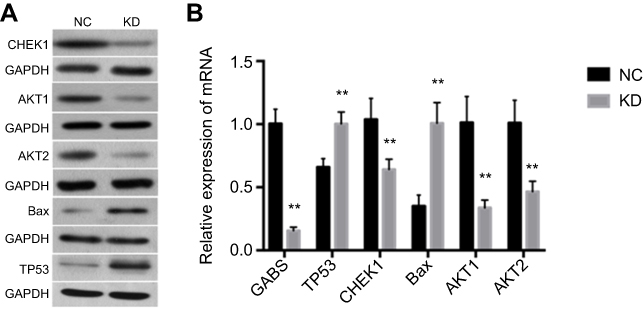 | Figure 7 The expression of AKT1, AKT2, Bax, CHEK1 and GBAS by the qRT-PCR and western blotting in tumor tissues in the sh-GBAS groups.Note: (A) The protein expression of AKT1, AKT2, Bax and CHEK1 by western blotting. GAPDH was used as a loading control. (B) The mRNA expression of AKT1, AKT2, Bax, CHEK1 and GBAS by the qRT-PCR. Histogram representing indicated the results of three independent experiments **P<0.01.Abbreviations: GBAS, glioblastoma amplified sequence; AKT1, AKT serine/threonine kinase 1; AKT2, AKT serine/threonine kinase 2; Bax, BCL2 associated X; CHEK1, checkpoint kinase 1; GAPDH, glyceraldehyde 3-phosphate dehydrogenase; RT-PCR, reverse transcription-polymerase chain reaction; NC, normal control; KD, knockdown. |
Discussion
In the present study, genes were differentially expressed between OSCCs and normal oral tissues using Affymetrix microarrays, of which 1,002 genes were downregulated and 519 were upregulated in tumor tissues. To foster the systematic identification of novel genes with important functional roles in OSCC, we sought to select the highly relevant novel candidate genes by high-content screening. Among them, the GBAS gene has been found to regulate cell proliferation and apoptosis, which had never been reported before in OSCC. Nevertheless, the gene coamplifies with epidermal growth factor receptor (EGFR) in multiple carcinomas, with the encoded protein expression increasing.10 EGFR is highly expressed in 90% of head and neck squamous cell carcinoma patients and is crucial for proliferation, migration, DNA synthesis and adhesion.18 Previous research has shown that gene mutations in EGFR are probably associated with protein function and tumor formation.19,20 However, little is known about the amplification, mutation and rearrangement of the gene, especially in OSCC. Thus, more effort should be devoted to fully elucidate the biological role and potential molecular mechanisms of GBAS.
To further determine the variations of tumor-related genes in OSCC and elucidate their correlation with clinical features and prognostic factors, the present study revealed the expression of GBAS in OSCC specimens and the adjacent normal tissues, and GBAS expression was significantly associated with tumor differentiation and local recurrence in OSCC patients. Considering the property of proliferation of OSCC cells, it was hypothesized that GBAS may be a probable gene to be related to disease progression. Unfortunately, a survival analysis could not be obtained because of insufficient patient follow-up data. Next, we further verified the function of GBAS in OSCC cells by loss-of-function approaches. Downregulation of GBAS could restrain cell proliferation and induce apoptosis in OSCC cell lines in vitro, as well as suppress tumor growth in vivo. Based on this observation, we then analyzed the function of the gene. As we know from previous research, GBAS may be located in the outer mitochondrial membrane or the inner membrane space.21 Recently, the cellular localization of genes has risen a large interest in the study of cellular function. Mitochondrial dysfunction has been described in tumor and cancer tissues, and it has been generally thought that the mitochondrial superoxide production could be of tremendous importance for cell proliferation and apoptosis.22 Mitochondria-targeted chemotherapeutics has been considered as the potential source of antitumor compounds. Kluza et al have found that the drug-induced changes of the mitochondrial mass showed significant differences between cancer cells and non-neoplastic cells.23 Moreover, results from an in vitro study indicate that a mitochondria-targeted drug may be a promising agent for the treatment of cancer since it is selectively toxic to cancer cells and harmless to normal cells.24 A study also lends credence to the belief that the mitochondria-dependent pathway can play an important role in suppressing the proliferation and migration of human oral cancer cells. Interestingly, p53, the tumor suppressor gene, is closely related to the course.25 To our surprise, the p53 signal pathway was activated when the expression of GBAS decreased, which was compared in multiple pathways using gene-set enrichment analysis by IPA. Thus, we hypothesize that mitochondrial dysfunction caused by the abnormal expression of GBAS possibly influences the formation and development of OSCC.
Beyond the functions related to cell proliferation and apoptosis, current flow cytometry data also demonstrated that GBAS facilitates cell cycle progression. Since the percentage of sh-GBAS cells in S-phase decreased significantly, we propose that GBAS regulates the progression through the S phase. The results coincide with microarray data, and the regulation effect of the GBAS gene may be through intricate signal pathways. This hypothesis is consistent with a role for the other members of the NIPSNAP family in genetic changes,26,27 as well as with previous reports that revealed a function for GBAS in regulating the cell cycle and apoptosis via Ca2+-dependent pathways.12 It is well documented that the mitochondrial membrane potential and Ca2+ production are involved in cell apoptosis, which is associated with activation of caspase-dependent pathways.28 Numerous reports have noted that apoptosis can be associated with mitochondrial damage after agents (including chemotherapy drugs) stimulate cancer cells.29,30 Based on our findings, we suspect that GBAS affects the growth of OSCC cells in vitro by causing cell-cycle arrest. However, the mechanism of shRNA-inhibited GBAS gene expression in the proliferation and apoptosis of OSCC cells was not clear.
A genetic regulatory network was built to investigate the interactions between GBAS and other correlative molecules including genes, proteins, and small molecules, which were analyzed by bioinformatics tools. The results demonstrated that 535 and 439 genes were up and downregulated in GBAS knockdown cells, respectively. In this report, HTT (Huntingtin) interacts directly with GBAS,31 which also has important interaction with CHEK1; this may be another way GBAS affects the processes of cancer cell division, growth, differentiation and apoptosis.32 CHEK1, which is also required for the DNA damage checkpoint, serves as a kind of serine/threonine protein kinase that is highly conserved evolutionarily. In response to DNA damage, Ataxia telangiectasia mutated and Rad3 related protein (ATR) can be activated and then phosphorylates CHEK1 at Ser345 and Ser317. Furthermore, phosphorylation of CHEK1 leads to its activation, which not only promotes further autophosphorylation at Ser296 but also results in phosphorylation and inactivation of Cdc25.33,34 As a consequence of the cross talk, ATR-pCHEK1 activation ultimately results in the arrest of the cell cycle at the S checkpoint.35 Previous research has demonstrated that ATR-CHEK1 signaling has prognostic, predictive and therapeutic value for cancer.36,37 To validate the microarray results, our data revealed that the expression of CHEK1 was significantly decreased in sh-GBAS cells according to the result of the qRT-PCR and Western blots. In conclusion, the data results propose the standpoint of how disruption of GBAS gene expression inhibits OSCC cell proliferation and induces apoptosis via affecting CHEK1 downstream signaling pathways.
The p53 signaling pathway participates in regulating the expression of many genes, and this results in a high ability to control human oral cancers. It is well established that activation of the p53 signaling pathway leads to cell cycle arrest and DNA repair as well as restrains the proliferation of OSCC cells.38 Moreover, mounting evidence indicates that CHEK1 can contribute directly or indirectly to the inhibition of p53.39,40 As far as we know, CHEK1 inhibition may induce p53 phosphorylation and subsequent p53-dependent apoptosis via p38 mitogen-activated protein kinase (p38 MAPK) activation.41 Collectively, these findings provide a strong rationale for therapeutic targeting of the p53 signaling pathway in OSCC. In our study, according to IPA, the p53 signaling pathway might contribute to the abnormal expression of GBAS in OSCC. Hence, it would be of great interest to further investigate whether upregulation of GBAS in OSCC is attributed to p53-mediated programmed cell death. Our data showed that downregulation of GBAS regulated the activation levels of the p53 signaling pathway. Moreover, in terms of protein expression levels, our findings indicate that GBAS can also modulate several vital target genes of the p53 signaling pathway, such as TP53, AKT1, AKT2 and Bax. The TP53 gene may be the most common genetic target involved in the malignant tumor transformation. The protein product of the TP53 gene contributes to cell cycle control and apoptosis. Molecular epidemiological analyses revealed that several cancers, including breast, liver, and kidney malignancies, showed a high mutation detection rate of the TP53 gene.42 Therefore, TP53 might be nonfunctional due to mutations and cannot act as a tumor suppressor anymore. However, our direct sequence analysis has demonstrated that no TP53 gene mutations in OSCC tissues were detected. It was also reported that mutations of the TP53 gene did not seem to be a frequent event in OSCC patients.43,44 TP53 expression was increased significantly after GBAS knockdown in OSCC cells in the present research. The protein serine/threonine kinase Akt, also known as protein kinase B, plays an important role in the transduction of antiapoptotic signals. Activated AKT can promote cell growth, proliferation, survival, metabolism, and motility in several types of human cancers, including OSCC.45,46 There are three isoforms of AKT, AKT1, AKT2 and AKT3, which have very similar mechanisms of activation but are very different in the tissue expression. Expect for AKT3, AKT1 and AKT2 are ubiquitously expressed.47 Surprisingly, Gottlieb et al have found the interactions between AKT and p53, and discussed the possibility of their regulation of cell apoptosis.48 If the AKT-mediated survival signals are aborted, p53-dependent apoptosis cannot be blocked. Notably, it was demonstrated in the present study that AKT1 and AKT2 levels were suppressed significantly in GBAS knockdown cells. Bax was not only acting as the determinant of oncogenic transformation and chemosensitivity but also as a transcriptional target for p53 in human tumors.49–51
These data suggest that the effects of GBAS on tumor proliferation and apoptosis in vitro and tumor cell growth in vivo might involve p53-related modulation. Meanwhile, many previous researchers have also shown that the p53 signaling pathway is associated with increased cell proliferation in locally recurrent patients with other carcinomas, which is identical to our findings and further support the notion that functional p53 activation is critical for GBAS-mediated cancer progression.52,53
Conclusion
The results of this study confirmed the importance of GBAS in the proliferation and apoptosis of human oral cancer cells and revealed a novel GBAS-p53 signaling pathway regulatory network in OSCC for the first time. Nevertheless, only a few functions of GBAS have been well elucidated in our research. Therefore, further study should be devoted to the function and critical mechanism of cancer-specific GBAS in the progression of OSCC, which may provide supporting evidence to facilitate understanding its potential as a therapeutic target for this fatal tumor.
Acknowledgments
This study was supported by National Natural Science Foundation of China (Grant No 81771071), Non-profit Industry Research Specific Fund of National Health and Family Planning Commission of China (Grant No 201502018) and Jiangsu Health and Family Planning Commission Project of Scientific Research (Grant No H2017080).
Author contributions
All authors contributed to data analysis, drafting and revising the article, gave final approval of the version to be published, and agree to be accountable for all aspects of the work.
Disclosure
The authors report no conflicts of interest in this work.
References
1.
2. Warnakulasuriya S. Global epidemiology of oral and oropharyngeal cancer. Oral Oncol. 2009;45(4–5):309–316. doi:10.1016/j.oraloncology.2008.06.002
3. Alves AM, Diel LF, Lamers ML. Macrophages and prognosis of oral squamous cell carcinoma: a systematic review. J Oral Pathol Med. 2018;47(5):460–467. doi:10.1111/jop.2018.47.issue-5
4. Das S, Thomas S, Pal SK, et al. Hypofractionated palliative radiotherapy in locally advanced inoperable head and neck cancer: CMC Vellore experience. Indian J Palliat Care. 2013;19(2):93–98. doi:10.4103/0973-1075.116709
5. Hillier LW, Fulton RS, Fulton LA, et al. The DNA sequence of human chromosome 7. Nature. 2003;424(6945):157–164. doi:10.1038/nature01782
6. Yang S. Gene amplifications at chromosome 7 of the human gastric cancer genome. Int J Mol Med. 2007;20(2):225–231.
7. Li WD, Li D, Wang S, et al. Linkage and linkage disequilibrium mapping of genes influencing human obesity in chromosome region 7q22.1-7q35. Diabetes. 2003;52(6):1557–1561. doi:10.2337/diabetes.52.6.1557
8. Wainwright BJ, Scambler PJ, Schmidtke J, et al. Localization of cystic fibrosis locus to human chromosome 7cen-q22. Nature. 1985;318(6044):384–385. doi:10.1038/318384a0
9. Cheng LS, Davis RC, Raffel LJ, et al. Coincident linkage of fasting plasma insulin and blood pressure to chromosome 7q in hypertensive hispanic families. Circulation. 2001;104(11):1255–1260. doi:10.1161/hc3601.096729
10. Wang XY, Smith DI, Liu W, et al. GBAS, a novel gene encoding a protein with tyrosine phosphorylation sites and a transmembrane domain, is co-amplified with EGFR. Genomics. 1998;49(3):448–451. doi:10.1006/geno.1998.5239
11. Seroussi E, Pan HQ, Kedra D, et al. Characterization of the human NIPSNAP1 gene from 22q12: a member of a novel gene family. Gene. 1998;212(1):13–20. doi:10.1016/S0378-1119(98)00098-5
12. Brittain JM, Wang Y, Wilson SM, et al. Regulation of CREB signaling through L-type Ca2+ channels by Nipsnap-2. Channels. 2012;6(2):94–102. doi:10.4161/chan.19415
13. Hong MJ, Lee SY, Choi JE, et al. Intronic variant of EGFR is associated with GBAS expression and survival outcome of early-stage non-small cell lung cancer. Thorac Cancer. 2018;9(8):916–923. doi:10.1111/1759-7714.12757
14. Shen H, Liu L, Yang Y, et al. Betulinic acid inhibits cell proliferation in human oral squamous cell carcinoma via modulating ROS-regulated p53 signaling. Oncol Res. 2017;25(7):1141–1152. doi:10.3727/096504017X14841698396784
15. Lindemann A, Takahashi H, Patel AA, et al. Targeting the DNA damage response in OSCC with TP53 mutations. J Dent Res. 2018;97(6):635–644. doi:10.1177/0022034518759068
16. Aubrey BJ, Strasser A, Kelly GL. Tumor-suppressor functions of the TP53 pathway. Cold Spring Harb Perspect Med. 2016;6(5):
17. Bieging KT, Mello SS, Attardi LD. Unravelling mechanisms of p53-mediated tumour suppression. Nat Rev Cancer. 2014;14(5):359–370. doi:10.1038/nrc3711
18. Mitsudomi T, Yatabe Y. Epidermal growth factor receptor in relation to tumor development: EGFR gene and cancer. Febs J. 2010;277(2):301–308. doi:10.1111/j.1742-4658.2009.07448.x
19. Ribeiro FA, Noguti J, Oshima CT, et al. Effective targeting of the epidermal growth factor receptor (EGFR) for treating oral cancer: a promising approach. Anticancer Res. 2014;34(4):1547–1552.
20. Hsieh CH, Chang JW, Hsieh JJ, et al. Epidermal growth factor receptor mutations in patients with oral cavity cancer in a betel nutchewing-prevalent area. Head Neck. 2011;33(12):1758–1764. doi:10.1002/hed.21665
21. Yamamoto S, Okamoto T, Ogasawara N, et al. NIP-SNAP-1 and −2 mitochondrial proteins are maintained by heat shock protein 60. Biochem Biophys Res Commun. 2017;483(3):917–922. doi:10.1016/j.bbrc.2016.12.133
22. Rustin P. Mitochondria, from cell death to proliferation. Nat Genet. 2002;30(4):352–353. doi:10.1038/ng0402-352
23. Kluza J, Marchetti P, Gallego MA, et al. Mitochondrial proliferation during apoptosis induced by anticancer agents: effects of doxorubicin and mitoxantrone on cancer and cardiac cells. Oncogene. 2004;23(42):7018–7030. doi:10.1038/sj.onc.1207444
24. Hickey JL, Ruhayel RA, Barnard PJ, et al. Mitochondria-targeted chemotherapeutics: the rational design of gold(I) N-heterocyclic carbene complexes that are selectively toxic to cancer cells and target protein selenols in preference to thiols. J Am Chem Soc. 2008;130(38):12570–12571. doi:10.1021/ja804027j
25. Lai CK, Rao YK, Chang KR, et al. 3,3ʹ,4ʹ, 5ʹ-Tetramethoxychalcone inhibits human oral cancer cell proliferation and migration viap53-mediated mitochondrial-dependent apoptosis. Anticancer Res. 2014;34(4):1811–1819.
26. Malhotra A, Shibata Y, Hall IM, et al. Chromosomal structural variations during progression of a prostate epithelial cell line to a malignant metastatic state inactivate the NF2, NIPSNAP1, UGT2B17, and LPIN2 genes. Cancer Biol Ther. 2013;14(9):840–852. doi:10.4161/cbt.25329
27. Schoeber JP, Topala CN, Lee KP, et al. Identification of Nipsnap1 as a novel auxiliary protein inhibiting TRPV6 activity. Pflugers Arch. 2008;457(1):91–101. doi:10.1007/s00424-008-0549-7
28. Lin CC, Lee MH, Lin JH, et al. Crude extract of rheum palmatum L. Induces cell cycle arrest S phase and apoptosis through mitochondrial-dependent pathways in U-2 OS human osteosarcoma cells. Environ Toxicol. 2016;31(8):957–969. doi:10.1002/tox.22105
29. Won SH, Lee HJ, Jeong SJ, et al. Tanshinone IIA induces mitochondria dependent apoptosis in prostate cancer cells in association with an inhibition of phosphoinositide 3-kinase/AKT pathway. Biol Pharm Bull. 2010;33(11):1828–1834.
30. Wasiak S, Zunino R, McBride HM. Bax/Bak promote sumoylation of DRP1 and its stable association with mitochondria during apoptotic cell death. J Cell Biol. 2007;177(3):439–450. doi:10.1083/jcb.200610042
31. Shirasaki DI, Greiner ER, Al-Ramahi I, et al. Network organization of the huntingtin proteomic interactome in mammalian brain. Neuron. 2012;75(1):41–57. doi:10.1016/j.neuron.2012.05.024
32. Qi ML, Tagawa K, Enokido Y, et al. Proteome analysis of soluble nuclear proteins reveals that HMGB1/2 suppress genotoxic stress in polyglutamine diseases. Nat Cell Biol. 2007;9(4):402–414. doi:10.1038/ncb1553
33. Furnari B, Rhind N, Russell P. Cdc25 mitotic inducer targeted by chk1 DNA damage checkpoint kinase. Science. 1997;277(5331):1495–1497. doi:10.1126/science.277.5331.1495
34. Ronco C, Martin AR, Demange L, et al. ATM, ATR, CHK1, CHK2 and WEE1 inhibitors in cancer and cancer stem cells. Medchemcomm. 2016;8(2):295–319. doi:10.1039/C6MD00439C
35. Flynn RL, Zou L. ATR: a master conductor of cellular responses to DNA replication stress. Trends Biochem Sci. 2011;36(3):133–140. doi:10.1016/j.tibs.2010.09.005
36. McNeely S, Beckmann R, Bence Lin AK. CHEK again: revisiting the development of CHK1 inhibitors for cancer therapy. Pharmacol Ther. 2014;142(1):1–10. doi:10.1016/j.pharmthera.2013.10.005
37. Abdel-Fatah TM, Middleton FK, Arora A, et al. Untangling the ATR-CHEK1 network for prognostication, prediction and therapeutic target validation in breast cancer. Mol Oncol. 2015;9(3):569–585. doi:10.1016/j.molonc.2015.05.003
38. Bidaud P, Chasle J, Sichel F, et al. Expression of p53 family members and CD44 in oral squamous cell carcinoma (OSCC) in relation to tumorigenesis. Histol Histopathol. 2010;25(3):331–339.
39. Bates S, Vousden KH. p53 in signaling checkpoint arrest or apoptosis. Curr Opin Genet Dev. 1996;6(1):12–18.
40. Huart AS, Saxty B, Merritt A, et al. A Casein kinase 1/Checkpoint kinase 1 pyrazolo-pyridine protein kinase inhibitor as novel activator of the p53 pathway. Bioorg Med Chem Lett. 2013;23(20):5578–5585. doi:10.1016/j.bmcl.2013.08.046
41. Vitale I, Senovilla L, Galluzzi L, et al. Chk1 inhibition activates p53 through p38 MAPK in tetraploid cancer cells. Cell Cycle. 2008;7(13):1956–1961. doi:10.4161/cc.7.13.6073
42. Robles AI, Harris CC. Clinical outcomes and correlates of TP53 mutations and cancer. Cold Spring Harb Perspect Biol. 2010;2(3):a001016. doi:10.1101/cshperspect.a001016
43. Ara N, Atique M, Ahmed S, et al. Frequency of p53 gene mutation and protein expression in oral squamous cell carcinoma. J Coll Physicians Surg Pak. 2014;24(10):7497.
44. Acha-Sagredo A, Ruesga MT, Rodriguez C, et al. p53 mutation is rare in oral mucosa brushings from patients previously treated for a head and neck squamous cell carcinoma. Oral Oncol. 2009;45(8):661–664. doi:10.1016/j.oraloncology.2008.10.002
45. Katso R, Okkenhaug K, Ahmadi K, et al. Cellular function of phosphoinositide 3-kinases: implications for development, homeostasis, and cancer. Annu Rev Cell Dev Biol. 2001;17:615–675. doi:10.1146/annurev.cellbio.17.1.615
46. Wang Y, Lin L, Xu H, et al. Genetic variants in AKT1 gene were associated with risk and survival of OSCC in Chinese han population. J Oral Pathol Med. 2015;44(1):45–50. doi:10.1111/jop.12211
47. Dummler B, Hemmings BA. Physiological roles of PKB/Akt isoforms in development and disease. Biochem Soc Trans. 2007;35(Pt 2):231–235. doi:10.1042/BST0350484
48. Gottlieb TM, Leal JF, Seger R, et al. Cross-talk between Akt, p53 and Mdm2: possible implications for the regulation of apoptosis. Oncogene. 2002;21(8):1299–1303. doi:10.1038/sj.onc.1205181
49. Chipuk JE, Kuwana T, Bouchier-Hayes L, et al. Direct activation of Bax by p53 mediates mitochondrial membrane permeabilization and apoptosis. Science. 2004;303(5660):1010–1014. doi:10.1126/science.1092734
50. McCurrach ME, Connor TM, Knudson CM, et al. bax-deficiency promotes drug resistance and oncogenic transformation by attenuating p53-dependent apoptosis. Proc Natl Acad Sci U S A. 1997;94(6):2345–2349. doi:10.1073/pnas.94.6.2345
51. Melincovici CS, Mihu CM, Mărginean M, et al. The prognostic significance of p53, Bax, Bcl-2 and cyclin E protein overexpression in colon cancer - an immunohistochemical study using the tissue microarray technique. Rom J Morphol Embryol. 2016;57(1):81–89.
52. de Roos MA, de Bock GH, de Vries J, et al. p53 overexpression is a predictor of local recurrence after treatment for both in situ and invasive ductal carcinoma of the breast. J Surg Res. 2007;140(1):109–114. doi:10.1016/j.jss.2006.10.045
53. Grabenbauer GG, Mühlfriedel C, Rödel F, et al. Squamous cell carcinoma of the oropharynx: ki-67 and p53 can identify patients at high risk for local recurrence after surgery and postoperative radiotherapy. Int J Radiat Oncol Biol Phys. 2000;48(4):1041–1050. doi:10.1016/S0360-3016(00)00737-9
 © 2019 The Author(s). This work is published and licensed by Dove Medical Press Limited. The full terms of this license are available at https://www.dovepress.com/terms.php and incorporate the Creative Commons Attribution - Non Commercial (unported, v3.0) License.
By accessing the work you hereby accept the Terms. Non-commercial uses of the work are permitted without any further permission from Dove Medical Press Limited, provided the work is properly attributed. For permission for commercial use of this work, please see paragraphs 4.2 and 5 of our Terms.
© 2019 The Author(s). This work is published and licensed by Dove Medical Press Limited. The full terms of this license are available at https://www.dovepress.com/terms.php and incorporate the Creative Commons Attribution - Non Commercial (unported, v3.0) License.
By accessing the work you hereby accept the Terms. Non-commercial uses of the work are permitted without any further permission from Dove Medical Press Limited, provided the work is properly attributed. For permission for commercial use of this work, please see paragraphs 4.2 and 5 of our Terms.