")
Back to Journals » Journal of Inflammation Research » Volume 16
Down Regulation of EGF and AZGP1 Were Associated with Clinical Characteristics in Chronic Rhinosinusitis with Nasal Polyps: An Observation Study
Authors Jin P , Zhang Q, Zang Y, Zhao L, Zhang H , Yu K, Liang X, Zi X, Shi L
Received 29 June 2023
Accepted for publication 12 October 2023
Published 28 October 2023 Volume 2023:16 Pages 4885—4898
DOI https://doi.org/10.2147/JIR.S428238
Checked for plagiarism Yes
Review by Single anonymous peer review
Peer reviewer comments 2
Editor who approved publication: Professor Ning Quan
Peng Jin,* Qinqin Zhang,* Yiran Zang, Li Zhao, Hongyang Zhang, Kena Yu, Xu Liang, Xiaoxue Zi, Li Shi
Department of Otolaryngology, The Second Hospital of Shandong University, Jinan, People’s Republic of China
*These authors contributed equally to this work
Correspondence: Xiaoxue Zi, Department of Otolaryngology, The Second Hospital of Shandong University, No. 247, Beiyuan Road, Jinan, Shandong Province, 250033, People’s Republic of China, Tel +86 531 85875226, Email [email protected]
Objective: The mechanisms underlying the chronic rhinosinusitis with nasal polyps (CRSwNP) remained unclear. This study aimed to identify differentially expressed genes (DEGs) in nasal polyps from CRSwNP patients compared to healthy controls and explore key genes and pathways associated with CRSwNP pathophysiology and prognosis.
Methods: Three datasets were obtained from the Gene Expression Omnibus database and the intersecting DEGs were identified in CRSwNP patients. Gene Ontology (GO) and protein-protein interaction (PPI) network analysis were applied to investigate the function of DEGs. Nasal specimens from 90 CRSwNP and 45 controls were further collected and qRT-PCR was applied to verify the mRNA expression of hub genes, and moreover, their association with tissue eosinophilia and clinical characteristics in CRSwNP were analyzed.
Results: Sixty-eight co-DEGs including 8 upregulated and 60 downregulated genes were identified and GO analyses identified the terms including positive regulation of ERK1 and ERK2 cascade, transforming growth factor beta receptor signaling pathway. PPI networks identified hub genes including EGF, ERBB4, AZGP1, CRISP3 and PIP which were validated to be significantly down-regulated in CRSwNP and showed well diagnostic prediction quality. In addition, lower mRNA expressions level of EGF and AZGP1 in eosinophilic CRSwNP compared with non-eosinophilic CRSwNP were found. Aberrant low expressions of EGF and AZGP1 protein in CRSwNP were identified, and there was good consistency between their mRNA expression level and protein relative expression level. Furthermore, the expressions of EGF and AZGP1 mRNA were significantly correlated with clinical severity parameters.
Conclusion: Integrated analysis revealed 68 co-DEGs between nasal polyps and controls and identified hub genes, of which EGF and AZGP1 expression was significantly downregulated in eosinophilic CRSwNP and correlated with disease severity. Downregulation of EGF and AZGP1 may contribute to epithelial barrier dysfunction and type 2 inflammation in CRSwNP, suggesting them as potential diagnostic biomarkers and therapeutic targets.
Keywords: chronic rhinosinusitis with nasal polyps, bioinformatics analysis, differentially expressed genes, EGF, AZGP1
Introduction
Chronic rhinosinusitis with nasal polyps (CRSwNP) is a common chronic upper airway inflammatory disorder with high prevalence, significant impact on health-related quality of life (HRQoL) and it is associated with substantial healthcare and productivity costs.1,2 Great efforts have been done to explore the underlying pathogenic factors of CRSwNP, the known biological processes implicated in CRSwNP are multifaceted, mainly including barrier deficits, alteration of ion channels or genes involved in the TH2 inflammatory response, dysregulation of the host immune system and mucociliary clearance (MCC) dysfunction.3–7 However, CRSwNP enjoys higher recurrence rates and poor response to standard therapies, especially for eosinophilic CRSwNP.8 Ineffective clinical management of CRSwNP partly due to the limited understanding of molecular mechanisms underlying pathogenesis and a paucity of effective therapeutic interventions, particularly in eosinophilic CRSwNP. So, understanding the mechanisms that underlie CRSwNP pathogenesis may help identify targets in critical candidate pathways for therapeutic interventions.
High-throughput sequencing and bioinformatic analysis have emerged as highly effective tools in recent years.9 Nevertheless, large numbers of microarray data have not been fully utilized. Reanalyzing existing microarray datasets with latest bioinformatics tools may uncover new pathogenic factors that were missed in original studies. Integrating data from multiple studies can overcome limitations of individual datasets and enhance the power to identify robust gene signatures. Bioinformatics analysis approaches that use well-powered datasets are necessary to thoroughly elucidate gene signatures and reveal novel pathogenic factors and therapeutic targets in CRSwNP.
In the present study, we identified differentially expressed genes (DEGs) in nasal polyps from CRSwNP patients compared to healthy controls to discover key genes and pathways associated with CRSwNP pathophysiology and prognosis through functional enrichment and network analysis of the DEGs, and verified the expression and clinical relevance of the hub genes experimentally. The gene signatures and candidate pathways would help identify disease targets and novel treatment options such as biologics for CRSwNP.
Materials and Methods
Study Design
The whole research was divided into discovery phase and verification phase. This study complies with the Declaration of Helsinki. The written informed forms from all participants in this study was obtained. Approval for this study was obtained from the institutional review board (IRB) of the Second Hospital of Shandong University, China [China approval number: KYLL-2021 (KJ) P-0241]. Details of the study workflow including data collection, data analysis, subject recruitment, data verification and interpretation are shown in Figure 1.
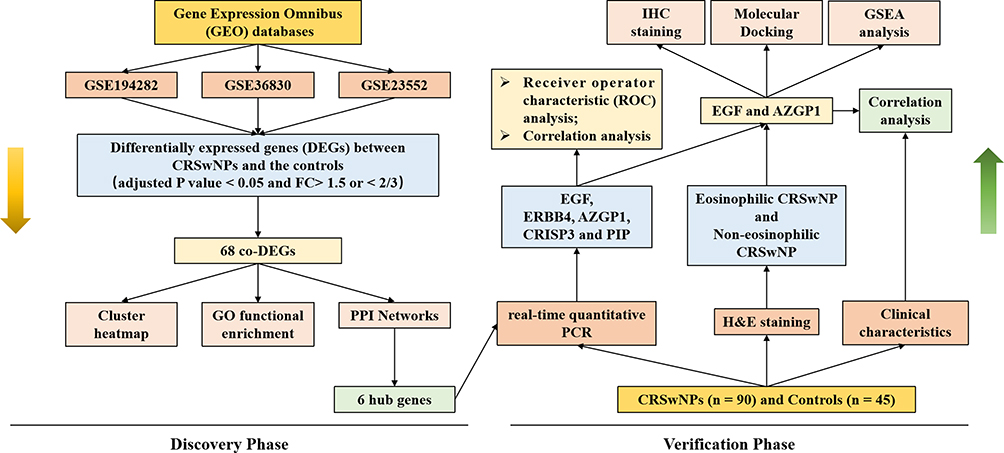 |
Figure 1 Study workflow from data analysis to subject recruitment and interpretation. |
Microarray Data Collection and Multiple-Dataset Integration Analysis
Three datasets including GSE194282, GSE36830 and GSE23552 were selected from the Gene Expression Omnibus (GEO) database (https://www.ncbi.nlm.nih.gov/geo/) and the details of the 3 datasets are summarized in Table S1. The corresponding series of matrix TXT files and platform TXT files were downloaded and the R package “limma” was used to test the expression data and search for DEGs. lmFit function fits a linear model and makeContrast function expresses contrasts between the coefficients from the linear model fit as a numeric matrix, function eBayes was then used to rank genes in order of evidence for differential expression, calculated using the Benjamini-Hochberg method in order to minimize false discovery rate (FDR). Statistically significant differences were determined by FDR < 0.05, and the fold change (FC) > 1.5 or < 2/3 (|log FC| > 0.585). Then, the volcano maps of each dataset were generated, the intersecting DEGs were created by the Draw Venn Diagram (http://bioinformatics.psb.ugent.be/webtools/Venn) and the heatmap of the intersecting DEGs were visualized by R software.
Gene Ontology (GO) Enrichment, Protein–Protein Interaction (PPI) Network Construction and Hub Genes Identification
GO functional enrichment analysis is a commonly used method for annotating genes and identifying characteristic biological attributes of high-throughput genome or transcriptome data.10,11 The GO functional enrichment of the intersecting DEGs was carried out via the hypergeometric test using the clusterProfiler R package, with the cut-off value of P less than 0.05 and q less than 0.2. To identify the PPI, the intersecting DEGs were uploaded to STRING (http://string-db.org/) with the combined score value set as >0.4. Then, Cytoscape (version 3.9.1, USA) software was used for PPI network visualization, and the hub genes were identified by the plug-ins of Cytoscape software Molecular Complex Detection (MCODE) with cluster degrees no less than 8, the node score cutoff (NSC) was set as 0.2, and k-core, a parameter of connectedness for nodes in a network, was set as 2.
Patients Recruitment
A total of 90 patients with CRSwNP including 56 eCRSwNP cases and 34 non-eCRSwNP cases and 45 control subjects were recruited for this study from the Department of Otolaryngology, the Second Hospital of Shandong University. The diagnosis of CRSwNP was made according to the European Position Paper on Rhinosinusitis and Nasal Polyps guidelines.1,12 Nasal polyp tissues were obtained from CRSwNP patients who underwent functional endoscopic sinus surgery. Middle turbinate and uncinate tissues from control subjects without other sinonasal diseases were those undergoing septoplasty because of anatomic variations. None of the patients had been treated with corticosteroids, immunomodulatory agents, or antibiotics within 4 weeks before enrollment. The exclusion criteria were as follows: age <18 or >80 years, patients with acute infections, a diagnosis of cystic fibrosis, immunodeficiency, aspirin intolerance, autoimmune disease and fungal sinusitis. Details of the subjects’ characteristics are included in Table 1. Due to the limited sizes of the tissue, not all specimens were used for each analysis.
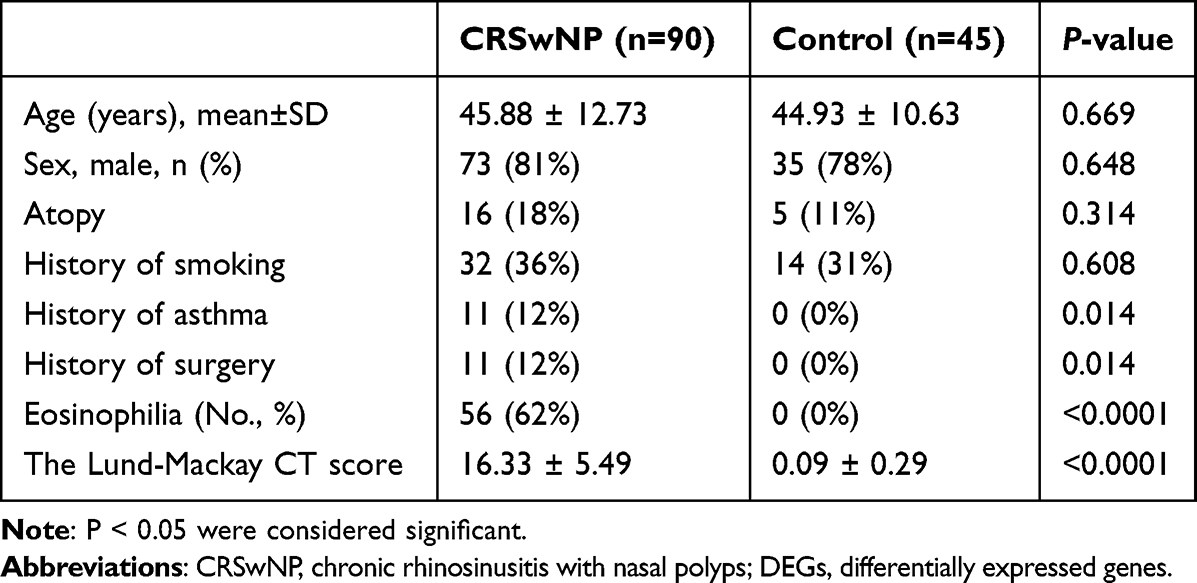 |
Table 1 The Clinical Characteristics of CRSwNP and Control Subjects for DEGs Verification |
Clinical Characteristics Collection of CRSwNP Patients
Visual Analogue Scale (VAS) scores and Sino Nasal Outcome Test-22 (SNOT-22) questionnaires were used to assess symptoms severity in CRSwNP patients. For VAS, seven typical symptoms including nasal congestion, purulent rhinorrhea, smell loss, headache/facial pain, sneezing, nasal itching and eye itching were evaluated by patients with scores from 0 (symptom not present) to 10 (symptom at its most severe). SNOT-22 questionnaires include 22 questions, and the questions were classified to five major domains including rhinologic, extranasal rhinologic, ear/facial, psychological and sleep dysfunction. Each item in each domain was scored from 0 to 5. Moreover, computed tomography (CT) results were recorded by Lund-Mackay Score (LMS) system. Each sinus (maxillary, anterior ethmoid, posterior ethmoid, sphenoid and frontal) was scored as 0 (completely transparent), 1 (partially opaque) and 2 (completely opaque), and the osteomeatal complex (OMC) region scores of 0 or 2 (not occluded/occluded), so that the sum of all sinus and OMC region scores range from 0 to 24.
RNA Extraction and Real-Time Quantitative PCR (RT-qPCR)
Fresh tissues were collected and stored in RNAlater solution (Thermo Fisher Scientific, Waltham, MA, USA). Total RNA was isolated by using a power homogenizer (TIANGEN, China) and TRIzol® reagent (Invitrogen, USA) followed by 1 μg total RNA reverse transcribed to cDNA with reversing transcription kit (Thermo, USA) based on the manufacturer’s protocol. The mRNA expression levels of EGF, ERBB4, PDGFC, AZGP1, CRISP3 and PIP were validated by real-time RT-PCR analysis (Mastercycler Nexus, Eppendorf, Germany) with the SYBR Green PCR Master Mix Kit (Takara, Japan). The relative expression was calculated by using the 2−ΔΔCt methods normalized against the housekeeping gene, glyceraldehyde 3-phosphate dehydrogenase (GAPDH). The details of primer sequences are presented in Table S2.
Receiver Operating Characteristics (ROC) Curve Analysis
ROC curve analysis was performed based on GraphPad Prism 7.04 (GraphPad Software, La Jolla, CA) for evaluating the sensitivity and specificity of 5 hub genes expression in CRSwNP diagnosis. The area under curve (AUC) is calculated to assess the veracity and reliability of diagnosis to discriminate the CRSwNP patients from normal subjects. The corresponding cutoff points of the ROC curve were determined by the Youden’s Index. The sensitivity, specificity and 95% confidence intervals (CIs) were calculated using the binary regression model.
Hematoxylin and Eosin (H&E) and Immunohistochemistry (IHC) Staining
Tissue specimens were obtained during surgery and soaked in 10% formalin. The embedded tissues were cut into 5 μm sections. Slides were stained with H&E for eosinophil infiltration evaluation. The number of eosinophils was counted in 5 randomly selected high-power fields (HPF) by two different observers who were unaware of the clinical data. Tissue specimens were denoted in terms of eosinophilic CRSwNP when the count of eosinophils was higher than 10 per HPF.
The localization and expression of EGF and AZGP1 protein was examined by IHC staining. The slides were incubated with citrate buffer (pH 6.0) in a 97°C constant temperature water bath, treated with freshly prepared 3% hydrogen peroxide for 15 minutes and further washed in PBS buffered saline. Then the slides were incubated overnight at 4°C with anti-EGF (EGF-10, Abcam, Cambridge, UK; 1:100 dilution) and anti-AZGP1 (Santa Cruz Biotechnology, Inc, sc-13585; 1:50 dilution). After that, the slides were incubated with DAKO EnVision+System-HRP (Dako A/S, Glostrup, Denmark) at room temperature for 30 minutes and developed by using DAB as substrate. Five random areas for each sample were selected for qualitatively immunostaining analysis by using the Image Pro Plus software (version 6.0) to semi-quantitatively determine the average optical density values.
Molecular Docking
The X-ray crystal structures of AZGP1 (1T7W) and EGF (1NQL) were retrieved from the Protein Data Bank. First, the protein was eliminated the water molecules and added the polar hydrogen manually in the AutoDockTools-1.5.7 to ensure the accuracy of the docking results.13 Then, Docking Web Server (GRAMM) was used for protein–protein docking.14 Finally, the protein–protein interactions were predicted and the protein–protein interaction figure was generated by PyMOL.
Gene Set Enrichment Analysis (GSEA)
To further explore the potential function of EGF and AZGP1 in CRSwNP, the CRSwNP samples in GSE36830 were divided into 2 groups (high vs low) according to the median expression value of EGF and AZGP1. The molecular signaling pathways involved in CRSwNP at these groups of gene set level were performed by GSEA. Then clusterprofiler package of R was utilized to conduct GSEA, and the “h.all.v2023.1.Hs.entrez.gmt” were selected as reference gene sets, which were downloaded from the Molecular Signature Database (MSigDB, http://software.broadinstitute.org/gsea/msigdb).15,16 An adjusted P value < 0.05 was chosen as the cut-off criteria.
Statistical Analysis
Statistical analysis was conducted by using GraphPad Prism 7.04 (GraphPad Software, La Jolla, CA) and SPSS 25.0 for Windows (IBM, Chicago, USA). The Mann–Whitney U-test and Chi-square test were used to detect the differences between the two groups. The Spearman correlation coefficient was used to estimate the correlation between two statistical variables. The receiver operator characteristic (ROC) curve was used to calculate the area under the curve (AUC) to discriminate the CRSwNP patients from normal subjects. P < 0.05 was considered statistically significant in all cases.
Results
The Screening of DEGs
Integrative datasets analysis is a way to avoid a high proportion of false positives in an individual dataset. We identified 336, 924 and 1291 genes that were significantly differentially expressed in nasal polyps compared to control tissues from GSE194282, GSE36830 and GSE23552, separately, and the volcano plots are shown in Figure 2A–C, respectively. Then, as it is displayed in Figure 2D, 68 co-DEGs including 8 upregulated and 60 downregulated genes were derived from the intersections of the three GEO datasets (details were showed in Table S3), and the cluster heatmap of the intersecting DEGs is shown in Figure 2E to visualize the changes in up- and down-regulated genes.
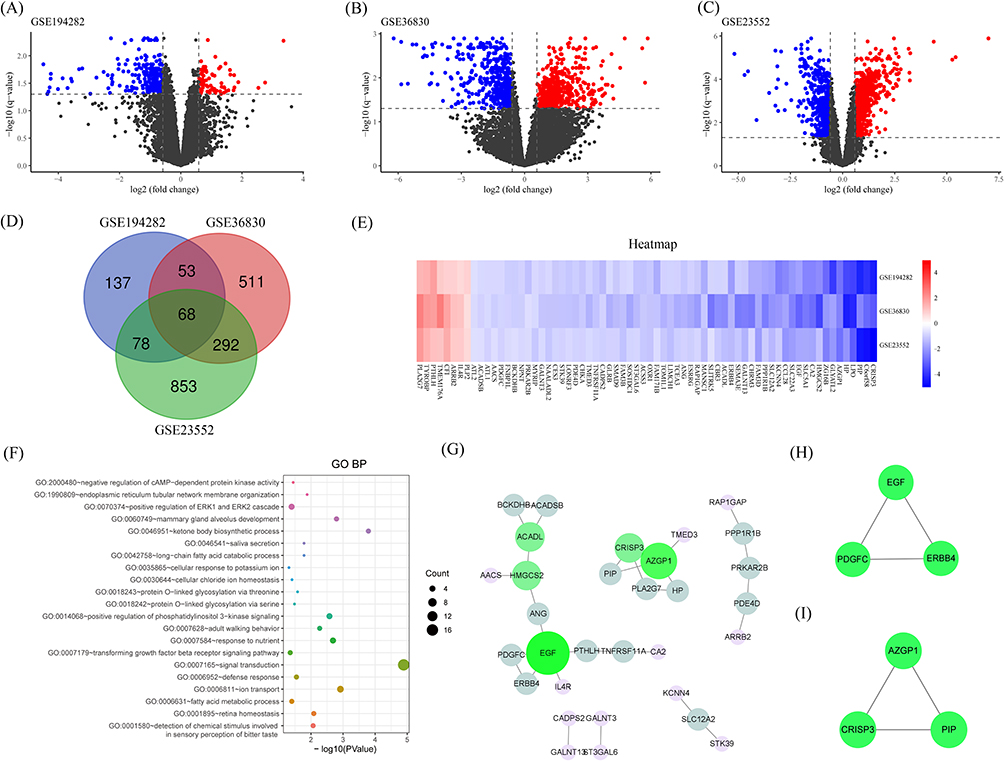 |
Figure 2 The screening of DEGs, GO BP analysis, PPI network and identification of hub genes. (A) Volcano plots of GSE194282; (B) Volcano plots of GSE36830; (C) Volcano plots of GSE23552; statistically significant differences were determined by an adjusted P value of < 0.05 and the fold change (FC) > 1.5 or < 2/3. (D) Venn diagram of the three GEO datasets. (E) Heatmap of 68 intersecting DEGs in CRSwNP compared to healthy controls. Red represents logFC >0, while blue represents logFC <0. (F) Bubble plots of GO terms; P < 0.05 were considered significant. (G) PPI network of 68 intersecting DEGs; the node colors representing the extent of the protein; green represents high and purple represents low; the combined score value set as > 0.4. (H) The sub-network of hub genes including EGF, ERBB4 and PDGFC; (I) The sub-network of hub genes including AZGP1, CRISP3 and PIP; the cluster degrees set as no less than 8. Abbreviations: CRSwNP, chronic rhinosinusitis with nasal polyps; DEGs, differentially expressed genes; GO, Gene Ontology; BP, biological processes; PPI, protein–protein interaction; EGF, epidermal growth factor; ERBB4, Erb-B2 receptor tyrosine kinase 4; PDGFC, platelet derived growth factor C; AZGP1, alpha-2-glycoprotein 1, zinc-binding; CRISP3, cysteine rich secretory protein 3; PIP, prolactin induced protein. |
Functional and Pathway Enrichment Analysis
Notably, the biological processes (BP) terms associated with the intersecting DEGs were signal transduction, positive regulation of phosphatidylinositol 3-kinase signaling, adult walking behavior, retina homeostasis, detection of chemical stimulus involved in sensory perception of bitter taste, saliva secretion, negative regulation of cAMP-dependent protein kinase activity, fatty acid metabolic process, positive regulation of ERK1 and ERK2 cascade, and transforming growth factor beta receptor signaling pathway and cellular response to potassium ion, etc (all P<0.05) (Figure 2F) (details were showed in Table S4).
The Identification of Hub Genes from PPI Networks
PPI networks were constructed to investigate the biological functions of the intersecting DEGs, which contained 29 nodes and 31 edges, and the isolated genes without interactions were removed (Figure 2G). Then, 2 sub-networks with hub genes including EGF, ERBB4, PDGFC, AZGP1, CRISP3 and PIP were identified by the MCODE (Figure 2H and I).
Validation, ROC and Correlation Analysis of Hub Genes
The gene expression levels of 6 hub genes in nasal polyps and controls were determined by qRT-PCR to further validate the results of bioinformatics analysis. Except for PDGFC, the expression levels of EGF, ERBB4, AZGP1, CRISP3 and PIP were significantly down-regulated in CRSwNP (all P < 0.05) (Figure 3Aa–Af), which was consistent with the results identified by bioinformatics analysis.
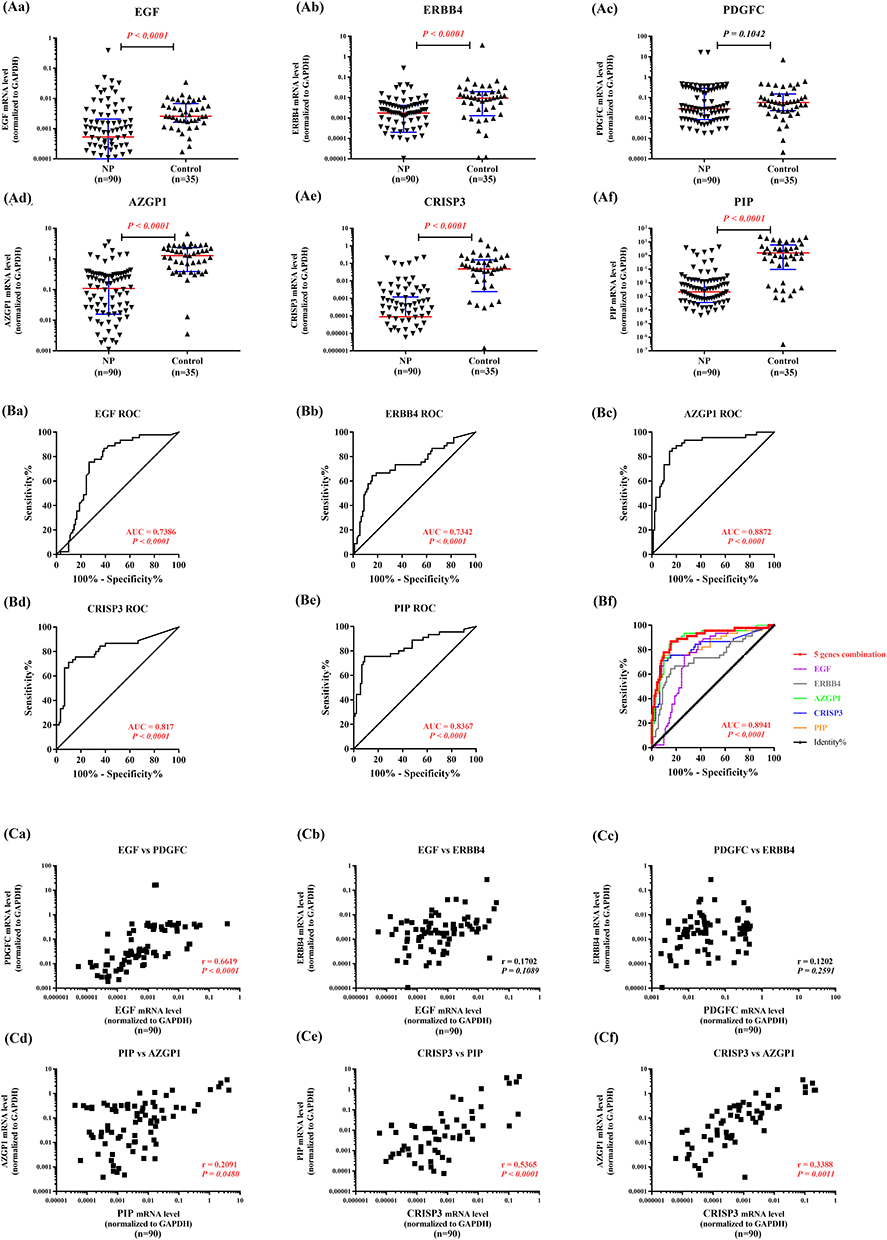 |
Figure 3 The mRNA expression levels and diagnostic values of hub genes in CRSwNP. The gene expression levels of EGF (Aa), ERBB4 (Ab), PDGFC (Ac), AZGP1 (Ad), CRISP3 (Ae) and PIP (Af) in CRSwNP compared to the controls with GAPDH was used as a reference. ROC profiles of EGF (Ba), ERBB4 (Bb), AZGP1 (Bc), CRISP3 (Bd), PIP (Be) as well as the combinations of the above genes (Bf). Correlation between mRNA expression levels of gene in each sub-network, including EGF and PDGFC (Ca), EGF and ERBB4 (Cb), PDGFC and ERBB4 (Cc), PIP and AZGP1 (Cd), CRISP3 and PIP (Ce) and CRISP3 and AZGP1 (Cf). P-values < 0.05 was considered statistically significant. Abbreviations: CRSwNP, chronic rhinosinusitis with nasal polyps; EGF, epidermal growth factor; ERBB4, Erb-B2 receptor tyrosine kinase 4; PDGFC, platelet derived growth factor C; AZGP1, alpha-2-glycoprotein 1, zinc-binding; CRISP3, cysteine rich secretory protein 3; PIP, prolactin induced protein. |
To determine the diagnostic values of EGF, ERBB4, AZGP1, CRISP3 and PIP for CRSwNP, the receiver operator characteristic (ROC) analysis was performed. Regarding diagnostic prediction quality, these 5 genes performed well with the area under the curves (AUC) are 0.7386, 0.7342, 0.8872, 0.817 and 0.8367, respectively (Figure 3Ba–Be). The AUC of the combined detection of the 5 indexes was 0.8941, which was higher than that of every single detection (Figure 3Bf).
Furthermore, we analyzed the correlations between the mRNA expression of the genes in each PPI sub-network. We found in the EGF-ERBB4-PDGFC sub-network, only the expression of EGF and PDGFC was significantly positively correlated (r=0.6619, P<0.0001). But in the AZGP1-CRISP3-PIP sub-network, PIP and AZGP1 (r = 0.2091, P=0.048), CRISP3 and PIP (r = 0.5365. P<0.0001) and AZGP1 and CRISP3 (r = 0.3388, P=0.0011) were found significantly positively correlated (Figure 3Ca–Cf).
Down Regulation of EGF and AZGP1 mRNA Expression Level in Eosinophilic CRSwNP Compared with Non-Eosinophilic CRSwNP
In this study, 62% of CRSwNP showed tissue eosinophilia (n = 56) (Table 1). Typical H&E staining of control, eosinophilic CRSwNP and non-eosinophilic CRSwNP are shown in Figure 4 A–C. The mRNA expression of EGF, ERBB4, AZGP1, CRISP3 and PIP in eosinophilic CRSwNP and non-eosinophilic CRSwNP were further analyzed (Figure 4D–4H), and only EGF (P < 0.05) (Figure 4D) and AZGP1 (P < 0.05) (Figure 4F) were found to express a lower level in eosinophilic CRSwNP compared to non-eosinophilic CRSwNP. Furthermore, the mRNA expression of EGF and AZGP1 was significantly positively correlated (r = 0.6274, P < 0.001) (Figure 4I).
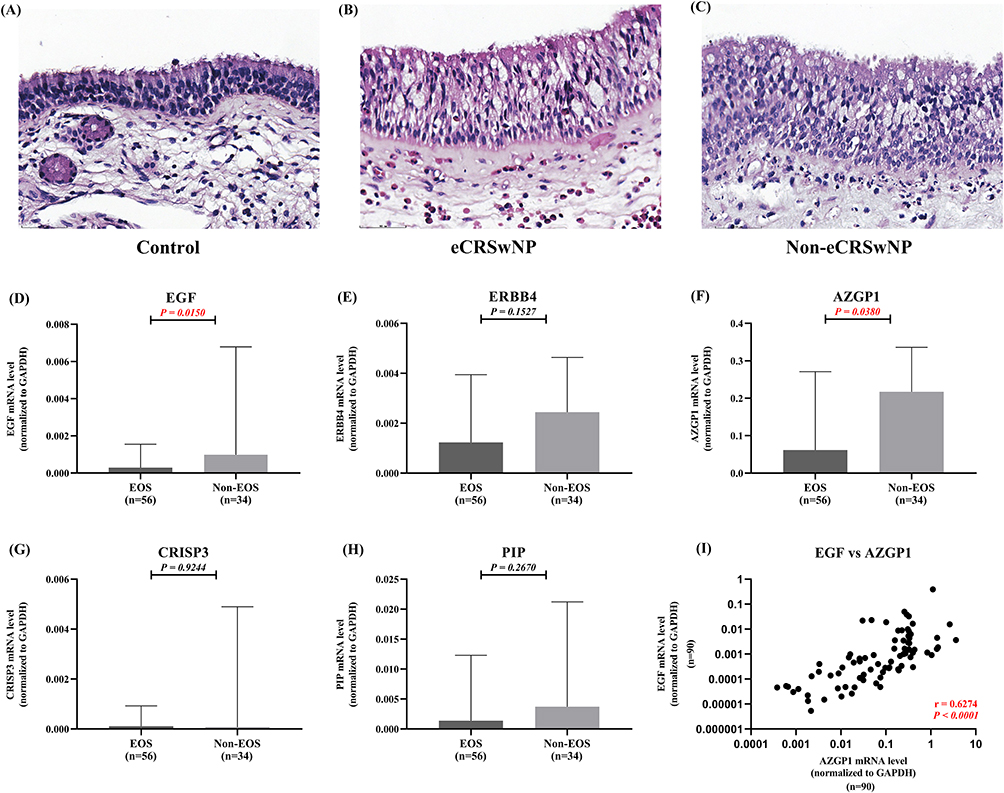 |
Figure 4 Down regulation of EGF and AZGP1 mRNA expression level in eosinophilic CRSwNP compared with non-eosinophilic CRSwNP. Typical H&E staining (original magnification ×400) of the nasal mucosa from controls (A), eosinophilic CRSwNP (B) and non-eosinophilic CRSwNP (C). The comparison of EGF (D), ERBB4 (E), AZGP1 (F), CRISP3 (G) and PIP (H) between eosinophilic CRSwNP and non-eosinophilic CRSwNP. The correlation between the mRNA expression of EGF and AZGP1 (I). P-values < 0.05 was considered statistically significant. Abbreviations: CRSwNP, chronic rhinosinusitis with nasal polyps; EGF, epidermal growth factor; ERBB4, Erb-B2 receptor tyrosine kinase 4; AZGP1, alpha-2-glycoprotein 1, zinc-binding; CRISP3, cysteine rich secretory protein 3; PIP, prolactin induced protein. |
Aberrant Expression of EGF and AZGP1 Protein in CRSwNP
EGF protein showed a distribution within both the nasal epithelium (mostly confined to the basal cell layer) and sub-epithelium (including submucosal gland and cells). Immunohistochemical analysis revealed a strong staining for EGF in control subjects compared with CRSwNP (Figure 5A–C). AZGP1 protein showed a distribution mainly in submucosal gland. In CRSwNP patients, a significant decrease in submucosal gland density of AZGP1 was observed (Figure 5D–F). Further analysis found that there is good consistency between the mRNA expression level and protein relative expression level for both EGF (r = 0.4308, P < 0.05) and AZGP1 (r = 0.6990, P < 0.01) (Figure 5G and H).
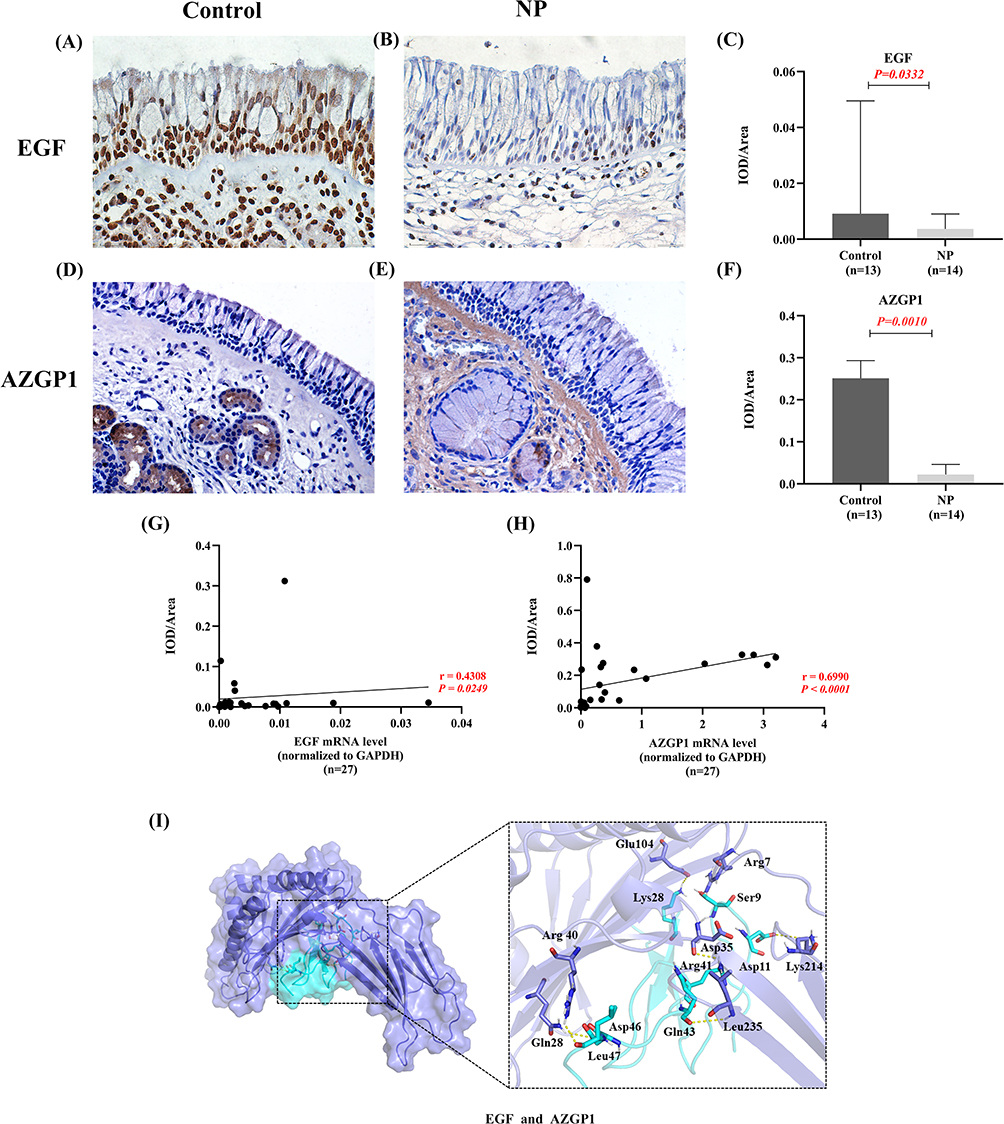 |
Figure 5 The location distribution, expression and interaction of EGF and AZGP1 protein. (A) The expression of EGF protein by IHC in control. (B) The expression of EGF protein by IHC in CRSwNP. (C) The semi-quantity of EGF protein expression in control compared with in CRSwNP by the average optical density value. (D) The expression of AZGP1 protein by IHC in control. (E) The expression of AZGP1 protein by IHC in CRSwNP. (F) The semi-quantity of AZGP1 protein expression in control compared with in CRSwNP by the average optical density value. (G) The correlation between the expression of EGF mRNA and protein. (H) The correlation between the expression of AZGP1 mRNA and protein. (I) EGF (the cyan model) is docked into AZGP1 (the slate model) through hydrogen bonding interactions and their binding sites are shown as pink stick structures. P-values < 0.05 was considered statistically significant. Abbreviations: EGF, epidermal growth factor; AZGP1, alpha-2-glycoprotein 1, zinc-binding; CRSwNP, chronic rhinosinusitis with nasal polyps; IHC, immunohistochemistry staining. |
Molecular Docking Between EGF Protein and AZGP1 Protein
All functional residues were identified and classified according to their interactions by Pymol. In the hydrogen bonding interaction, multiple groups of residues were used to form hydrogen bonds between AZGP1 and EGF, such as the hydrogen bond formed by Glu104 of AZGP1 and Lys28 of EGF. With these interaction forces, the scoring of AZGP1-EGF is −376, which is a good performance (Figure 5I).
Correlation Between EGF and AZGP1 mRNA Expression with Clinical Features in Patients with CRSwNP
To better explain the association of both EGF and AZGP1 with the severity of CRSwNP, we explored correlation analysis between the mRNA expression of the two genes and clinical features including VAS scores, SNOT-22 scores and Lund-Mackay CT scores. Firstly, the high-expression group and low-expression group were divided based on the mRNA level of EGF; VAS scores including nasal congestion (P < 0.05), smell loss (P < 0.05), sneezing (P < 0.01), nasal itching (P < 0.01) and eye itching (P < 0.01) were significantly higher in low-EGF group than in high-EGF group; SNOT-22 scores including rhinologic (P < 0.01), psychological (P < 0.05) and SNOT-22 (P < 0.01) total scores were significantly higher in low-EGF group than in high-EGF group; however, no significant differences of Lund–Mackay CT scores were found between the two groups. Then, the high-expression group and low-expression group were divided based on the mRNA level of AZGP1; VAS scores including nasal congestion (P < 0.01), smell loss (P < 0.05), sneezing (P < 0.05) and nasal itching (P < 0.05) were significantly higher in low-AZGP1 group than in high-AZGP1 group; SNOT-22 scores of rhinologic (P < 0.005) was significantly higher in low-AZGP1 group than in high-AZGP1 group; but no significant differences of Lund–Mackay CT scores were found between the two groups (Figure 6).
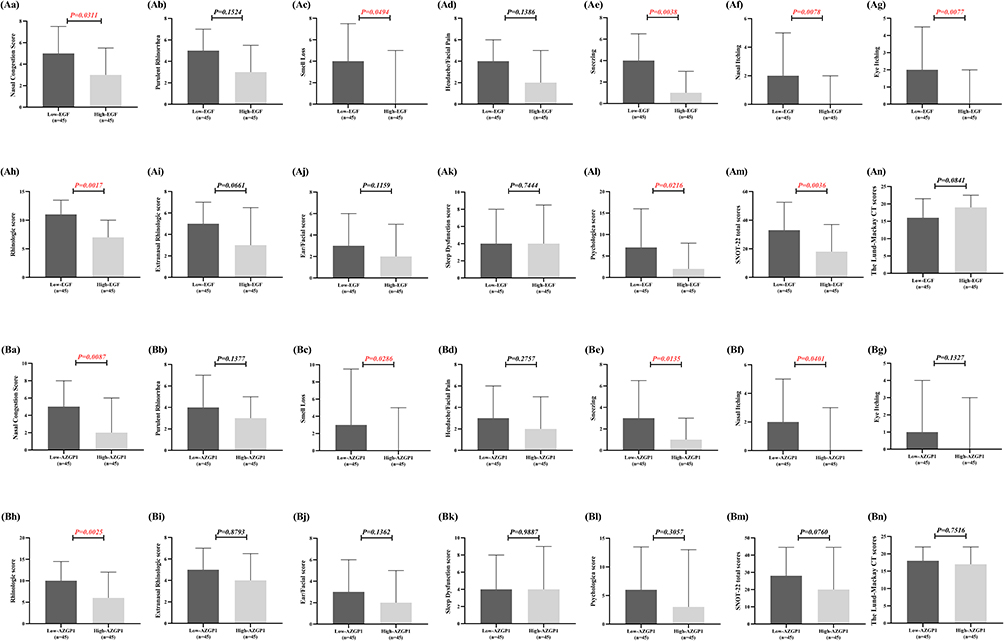 |
Figure 6 The association of EGF and AZGP1 with clinical characteristics in CRSwNP. The VAS score of nasal congestion (Aa), purulent rhinorrhea (Ab), smell loss (Ac), headache/facial pain (Ad), sneezing (Ae), nasal itching (Af) and eye itching (Ag) comparison between the low-EGF group and high-EGF group. The SNOT-22 scores of rhinologic (Ah), extranasal rhinologic (Ai), ear/facial (Aj), sleep dysfunction (Ak), psychological (Al) and SNOT-22 total scores (Am) comparison between the low-EGF group and high-EGF group. (An) The Lund-Mackay CT scores in the two EGF groups. The VAS score of nasal congestion (Ba), purulent rhinorrhea (Bb), smell loss (Bc), headache/facial pain (Bd), sneezing (Be), nasal itching (Bf) and eye itching (Bg) comparison between the low-AZGP1 group and high-AZGP1 group. The SNOT-22 scores of rhinologic (Bh), extranasal rhinologic (Bi), ear/facial (Bj), sleep dysfunction (Bk) and psychological (Bl) and SNOT-22 total scores (Bm) comparison between the low-AZGP1 group and high-AZGP1 group. (Bn) The Lund-Mackay scores in the two AZGP1 groups. P-values < 0.05 was considered statistically significant. Abbreviations: EGF, epidermal growth factor; AZGP1, alpha-2-glycoprotein 1, zinc-binding; CRSwNP, chronic rhinosinusitis with nasal polyps; VAS, visual analogue scale; SNOT-22, Sino nasal outcome test-22. |
GSEA of EGF and AZGP1 in CRSwNP
To better understand the potential biological functions of EGF and AZGP1 in CRSwNP, we performed GSEA based on the hallmark gene sets. Only gene set “HALLMARK_TNFA_SIGNALING_VIA_NFKB” was significantly perturbed in both low-EGF samples and low-AZGP1 samples, both with enrichment scores of −0.41, suggesting that TNF-α signaling via NF-κB may play a pivotal role in the pathophysiology of CRSwNP (Figure 7), and detailed results for 50 hallmark gene sets were shown in Tables S5 and S6.
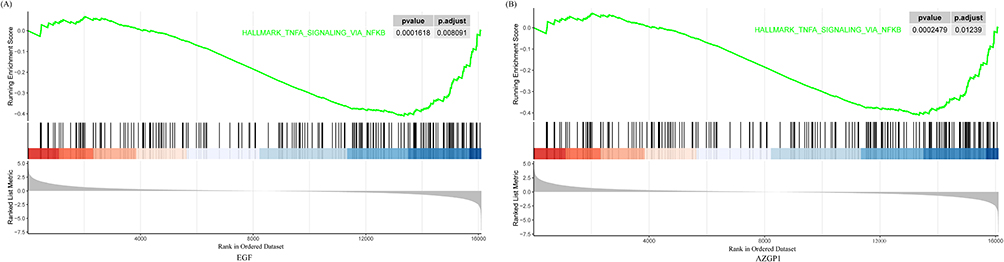 |
Figure 7 GSEA of EGF and AZGP1 in CRSwNP. (A) GSEA of EGF in CRSwNP. (B) GSEA of AZGP1 in CRSwNP. The X-axis represents the sequencing of expression values of genes enriched in different pathways within the sample, and the Y-axis represents the enrichment score. Adjusted P-values < 0.05 was considered statistically significant. Abbreviations: GSEA, gene set enrichment analysis; EGF, epidermal growth factor; AZGP1, alpha-2-glycoprotein 1, zinc-binding. |
Discussion
In this study, we integrated 3 GEO databases of CRSwNP followed by the validation of a large sample size, which allowed us to identify candidate genes and canonical pathways. 8 up-regulated and 60-downregulated co-DEGs (a total of 68 co-DEGs) were revealed among the three GEO datasets. GO BP analysis suggested that genes were enriched for positive regulation of phosphatidylinositol 3-kinase signaling, positive regulation of ERK1 and ERK2 cascade and transforming growth factor beta (TGF-β) receptor signaling pathway. The PPI network provided an overview illustration of the associations among the 68 co-DEGs, 5 hub genes, including EGF, ERBB4, AZGP1, CRISP3 and PIP were identified by mRNA analysis, interestingly, only down-regulation of EGF and AZGP1 were found significantly associated with the clinical characteristics in CRSwNP.
CRS pathogenesis with NP formation follows sequential events, including environmental triggers, heightened inflammation, angiogenesis and tissue remodelling. Intact epithelial barrier function is essential to protect the airways from allergens or pathogenic insults.1,17,18 To strengthen the study, incorporating more databases would allow for the exploration of a broader range of gene expression profiles and potentially identify more genes associated with CRSwNP. Indeed, our GO BP analysis revealed that the differential genes were enriched in related pathways, including positive regulation of phosphatidylinositol 3-kinase signaling, positive regulation of ERK1 and ERK2 cascade and TGF-β receptor signaling pathway. According to literature, epithelial-mesenchymal transition (EMT) was involved in epithelial tissue remodeling in CRS. And TGF-β can influence the transformation of epithelial cells into mesenchymal fibroblasts and product extracellular matrix (ECM).19 The PI3K pathway is a non-Smad pathway that contributes to TGF-β-induced EMT.20 In addition, ERK signaling pathways can be involved in EMT by being activated by IFN-γ.21 Significantly altered EMT related gene expression implicates the biological significance of abnormal antiviral responses in inducing NP formation.
Proliferative potential of NP epithelium is impaired compared to healthy epithelium.4,22,23 EGF (epidermal growth factor) is a 160 kDa membrane glycoprotein. It is a ligand of EGF-receptor and plays important roles in cell differentiation, proliferation, motility and has been proven as a key factor in epithelial repair.4,24,25 Our previous study showed that EGF was localized to p63+ basal cells and ciliated cells, thus the reduced number of ciliated cells may be related to the down-regulation of EGF expression in CRSwNP tissue.26 Jiao et al observed that EGF mediate the expression of MUC5AC through PI3K-TMEM16A signalling pathway in CRSwNP.4,6 In the present study, a strong staining for EGF in control subjects compared with CRSwNP were revealed. Moreover, a down expression level of EGF in eosinophilic CRSwNP and the positive relationship between EGF and clinical features score were observed. The varying expression patterns of EGF in nasal airway epithelium during various inflammatory status implies that their role in epithelial restitution and remodeling is diverse and EGF may play a more important role in the progression of type 2 inflammation in CRSwNP.
Previous studies demonstrated the down-regulation of AZGP1, CRISP3, and PIP in CRSwNP separately,27–29 while the present study is the first that AZGP1, CRISP3, and PIP were found down-regulated in CRSwNP at the same time, and any two of the genes were found significantly positively correlated and the 3 hub genes could be diagnostic biomarkers for CRSwNP. AZGP1 is a member of a unique, heterogeneous spectrum of major histocompatibility complex class I genes whose functions include anti-infection and tumor immunity.30 The mechanism of action of AZGP1 in the immune system is thought to be through liposome binding and presentation to T cells.31 In addition, AZGP1 inhibits cell cycle-dependent proliferation, possibly through downregulation of cdc2 cell cycle protein-dependent kinase, and its increased expression is associated with advanced tumors with increased proliferation and decreased differentiation were directly correlated.32 Dexamethasone was found to stimulate the production of AZGP1 protein in 3T3-L1 adipocytes while glucocorticoids are the first-line treatment for nasal polyps.33 Thus, similar to how AZGP1 added as a protein to the culture medium may be useful in reducing tumor cell proliferation, increasing the pharmacological effects of AZGP1 production in polyps may have therapeutic implications. Similarly, Shiu and Iwasiow reported that treatment of human breast cancer cell lines with prolactin and hydrocortisone resulted in increased synthesis and secretion of PIP, a small secretory glycoprotein whose expression is usually restricted to cells with paracrine properties, which suggests the significance of PIP as a therapeutic target of CRSwNP.27,34,35 PIP plays a role in cell proliferation, migration, and adhesion and its reduction may lead to reduced cell adhesion to fibronectin.36 PIP knockdown may lead to an indirect effect of PIP on the differentiation of primitive CD4-positive T cells to Th1 cells by reducing cytokine production by antigen-presenting cells.37 It leads to a significant decrease in IFN-γ production, which may be involved in the immune response process in chronic sinusitis. CRISP3 is a member of the family of cysteine-rich secretory proteins (CRISPs) and is localized in the secretory granules of neutrophils and exocrine secretions.38 Its role in innate immunity, defense responses, multiplication, and chronic inflammation has been demonstrated.39 The down expression trend of CRISP3 in our study is consistent with Plager et al’s study.29 It would be beneficial to validate the identified genes using experimental methods, which could provide more definitive evidence of their role in CRSwNP. Interestingly, a lower expression level of AZGP1 in eosinophilic CRSwNP and the positive relationship between AZGP1 and clinical features score were observed, which also implied AZGP1 may play a role in the progression of type 2 inflammation of nasal polyps and have a positive correlation with the progression of CRSwNP.
Based on traditional CRSwNP treatments including nasal irrigation, intranasal and oral corticosteroids, antibiotics as well as surgery, precision medicine is evolving rapidly. However, biologics in CRSwNP mainly focus on targeting the type 2 cytokines such as IL-4, IL-5, IL-13, and IgE, which is based on the concept of CRSwNP endotypes.40 Due to the limitation of public sequencing data, we could not subgroup samples from the GEO datasets, but we subgrouped the CRSwNP samples as eosinophilic CRSwNP and non-eosinophilic CRSwNP for validation. We obtained the common key genes in patients with different types of nasal polyps and further found a lower expression level of EGF and AZGP1 in eosinophilic CRSwNP, as well as the positive correlation of EGF and AZGP1 with clinical features. Furthermore, in the hydrogen bonding interaction, multiple groups of residues were used to form hydrogen bonds between AZGP1 and EGF, such as the hydrogen bond formed by Glu104 of AZGP1 and Lys28 of EGF. With these interaction forces, the scoring of AZGP1-EGF is −376, which is a good performance. So, the decrease of AZGP1 and a concomitant decrease of EGF may together be likely the crucial risk factors that modulate the stage of CRSwNP. Furthermore, our findings may guide the selection of gene signatures to determine the efficacy of therapeutic interventions for future clinical trials. However, validation in a larger sample size and further mechanism research both in vitro and in vivo are needed to investigate how these genetic changes correlate with clinical outcomes in CRSwNP. This could potentially uncover new therapeutic targets or diagnostic markers. In addition, more feasible and easy questionnaire that associated with symptoms may be used to reduce time consuming in the future.41
Conclusions
In summary, our study integrated 3 GEO databases to identify the important roles of gene sets involving in the pathophysiology of CRSwNP. Integrated analysis revealed 68 co-DEGs between nasal polyps and controls. Further analyses identified 6 hub genes, of which EGF and AZGP1 expression was significantly downregulated in eosinophilic CRSwNP and correlated with disease severity. Downregulation of EGF and AZGP1 may contribute to epithelial barrier dysfunction and type 2 inflammation in CRSwNP. Our results provide valuable information for future investigations to functionally validation of EGF and AZGP1, and it might lead to more personalized treatment strategies or improve the ability to predict disease progression.
Acknowledgment
The authors thank Dr Hailing Zhang, Dr Hongping Zhang and Dr Jiandong Zhao for kindly supporting with the nasal specimens for this study.
Author Contributions
All authors made a significant contribution to the work reported, whether that is in the conception, study design, execution, acquisition of data, analysis and interpretation, or in all these areas. They took part in drafting, revising or critically reviewing the article and gave final approval of the version to be published. Every author has agreed on the journal to which the report has been submitted and agree to be accountable for all aspects of the work.
Funding
This research was supported by National Natural Science Foundation of China (81800885, 82101195 and 81873692), the Nature Science Foundation of Shandong Province (ZR2018PH021) and China Biodiversity Conservation and Green Development Foundation (cbcgdf-R122KQ001).
Disclosure
The authors declare no conflicts of interest in this work.
References
1. Fokkens WJ, Lund VJ, Hopkins C, et al. European position paper on rhinosinusitis and nasal polyps 2020. Rhinology. 2020;58(Suppl S29):1–464. doi:10.4193/Rhin20.401
2. Zhang Y, Gevaert E, Lou H, et al. Chronic rhinosinusitis in Asia. J Allergy Clin Immunol. 2017;140(5):1230–1239. doi:10.1016/j.jaci.2017.09.009
3. Liu J, Li YY, Andiappan AK, et al. Role of IL-13Rα2 in modulating IL-13-induced MUC5AC and ciliary changes in healthy and CRSwNP mucosa. Allergy. 2018;73(8):1673–1685. doi:10.1111/all.13424
4. Chen L, Liu Q, Liu Z, et al. EGF protects epithelial cells from barrier damage in chronic rhinosinusitis with nasal polyps. J Inflamm Res. 2022;15:439–450. doi:10.2147/JIR.S345664
5. Schleimer RP. Immunopathogenesis of chronic rhinosinusitis and nasal polyposis. Annu Rev Pathol. 2017;12:331–357. doi:10.1146/annurev-pathol-052016-100401
6. Jiao J, Wang M, Duan S, et al. Transforming growth factor-β1 decreases epithelial tight junction integrity in chronic rhinosinusitis with nasal polyps. J Allergy Clin Immunol. 2018;141(3):1160–1163.e9. doi:10.1016/j.jaci.2017.08.045
7. Antonino M, Nicolò M, Jerome Renee L, et al. Single-nucleotide polymorphism in chronic rhinosinusitis: a systematic review. Clin Otolaryngol. 2022;47(1):14–23. doi:10.1111/coa.13870
8. Cho SH, Hamilos DL, Han DH, et al. Phenotypes of chronic rhinosinusitis. J Allergy Clin Immunol Pract. 2020;8(5):1505–1511. doi:10.1016/j.jaip.2019.12.021
9. Reuter JA, Spacek DV, Snyder MP. High-throughput sequencing technologies. Mol Cell. 2015;58(4):586–597. doi:10.1016/j.molcel.2015.05.004
10. Ashburner M, Ball CA, Blake JA, et al. Gene ontology: tool for the unification of biology. The Gene Ontology Consortium. Nat Genet. 2000;25(1):25–29.
11. Gene Ontology Consortium. The Gene Ontology (GO) project in 2006. Nucleic Acids Res. 2006;34(Database issue):D322–D326. doi:10.1093/nar/gkj021
12. Fokkens WJ, Lund VJ, Mullol J, et al. European position paper on rhinosinusitis and nasal polyps 2012. Rhinol Suppl. 2012;23(3):1–298.
13. Morris GM, Huey R, Olson AJ. Using AutoDock for ligand-receptor docking. Curr Protoc Bioinformatics. 2008;24(1). doi:10.1002/0471250953.bi0814s24
14. Katchalski-Katzir E, Shariv I, Eisenstein M, et al. Molecular surface recognition: determination of geometric fit between proteins and their ligands by correlation techniques. Proc Natl Acad Sci U S A. 1992;89(6):2195–2199. doi:10.1073/pnas.89.6.2195
15. Yu G, Wang LG, Han Y, et al. clusterProfiler: an R package for comparing biological themes among gene clusters. Omics. 2012;16(5):284–287. doi:10.1089/omi.2011.0118
16. Liberzon A, Birger C, Thorvaldsdóttir H, et al. The Molecular Signatures Database (MSigDB) hallmark gene set collection. Cell Syst. 2015;1(6):417–425. doi:10.1016/j.cels.2015.12.004
17. Peng Y, Zi XX, Tian TF, et al. Whole-transcriptome sequencing reveals heightened inflammation and defective host defence responses in chronic rhinosinusitis with nasal polyps. Eur Respir J. 2019;54(5):1900732. doi:10.1183/13993003.00732-2019
18. Valera FCP, Ruffin M, Adam D, et al. Staphylococcus aureus impairs sinonasal epithelial repair: effects in patients with chronic rhinosinusitis with nasal polyps and control subjects. J Allergy Clin Immunol. 2019;143(2):591–603.e3. doi:10.1016/j.jaci.2018.05.035
19. Hackett TL, Warner SM, Stefanowicz D, et al. Induction of epithelial-mesenchymal transition in primary airway epithelial cells from patients with asthma by transforming growth factor-beta1. Am J Respir Crit Care Med. 2009;180(2):122–133. doi:10.1164/rccm.200811-1730OC
20. Zhang YE. Non-Smad pathways in TGF-beta signaling. Cell Res. 2009;19(1):128–139. doi:10.1038/cr.2008.328
21. Lee M, Kim DW, Khalmuratova R, et al. The IFN-γ-p38, ERK kinase axis exacerbates neutrophilic chronic rhinosinusitis by inducing the epithelial-to-mesenchymal transition. Mucosal Immunol. 2019;12(3):601–611. doi:10.1038/s41385-019-0149-1
22. Zhao L, Li YY, Li CW, et al. Increase of poorly proliferated p63(+) /Ki67(+) basal cells forming multiple layers in the aberrant remodeled epithelium in nasal polyps. Allergy. 2017;72(6):975–984. doi:10.1111/all.13074
23. Yu XM, Li CW, Chao SS, et al. Reduced growth and proliferation dynamics of nasal epithelial stem/progenitor cells in nasal polyps in vitro. Sci Rep. 2014;4(4619). doi:10.1038/srep04619
24. Holgate ST. Epithelial damage and response. Clin Exp Allergy. 2000;30(Suppl 1):37–41. doi:10.1046/j.1365-2222.2000.00095.x
25. Burgel PR, Nadel JA. Roles of epidermal growth factor receptor activation in epithelial cell repair and mucin production in airway epithelium. Thorax. 2004;59(11):992–996. doi:10.1136/thx.2003.018879
26. Duan C, Li CW, Zhao L, et al. Differential expression patterns of EGF, EGFR, and ERBB4 in Nasal Polyp Epithelium. PLoS One. 2016;11(6):e0156949. doi:10.1371/journal.pone.0156949
27. Platt MP, Soler ZM, Kao SY, et al. Topographic gene expression in the sinonasal cavity of patients with chronic sinusitis with polyps. Otolaryngol Head Neck Surg. 2011;145(1):171–175. doi:10.1177/0194599811402030
28. Stankovic KM, Goldsztein H, Reh DD, et al. Gene expression profiling of nasal polyps associated with chronic sinusitis and aspirin-sensitive asthma. Laryngoscope. 2008;118(5):881–889. doi:10.1097/MLG.0b013e31816b4b6f
29. Plager DA, Kahl JC, Asmann YW, et al. Gene transcription changes in asthmatic chronic rhinosinusitis with nasal polyps and comparison to those in atopic dermatitis. PLoS One. 2010;5(7):e11450. doi:10.1371/journal.pone.0011450
30. Bahram S, Bresnahan M, Geraghty DE, et al. A second lineage of mammalian major histocompatibility complex class I genes. Proc Natl Acad Sci U S A. 1994;91(14):6259–6263. doi:10.1073/pnas.91.14.6259
31. Rolli V, Radosavljevic M, Astier V, et al. Lipolysis is altered in MHC class I zinc-alpha (2)-glycoprotein deficient mice. FEBS Lett. 2007;581(3):394–400. doi:10.1016/j.febslet.2006.12.047
32. He N, Brysk H, Tyring SK, et al. Zinc-alpha (2)-glycoprotein hinders cell proliferation and reduces cdc2 expression. J Cell Biochem Suppl. 2001;36(S36):162–169. doi:10.1002/jcb.1078
33. Bing C, Bao Y, Jenkins J, et al. Zinc-alpha2-glycoprotein, a lipid mobilizing factor, is expressed in adipocytes and is up-regulated in mice with cancer cachexia. Proc Natl Acad Sci U S A. 2004;101(8):2500–2505. doi:10.1073/pnas.0308647100
34. Shiu RP, Iwasiow BM. Prolactin-inducible proteins in human breast cancer cells. J Biol Chem. 1985;260(20):11307–11313. doi:10.1016/S0021-9258(17)39181-0
35. Urbaniak A, Jablonska K, Podhorska-Okolow M, et al. Prolactin-induced protein (PIP)-characterization and role in breast cancer progression. Am J Cancer Res. 2018;8(11):2150–2164.
36. Naderi A, Vanneste M. Prolactin-induced protein is required for cell cycle progression in breast cancer. Neoplasia. 2014;16(4):329–42. e1–14. doi:10.1016/j.neo.2014.04.001
37. Li J, Liu D, Mou Z, et al. Deficiency of prolactin-inducible protein leads to impaired Th1 immune response and susceptibility to Leishmania major in mice. Eur J Immunol. 2015;45(4):1082–1091. doi:10.1002/eji.201445078
38. Eberspaecher U, Roosterman D, Krätzschmar J, et al. Mouse androgen-dependent epididymal glycoprotein CRISP-1 (DE/AEG): isolation, biochemical characterization, and expression in recombinant form. Mol Reprod Dev. 1995;42(2):157–172. doi:10.1002/mrd.1080420205
39. Udby L, Bjartell A, Malm J, et al. Characterization and localization of cysteine-rich secretory protein 3 (CRISP-3) in the human male reproductive tract. J Androl. 2005;26(3):333–342. doi:10.2164/jandrol.04132
40. Schneider AL, Schleimer RP, Tan BK. Targetable pathogenic mechanisms in nasal polyposis. Int Forum Allergy Rhinol. 2021;11(8):1220–1234. doi:10.1002/alr.22787
41. La Mantia I, Ragusa M, Grigaliute E, et al. Sensibility, specificity, and accuracy of the Sinonasal Outcome Test 8 (SNOT-8) in patients with chronic rhinosinusitis (CRS): a cross-sectional cohort study. Eur Arch Otorhinolaryngol. 2023;280(7):3259–3264. doi:10.1007/s00405-023-07855-8
 © 2023 The Author(s). This work is published and licensed by Dove Medical Press Limited. The full terms of this license are available at https://www.dovepress.com/terms.php and incorporate the Creative Commons Attribution - Non Commercial (unported, v3.0) License.
By accessing the work you hereby accept the Terms. Non-commercial uses of the work are permitted without any further permission from Dove Medical Press Limited, provided the work is properly attributed. For permission for commercial use of this work, please see paragraphs 4.2 and 5 of our Terms.
© 2023 The Author(s). This work is published and licensed by Dove Medical Press Limited. The full terms of this license are available at https://www.dovepress.com/terms.php and incorporate the Creative Commons Attribution - Non Commercial (unported, v3.0) License.
By accessing the work you hereby accept the Terms. Non-commercial uses of the work are permitted without any further permission from Dove Medical Press Limited, provided the work is properly attributed. For permission for commercial use of this work, please see paragraphs 4.2 and 5 of our Terms.