Back to Journals » Journal of Multidisciplinary Healthcare » Volume 18
Does Patient Satisfaction with Primary and Emergency Care Influence Non-Urgent Emergency Department Utilization? A Path Analysis
Authors Sarbay İ ![]() , Mercan Baspinar M
, Mercan Baspinar M ![]() , Erman E, Cavdar B, Tamer I, Adiyaman AM, Kosali K, Aksuz MY, Basat O, Calik M
, Erman E, Cavdar B, Tamer I, Adiyaman AM, Kosali K, Aksuz MY, Basat O, Calik M ![]()
Received 7 April 2025
Accepted for publication 24 July 2025
Published 7 August 2025 Volume 2025:18 Pages 4703—4715
DOI https://doi.org/10.2147/JMDH.S532858
Checked for plagiarism Yes
Review by Single anonymous peer review
Peer reviewer comments 3
Editor who approved publication: Professor Steve Campbell
İbrahim Sarbay,1 Melike Mercan Baspinar,2 Ezgi Erman,1 Bilge Cavdar,1 Ilayda Tamer,1 Ayla Muge Adiyaman,2 Kafkas Kosali,2 Muhammed Yasar Aksuz,1 Okcan Basat,2 Mustafa Calik1
1Department of Emergency Medicine, University of Health Sciences, Gaziosmanpaşa Training and Research Hospital, Istanbul, Türkiye; 2Department of Family Medicine, University of Health Sciences, Gaziosmanpaşa Training and Research Hospital, Istanbul, Türkiye
Correspondence: Melike Mercan Baspinar, Email [email protected]
Aim: To examine whether patient satisfaction mediates the relationship between primary care (PC) utilization and non-urgent emergency department (ED) use during weekday working hours.
Methods: This observational study compared patient satisfaction levels using two validated tools: the EUROPEP (European Patients Evaluate General/Family Practice) scale for PC visits and the Brief Emergency Department Patient Satisfaction Scale (BEPSS) for ED visits. Data analysis was conducted using Jamovi software (version 2.6.26), employing structural equation modeling and correlation analysis.
Results: A total of 293 non-urgent adult patients (61.4% female) were enrolled in the study through consecutive sampling at ED visits of a tertiary hospital in Istanbul. Visits solely for examination purposes constituted 43.7% of PC visits and 66.6% of ED visits. Patient satisfaction rates were 66.7% for PC and 75.0% for ED. Frequent users of non-urgent ED services were also more likely to utilize PC services (r = 0.394, p ≤ 0.001). A positive correlation was observed between satisfaction with previous PC and ED experiences (r = 0.399, p ≤ 0.001). However, higher satisfaction with either service was not associated with increased visit frequency (p > 0.05). Notably, frequency of PC visits mediated the relationship between older age and increased non-urgent ED use (β = 0.067, 95% CI [0.002, 0.029], p = 0.028), suggesting insufficient referrals from PC to ED.
Conclusion: Non-urgent ED utilization during working hours is not driven by low PC satisfaction or high ED satisfaction. Improving satisfaction alone is insufficient without addressing overuse, maladaptive health-seeking behavior, and the structural need for standardized medical equipment and adequate human resources in family health centers—rather than relying solely on categorical group classifications.
Keywords: emergency medical services, primary health care, patient satisfaction, non-urgent
Introduction
In 2003, the “Family Medicine Model” in Türkiye was established as part of the Health Transformation Program, a comprehensive reform initiative aimed at restructuring primary healthcare services to be individual and family centered.1 Key characteristics of family medicine—such as easy access to services, ongoing and consistent care, sufficient consultation time, strong doctor–patient relationships, and a focus on prevention—contribute significantly to patient satisfaction, better health outcomes, and cost-effectiveness.2 An effective primary care (PC) has the potential to deliver timely and appropriate care, helping to prevent unnecessary use of emergency department (ED) clinics for non-urgent issues.3 Portugal’s PC reform was successful in reducing inappropriate utilization of EDs.4
ED utilization in Türkiye remains remarkably high, with a total of 925,161,028 visits recorded between 2015 and 2022.5 Of all ED visits, 28.30% are classified as green zone (non-urgent) and 68.51% as yellow zone (urgent but not critical) cases. The highest frequency of visits occurred outside regular working hours, with a peak between 8:00 p.m. and 9:00 p.m.5 Approximately 9.9% of ED visits are made for non-urgent conditions.6 Although 91.2% of the patients reported that they knew their family physician and could use family medicine centers during working hours, 69.6% did not consult them prior to their emergency department (ED) visit. However, many of the patients categorized within the green triage level may be appropriately managed in primary care by their family physicians.7
A strong PC–patient relationship and an accessible PC can reduce unnecessary ED visits.8 A national study conducted by the Turkish Ministry of Health, using data from the integrated e-Pulse and SINA systems, ranked highest family medicine centers in terms of patient satisfaction.9 Patient satisfaction data are now widely incorporated into physician assessment systems. On consumer-oriented health platforms, these indicators often serve as key quality metrics and are frequently the primary criteria used to compare healthcare providers.10
Patient reported satisfaction has been extensively studied,2,9,11 but a key gap in the literature is the lack of integrated evaluation of ED and PC utilization. Cause of the lack of a validated single tool that adequately captures patient satisfaction across both settings, two separate instruments were employed. Patient satisfaction with PC was assessed using the European Patients Evaluate General/Family Practice (EUROPEP) questionnaire, while satisfaction with ED services was measured using the Brief Emergency Department Patient Satisfaction Scale (BEPSS). Prior studies have not examined how satisfaction with both primary and emergency care jointly affects ED use. No path analysis studies to our knowledge have explored the mediating role of ED or PC patient satisfaction between sociodemographic factors and frequency of non-urgent ED utilization. This study evaluates satisfaction among non-urgent ED patients based on their recent experiences with both services and explores whether satisfaction mediates the reason for non-urgent ED utilization instead of PC use during weekday working hours.
Methods
Study Population and Design
This observational cross-sectional study included 293 nonurgent patients who presented to the ED green zone during regular weekday hours (Monday through Friday, 8:00 am to 5:00 pm), despite having access to primary care through their family physician. Data were collected from 25th December 2024 through 25th January 2025 through consecutive sampling. All patients aged 18 years and older presenting to ED were assessed by a triage nurse. Cases were classified as non-urgent (green area) if they met four criteria: stable vital signs, a chief complaint among 50 predefined nonurgent symptoms, no red flags on initial screening, and no presentation of chest or abdominal pain, severe pain, or impaired mobility.12
The study included non-urgent adult patients who had at least one documented visit to both a family physician and the ED at anytime of the past six months. Patients who had visited only the ED or only PC during the same period were excluded from the study. Sample size was not calculated, study survey was administered to all patients who met the criteria. A total of 293 patients participated. A face-to-face survey was administered by resident physicians from family medicine and emergency medicine clinics during their emergency medicine education rotations.
This study was conducted in accordance with the principles of the Declaration of Helsinki. Ethical approval was obtained from the Clinical Research Ethics Committee of Gaziosmanpaşa Training and Research Hospital by date 18/12/2024 with protocol number 75. Written informed consent was obtained from each participant.
Satisfaction Measurement and Data Assessment
The survey included questions on sociodemographic characteristics (gender, marital status, occupation, education level, and presence of chronic disease), reasons for the most recent visits to PC and ED, duration of registration with their current family physician, and validated assessment tools including the EUROPEP and BEPSS questionnaires.
The European Patients Evaluate General/Family Practice (EUROPEP) questionnaire was originally developed in 1999 by the European Working Party on Quality in Family Practice (EQuiP)13 and adapted in many language including Turkish.14,15 The instrument invites patients to assess the family physician they have consulted most frequently in the past six months, using a 23-item Likert-type scale (ranging from 1 = poor to 5 = excellent) and higher total scores indicate greater satisfaction. These items are grouped into five key dimensions: the doctor–patient relationship, medical care received, provision of information and emotional support, service organization, and ease of access to services. A Cronbach’s alpha coefficient was calculated at 0.98 in this study.14,15 To simplify the responses into two categories, Likert responses of four (“Good”) and five (“Very Good”) on the EUROPEP Scale were classified as “satisfied”, while all other responses were considered “dissatisfied”.
Brief Emergency Service Patient Satisfaction Scale (BEPSS) determines the satisfaction level of patients who presented to the ED.16 The scale, originally developed by Mohammed and Maryam Atari and later adapted into Turkish by Konateke and Yılmaz, consists of 18 items rated on a 4-point Likert scale.16 The Cronbach’s alpha reliability coefficient (α = 0.940) was high and the item total score correlation varied between 0.577 and 0.832. Total scores range from 18 to 72, with higher scores indicating greater satisfaction.16 In this study, Likert responses of 3 (“Agree”) and 4 (“Strongly Agree”) were categorized as indicating satisfaction, while responses of 1 (“Strongly Disagree”) and 2 (“Disagree”) were classified as indicating dissatisfaction.
Statistical Analysis
Descriptive statistics (n, %, or mean ± standard deviation), Cronbach’s alpha for internal consistency, and Spearman correlation tests were used in the initial analyses. Path analysis was conducted using Jamovi (v2.6.26) with the SEM module based on the Lavaan package to examine direct and indirect relationships in the proposed semistructural model. To evaluate the goodness-of-fit of the model, several widely accepted fit indices were calculated, including the Comparative Fit Index (CFI), Tucker-Lewis Index (TLI), Goodness of Fit Index (GFI), Root Mean Square Error of Approximation (RMSEA), and Relative Noncentrality Index (RNI). These indices were interpreted according to the cutoff criteria recommended by Hu and Bentler (1999), where CFI, TLI, GFI, and RNI values of ≥0.95, and RMSEA values of <0.05 indicate good model fit.17 A p-value of less than 0.05 was considered statistically significant.
Results
Among the 293 patients (n = 180, 61.4% female; n = 113, 38.6% male; mean age = 45.79 ± 18.42 years), housewives (n = 88, 30.0%) and manual workers (n = 55, 18.8%) were predominant groups. The distribution of the patients’ descriptive characteristics is presented in Table 1. On average, patients (median) visit their family physician three times and the ED twice in last six months. Approximately half of the patients (41.3%) reported having at least one chronic condition, such as asthma, chronic obstructive pulmonary disease (COPD), diabetes, or hypertension. The most common reason for visiting a family physician was for a medical examination (43.7%), followed by prescription or medication-related requests (35.5%). In contrast, the most frequent reason for ED visits was also for medical examination, reported by 66.6% of the participants.
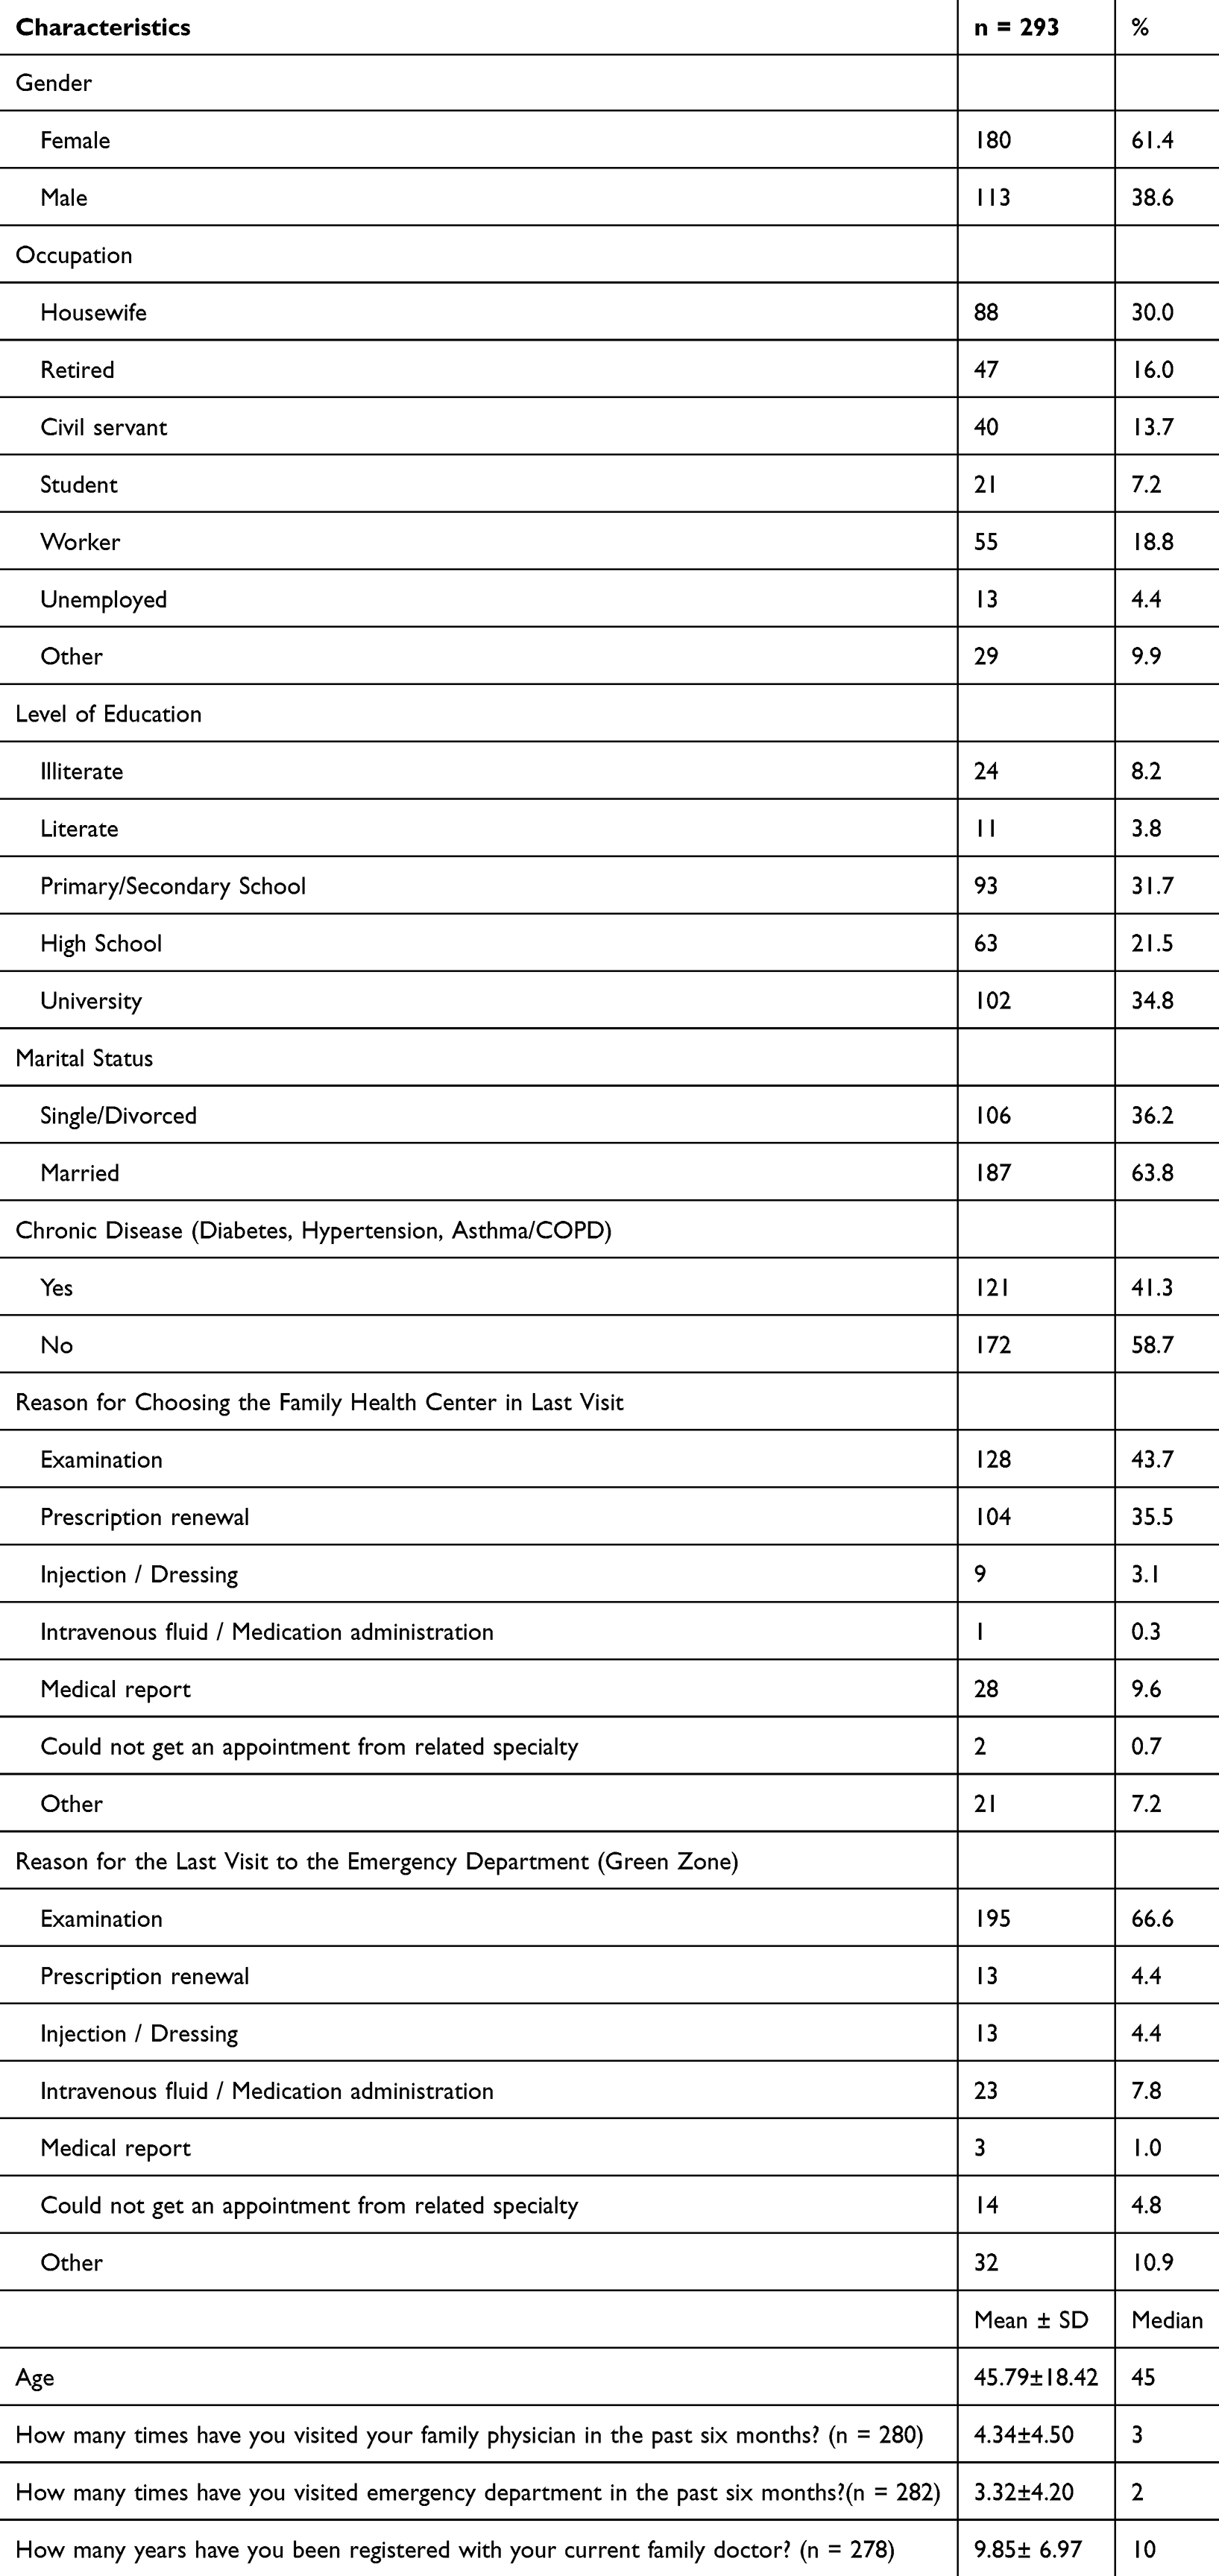 |
Table 1 Distribution of the Descriptive Characteristics of the Patients (N = 293) |
As shown in Table 2, total score obtained from the EUROPEP (European Patients Evaluate General/Family Practice) Scale was 82.84 ± 23.43 with a Cronbach’s alpha of 0.96, and the general satisfaction rate was 66.7%. Analysis of the EUROPEP questions related to the clinical behavior of family physicians revealed that mean scores across the subdomains—Doctor–Patient Relationship, Medical Care, Information and Emotional Support, and Continuity and Cooperation—ranged from 3.64 to 4.05 out of 5. The proportion of participants who rated these items as “good” or “very good” ranged between 67.2% and 78.5%, suggesting a moderate to high level of patient satisfaction with the clinical behaviour of their family physicians. The analysis of EUROPEP items related to the organization of services at family health centers indicated that mean scores for accessibility-related subdomains ranged from 2.13 to 3.68 out of 5. The percentage of participants who responded with “Good” or “Very good” varied between 30.4% and 66.2%, reflecting a generally low level of satisfaction with the organizational aspects of family health centers—particularly concerning limited phone accessibility to family physicians or the centers themselves, waiting time and prompt service for urgent issues.
 |
Table 2 EUROPEP (European Patients Evaluate General/Family Practice) Scale Score |
As presented in Table 3, total score for the BEPSS (Brief Emergency Department Patient Satisfaction) Scale was 55.81 ± 12.53 with a Cronbach’s alpha of 0.95, and general satisfaction rate was 75.0%. The mean range scores for nursing satisfaction was 3.16 and 3.33 out of 4. The percentage of participants who provided positive responses ranged between 77.1% and 85.7%. The mean scores for the ED physician treatment satisfaction items ranged from 3.14 to 3.52 out of 4 points. The proportion of participants who reported being satisfied varied between 74.1% and 91.1%. Results showed moderate and high level patient reported satisfaction with nurses and doctors in ED care. Items related to environmental factors—such as sanitization, cleanliness, availability of equipment, and noise levels—received mean scores ranging from 2.38 to 2.72 out of 4. The proportion of participants who expressed satisfaction with these aspects ranged between 48.2% and 58.7%, indicating relatively low satisfaction with the physical environment of the emergency department.
 |
Table 3 Brief Emergency Department Patient Satisfaction Scale Score (BEPSS) |
Table 4, presents the correlation matrix of following variables: age, PCV (Primary care visit number in the past six months), PCSS (Primary care satisfaction score based on EUROPEP Scale), EDSS (Emergency department satisfaction score based on Brief Emergency Department Patient Satisfaction Scale), EDV (Emergency department visit number in the past six months), FP (Year) (Years Registered to Family Physician). A positive correlation was found between the duration of registration with the same family physician and both the frequency of ED visits (r = 0.138, p = 0.024) and satisfaction with ED services (r = 0.121, p = 0.044). These findings suggest that continuity and possible scheduled emergency services referral of care by family physicians may be associated with increased utilization and satisfaction with emergency services. Similarly, PCSS was positively related to EDSS (r = 0.399, p < 0.001). Although the number of visits to the family physician was not associated with satisfaction, and the number of emergency visits was not related to emergency satisfaction, a positive correlation was found between the frequency of visits to the family physician and emergency department. An increase in age was associated with higher visit frequencies to both family physicians and EDs. Furthermore, satisfaction with family medicine services was positively correlated with satisfaction with emergency care. These findings suggest that family health centers should be used more effectively and point to potential issues in patient behaviour.
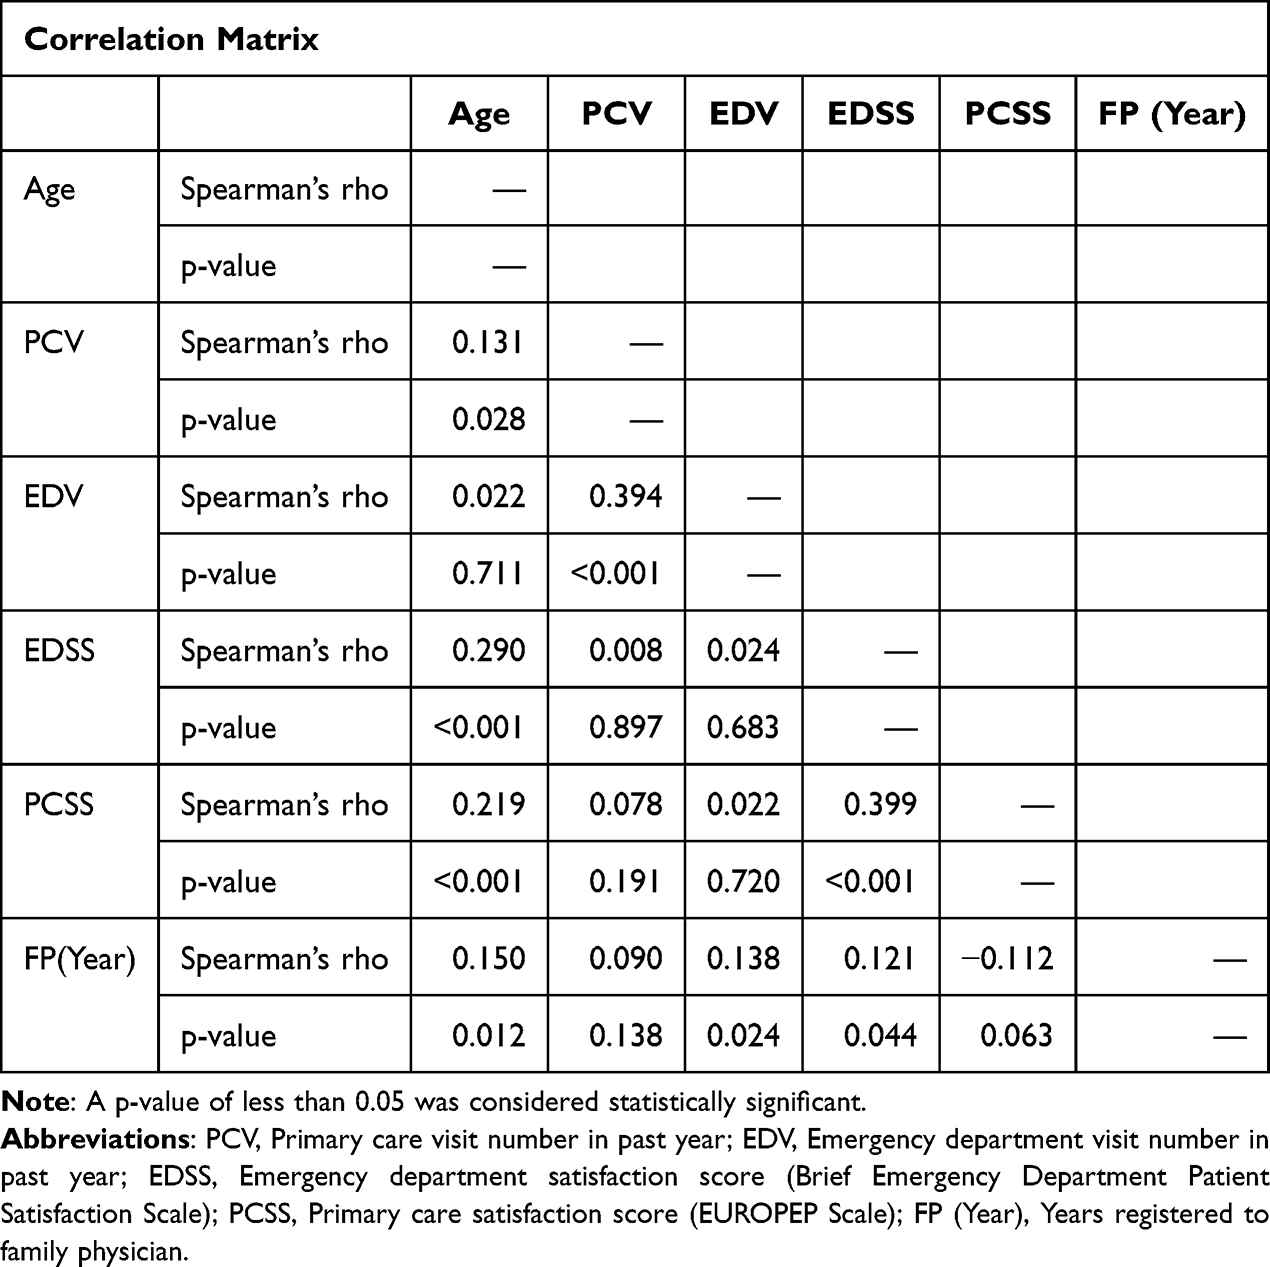 |
Table 4 Spearman Correlation Coefficients and Significance Values |
A path analysis was conducted to examine the mediating roles of Primary Care Service Satisfaction (PCSS) and Primary Care Visit frequency (PCV) in the relationships between age, Emergency Department Service Satisfaction (EDSS) and Emergency Department Visit frequency (EDV). The model demonstrated an excellent fit to the data: CFI = 0.998, TLI = 0.988, GFI = 1.000, RNI = 0.998, SRMR = 0.019, RMSEA = 0.026. All indices met recommended cutoff criteria (ie, CFI, TLI, GFI, RNI > 0.95; SRMR, RMSEA < 0.05), indicating that the model adequately fits the observed data.17 A path analysis was conducted to examine the mediating roles of primary care satisfaction (PCSS), and PC visit frequency in the relationships between age, emergency department satisfaction (EDSS), and ED visit frequency. The indirect effects are summarized in Figure 1 and Table 5.
 |
Table 5 A Path Analysis Table for Mediating Roles of Primary Care Satisfaction (PCSS) and Primary Care Visit Frequency (PCV) in the Relationships Between Age, Emergency Department Satisfaction (EDSS), and Emergency Department Visit Frequency (EDV) |
 |
Figure 1 Path diagram illustrating the hypothesized mediating effects of primary care satisfaction (PCSS) and primary care visit frequency (PCV) on the relationship between age and emergency department outcomes, including emergency department satisfaction (EDSS) and emergency department visit frequency (EDV). Abbreviations: PCV, Primary care visit number in past year; PCSS, Primary care satisfaction score (EUROPEP Scale); EDSS, Emergency department satisfaction score (Brief Emergency Department Patient Satisfaction Scale); EDV, Emergency department visit number in past year; FP (Year), Years registered to family physician. |
The analysis demonstrated a significant positive indirect effect of age on Emergency Department Service Satisfaction (EDSS) through Primary Care Service Satisfaction (PCSS) (β = 0.071, SE = 0.015, 95% CI [0.017, 0.077], z = 3.110, p = 0.002). This suggests that higher age is associated with greater satisfaction with emergency department services, and this relationship is mediated by increased satisfaction with primary care services.
Conversely, the indirect effect of age on emergency department visit frequency (EDV) via PCSS was negative but not statistically significant (β = −0.020, SE = 0.003, 95% CI [−0.010, 0.001], z = −1.576, p = 0.115), indicating that satisfaction with primary care services did not significantly mediate the association between age and emergency department utilization.
A significant positive indirect effect of age on EDV emerged through the frequency of primary care visits (PCV), with a path coefficient of β = 0.067 (SE = 0.007, 95% CI [0.002, 0.029], z = 2.190, p = 0.028). This finding implies that older individuals tend to visit emergency departments more frequently, and this association is partially explained by their more frequent engagement with primary care services.
Discussion
In summary, non-urgent ED utilization instead of PC during regular working hours may not be explained by patient satisfaction alone. Frequent non-urgent ED users are more likely to be potential PC users, suggesting the need for a referral system or enhanced resources at family health centers in light of this study. While approximately half of the visits to family physicians were for examinations and the other half for prescription renewals or medical reports, nearly 70% of ED visits were for conditions that could have been managed in family health centers. Overall, the study is novel, having uncovered a significant positive indirect effect of age on EDSS through PCSS. Age, on the other hand, has a negative and insignificant indirect effect on EDV through PCSS as a new contribution to the literature.
Previous studies in this field suggest that non-urgent ED visits are predominantly made by younger individuals, female gender and have a low prevalence of chronic conditions.18,19 Similarly, most of the nonurgent applicants in our study are women, predominantly housewives. However, unlike previous literature, half of the patients in our study had at least one chronic condition and commonly over middle-age. The fact that half of the patients who visited both PC and the ED within the past 6 months had repeat ED visits raises concerns about the adequacy of follow-up care provided by family health centers for chronic disease management. However, the fact that the highest satisfaction scores for both services were related to physician examination and attentiveness suggests that the problem does not stem from physician-related factors.
Koziol-Mclain et al showed that most patients who visit the ED report high satisfaction, even for non-urgent medical problems, but this satisfaction is often related to the easy accessibility and perceived quality of the ED.20 In our study, 75.0% of patients were satisfied with their ED experience despite environmental factors—such as inadequate cleanliness, noise, lack of calm, and perceived insufficient equipment—were the main contributors to dissatisfaction with ED nearly 50.0%. In addition, patient satisfaction rates were 66.7% for PC. In other words, the dissatisfaction rate was 33.3% for PC services. The most commonly reported dissatisfaction with family health center among non-urgent ED users was related to especially about difficulty in contacting the family physician nearly %70 or clinic by phone nearly %60, followed by prolonged waiting times nearly %40. This outcome is likely shaped by the expectations held by patients. Patient satisfaction with PC in Türkiye was reported to be as high as 90% between 2010 and 2012 based on EUROPEP, coinciding with the development of the national family medicine program.21 The satisfaction rate of 66.7% observed in 2025 in our study suggests a moderate level of contentment with the family medicine system, potentially indicating a decline in its perceived effectiveness or popularity among patients.
The finding that positive relationship between patient satisfaction with ED care and PC suggests that the underlying issue may be more related to maladaptive healthcare-seeking behavior than to satisfaction alone. In the study by Tuz et al, nonurgent patients reported self-referring to the ED primarily due to perceived urgency (61%), followed by dissatisfaction with family physicians (25.1%), and perceived advantages of ED (12.9%).22 This highlights a key issue: the discrepancy between perceived and actual urgency. Such mismatches challenge both primary and emergency care and are likely to persist under systems permitting unrestricted access regardless of clinical need. The commonly advocated policy of redirecting nonurgent cases from ED to PC settings often overlooks patients’ lived experiences and decision-making processes.20 In Türkiye, family medicine clinics offer free examinations and diagnostic tests, including for individuals without health insurance, providing a substantial advantage in terms of healthcare accessibility. Nonetheless, the continued preference for ED appears to be driven less by financial limitations and more by patients’ behaviors.
Although we found that satisfaction with primary care services did not significantly mediate the association between age and emergency department (ED) utilization, prior studies have shown that the most influential factors in reducing ED use are having a regular primary care physician and ensuring continuity of care, rather than satisfaction alone.23,24 Particularly among older adults, ED visits are more strongly associated with structural factors such as chronic disease burden, socioeconomic status, and rural versus urban residence.23,25 Moreover, even when satisfaction with primary care services is high, older individuals may still prefer ED services due to complex healthcare needs or perceived urgency.23,26 Some studies have indicated that improving access to and continuity of primary care reduces ED utilization; however, satisfaction does not appear to directly mediate this relationship.3,23,24 In summary, structural and clinical determinants—such as healthcare access, continuity of care, and individual health status—are the key moderators of the relationship between age and ED use, while satisfaction plays a more secondary role in this complex dynamic.23–25
In this study, older patients who are more satisfied with their family physicians may also report higher satisfaction with ED services—possibly because they are more likely to be referred to the ED through a scheduled and guided process by their PC provider. Therefore, the reported satisfaction may reflect appreciation for the continuity and coordination of care, rather than satisfaction with the ED services alone. In addition, considering that our study found an increase in both ED visit frequency and ED satisfaction levels with longer registration duration with the same family physician, it may be inferred that continuity of care in PC settings plays a role in shaping patient behavior and perceptions regarding ED.
A retrospective cohort study has shown that poor quality in PC may be linked to a higher likelihood of nonurgent ED visits, indicating that enhancing communication and care quality could decrease nonurgent ED visits.27 However, Hunt et al showed that frequent ED users often heavily use other healthcare services and PC28 consistent with the findings of our study. According to Stube et al, patients often base their decision to seek emergency care on how serious they believe their condition to be. Uncertainty regarding symptoms and external recommendations are key factors influencing patients’ preference for ED over other healthcare options.29 This dynamic may help explain the observed correlation between increased PC and ED visit frequencies, as patients may seek reassurance through multiple points of care.
In the study of Stefanini et al, patient satisfaction was strongly influenced by behavioral and network factors. Patients value proximity to their doctors, ongoing health monitoring, and active communication. They also prefer teams where doctors lead the communication process.30 Due to patients’ desire to establish a network with multiple healthcare professionals. Moreover, this preference may reflect patients’ broader inclination to consult multiple professionals to increase confidence in diagnosis and treatment. Although aimed at reassurance, this behaviour may inadvertently lead to fragmented care, and overutilization of ED services. Such patterns align with our findings, where high satisfaction with both primary care and ED services did not prevent patients from using multiple healthcare channels.
Limitations and Strengths
One limitation of the study is its reliance on self-reported quantitative data and short (1-month) data collection period. Other limitation is that it was conducted in the Gaziosmanpaşa district, an area characterized by relatively low socioeconomic status of Istanbul. This context may have influenced patient expectations and satisfaction levels, potentially limiting the generalizability of our findings to populations in higher-income or more socioeconomically diverse settings.
Despite these limitations, the study also possesses notable strengths. It utilized two validated and widely accepted instruments—EUROPEP for primary care and BEPSS for emergency services—to assess patient satisfaction in a structured and reliable manner. Furthermore, the inclusion of participants who had accessed both primary and emergency care within the past six months allowed for a unique, real-world comparison of satisfaction across healthcare settings. Lastly, the application of path analysis provided a nuanced understanding of potential mediating relationships, contributing to the growing body of literature on healthcare utilization behavior.
Conclusion
Patients may perceive consulting multiple healthcare professionals—such as both a family physician and an emergency physician—as a strategy to enhance the quality of health care. This patient tendency may reflect a belief that seeking second or even third opinions leads to more reliable care, driven by the notion that “if one doctor is good, more must be better”. However, the association between increased satisfaction with family physicians and a rise in ED visits may suggest inappropriate referrals from PC to ED. So then, improving patient reported satisfaction with primary and emergency care alone is insufficient without addressing systemic overuse, maladaptive health-seeking behavior, and the need for a referral system or standardized family health center enhanced resources.
Data Sharing Statement
The data that support the findings of this study are available from the corresponding author [Melike Mercan Baspinar] upon reasonable request.
Ethical Approval
This study was conducted in accordance with the principles of the Declaration of Helsinki. Ethical approval was obtained from the Clinical Research Ethics Committee of Gaziosmanpaşa Training and Research Hospital by date 18/12/2024 with protocol number 75. Written informed consent was obtained from each participant.
Informed Consent
Participants were informed about the procedure. Written informed consent was obtained from each participant.
Acknowledgments
Thanks to the patients who participated in the emergency department.
Disclosure
The authors declare that they have no known competing financial interests or personal relationships that could have appeared to influence the work reported in this paper.
References
1. Türkiye Sağlıkta Dönüşüm. Programı Değerlendirme Raporu (2003–2011). Ankara, Türkiye: T.C. Sağlık Bakanlığı; 2012.
2. Sans-Corrales M, Pujol-Ribera E, Gene-Badia J, Pasarin-Rua MI, Iglesias-Perez B, Casajuana-Brunet J. Family medicine attributes related to satisfaction, health and costs. Family Practice. 2006;23(3):308–316. doi:10.1093/fampra/cmi112
3. Hong M, Thind A, Zaric GS, Sarma S. The impact of improved access to after-hours primary care on emergency department and primary care utilization: a systematic review. Health Policy. 2020;124(8):812–818. doi:10.1016/j.healthpol.2020.05.015
4. Almeida A, Vales J. The impact of primary health care reform on hospital emergency department overcrowding: evidence from the Portuguese reform. Int J Health Plan Manag. 2020;35(1):368–377. doi:10.1002/hpm.2939
5. Birinci Ş, Ülgü MM, Gözükara MG. Critical insights based on the ministry of health’s 6-year data analysis: an epidemiological study of patient visits trends of emergency departments in Türkiye. Haydarpasa Numune Med J. 2023;6(3).
6. Dundar C, Dal Yaylaoglu S. A sample of the relationship between the non-integrated healthcare system and national epidemic of emergency department overcrowding in Turkey; 2021.
7. Ümit TB, Akdoğan Hİ. Satisfaction and knowledge levels of adult patients admitted to the emergency department of a secondary state hospital: an observational survey study. Global Emerg Critical Care. 2023;2:122–127. doi:10.4274/globecc.galenos.2023.25733
8. Henninger S, Spencer B, Pasche O. Importance of the GP–patient relationship. Eur J Gener Pract. 2019;25(4):245. doi:10.1080/13814788.2019.1679469
9. Birinci S, Guven SC, Ata N, Ulgu MM, Kucuksahin O. Patient satisfaction with health care services in Turkiye: a glimpse from nationwide Ministry of Health database. North Clin Istanbul. 2024;11(6).
10. Fenton JJ, Jerant AF, Bertakis KD, Franks P. The cost of satisfaction: a national study of patient satisfaction, health care utilization, expenditures, and mortality. Arch Internal Med. 2012;172(5):405–411. doi:10.1001/archinternmed.2011.1662
11. Backman A-S, Blomqvist P, Svensson T, Adami J. Health care utilization following a non-urgent visit in emergency department and primary care. Int Emerg Med. 2010;5:539–546. doi:10.1007/s11739-010-0439-9
12. Derlet RW, Kinser D, Ray L, Hamilton B, McKenzie J. Prospective identification and triage of nonemergency patients out of an emergency department: a 5-year study. Ann Emerg Med. 1995;25(2):215–223. doi:10.1016/S0196-0644(95)70327-6
13. Grol R, Wensing M, Mainz J, et al. Patients’ priorities with respect to general practice care: an international comparison. Family Practice. 1999;16(1):4–11. doi:10.1093/fampra/16.1.4
14. Dagdeviren N, Akturk Z. An evaluation of patient satisfaction in Turkey with the EUROPEP instrument (vol 45, pg 23, 2004). Yonsei Med J. 2005;46(3):448.
15. Akturk Z, Dagdeviren N, Sahin E, et al. Patients evaluate physicians: the EUROPEP instrument. Journal of. 2002;9:153–160.
16. Konateke S, Yılmaz M. Turkish validity and reliability study of the brief emergency department patient satisfaction scale. Int Emerg Nurs. 2022;61:101145. doi:10.1016/j.ienj.2022.101145
17. Hu LT, Bentler PM. Cutoff criteria for fit indexes in covariance structure analysis: conventional criteria versus new alternatives. Struct Equ Model. 1999;6(1):1–55. doi:10.1080/10705519909540118
18. Jiang L, Ye L, Dai M, Zhou J, Li Q. Use Andersen’s behavior model to explain non-urgent visits in emergency department: a single center study in southwest China. Int Emerg Nurs. 2020;52:100845. doi:10.1016/j.ienj.2020.100845
19. Uscher-Pines L, Pines J, Kellermann A, Gillen E, Mehrotra A. Deciding to visit the emergency department for non-urgent conditions: a systematic review of the literature. Am J Manag Care. 2013;19(1):47.
20. Koziol-McLain J, Price DW, Weiss B, Quinn AAT, Honigman B. Seeking care for nonurgent medical conditions in the emergency department: through the eyes of the patient. J Emerg Nurs. 2000;26(6):554–563. doi:10.1067/men.2000.110904
21. Aktürk Z, Ateşoğlu D, Ciftci E. Patient satisfaction with family practice in Turkey: three-year trend from 2010 to 2012. Eur J Gener Pract. 2015;21(4):238–245. doi:10.3109/13814788.2015.1048681
22. Tuz C, Özçakir A. Why patients self-refer to the emergency service for nonurgency?: a mix-method survey from a family medicine perspective. Medicine. 2024;103(10):e37453. doi:10.1097/MD.0000000000037453
23. Ionescu-Ittu R, McCusker J, Ciampi A, et al. Continuity of primary care and emergency department utilization among elderly people. Cmaj. 2007;177(11):1362–1368. doi:10.1503/cmaj.061615
24. Yang S, Zhou M, Liao J, Ding X, Hu N, Kuang L. Association between primary care utilization and emergency room or hospital inpatient services utilization among the middle-aged and elderly in a self-referral system: evidence from the China health and retirement longitudinal study 2011–2018. Int J Environ Res Public Health. 2022;19(19):12979. doi:10.3390/ijerph191912979
25. Thind K, Wiedrick J, Walker S, Hasan R. Emergency department visits increase in transition-age patients empaneled in a primary care network at a major academic medical center. J Adolesc Health. 2022;70(1):77–82. doi:10.1016/j.jadohealth.2021.07.024
26. Ron D, Abess AT, Boone MD, Martinez-Camblor P, Deiner SG. Perioperative primary care utilization and postoperative readmission, emergency department use, and mortality in older surgical patients. Anesthesia Analg. 2022.
27. Xin H. Patient dissatisfaction with primary care and nonurgent emergency department use. J Ambulatory Care Manage. 2019;42(4):284–294. doi:10.1097/JAC.0000000000000301
28. Hunt KA, Weber EJ, Showstack JA, Colby DC, Callaham ML. Characteristics of frequent users of emergency departments. Ann Emerg Med. 2006;48(1):1–8. doi:10.1016/j.annemergmed.2005.12.030
29. Stube CW, Ljungberg AS, Borton JA, Chadha K, Kelleran KJ, Lerner EB. Why do patients opt for the emergency department over other care choices? A multi-hospital analysis. West J Emerg Med. 2024;25(6):921.
30. Stefanini A, Aloini D, Gloor P, Pochiero F. Patient satisfaction in emergency department: unveiling complex interactions by wearable sensors. J Bus Res. 2021;129:600–611. doi:10.1016/j.jbusres.2019.12.038
 © 2025 The Author(s). This work is published and licensed by Dove Medical Press Limited. The
full terms of this license are available at https://www.dovepress.com/terms
and incorporate the Creative Commons Attribution
- Non Commercial (unported, 4.0) License.
By accessing the work you hereby accept the Terms. Non-commercial uses of the work are permitted
without any further permission from Dove Medical Press Limited, provided the work is properly
attributed. For permission for commercial use of this work, please see paragraphs 4.2 and 5 of our Terms.
© 2025 The Author(s). This work is published and licensed by Dove Medical Press Limited. The
full terms of this license are available at https://www.dovepress.com/terms
and incorporate the Creative Commons Attribution
- Non Commercial (unported, 4.0) License.
By accessing the work you hereby accept the Terms. Non-commercial uses of the work are permitted
without any further permission from Dove Medical Press Limited, provided the work is properly
attributed. For permission for commercial use of this work, please see paragraphs 4.2 and 5 of our Terms.
Recommended articles
Patient Satisfaction with Primary Health Care Services in Riyadh, Saudi Arabia
Albaqami NM, Alshagrawi S
International Journal of General Medicine 2025, 18:835-845
Published Date: 17 February 2025