")
Back to Journals » OncoTargets and Therapy » Volume 10
DNA ploidy and S-phase fraction analysis in peritoneal carcinomatosis from ovarian cancer: correlation with clinical pathological factors and response to chemotherapy
Authors Carloni S, Gallerani G , Tesei A , Scarpi E , Verdecchia GM , Virzì S, Fabbri F, Arienti C
Received 4 May 2017
Accepted for publication 11 August 2017
Published 20 September 2017 Volume 2017:10 Pages 4657—4664
DOI https://doi.org/10.2147/OTT.S141117
Checked for plagiarism Yes
Review by Single anonymous peer review
Peer reviewer comments 3
Editor who approved publication: Dr Ingrid Espinoza
Silvia Carloni,1 Giulia Gallerani,1 Anna Tesei,1 Emanuela Scarpi,2 Giorgio Maria Verdecchia,3 Salvatore Virzì,4 Francesco Fabbri,1 Chiara Arienti1
1Biosciences Laboratory, Istituto Scientifico Romagnolo per lo Studio e la Cura dei Tumori (IRST) IRCCS, Meldola, 2Unit of Biostatistics and Clinical Trials, Istituto Scientifico Romagnolo per lo Studio e la Cura dei Tumori (IRST) IRCCS, Meldola, 3Department of Surgery and Advanced Cancer Therapies, Morgagni-Pierantoni Hospital, Forlì, 4Department of Surgery, Bentivoglio Hospital, Bologna, Italy
Objective: We investigated the correlation between ploidy or S-phase fraction (SPF) and the clinical pathological characteristics of patients with peritoneal carcinomatosis from ovarian cancer. We also assessed their relation with the in vivo and in vitro response to several chemotherapeutic agents.
Patients and methods: Fifty-three patients with peritoneal carcinomatosis from ovarian cancer were enrolled. Frozen tumor tissue was dissociated by a detergent–trypsin method, and the resulting cell suspension was stained with RNase A and propidium iodide. Samples were then analyzed for ploidy and SPF by flow cytometry. Fresh tumor tissue was dissociated by enzymatic digestion, and cells were exposed to different concentrations of cisplatin, adriamycin, carboplatin, gemcitabine and taxol for 72 hours. In vitro drug sensitivity was then measured using the sulforhodamine B assay.
Results: No significant correlation was found between ploidy or SPF and patient characteristics, even though primary carcinomas were mainly hyperdiploid and more proliferative than recurrent tumors. SPF differed significantly among ploidy categories (P=0.01), and high SPF was associated with short-term survival (P=0.48). Patients with multiploid tumors were the most resistant to platinum-based chemotherapy, whereas those with hyperdiploid tumors were the most responsive. In vitro multiploid tumors were the least sensitive, while hypodiploid samples showed the highest sensitivity to the tested drugs. Sensitivity to adriamycin was significantly correlated with ploidy (P=0.03), whereas sensitivity to taxol was correlated with SPF (P=0.04).
Conclusion: Our results indicate that ploidy and SPF could facilitate the choice of therapy for patients with peritoneal carcinomatosis.
Keywords: DNA index, aneuploidy, SPF, chemotherapeutic agent, in vitro sensitivity, in vivo response
Introduction
Ovarian cancer is the fifth cause of death from cancer in women and is the most frequent cause of death among gynecological malignancies in the Western world,1,2 with an estimated five-year survival rate of 39%.3 The incidence of the disease in developed countries is 14 cases out of 100,000 women per year, but its frequency varies among different geographic regions, and ethnic and age groups, with no relation to familial factors in the majority of cases.4
Most ovarian cancers (90%–95%) derive from epithelial cells on the surface of the ovary, and different subtypes have been identified (serous, papillary, mucinous, endometrial, clear cell, etc.), with variable prognosis. Less frequently, ovarian cancer arises from other types of cells (5%–10%) such as germinal cell tumors, sex cord-stromal tumors, mixed cell-type tumors and others.5
Epithelial cancer derives from the malignant transformation of ovarian surface epithelial cells which are contiguous to the peritoneal mesothelium. As a consequence of tumor growth, malignant cells may exfoliate and disseminate into the abdominal cavity. The spread of the tumor into the peritoneum is called peritoneal carcinomatosis and is a typical feature of cancer dissemination in patients with advanced primary or recurrent epithelial ovarian cancer.6 Currently, eradication of the peritoneal surface, surgical cytoreduction to decrease the tumor load to a minimum and intraperitoneal chemotherapy to eliminate microscopic disease are the standard strategies used to prolong overall survival (OS) and disease-free survival.7
Platinum/taxol-based chemotherapy is the treatment of choice for the management of advanced epithelial ovarian cancer. Although clinical remission is often achieved after completion of the first-line treatment, 60% of patients will ultimately relapse or develop drug resistance.8 Different treatment modalities have been used in an attempt to overcome these limits, such as secondary cytoreduction, second-line chemotherapeutic drugs, cytoreductive surgery (CRS) plus hypertermic intraperitoneal chemotherapy (HIPEC), radiotherapy, immunotherapy and hormone therapy.9 To date, with the exception of CRS plus HIPEC, none of the aforementioned approaches has been found to have a significant impact on survival. HIPEC refers to the administration of cytotoxic agents with perfusional technique directly into the peritoneal cavity during surgery, at the end of cytoreductive phase. The optimal temperature during perfusion is 41.5°C–43°C. HIPEC combines the pharmacokinetic advantage of cytotoxic drug delivery directly into the peritoneal cavity with the cell-killing effect of hypertermia.
Chromosomal rearrangements represent an early step in tumorigenesis, and transformation to a malignancy phenotype is frequently accompanied by quantitative changes in DNA content (DNA aneuploidy).10 Aneuploidy appears to be promoted by disruption of the spindle assembly checkpoint, centrosome abnormalities, alterations in microtubule–kinetochore dynamics or defects in chromosome cohesion.11 Whether aneuploidy is simply a by-product of the process of tumor formation or whether it is instrumental in carcinogenesis remains to be clarified.
Flow cytometric analysis of the nuclear DNA content provides valuable information about the proliferative activity of tumor cells, defined as the S-phase fraction (SPF).12 Although the involvement of aneuploidy and SPF in tumor progression has never been firmly established, several studies have reported that chromosomal instability and high levels of replicating DNA are associated with a varied response to chemotherapy in some tumors.13–15
The main aim of the present work was to define the prognostic significance of DNA ploidy and SPF by evaluating their correlation with the clinical pathological characteristics of patients with peritoneal carcinomatosis from ovarian cancer. A secondary aim was to investigate the association between ploidy or SPF and sensitivity to therapy to identify patients who could potentially benefit from a specific chemotherapy.
Patients and methods
Patients
Fifty-three patients with peritoneal carcinomatosis from advanced primary or recurrent ovarian cancer underwent surgical resection at Pierantoni Hospital in Forlì or Bentivoglio Hospital in Bologna. Tumor characteristics are reported in Table 1. Inclusion criteria were age ≥18 years, histological confirmation of advanced or recurrent ovarian cancer and pre- or postsurgery platinum-based chemotherapy. Informed consent was obtained before the surgical treatment, and patients were required to be accessible for follow-up (24 months). The study protocol was approved by the Ethics Committee of Istituto Scientifico Romagnolo per lo Studio e la Cura dei Tumori (IRST) and Area Vasta Romagna (AVR) in accordance with the ethical standards laid down in the Declaration of Helsinki, and patients gave written informed consent to take part in the study. We divided patients into responders (partial or complete clinical response and stable disease) and nonresponders (progressive disease) to evaluate the correlation between DNA ploidy, SPF and clinical response to chemotherapy.
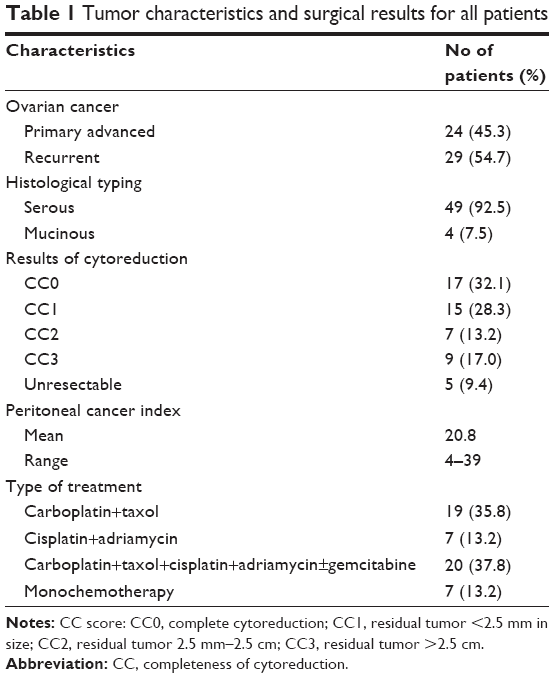 | Table 1 Tumor characteristics and surgical results for all patients |
Sample collection
Immediately after surgical resection, tumor specimens were sampled and analyzed (under sterile conditions) by a pathologist to confirm the tumor representativity of the samples. A part of the tissue was then stored in liquid nitrogen for subsequent flow cytometric analysis.
Cell processing for DNA ploidy analysis
Frozen tumor tissue was dissociated by a detergent–trypsin method as previously described by Vindeløv et al.16 Briefly, tissue fragments were minced in Petri dishes using scalpels and collected in 5 mL tubes containing citrate/DMSO buffer (0.25 M sucrose, 40 mM trisodium citrate dihydrate, 0.5% DMSO). Cell suspensions were obtained and filtered over a 70-μm nylon strainer (CellTrics; Partec Gmbh, Münster, Germany). An absolute count of the cell suspension was performed, and the final volume was calculated to obtain a concentration of 106 cells/mL. Cells were stained at room temperature for 10 min with 2 mL of detergent solution (3.4 mM trisodium citrate dehydrate, 0.1% Nonidet P-40, 1.5 mM spermine tetrahydrochloride and 0.5 mM Tris) and 30 μg/mL trypsin type IX from porcine pancreas (Sigma-Aldrich, St Louis, MO, USA). Incubation was followed by staining with 1.5 mL detergent solution, 500 μg/mL chicken egg white trypsin inhibitor (Sigma-Aldrich) and 100 μg/mL RNase A (Sigma-Aldrich). Finally, cells were stained for 2 h with 1.5 mL of detergent solution and 200 μg/mL propidium iodide (Molecular Probes, Eugene, OR, USA).
Cell acquisition and analysis
Flow cytometric analysis was performed using a FACSCanto flow cytometer (Becton Dickinson, Franklin Lakes, NJ, USA). A total of 10,000 events per sample were acquired using FACSDiva software (Becton Dickinson). Cells for DNA analysis were acquired at the low rate (approximately 100 events/seconds). Sex-specific human lymphocytes from healthy donors were mixed (1:1 proportion) with tumor cells and served as DNA diploid internal control. After aggregate exclusion, data were analyzed with ModFit 2.0 (DNA Modelling System; Verity Software House, Inc., Topsham, ME, USA). Only histograms with a coefficient of variation ≤5% were considered.17 DNA index (DI) values were evaluated as the ratio of the mean channel number of the DNA aneuploid G0/G1 peak to the mean channel number of the G0/G1 peak of human lymphocytes. Ploidy was categorized as diploidy if DI was >0.95 to <1.06, hypodiploidy if DI was ≤0.95 and hyperdiploidy if DI was ≥1.06, as previously reported.18–20 A sample was categorized as multiploid when more than one aneuploid population was present.
SPF measurement
DNA histograms were interpreted according to the European Society for Analytical Cellular Pathology (ESACP) consensus criteria.21 SPF, a measure of tumor proliferative activity, was automatically calculated by the ModFit program as the percentage of cells in the S phase of the cycle and was recorded for all cases. SPF was not calculated in DNA multiploid cases.22 The median SPF value (14.9%) was used as the cut-off to distinguish between tumors with high (≥14.9%) and low (<14.9%) proliferative activity.
In vitro chemosensitivity test
A cell suspension was obtained after fresh tumor tissue was enzymatically digested for 4–16 hours. Cells were counted and plated at a density of 5×10³ cells/well in 96-well flat-bottomed microtiter plates (100 μL of cell suspension/well). Experiments were run in octuplicate. Cells were exposed for 72 hours to the following: 1, 10 and 100 μM of cisplatin or adriamycin; 8, 80 and 800 μM of carboplatin; 4, 40 and 400 μM of gemcitabine; and 0.6, 6 and 60 μM of taxol. Drug concentrations were selected as previously described.23 Drug activity was assessed by sulforhodamine B assay according to the method of Skehan et al.24 The optical density of treated and untreated cells was determined at a wavelength of 540 nm using a fluorescence plate reader. The PC3 cell line dose–response curve in relation to the tested drugs was generated and used as an internal control in all performed experiments. As previously described, 70% inhibiting concentration values were determined to identify patients who were sensitive or resistant to drugs.25
Statistical analysis
The relationship between continuous and dichotomous variables was analyzed using a nonparametric ranking statistic.26 Spearman’s correlation coefficient (rs) was used to investigate the correlation between continuous variables, such as age, peritoneal cancer index (PCI) and SPF. For survival analysis, Kaplan–Meier curves were plotted, and differences between the curves analyzed using the log-rank test. Two-sided P-values <0.05 were considered significant.
Results
DNA ploidy and clinical pathological variables
The histograms obtained after flow cytometric analysis of propidium iodide-stained nuclei showed a considerable variation in DNA content. In particular, tumor sample DI ranged from 0.6 to 2.5, with a mean of 1.3 (Figure 1A). Typical histograms obtained during the analysis of the genome size are shown in Figure 1B. On the basis of the DI, samples were divided into four categories: hyperdiploid (34% of cases), hypodiploid (26.4%), diploid (22.6%) and multiploid (17%). The association between ploidy and clinical pathological variables is shown in Table 2. No significant correlation was found between ploidy status and PCI, age, recurrence or proliferation rate. Advanced primary carcinomas were mainly hyperdiploid (45.8% of total primary carcinomas), whereas recurrent tumors showed a wide variation in DNA content (31% were hypodiploid, 24.1% hyperdiploid, 24.1 multiploid and 20.8% diploid).
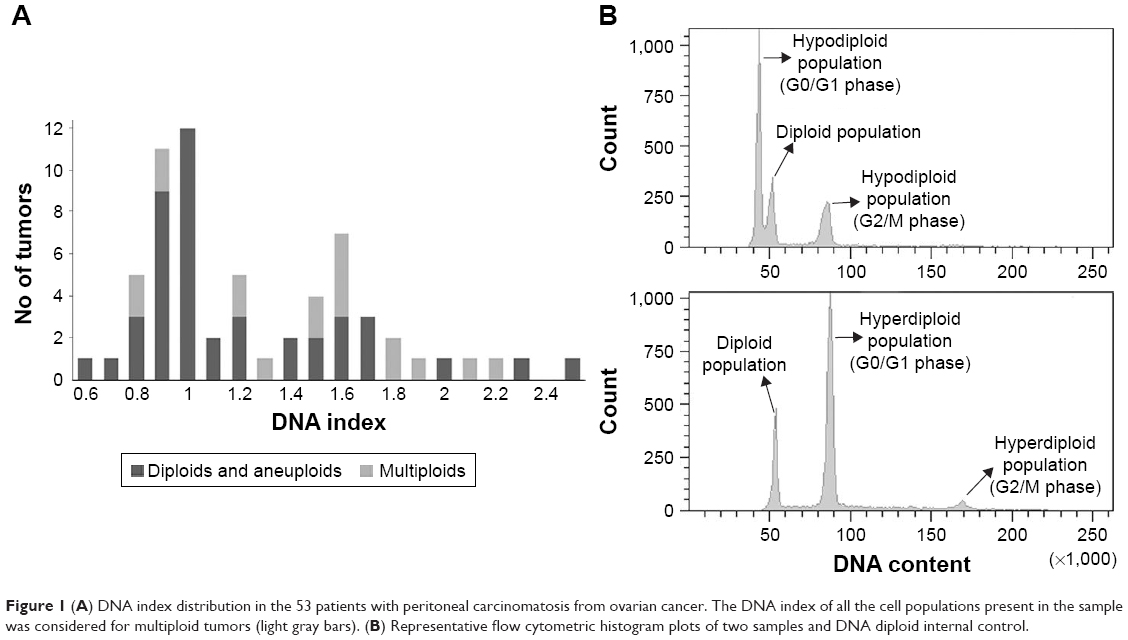 | Figure 1 (A) DNA index distribution in the 53 patients with peritoneal carcinomatosis from ovarian cancer. The DNA index of all the cell populations present in the sample was considered for multiploid tumors (light gray bars). (B) Representative flow cytometric histogram plots of two samples and DNA diploid internal control. |
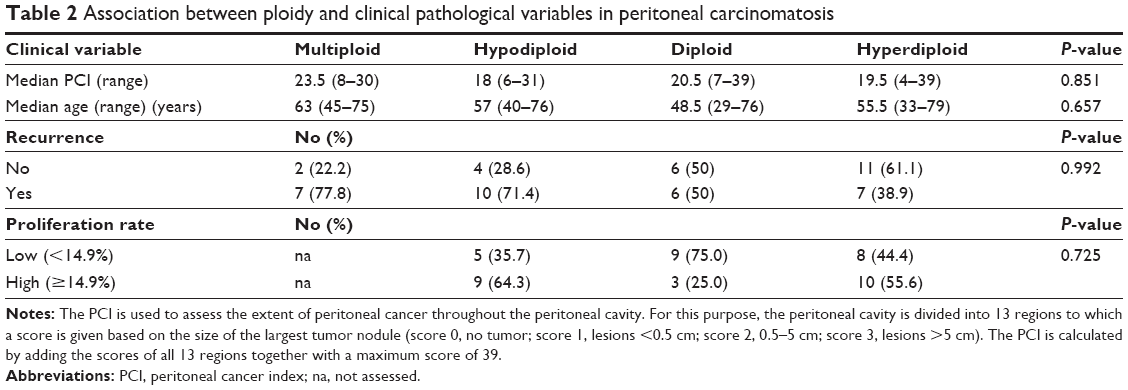 | Table 2 Association between ploidy and clinical pathological variables in peritoneal carcinomatosis |
SPF and clinical pathological factors
SPF ranged from 1.58% to 65.51%, with a median of 14.9%. SPF differed significantly among the three ploidy categories (P=0.01). In particular, median SPF was 5.69% in the diploid group, 16.57% in hyperdiploid tumors and 18.72% in the hypodiploid group (Figure 2). The association between SPF and clinical pathological variables is shown in Table 3. Primary tumors generally had a higher SPF than recurrent tumors (P=0.056), whereas PCI or age did not correlate with SPF level.
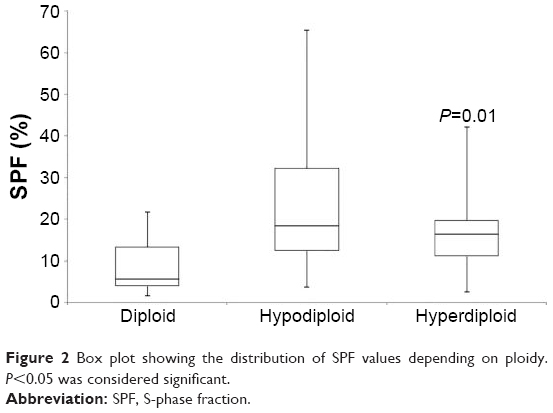 | Figure 2 Box plot showing the distribution of SPF values depending on ploidy. P<0.05 was considered significant. |
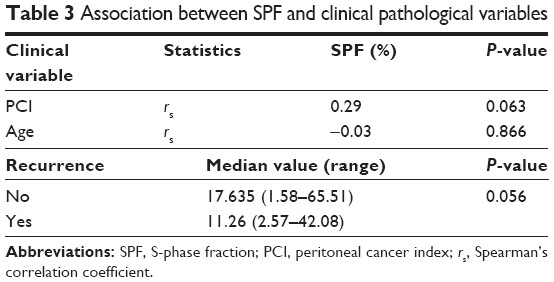 | Table 3 Association between SPF and clinical pathological variables |
Ploidy, SPF and survival outcome
Univariate survival analysis with ploidy status and SPF value at cut point of 14.9% was done. The ploidy status showed no prognostic significance in any case (Figure 3A), even when diploid tumors were compared with all the aneuploid tumors (data not shown). Conversely, Kaplan–Meier plot for OS with respect to SPF demonstrated that short survival time was associated with high SPF (P=0.048) (Figure 3B).
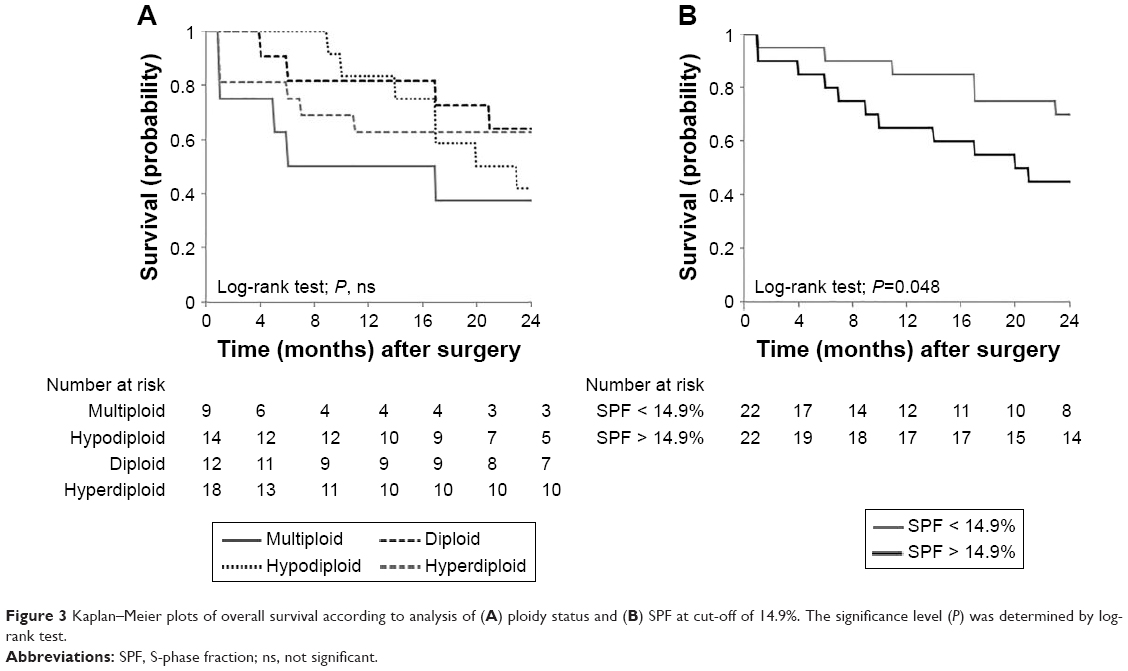 | Figure 3 Kaplan–Meier plots of overall survival according to analysis of (A) ploidy status and (B) SPF at cut-off of 14.9%. The significance level (P) was determined by log-rank test. |
Clinical response
Analysis of the responsiveness of the different subgroups to the in vivo treatment revealed that only 11.1% of multiploid tumors were responsive, whereas hypodiploid and diploid tumors showed an intermediate sensitivity to platinum-based treatment (35.7% and 41.7% of responsive tumors, respectively). Patients with hyperdiploid tumors were the most responsive to chemotherapy (61.1%). In particular, this group was more sensitive to cisplatin+adriamycin (2/2 cases, 100%) and carboplatin+taxol (4/6 cases, 66.7%) than to any of the other drugs. Clinical response did not correlate with SPF.
In vitro chemosensitivity test
In parallel, a chemosensitivity profile to all the drugs used in clinical treatments was generated for each tumor. We also evaluated drug sensitivity on the basis of sample ploidy and SPF. Multiploid tumors were the most resistant to all in vitro treatments (Table 4). Conversely, diploid tumors showed important sensitivity to adriamycin and cisplatin (41.7% and 40% of sensitive cases, respectively). Hyperdiploid tumors were sensitive to all drugs, but mainly to adriamycin. Hypodiploid samples showed the highest sensitivity to all the tested drugs.
 | Table 4 In vitro sensitivity (%) of the different ploidy subgroups to all tested drugs |
Statistical analysis revealed that only sensitivity to adriamycin was significantly correlated with ploidy (P=0.03), whereas sensitivity to taxol was correlated with SPF (P=0.04). In particular, patients who were sensitive to taxol had tumors with a lower proliferative activity (median SPF 6.85%; range 2.57%−49.11%) than those who were resistant (median SPF 16.48%; range 1.58%−65.51%).
Discussion
In 1914, Theodor Boveri formulated the first aneuploidy theory of cancer which postulated that tumors are caused by the abnormal dosage of thousands of genes. This abnormality is generated by the gain or loss of chromosomes or parts of chromosomes.27,28 According to this theory, carcinogenesis is initiated by a random aneuploidy that destabilizes chromosomes and genes. If cancer was caused by aneuploidy, malignancy would be proportional to the degree of aneuploidy.27 We evaluated the DI of 53 patients with peritoneal carcinomatosis from advanced primary or recurrent ovarian cancer, observing considerable variation in the DNA content between samples. Of note, only 22.6% of cases were diploid. PCI, age, recurrence and proliferation rate were not significantly associated with ploidy status, even though primary carcinomas were mainly hyperdiploid and recurrent tumors showed a wide variability in their DNA content. This observation is consistent with findings from other studies, indicating that hypodiploidy is rarely found during the early stages of carcinogenesis, presumably because of its lethality at the cellular level.29
Moreover, in agreement with Coley et al,30 we observed that diploid tumors showed the lowest SPF, indicative of a lower proliferation rate and less aggressive behavior than hyper- and hypodiploid cases.
Although we found no correlation between ploidy and OS, the Kaplan–Meier analysis revealed that high SPF was associated with short-term survival, in agreement with data published by Ermiah et al on breast cancer patients,31 but in contrast to the findings of Kimmig et al.32
As drug resistance is a key problem in cancer treatment, it is essential to develop reliable criteria to identify the patients who are most likely to benefit from chemotherapy. Previous studies evaluating the correlation between DNA content and response to chemotherapy reported contradictory results. The works by Jakobsen and Bichel33 and Brescia et al34 revealed a significant relation between the chemotherapy response rate and ploidy in patients with ovarian cancer, whereas Kigawa et al found no difference in response to chemotherapy between diploid and aneuploid tumors.35
Although our results did not reveal a significant association between tumor DNA ploidy or SPF and clinical response to platinum-based chemotherapy, a nonsignificant trend toward a poorer response was observed in multiploid tumors. The wide variability in DNA content of multiploid samples may be a sign of tumor heterogeneity, the most obvious clinical implication being that a specific treatment, albeit effective in one area of the tumor, may not be equally as effective in another.36
Conversely, highly proliferative primary hyperdiploid tumors were the most responsive to chemotherapy. Our findings are in agreement with previous reports of improved chemotherapy response rates in primary solid tumors with a high SPF.37–40
Predicting drug response at the preclinical level could facilitate treatment planning, reduce undesirable drug toxicity and decrease health care costs. The majority of patients with ovarian cancer, notwithstanding the heterogeneity of treatments available for peritoneal carcinomatosis, have persistent disease or relapse after a short disease-free interval.41 Preclinical studies of response to therapy are therefore needed to reduce the risk of administering ineffective treatments to which the disease has acquired resistance.23
In the present study, we investigated whether a conventional in vitro chemosensitivity test is capable of predicting clinical response to therapy regimens on the basis of ploidy and SPF. In agreement with clinical data, we found that multiploid tumors were the most resistant to all of the in vitro treatments and that diploid tumors showed an intermediate sensitivity to the tested drugs. However, in contrast to our clinical data, hyperdiploid tumors were sensitive to all drugs but less so than hypodiploid samples, which demonstrated the highest in vitro sensitivity. This may be due to the fact that patients did not always receive the therapy that proved the most effective in in vitro testing. In fact, although adriamycin and cisplatin were the most active drugs against both hyper- and hypodiploid tumors in vitro, a higher number of hyperdiploid than hypodiploid patients underwent treatment containing these two drugs in vivo.
Finally, although the majority of patients with peritoneal carcinomatosis received platinum-containing chemotherapy, we found that ploidy significantly correlated with in vitro sensitivity to adriamycin, and that low SPF was associated with sensitivity to taxol. The latter finding is in contrast to results from a previous study showing that highly proliferating cells were the most sensitive to taxane treatment.14 However, we observed a significant correlation between low SPF and diploidy, while Swanton et al, in the OV01 ovarian cancer clinical trial, demonstrated that paclitaxel caused cell death in diploid cells, but not in chromosomally unstable cells.42 In particular, a high level of chromosomal instability was associated with taxane resistance. We probably failed to find a correlation between ploidy and taxane treatment because of our small sample size.
Conclusion
In conclusion, our results indicate that DNA ploidy and SPF do not significantly correlate with patient characteristics or clinical response to platinum-based chemotherapy. In our population, patients with multiploid peritoneal carcinomatosis showed the poorest response, while those with hyperdiploid tumors were the most responsive. Moreover, in vitro chemosensitivity data revealed that ploidy was significantly associated with sensitivity to adriamycin and that SPF correlated with sensitivity to taxol. Further studies are warranted to confirm these data.
Acknowledgment
The authors thank Cristiano Verna for editorial assistance.
Author contributions
All authors contributed toward data analysis, drafting and critically revising the paper and agree to be accountable for all aspects of the work.
Disclosure
The authors report no conflicts of interest in this work.
References
Poveda A, Salazar R, del Campo JM, et al. Update in the management of ovarian and cervical carcinoma. Clin Transl Oncol. 2007;9(7):443–451. | ||
Muñoz-Casares FC, Medina-Fernández FJ, Arjona-Sánchez Á, et al. Peritonectomy procedures and HIPEC in the treatment of peritoneal carcinomatosis from ovarian cancer: long-term outcomes and perspectives from a high-volume center. Eur J Surg Oncol. 2016;42(2):224–233. | ||
Jemal A, Tiwari RC, Murray T, et al; American Cancer Society. Cancer statistics, 2004. CA Cancer J Clin. 2004;54(1):8–29. | ||
Webb PM, Jordan SJ. Epidemiology of epithelial ovarian cancer. Best Pract Res Clin Obstet Gynaecol. 2017;41:3–14. | ||
Palomar A, Nanni C, Castellucci P, et al. Value of FDG PET/CT in patients with treated ovarian cancer and raised CA125 serum levels. Mol Imaging Biol. 2012;14(1):123–129. | ||
Fagotti A, Gallotta V, Romano F, et al. Peritoneal carcinosis of ovarian origin. World J Gastrointest Oncol. 2010;2(2):102–108. | ||
Jaaback K, Johnson N, Lawrie TA. Intraperitoneal chemotherapy for the initial management of primary epithelial ovarian cancer. Cochrane Database Syst Rev. 2016;(1):CD005340. | ||
Sagae S, Berek JS, Fu YS, Chang N, Dauplat J, Hacker NF. Peritoneal cytology of ovarian cancer patients receiving intraperitoneal therapy: quantitation of malignant cells and response. Obstet Gynecol. 1988;72(5):782–788. | ||
Vasey PA. Resistance to chemotherapy in advanced ovarian cancer: mechanisms and current strategies. Br J Cancer. 2003;89 (Suppl 3):S23–S28. | ||
Tanaka K, Hirota T. Chromosomal instability: a common feature and a therapeutic target of cancer. Biochim Biophys Acta. 2016;1866(1):64–75. | ||
Fang X, Zhang P. Aneuploidy and tumorigenesis. Semin Cell Dev Biol. 2011;22(6):595–601. | ||
Feng YC, Yang J, Liu CM, Cheng ZZ, Huang YC. DNA ploidy of cervical epithelial cells should be a cure criterion of high-risk HPV infection in Xinjiang Uygur women. Onco Targets Ther. 2015;8:827–833. | ||
Rajagopalan H, Lengauer C. Aneuploidy and cancer. Nature. 2004;432(7015):338–341. | ||
Kolfschoten GM, Hulscher TM, Pinedo HM, Boven E. Drug resistance features and S-phase fraction as possible determinants for drug response in a panel of human ovarian cancer xenografts. Br J Cancer. 2000;83(7):921–927. | ||
Karelia NH, Patel DD, Desai NS, et al. Prognostic significance of DNA aneuploidy and p21 ras oncoprotein expression in colorectal cancer and their role in the determination of treatment modalities. Int J Biol Markers. 2001;16(2):97–104. | ||
Vindeløv LL, Christensen IJ, Nissen NI. A detergent-trypsin method for the preparation of nuclei for flow cytometric DNA analysis. Cytometry. 1983;3(5):323–327. | ||
Darzynkiewicz Z. Critical aspects in analysis of cellular DNA content. Curr Protoc Cytom. 2011;Chapter 7:Unit 7.2. | ||
Smets LA, Slater R, van Wering ER, et al. DNA index and %S-phase cells determined in acute lymphoblastic leukemia of children: a report from studies ALL V, ALL VI, and ALL VII (1979–1991) of the Dutch Childhood Leukemia Study Group and The Netherlands Workgroup on Cancer Genetics and Cytogenetics. Med Pediatr Oncol. 1995;25(6):437–444. | ||
Tsurusawa M, Katano N, Fujimoto T. Prognosis and DNA aneuploidy in children with acute lymphoblastic leukemia. Haematol Blood Transfus. 1990;33:174–181. | ||
Bezić J, Samija-Projić I, Projić P, et al. Near-diploid hyperploidy in early breast cancer (T1a,b) is associated with higher risk of lymph node involvement. Pathol Oncol Res. 2013;19(1):71–77. | ||
Haroske G, Giroud F, Reith A, Böcking A. 1997 ESACP consensus report on diagnostic DNA image cytometry. Part I: basic considerations and recommendations for preparation, measurement and interpretation. European Society for Analytical Cellular Pathology. Anal Cell Pathol. 1998;17(4):189–200. | ||
Duigou F, Herlin P, Marnay J, Michels JJ. Variation of flow cytometric DNA measurement in 1,485 primary breast carcinomas according to guidelines for DNA histogram interpretation. Cytometry. 2000;42(1):35–42. | ||
Arienti C, Tesei A, Verdecchia GM, et al. Peritoneal carcinomatosis from ovarian cancer: chemosensitivity test and tissue markers as predictors of response to chemotherapy. J Transl Med. 2011;9:94. | ||
Skehan P, Storeng R, Scudiero D, et al. New colorimetric cytotoxicity assay for anticancer-drug screening. J Natl Cancer Inst. 1990;82(13):1107–1112. | ||
Arienti C, Tesei A, Verdecchia GM, et al. Role of conventional chemosensitivity test and tissue biomarker expression in predicting response to treatment of peritoneal carcinomatosis from colon cancer. Clin Colorectal Cancer. 2013;12(2):122–127. | ||
Siegel S. Nonparametric Statistics. London: McGraw-Hill Ltd.; 1956. | ||
Duesberg P, Fabarius A, Hehlmann R. Aneuploidy, the primary cause of the multilateral genomic instability of neoplastic and preneoplastic cells. IUBMB Life. 2004;56(2):65–81. | ||
Sansregret L, Swanton C. The role of aneuploidy in cancer evolution. Cold Spring Harb Perspect Med. 2017;7(1):1–18. | ||
Danielsen HE, Pradhan M, Novelli M. Revisiting tumour aneuploidy – the place of ploidy assessment in the molecular era. Nat Rev Clin Oncol. 2016;13(5):291–304. | ||
Coley HM, Sargent JM, Titley J, Taylor CG. Lack of prognostic significance of ploidy and S-phase measurements in advanced ovarian cancer. Anticancer Res. 1999;19(3A):2111–2116. | ||
Ermiah E, Buhmeida A, Abdalla F, et al. Prognostic value of proliferation markers: immunohistochemical ki-67 expression and cytometric s-phase fraction of women with breast cancer in Libya. J Cancer. 2012;3:421–431. | ||
Kimmig R, Wimberger P, Hillemanns P, Kapsner T, Caspari C, Hepp H. Multivariate analysis of the prognostic significance of DNA-ploidy and S-phase fraction in ovarian cancer determined by flow cytometry following detection of cytokeratin-labeled tumor cells. Gynecol Oncol. 2002;84(1):21–31. | ||
Jakobsen A, Bichel P. Ploidy level, histopathological differentiation and response to chemotherapy in serious ovarian cancer. Eur J Cancer Clin Oncol. 1989;25(11):1589–1593. | ||
Brescia RJ, Barakat RA, Beller U, et al. The prognostic significance of nuclear DNA content in malignant epithelial tumors of the ovary. Cancer. 1990;65(1):141–147. | ||
Kigawa J, Minagawa Y, Ishihara H, Kanamori Y, Terakawa N. Tumor DNA ploidy and prognosis of patients with serous cystadenocarcinoma of the ovary. Cancer. 1993;72(3):804–808. | ||
Blagden SP. Harnessing pandemonium: the clinical implications of tumor heterogeneity in ovarian cancer. Front Oncol. 2015;5:149. | ||
Hietanen P, Blomqvist C, Wasenius VM, Niskanen E, Franssila K, Nordling S. Do DNA ploidy and S-phase fraction in primary tumour predict the response to chemotherapy in metastatic breast cancer? Br J Cancer. 1995;71(5):1029–1032. | ||
Schmidt RA, Conrad EU 3rd, Collins C, Rabinovitch P, Finney A. Measurement and prediction of the short-term response of soft tissue sarcomas to chemotherapy. Cancer. 1993;72(9):2593–2601. | ||
Türkölmez K, Baltaci S, Bedük Y, Müftüoğlu YZ, Göğüş O. DNA ploidy and S-phase fraction as predictive factors of response and outcome following neoadjuvant methotrexate, vinblastine, epirubicin and cisplatin (M-VEC) chemotherapy for invasive bladder cancer. Scand J Urol Nephrol. 2002;36(1):46–51. | ||
Karlsson M, Jungnelius U, Aamdal S, et al. Correlation of DNA ploidy and S-phase fraction with chemotherapeutic response and survival in a randomized study of disseminated malignant melanoma. Int J Cancer. 1996;65(1):1–5. | ||
Raspagliesi F, Kusamura S, Campos Torres JC, et al. Cytoreduction combined with intraperitoneal hyperthermic perfusion chemotherapy in advanced/recurrent ovarian cancer patients: the experience of National Cancer Institute of Milan. Eur J Surg Oncol. 2006;32(6):671–675. | ||
Swanton C, Nicke B, Schuett M, et al. Chromosomal instability determines taxane response. Proc Natl Acad Sci U S A. 2009;106(21):8671–8676. |
 © 2017 The Author(s). This work is published and licensed by Dove Medical Press Limited. The full terms of this license are available at https://www.dovepress.com/terms.php and incorporate the Creative Commons Attribution - Non Commercial (unported, v3.0) License.
By accessing the work you hereby accept the Terms. Non-commercial uses of the work are permitted without any further permission from Dove Medical Press Limited, provided the work is properly attributed. For permission for commercial use of this work, please see paragraphs 4.2 and 5 of our Terms.
© 2017 The Author(s). This work is published and licensed by Dove Medical Press Limited. The full terms of this license are available at https://www.dovepress.com/terms.php and incorporate the Creative Commons Attribution - Non Commercial (unported, v3.0) License.
By accessing the work you hereby accept the Terms. Non-commercial uses of the work are permitted without any further permission from Dove Medical Press Limited, provided the work is properly attributed. For permission for commercial use of this work, please see paragraphs 4.2 and 5 of our Terms.