Back to Journals » Cancer Management and Research » Volume 10
Distinct prognostic value of dynactin subunit 4 (DCTN4) and diagnostic value of DCTN1, DCTN2, and DCTN4 in colon adenocarcinoma
Authors Wang SJ, Wang Q, Zhang X, Liao X ![]() , Wang G, Yu L, Zhang W, Zhou Q, Hu S, Yuan W
, Wang G, Yu L, Zhang W, Zhou Q, Hu S, Yuan W
Received 8 August 2018
Accepted for publication 12 October 2018
Published 16 November 2018 Volume 2018:10 Pages 5807—5824
DOI https://doi.org/10.2147/CMAR.S183062
Checked for plagiarism Yes
Review by Single anonymous peer review
Peer reviewer comments 2
Editor who approved publication: Dr Antonella D'Anneo
Shijun Wang,1 Qiaoqi Wang,2 Xiqian Zhang,3 Xiwen Liao,4 Guixian Wang,1 Long Yu,5 Wei Zhang,1 Quanbo Zhou,1 Shengyun Hu,1 Weitang Yuan1
1Department of Colorectal and Anal Surgery, The First Affiliated Hospital of Zhengzhou University, Zhengzhou, Henan Province, China; 2Department of Medical Cosmetology, The Second Affiliated Hospital of Guangxi Medical University, Nanning, Guangxi Province, China; 3Department of Radiotherapy, The First Affiliated Hospital of Zhengzhou University, Henan Province, China; 4Department of Hepatobiliary Surgery, The First Affiliated Hospital of Guangxi Medical University, Nanning, Guangxi Province, China; 5Department of Hepatobiliary Surgery, The First Affiliated Hospital of Zhengzhou University, Henan Province, China
Background: Colon adenocarcinoma (COAD) is ranked as the third most commonly diagnosed cancer in both women and men, and it is the most frequently occurring malignant tumor. Dynactin is a protein compound based on multiple subunits, including dynactin 1–6 (DCTN1–6), in most categories of cytoplasmic dynein performance in eukaryotes. Nevertheless, correlations between the DCTN family and the prognosis and diagnosis of COAD remain unidentified.
Methods: Statistics for DCTN mRNA expression in patients with COAD were acquired from The Cancer Genome Atlas. Kaplan–Meier analyses and a Cox regression model were applied to determine overall survival, with computation of HRs and 95% CIs. Several online data portals were used to assess the biological process, and pathway examination was performed using the Kyoto Encyclopedia of Genes and Genomes to predict the biological functionality of DCTN genes.
Results: We found that high expression of DCTN4 was linked with satisfactory results for overall survival (P=0.042, HR=0.650, 95% CI 0.429–0.985). The expression of DCTN1, DATN2, and DCTN4 was closely correlated with the frequency of colon tumors (P<0.001, area under the curve [AUC]=0.8811, 95% CI 0.8311–0.9312; P<0.001, AUC=0.870, 96% CI 0.833–0.9071; and P=0.0051, AUC=0.6317, 95% CI 0.5725–0.6908, respectively). In the enrichment examination, the level of gene expression was related to the cell cycle, cell apoptosis, and the cell metastasis pathway.
Conclusion: The expression levels of DCTN1, DCTN2, and DCTN4 could allow differentiation between cancer-bearing tissues and paracancerous tissue. These genes can be applied as biomarkers to predict the prognosis and diagnosis of COAD.
Keywords: dynactin, colon adenocarcinoma, diagnosis, prognosis, biomarker
Introduction
Colon adenocarcinoma (COAD) is a type of colorectal cancer (CRC) and is the most frequently occurring malignant tumor. In USA, it is ranked as the third most frequently diagnosed tumor in both males and females.1 Moreover, in 2018, the number of new cases was predicted to be 97,220, and the predicted number of deaths was 50,630.2 The Surveillance, Epidemiology, and End Results Program (SEER) found that the 5-year survival rate is 64.5% (https://seer.cancer.gov). The risk factors involved in this disease are old age, male gender, increased level of fat consumption, alcohol, physical inactivity, smoking, red meat, obesity, and processed food.3,4 Treatment of CRC may include combinations of surgery, radiotherapy, chemotherapy, and targeted therapy.5 Diagnostic methods include colonoscopy, which is referred to as the gold standard for diagnosis and can provide a highly accurate diagnosis and assess the location of the tumor5; capsule endoscopy; computed tomography colonography; and biomarkers of CRC such as Septin-9 (SEPT9).5–7
Dynactin is a multiple-subunit protein compound involved in the activation of most forms of cytoplasmic dynein in eukaryotes.8 Dynactin connects to cytoplasmic dynein, dynein cargo adaptors, and microtubules.9 Six subunits of dynactin, DCTN1, DCTN2, DCTN3, DCTN4, DCTN5, and DCTN6, have been verified, and all the subunits are encoded through their corresponding genes. Previous research found that the DCTN family is linked with multiple neurodegenerative diseases.10–12 Nevertheless, after bibliographic retrieval, it was found that only a few studies stated the correlation between the DCTN family and the prognosis and diagnosis of COAD.
In this research, we accessed a public database, The Cancer Genome Atlas (TCGA), to assess survival-related data and DCTN family expression in patients with COAD, and examined the prognostic and diagnostic value of mRNA expression levels of individual DCTN genes. Several online data portals were employed for analyzing the functionality and signaling pathways in a bid to predict the functionality of DCTN genes.
Materials and methods
Data preparation
Data including mRNA expression and clinical information that may be linked with COAD, including gender, age, and tumor stage, were extracted from TCGA data portal, accessed by the University of California Santa Cruz Xena (UCSC Xena: https://xena.ucsc.edu/, retrieved June 21, 2018). mRNA sequencing was used in 456 patients. The expression data, which include 480 cases of cancer and 42 non-cancer mRNA sequences, were used for performing expression-associated examinations. After the cases with missing medical data and 0-day survival time had been removed, a total of 438 cases were included in the survival examination.
Functional analysis and mRNA co-expression of the DCTN family
The relevant degrees of expression of the six DCTN genes in multiple different tissues were created by GTEx Portal.13 The Database for Annotation, Visualization, and Integrated Discovery (DAVID, v.6.8)14,15 was employed to analyze the functional enrichment, which includes two terminologies, the gene ontology (GO) functional examination and the Kyoto Encyclopedia of Genes and Genomes (KEGG) pathway examination. The functional examination based on GO includes the molecular functionality (MF), biological process (BP), and cellular component (CC).
A GO function analysis tool, Biological Networks Gene Ontology (BiNGO),16 was applied for predicting the functionality of gene based on the results of correlation analysis. A gene function prediction website, Gene Multiple Association Network Integration Algorithm (GeneMANIA), was used to predict DCTN family members.17 The Search Tool for the Retrieval of Interacting Genes/Proteins (STRING) database which offers a critical evaluation and combination of protein–protein interactions,18 was employed for assessing the functional and physical relationships of DCTN4 and correlated genes, with a collective score >0.15 being taken to indicate statistical significance.
Co-expression matrix of the DCTN family in COAD
Pearson correlation coefficient analysis was used to identify correlations between DCTN family genes in COAD. Results with P<0.01 were considered to be statistically significant.
Characteristics of gene expression levels
We used the Metabolic gEne RApid Visualizer (MERAV) to make boxplots of various expression levels of DCTN family members in primary colon cancer-bearing tissue and normal colon tissue.19 Vertical scatterplots were produced based on the DCTN gene expression. Furthermore, the high and low expression level groups of DCTN genes were identified according to the median values of each gene. Patients with expression values greater than the median values of specific DCTN genes were identified as the high expression group, and the remaining patients were identified as the low expression group.
Diagnostic prediction
Receiver operating characteristics (ROC) curves were drawn to identify the prognostic importance of the DCTN family in TCGA data portal. Standardized values of diagnosis with P<0.05 were considered to be statistically significant.
Survival analysis
The log-rank test, together with Kaplan–Meier survival examination, was applied to calculate the P-value and overall survival (OS) for the DCTN gene family and clinical information. Furthermore, the Cox proportional hazards regression model was applied for univariate and multivariate survival examinations. HRs and 95% CIs were computed by means of the Cox proportional hazards regression model after adjusting for clinical characteristics.
Nomogram
A nomogram was employed to evaluate the relationship between DCTN4 and medical rank in COAD OS. Furthermore, the probable utility of DCTN4 in predicting clinical rank was assessed.
With regard to the clinical information and survival analysis, after adjustment with the Cox proportional hazards regression model, only tumor stage and expression level of DCTN4 were entered into the risk model. The points against each factor could be counted, and 1-, 5-, and 10-year survival rates could also be computed.20
Gene Set Enrichment Analysis (GSEA)
To investigate the mechanism by which different expression levels of DCTN4 in COAD generate different results, GSEA v.3.0 (http://software.broadinstitute.org/gsea/msigdb/index.jsp, accessed July 10, 2018) was used for analyzing dissimilarities in DCTN4 expression levels of biological patterns in the lower expression group and higher expression group for each gene using reference gene sets, extracted from the Molecular Signatures Database (MSigDB), c2 (KEGG gene sets: c2.all.v6.1.symbols.gmt), and c5 (GO gene sets: c5.all.v6.1.symbols.gmt).21 The number of permutations was set at 1,000. Enriched results satisfying a nominal significant cut-off value of P<0.05 with a false discovery rate <0.25 were considered to be statistically significant.
Exploring the function of DCTN4 in COAD
Pearson correlation coefficient analysis was used to perform genome-wide correlation analysis and to identify correlations between DCTN4 and possible survival rate associated with the COAD gene cohort of TCGA. An absolute value of correlation coefficient >0.4 was taken as being highly correlated. To explore the functionality of DCTN4 in COAD, the online database of DAVID, together with BiNGO, STRING, and GeneMANIA, was applied to examine the GO function and KEGG pathway for DCTN4 and correlated genes of the COAD cohort in TCGA.
Statistical analyses
SPSS v.25.0 software was used for statistical analyses (IBM Corp., Armonk, NY, USA). In addition, GraphPad Prism v.7.0 was used for generating survival curves and vertical scatterplots (GraphPad Software, Inc., La Jolla, CA, USA). The correlation plots and nomogram were produced by R v.3.5.1 (R Foundation for Statistical Computing, Vienna, Austria). Cytoscape v.3.6.1 was employed to construct an interactive network of the targeted genes.22
Results
mRNA expression of DCTN genes in human non-cancer-bearing colon and colon cancer tissues
In human colon tissues, DCTN2, DCTN5, and DCTN6 were highly expressed (Figure S1B, E, and F), and DCTN1, DCTN3, and DCTN4 were expressed at a medium level (Figure S1A, C, and D).
DCTN family functional, pathway, and co-expression enrichment analysis
The biological functionality of the DCTN genes was assessed through DAVID regarding the BP, MF, and CC types for GO function and KEGG pathway examination (Figure 1A). Enrichment outcomes were examined through BiNGO (Figure S2). Interactions between the expressed levels of DCTN genes are shown in Figure 1B. An examination of co-expression at the protein level is illustrated in Figure 1C. These results indicated that genes in the DCTN family were correlated with substance transportation, together with cell cycle and protein-binding procedures in cells.
 | Figure 1 (A) Study of enriched GO terminology and KEGG pathways for DCTN genes assessed by DAVID; (B) DCTN gene interaction networks among selected genes generated by GeneMANIA; (C) STRING physical and functional connections of DCTN genes. Abbreviations: DAVID, Database for Explaining, Visualization, and Integrated Discovery; DCTN, dynactin; ER, endoplasmic reticulum; GeneMANIA, Gene Multiple Association Network Integration Algorithm; GO, gene ontology; KEGG, Kyoto Encyclopedia of Genes and Genomes; MHC, major histocompatibility complex; STRING, Search Tool for the Retrieval of Interacting Genes/Proteins. |
Correlations between the expression levels of individual DCTN genes were found through Pearson correlation coefficient analysis. The expression level of DCTN1 was correlated with both DCTN4 and DCTN6, while the expression level of DCTN2 was correlated with DCTN3 and DCTN5 (all P<0.01; Figure 2A).
 | Figure 2 (A) Pearson’s correlation coefficients for DCTN gene expression levels, *P<0.001; (B) scatterplots for DCTN gene family expression levels in TCGA. Abbreviations: DCTN, dynactin; TCGA, The Cancer Genome Atlas. |
Diagnostic value of the DCTN gene family
Vertical scatterplots for expression levels of DCTN genes are shown in Figure 2B, and each group was considered to be statistically significant (all P<0.05). The boxplots produced from MERAV showed that, with the exception of DCTN2, the expression levels of the remaining genes in primary colon tumor were higher than in normal colon tissue (Figure 3A and C–F). The expression level of DCTN2 in normal colon tissues was greater than that in the tumor-bearing colon (Figure 3B). Furthermore, we produced ROC curves of the estimated expression levels of DCTN family in tumor and paired colon tissues (Figure 4). The expression levels of DCTN1, DATN2, and DCTN4 were closely correlated with the occurrence of colon tumors (P<0.001, area under the curve [AUC]=0.8811, 95% CI=0.8311–0.9312; P<0.001, AUC=0.870, 96% CI=0.833–0.9071; and P=0.0051, AUC=0.6317, 95% CI=0.5725–0.6908, respectively; Figure 4A, B, and D, respectively).
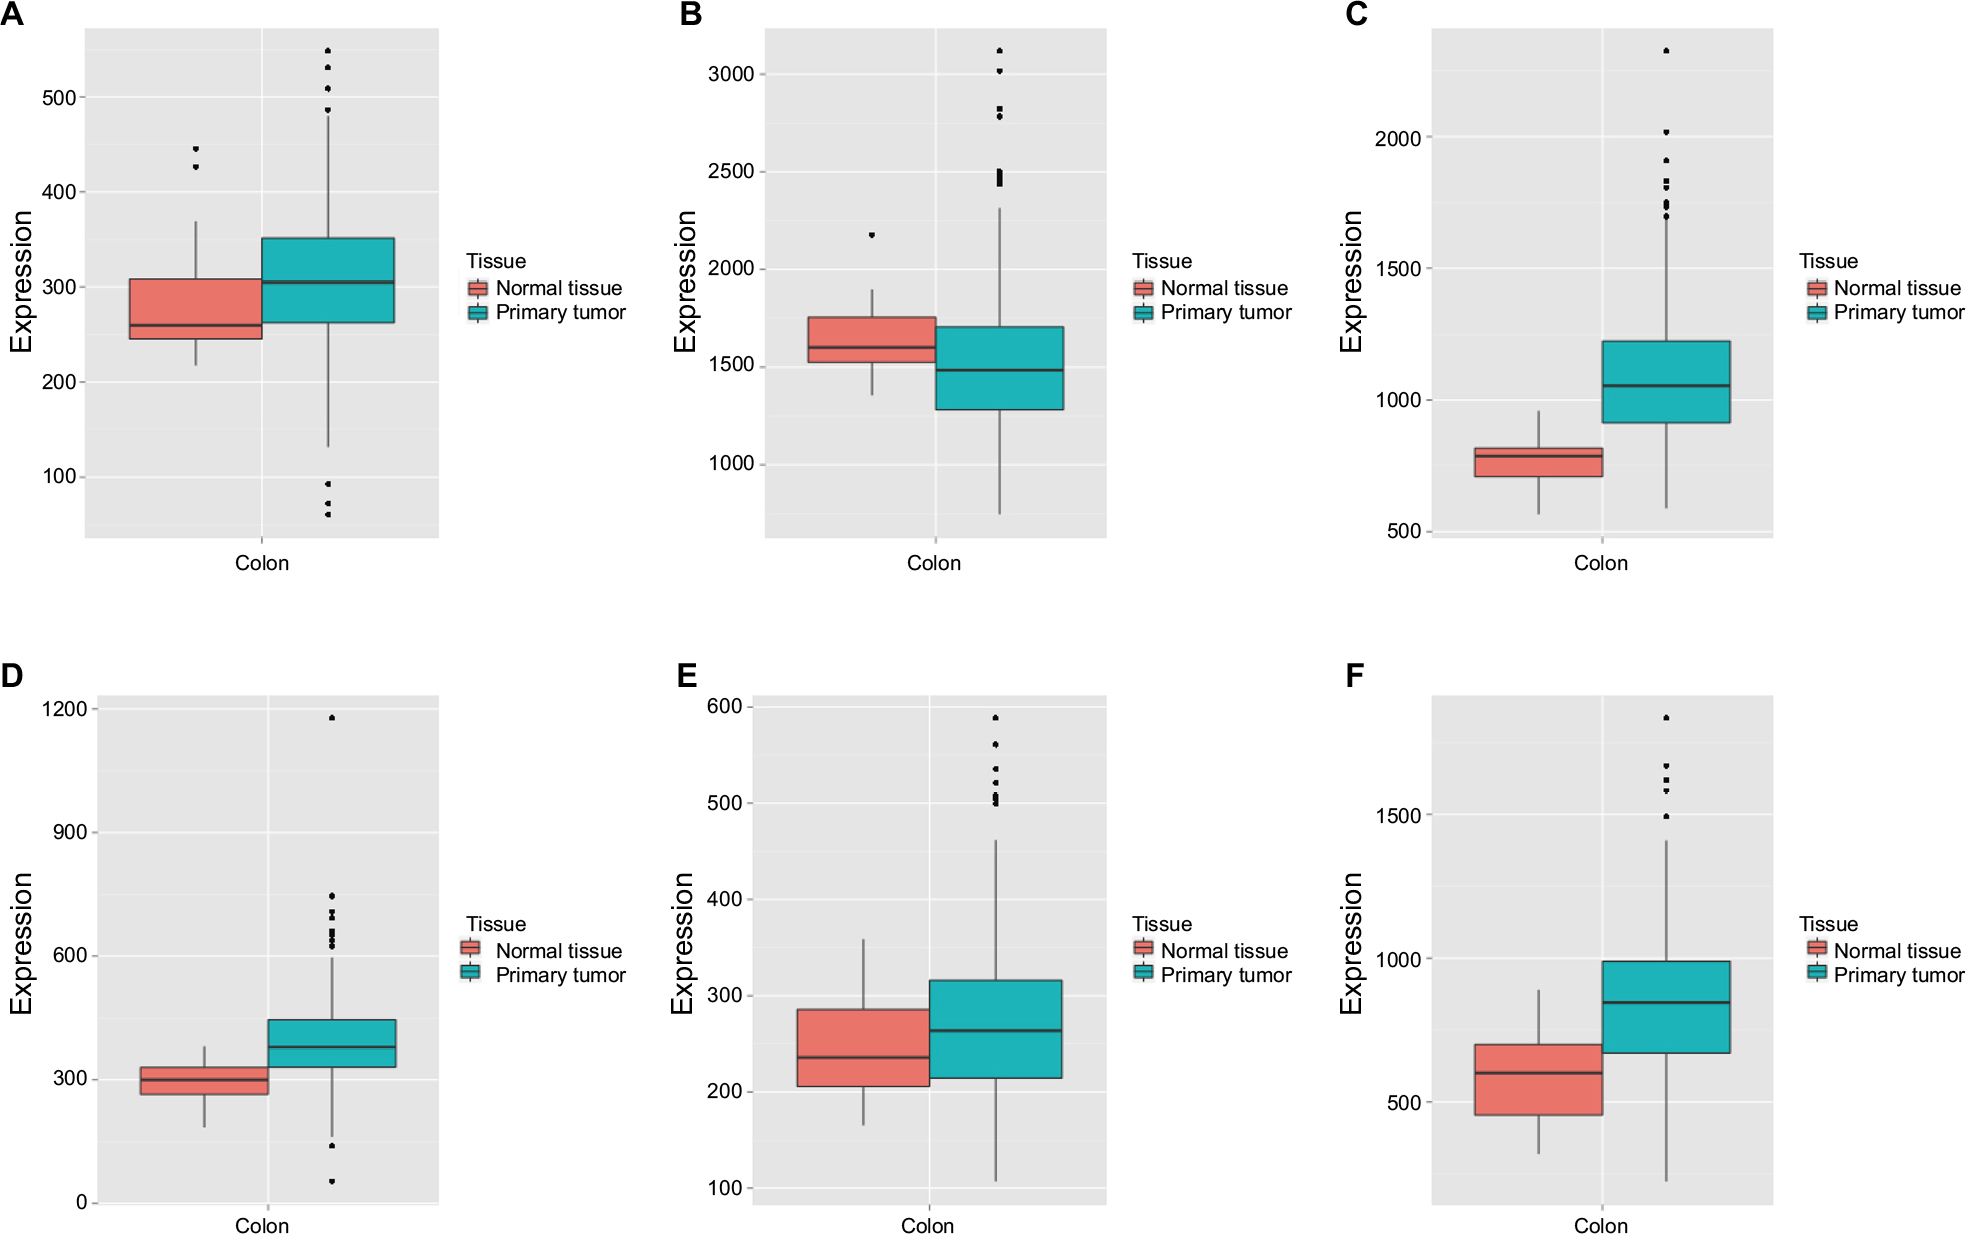 | Figure 3 MERAV boxplots of expression of DCTN family in normal tissues and tumor-bearing tissues. Note: Boxplots are shown for the expression levels of (A) DCTN1; (B) DCTN2; (C) DCTN3; (D) DCTN4; (E) DCTN5; and (F) DCTN6. Abbreviations: DCTN, dynactin; MERAV, Metabolic gEne RApid Visualizer. |
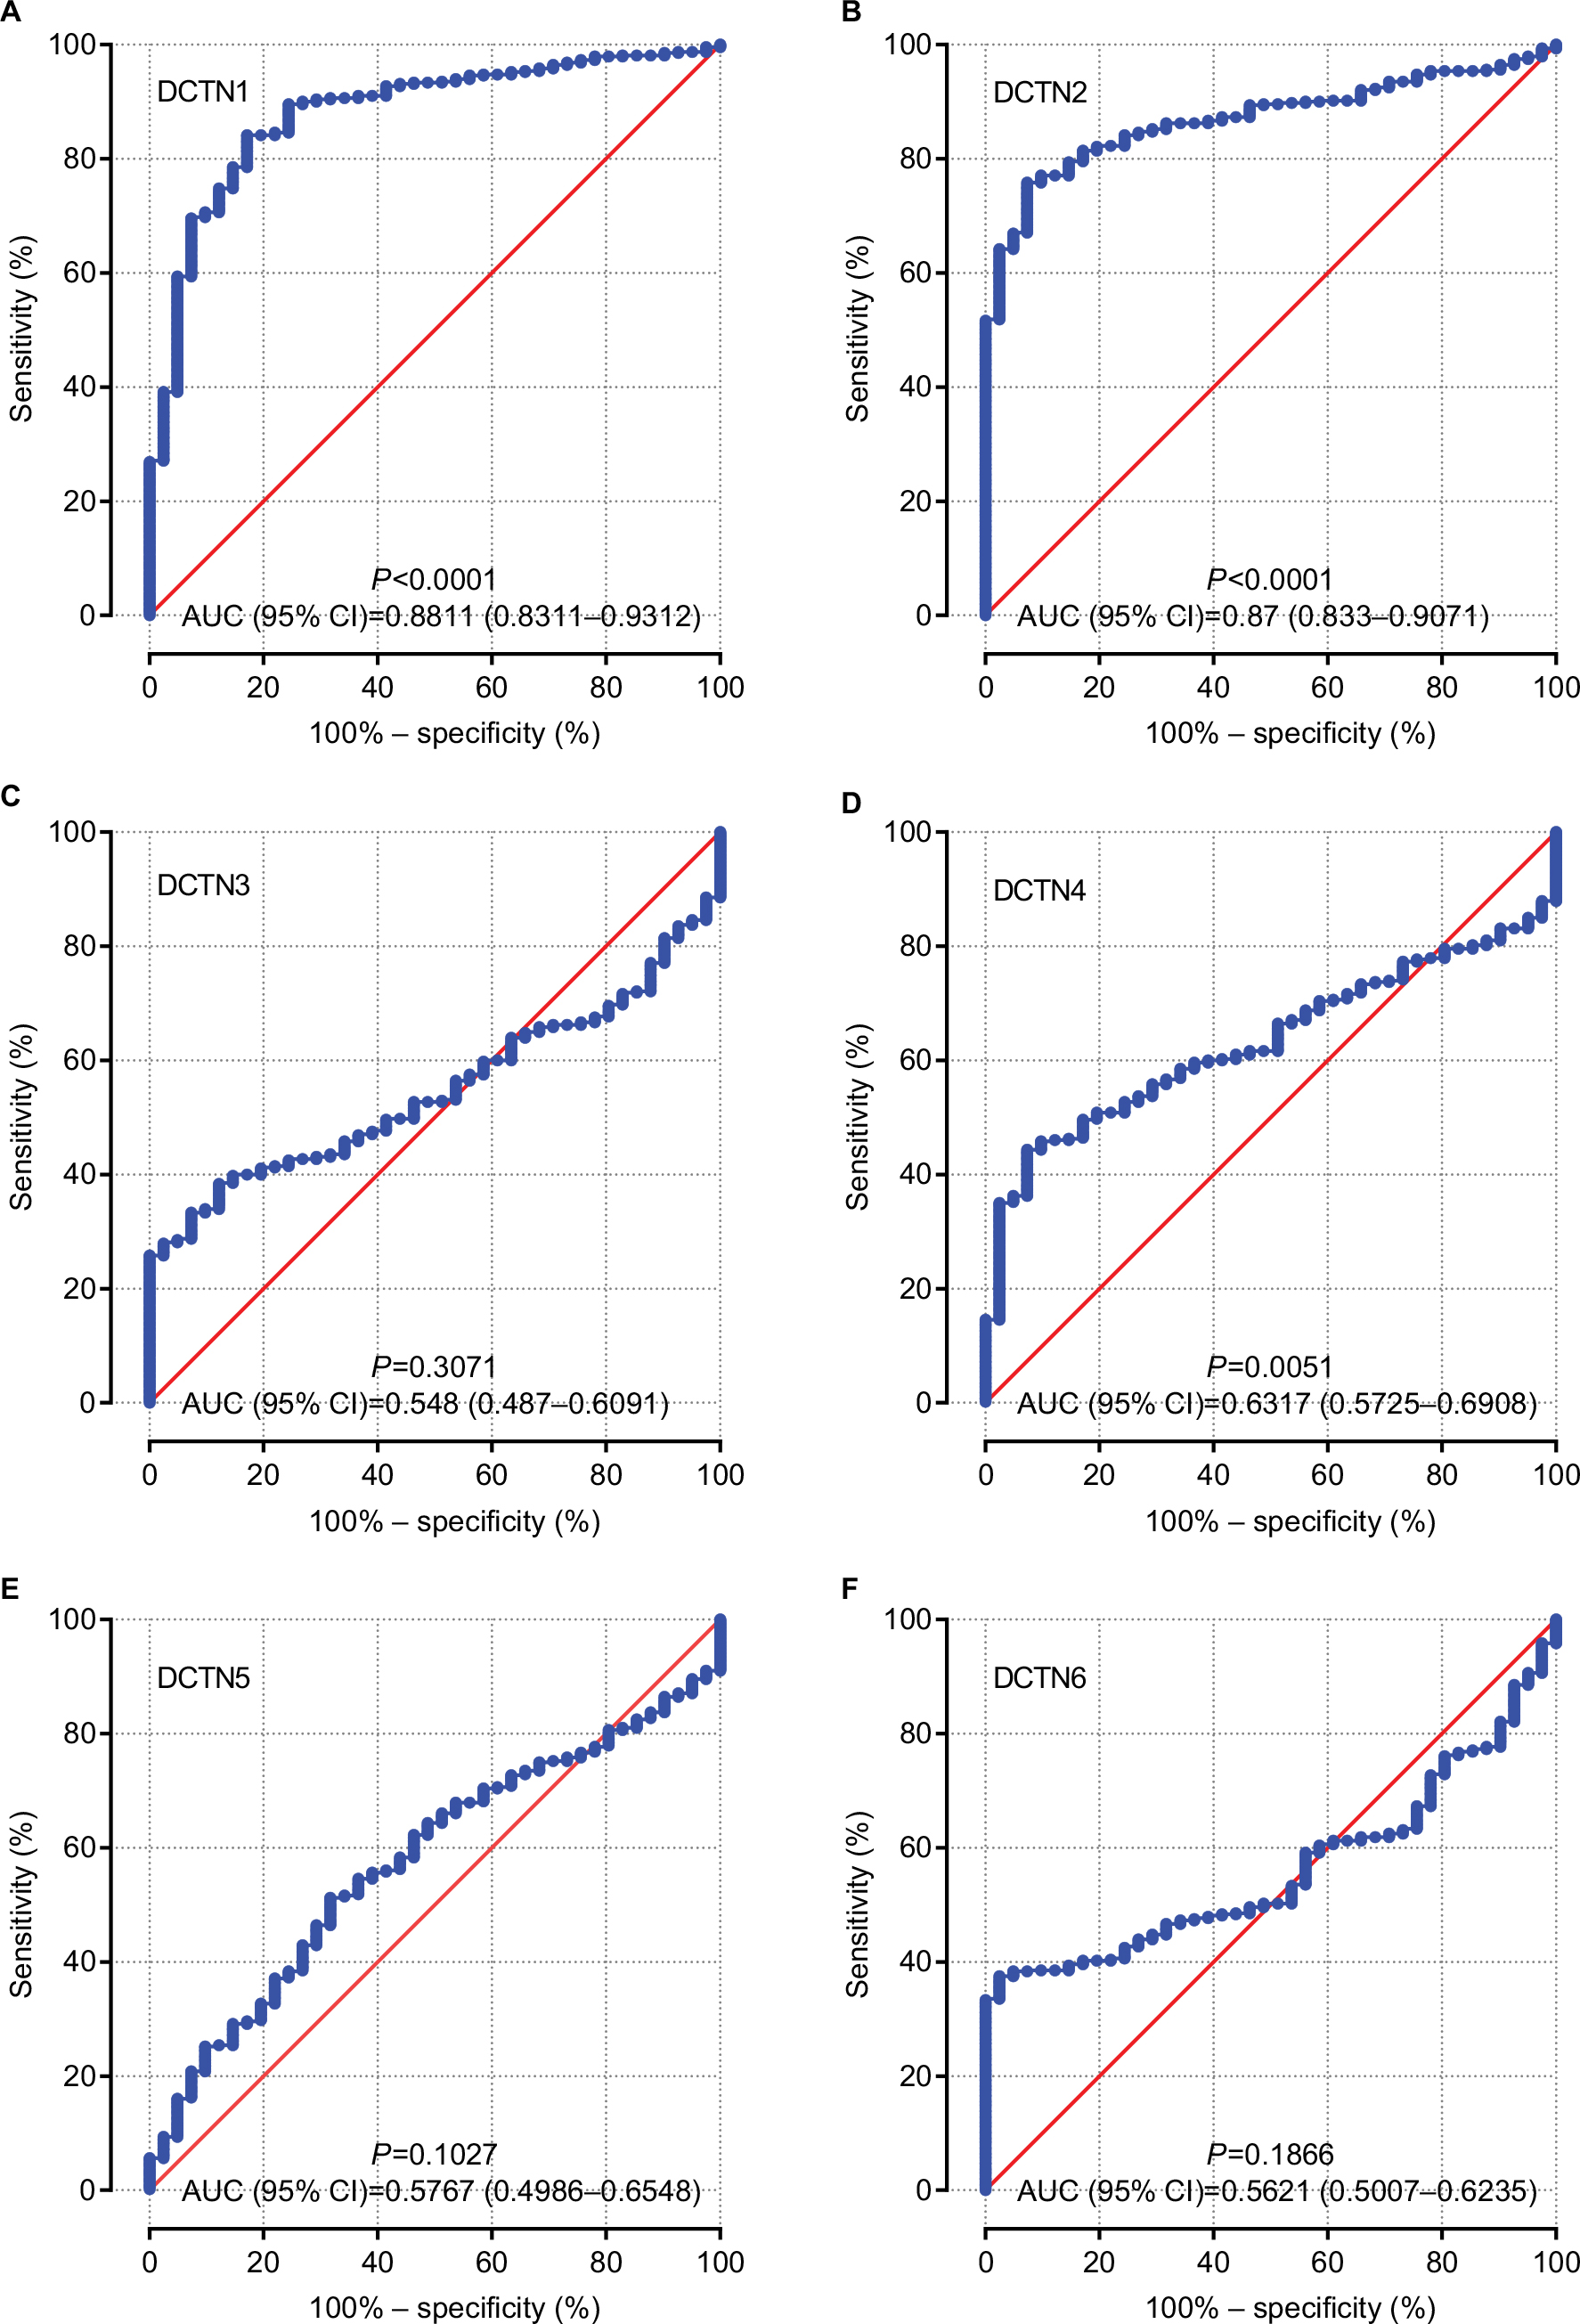 | Figure 4 ROCs of six DCTN genes, showing differences between COAD tissue and adjacent normal colon tissue. Note: ROCs of six prognostic differentially expressed miRNAs: (A) DCTN1; (B) DCTN2; (C) DCTN3; (D) DCTN4; (E) DCTN5; and (F) DCTN6. Abbreviations: COAD, colon adenocarcinoma; DCTN, dynactin; ROC, receiver operating characteristics. |
Survival analysis
The univariable survival analysis indicated that, with regard to clinical information, tumor stage was the only factor that was linked with OS, and preliminary stages were correlated significantly with favorable OS (P<0.001, HR=0.323, 95% CI=0.210–0.498; Table 1). The Kaplan–Meier curves of the DCTN gene family are shown in Figure 5A–F. The tumor phase was included in the Cox proportional hazards regression model for multivariate survival examination; higher expression levels of DCTN4 correlated significantly with satisfactory OS results (adjusted P=0.042, HR=0.650, 95% CI=0.429–0.985; Table 2; Figure 5D), and the results were consistent with the outcomes of univariate survival examination (P=0.009, HR=0.581, 95% CI=0.386–0.874; Table 2).
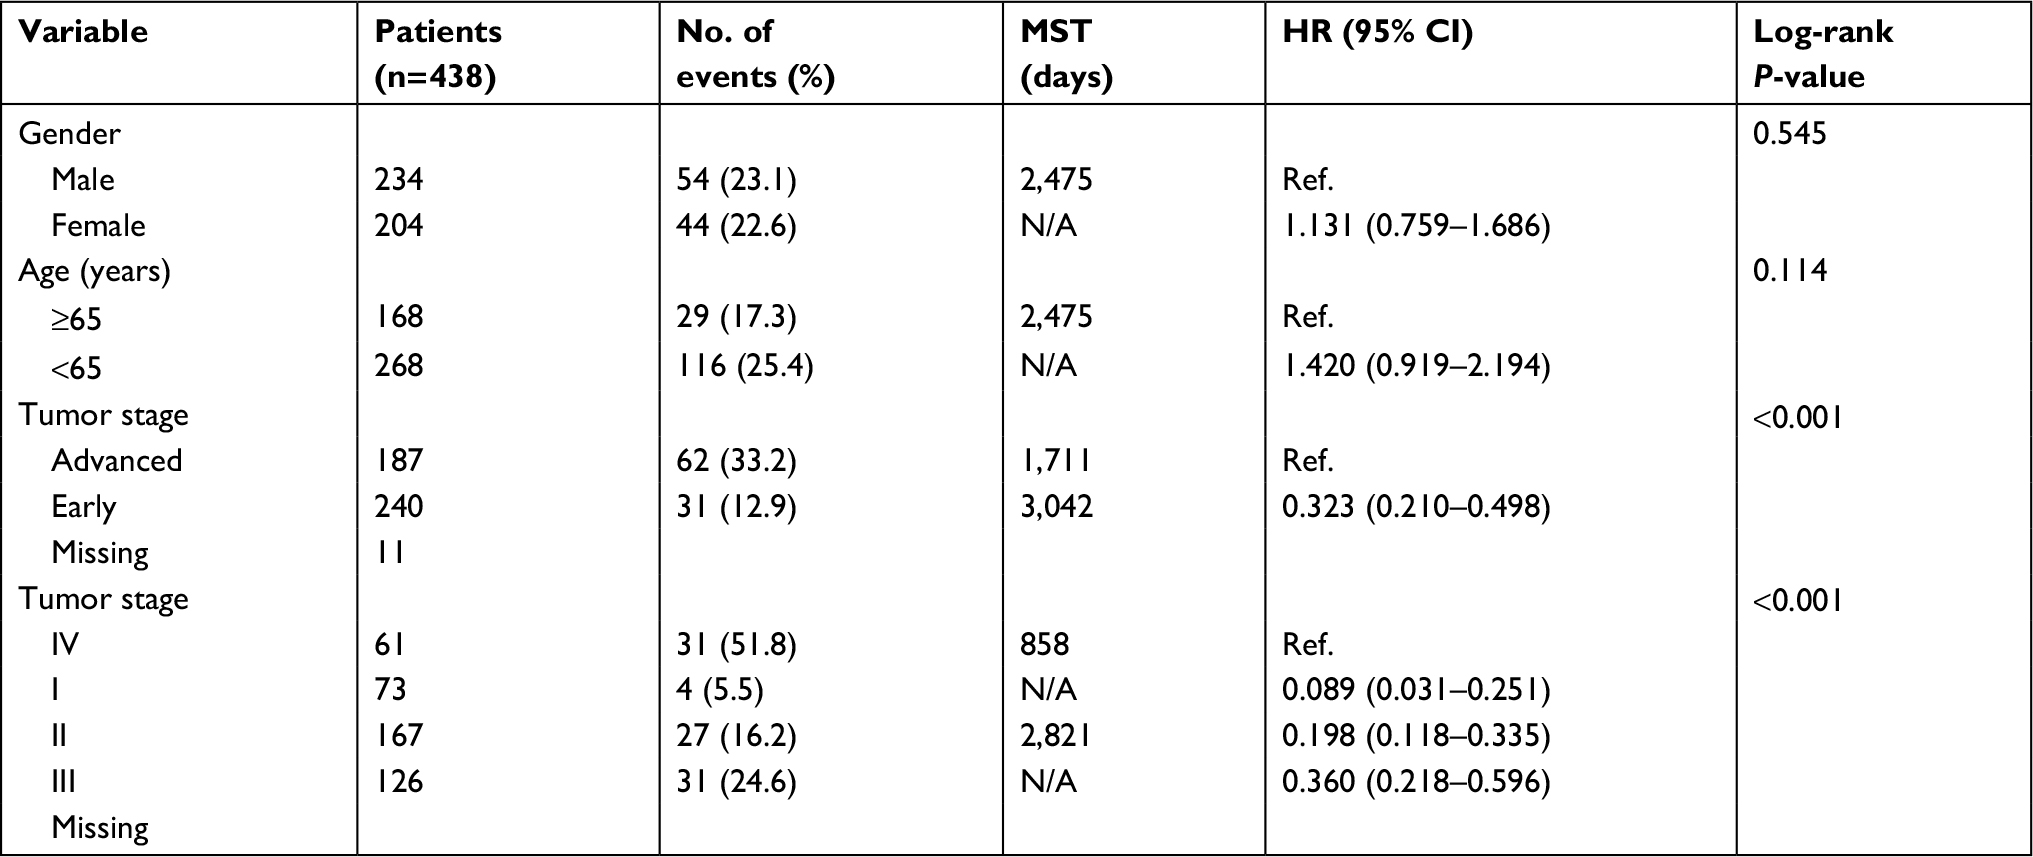 | Table 1 Demographic and clinical data for 438 COAD patients Abbreviations: COAD, colon adenocarcinoma; MST, median survival time; N/A, not available. |
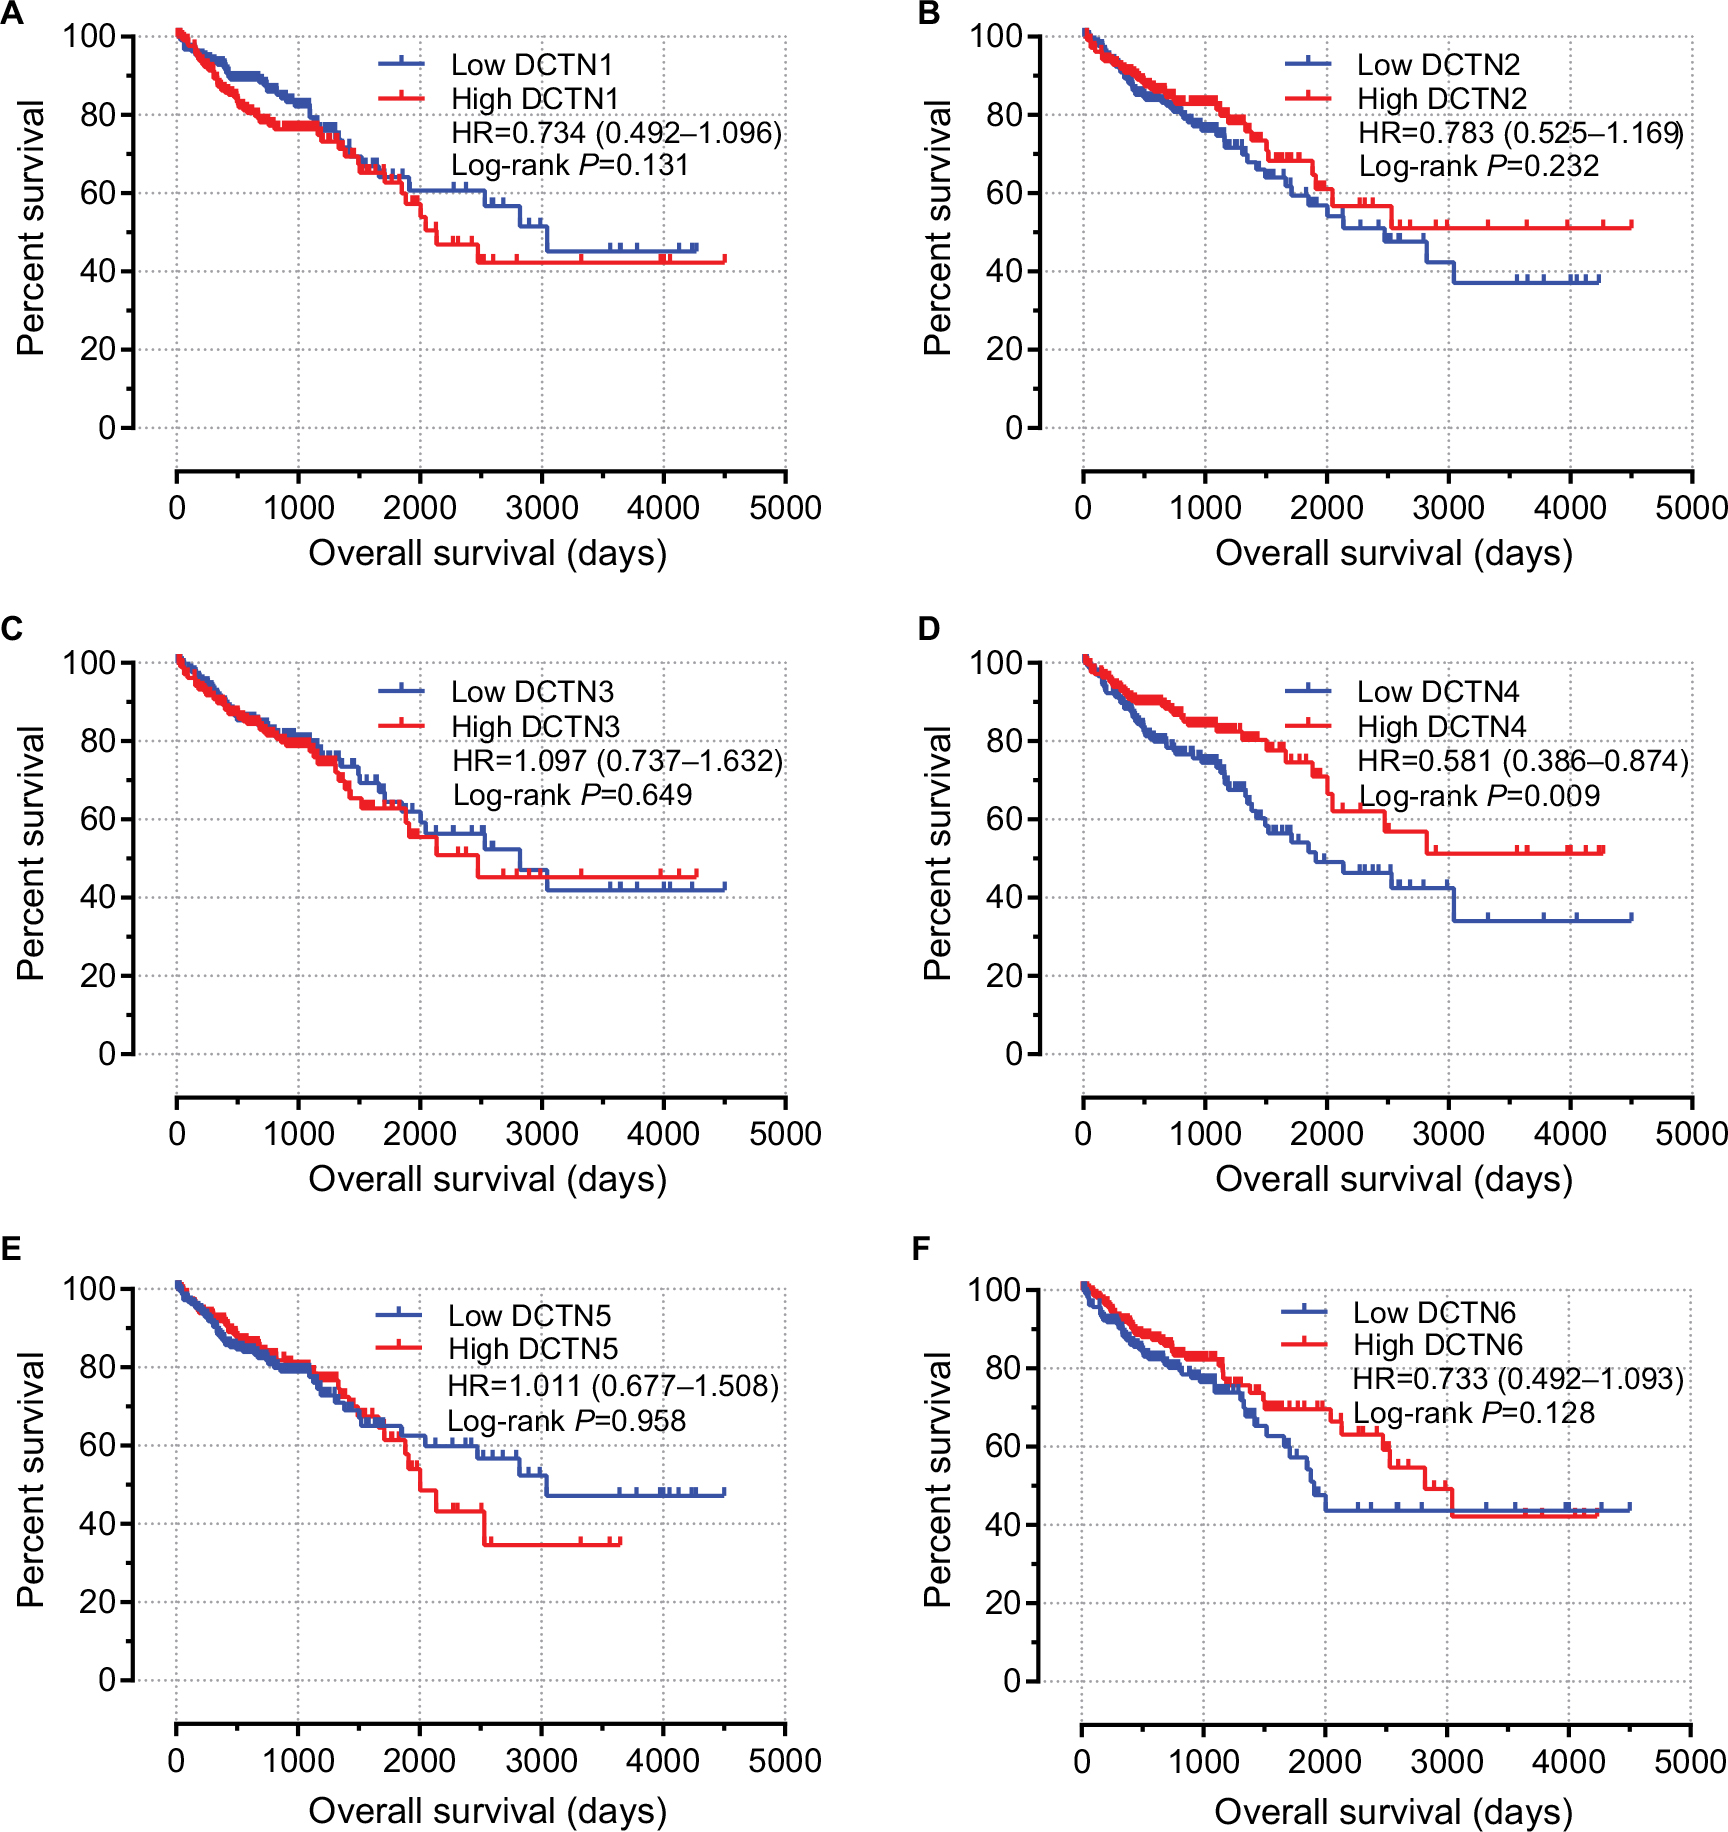 | Figure 5 Prognostic graphs of DCTN expression for overall survival. Note: Kaplan–Meier survival curves for complete COAD patients according to expression of (A) DCTN1; (B) DCTN2; (C) DCTN3; (D) DCTN4; (E) DCTN5; and (F) DCTN6 (n=438). Abbreviations: COAD, colon adenocarcinoma; DCTN, dynactin. |
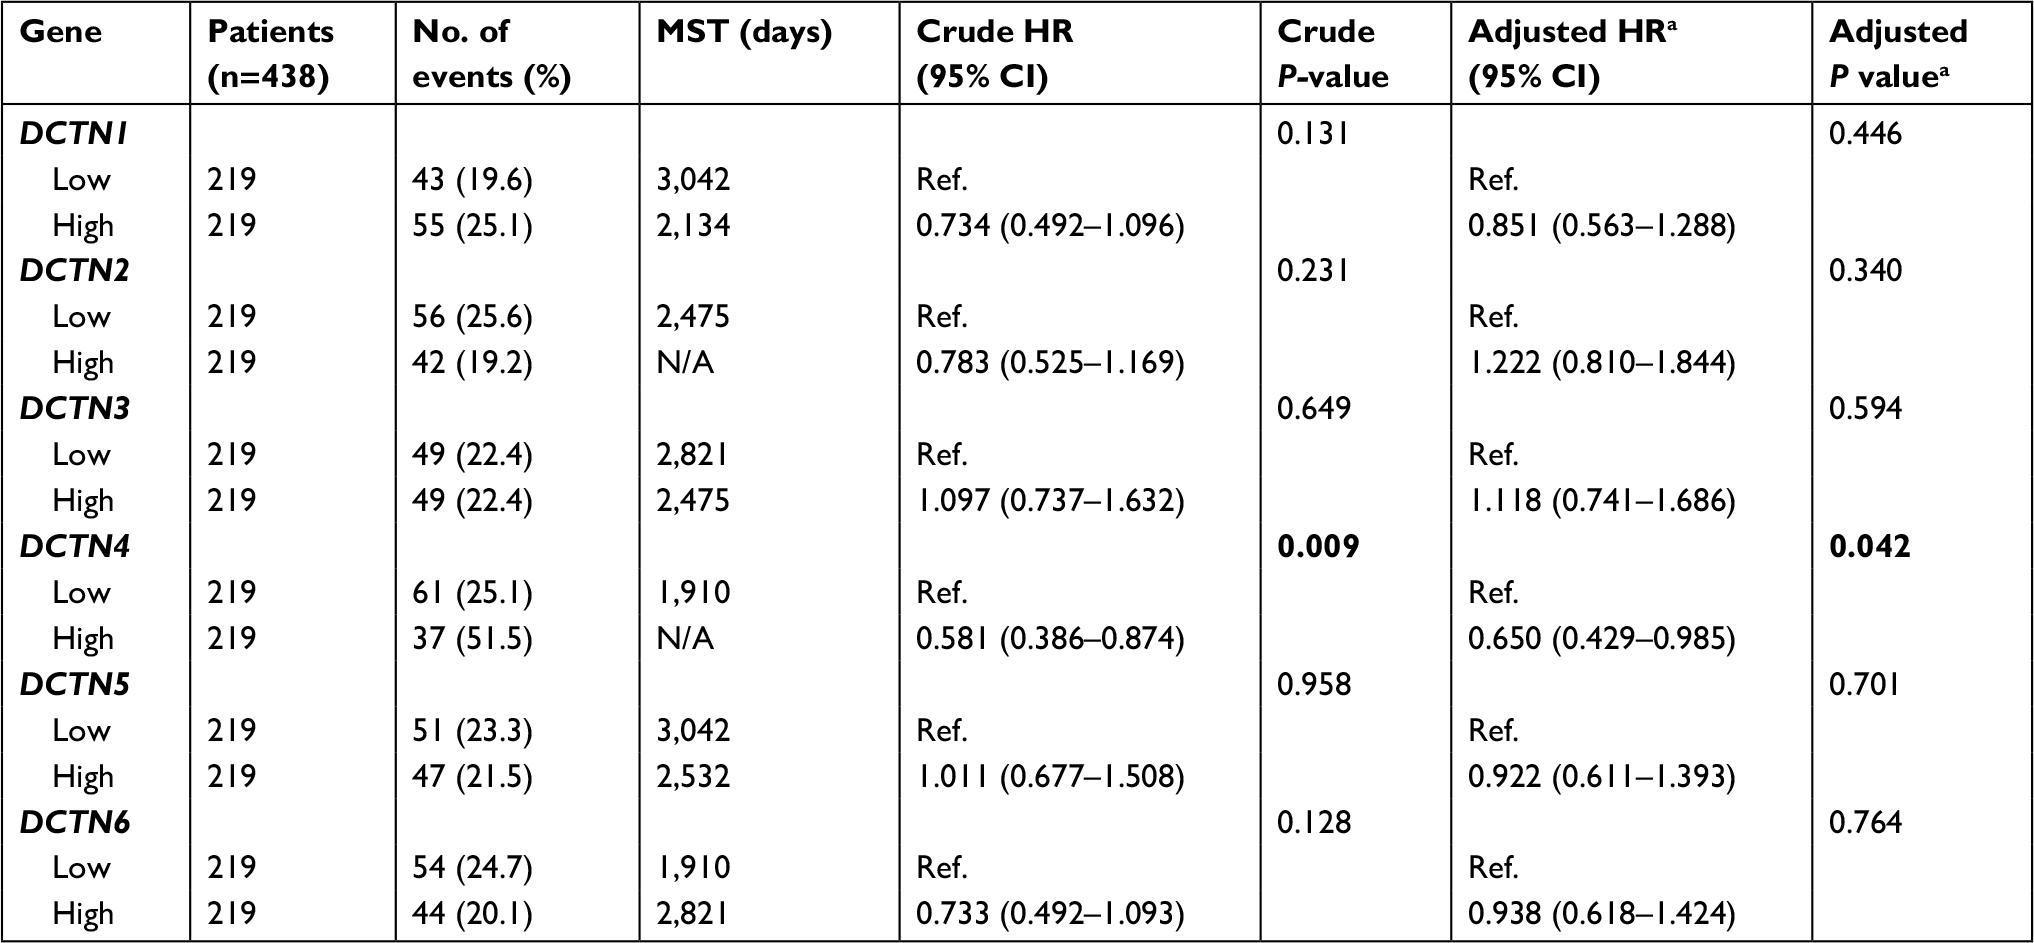 | Table 2 Prognostic survival analysis according to high or low expression of DCTN family genes Notes: aAdjusted for tumor stage. Bold figures indicate statistically significance. Abbreviations: DCTN, dynactin; MST, median survival time. |
The nomogram for scoring risk includes the expression level of DCTN4 and tumor stage to predict results and the 1-, 5-, and 10-year related survival percentage (Figure 6).
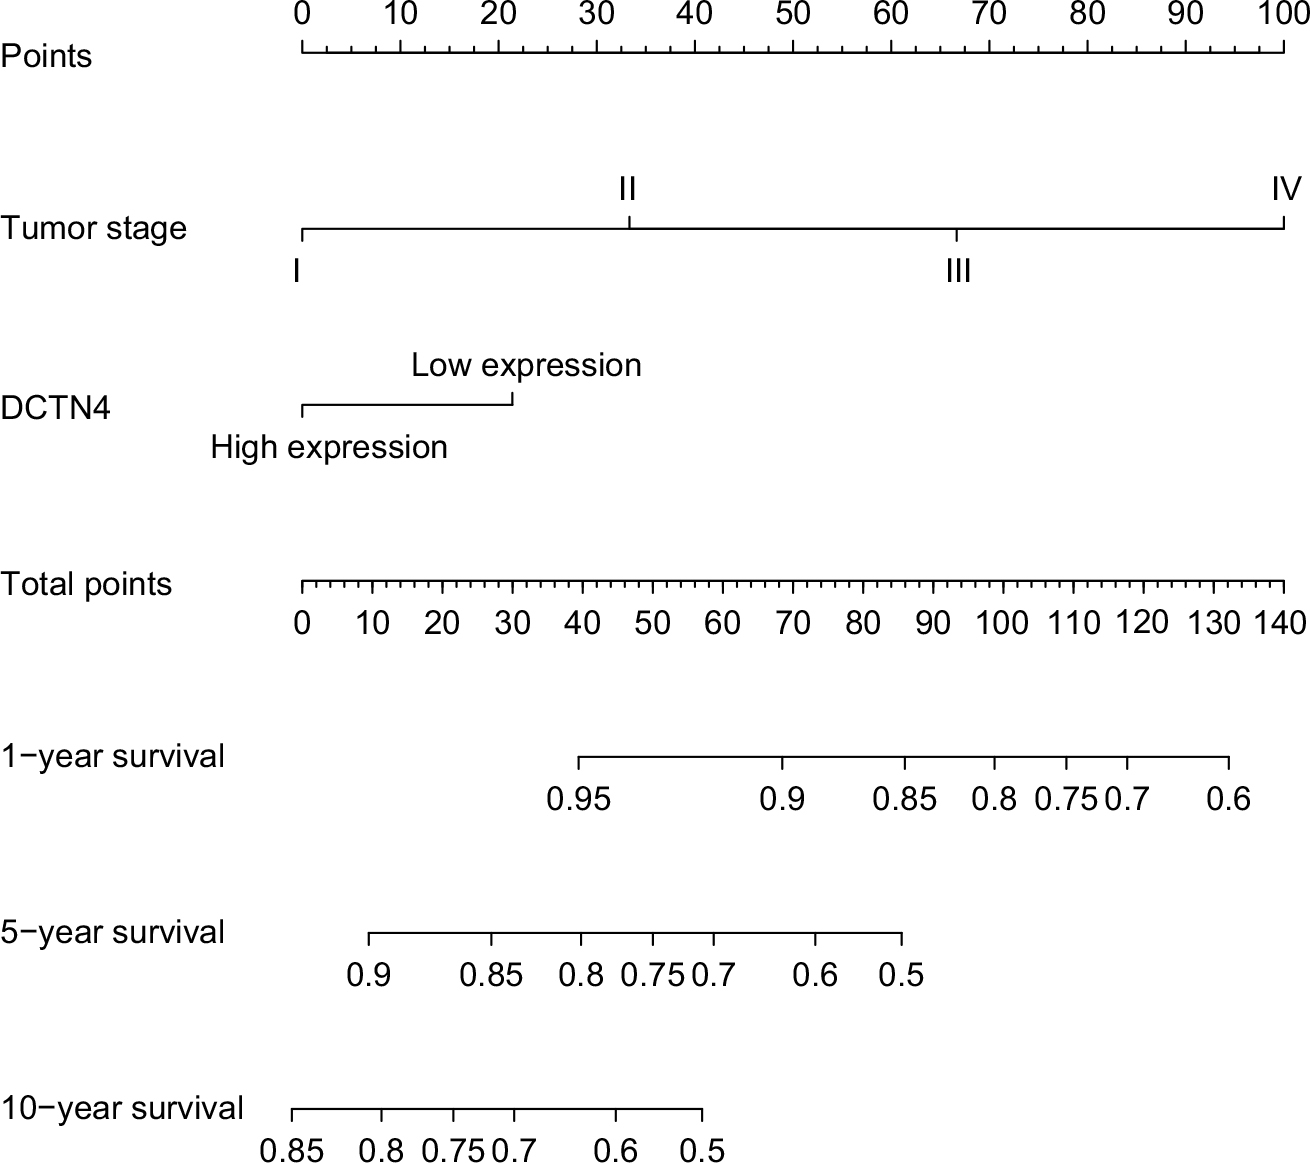 | Figure 6 Nomogram for the relations hip between medical data and risk score. Abbreviation: DCTN, dynactin. |
Function of DCTN4 in COAD
The relative difference in DCTN4 expression level of COAD in TCGA records was assessed by means of GSEA (Figure 7A–I). In the GSEA of KEGG pathways, the expression level of the gene was linked with the cell cycle, cell apoptosis, and the cell metastasis pathway. The GO function enriched examination produced no significant outcomes. The remaining results are presented in Tables S1 and S2.
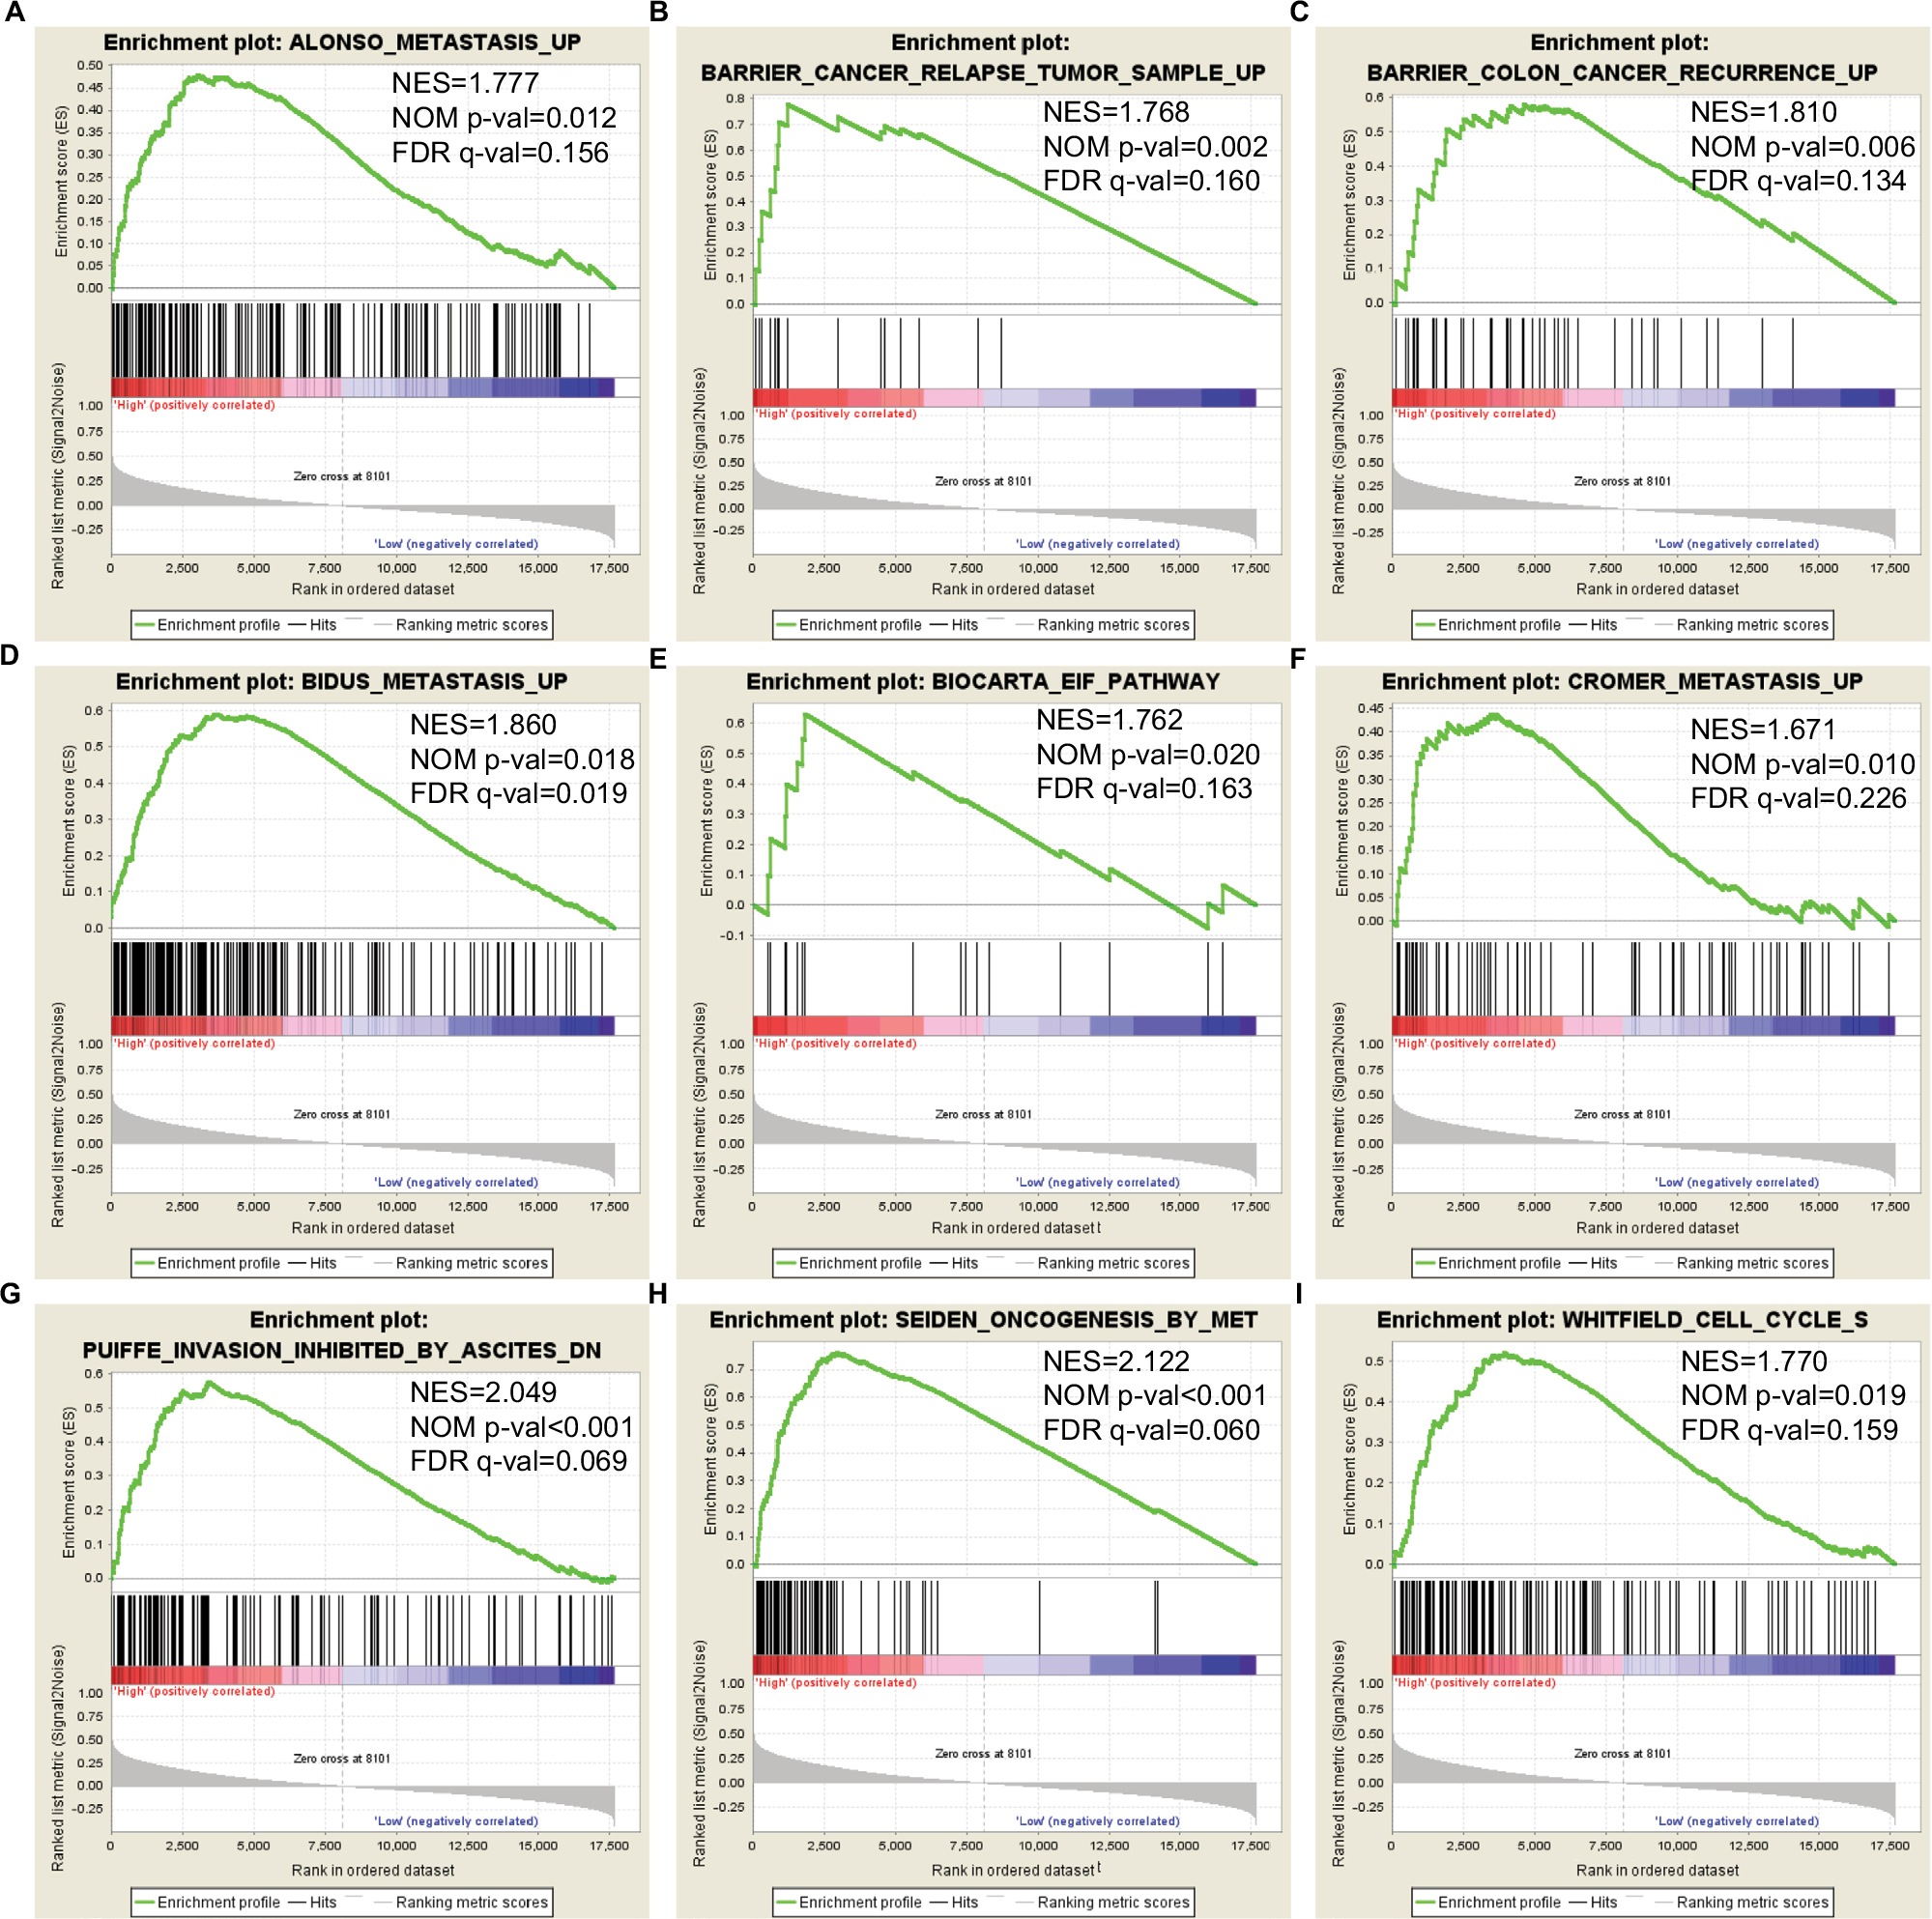 | Figure 7 GSEA outcomes achieved for KEGG pathway analysis for higher and lower levels of expression of DCTN4, using gene set c2. Note: (A) Metastasis; (B) cancer relapse tumor sample; (C) colon cancer recurrence; (D) metastasis; (E) EIF pathway; (F) metastasis; (G) inhibited invasion; (H) oncogenesis; (I) cell cycle S. Abbreviations: DCTN, dynactin; EIF, eukaryotic initiation factor; ES, enrichment score; FDR, false discovery rate; GSEA, Gene Set Enrichment Analysis; KEGG, Kyoto Encyclopedia of Genes and Genomes; NES, normalized enrichment score; NOM, nominal. |
Correlations between DCTN4 and possible survival associated with the COAD gene cohort in TCGA are presented in Figure 8. The outcomes of GO function and KEGG pathway examination performed by DAVID among these genes are presented in Figure 9. The co-functional examination conducted by means of BiNGO among genes associated with DCTN4, based on the results of correlation analysis, and DCTN4 is presented in Figure 10. The items shown in red were consistent with the results of the DAVID examination.
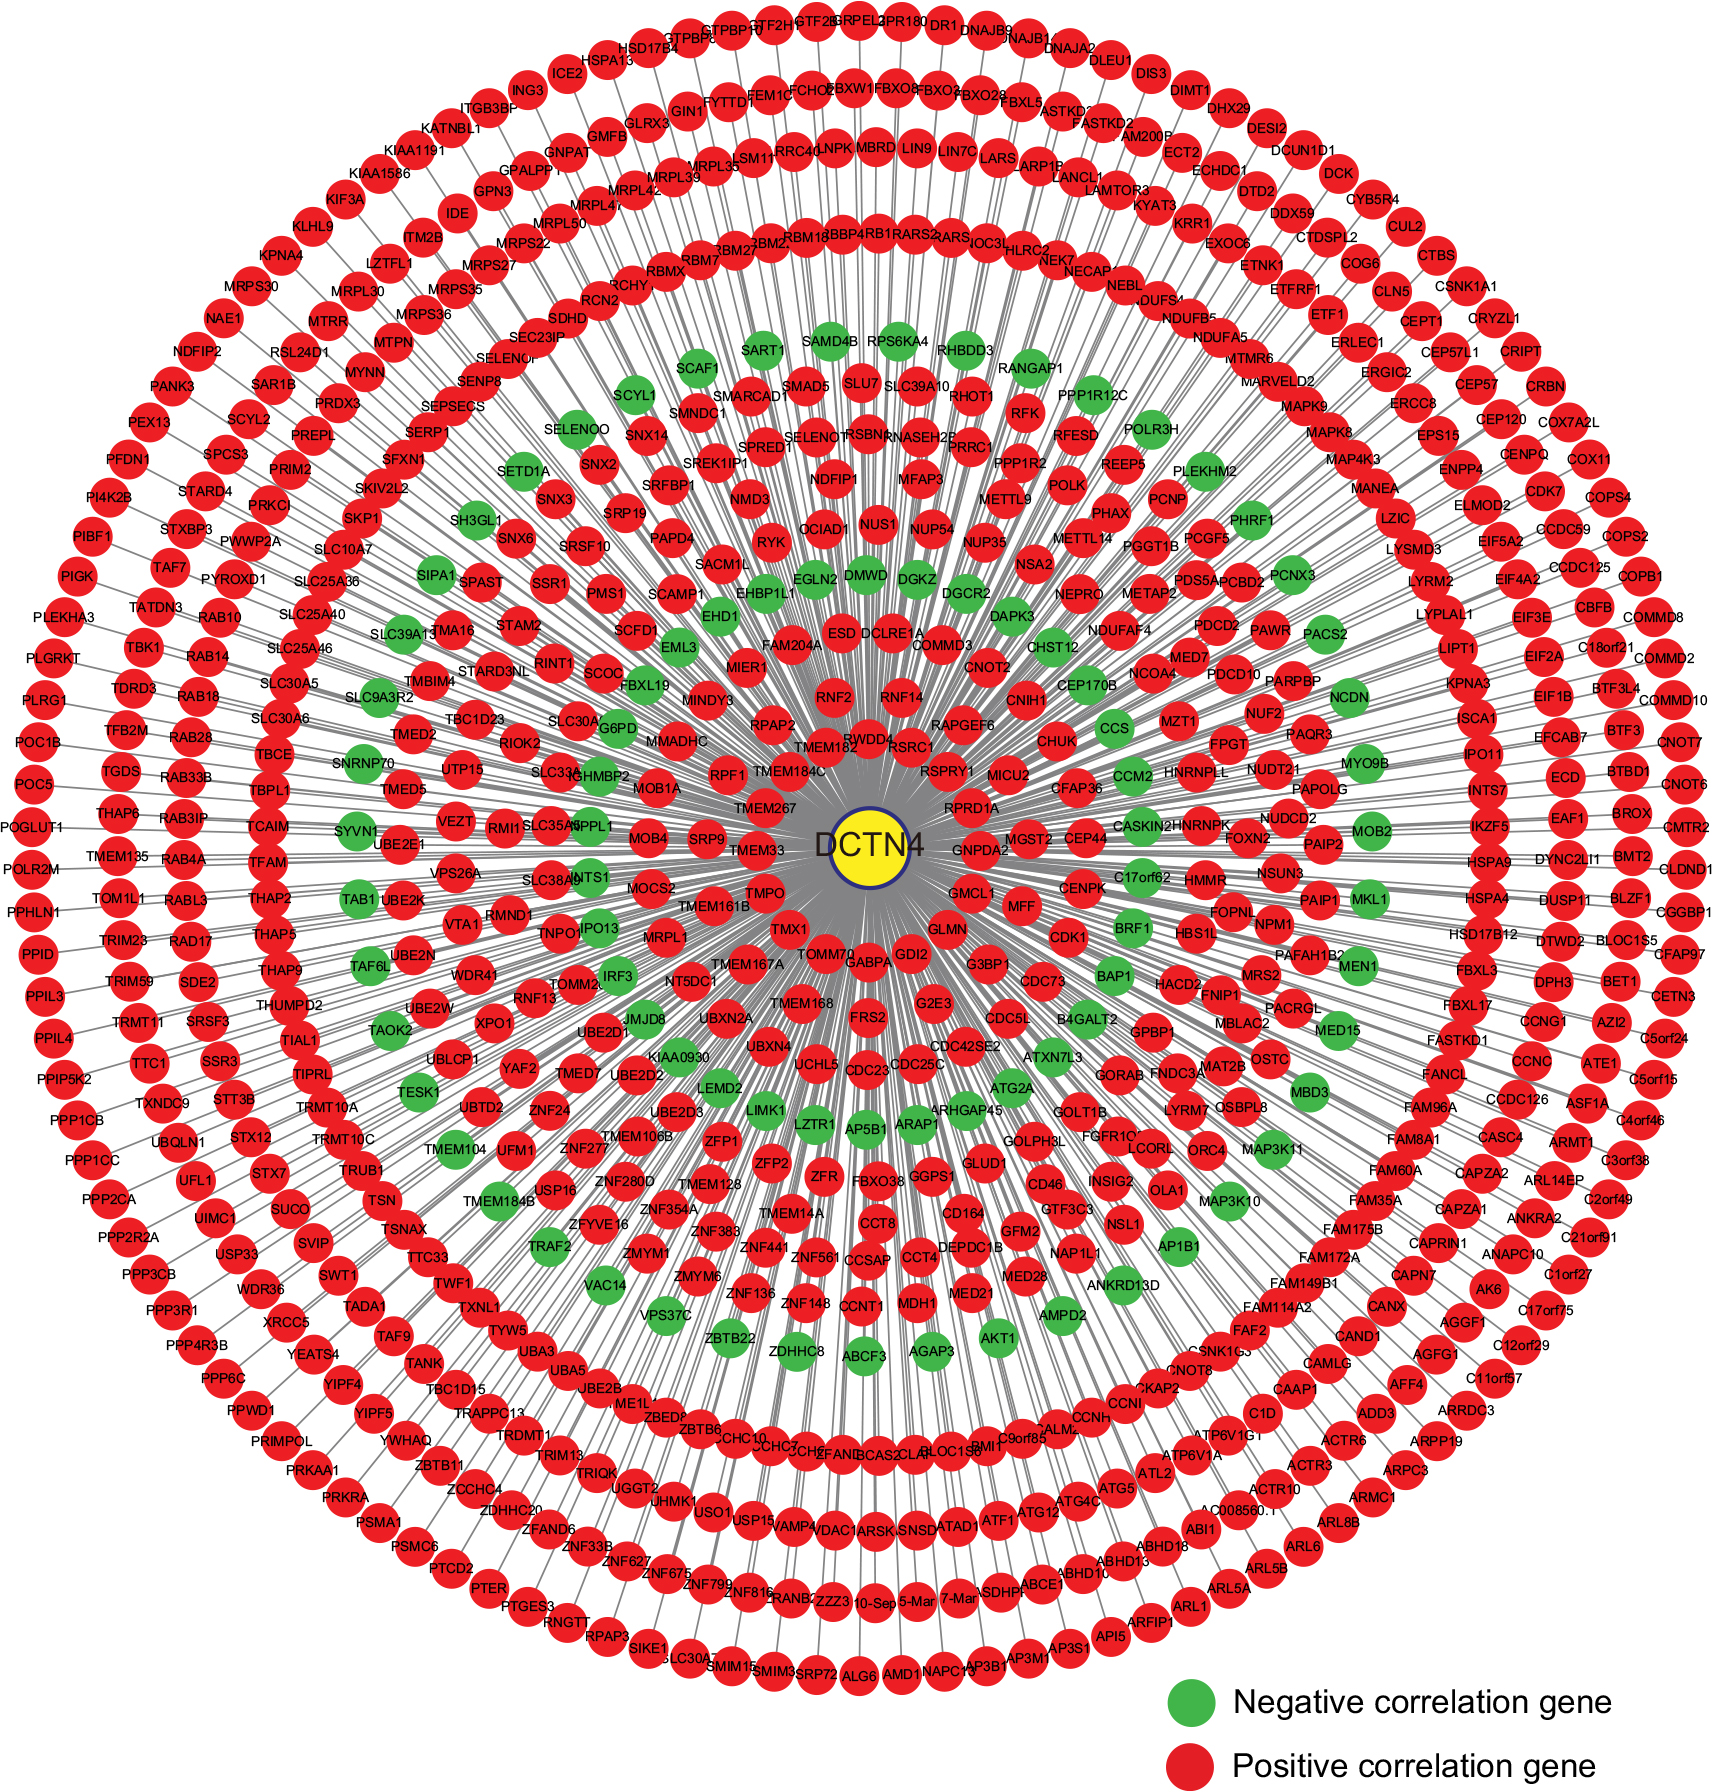 | Figure 8 Pearson’s correlations among DCTN4 and possible associated COAD gene cohort of TCGA. Note: An absolute value of the correlation coefficient >0.4 was considered to be highly correlated. Abbreviations: COAD, colon adenocarcinoma; DCTN, dynactin; TCGA, The Cancer Genome Atlas. |
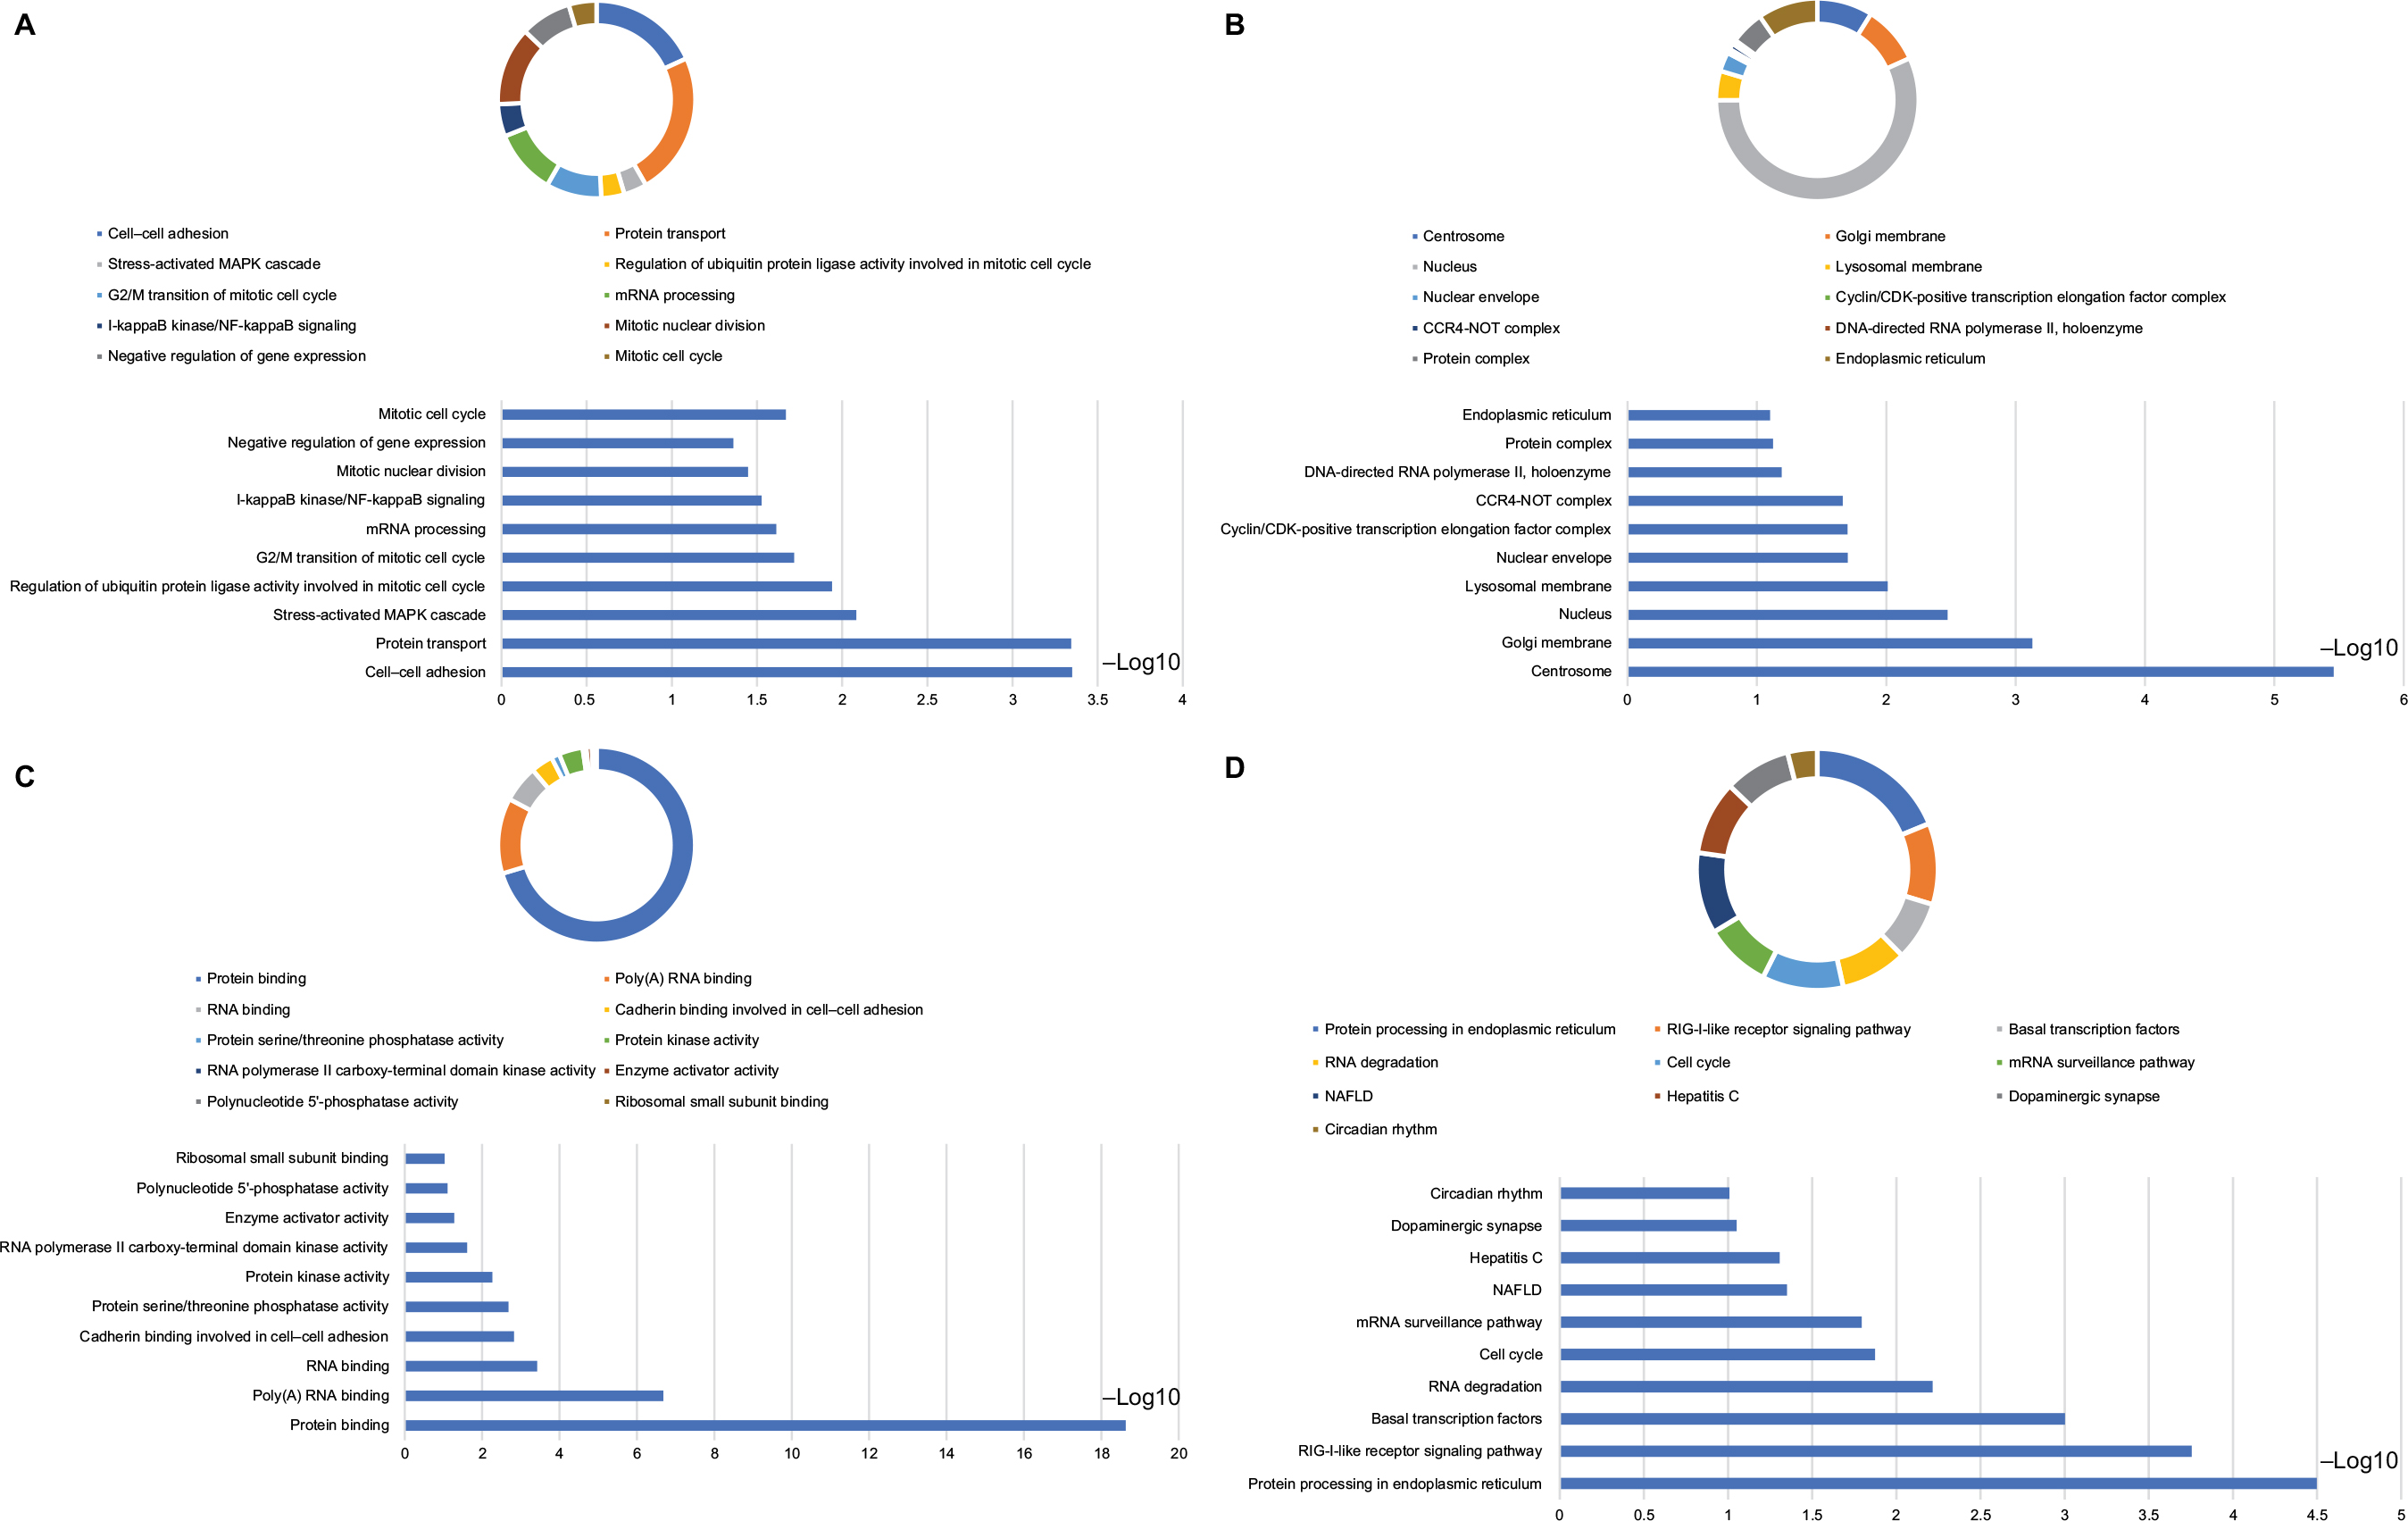 | Figure 9 Analysis of GO terms that are enriched and KEGG pathways for DCTN4 and the linked COAD gene cohort of TCGA obtained using DAVID. Notes: Outcomes of GO analysis of functional enrichment: (A) BP outcomes; (B) CC outcomes; (C) MF outcomes; (D) KEGG outcomes. *P<0.001. Abbreviations: BP, biological process; CC, cellular component; CDK, cyclin-dependent kinase; COAD, colon adenocarcinoma; DAVID, Database for Annotation, Visualization, and Integrated Discovery; DCTN, dynactin; GO, gene ontology; KEGG, Kyoto Encyclopedia of Genes and Genomes; MAPK, mitogen-activated protein kinase; MF, molecular functionality; NAFLD, nonalcoholic fatty liver disease; NF, nuclear factor; RIG-I-like receptor, retinoic acid-inducible gene-I-like receptor; TCGA, The Cancer Genome Atlas. |
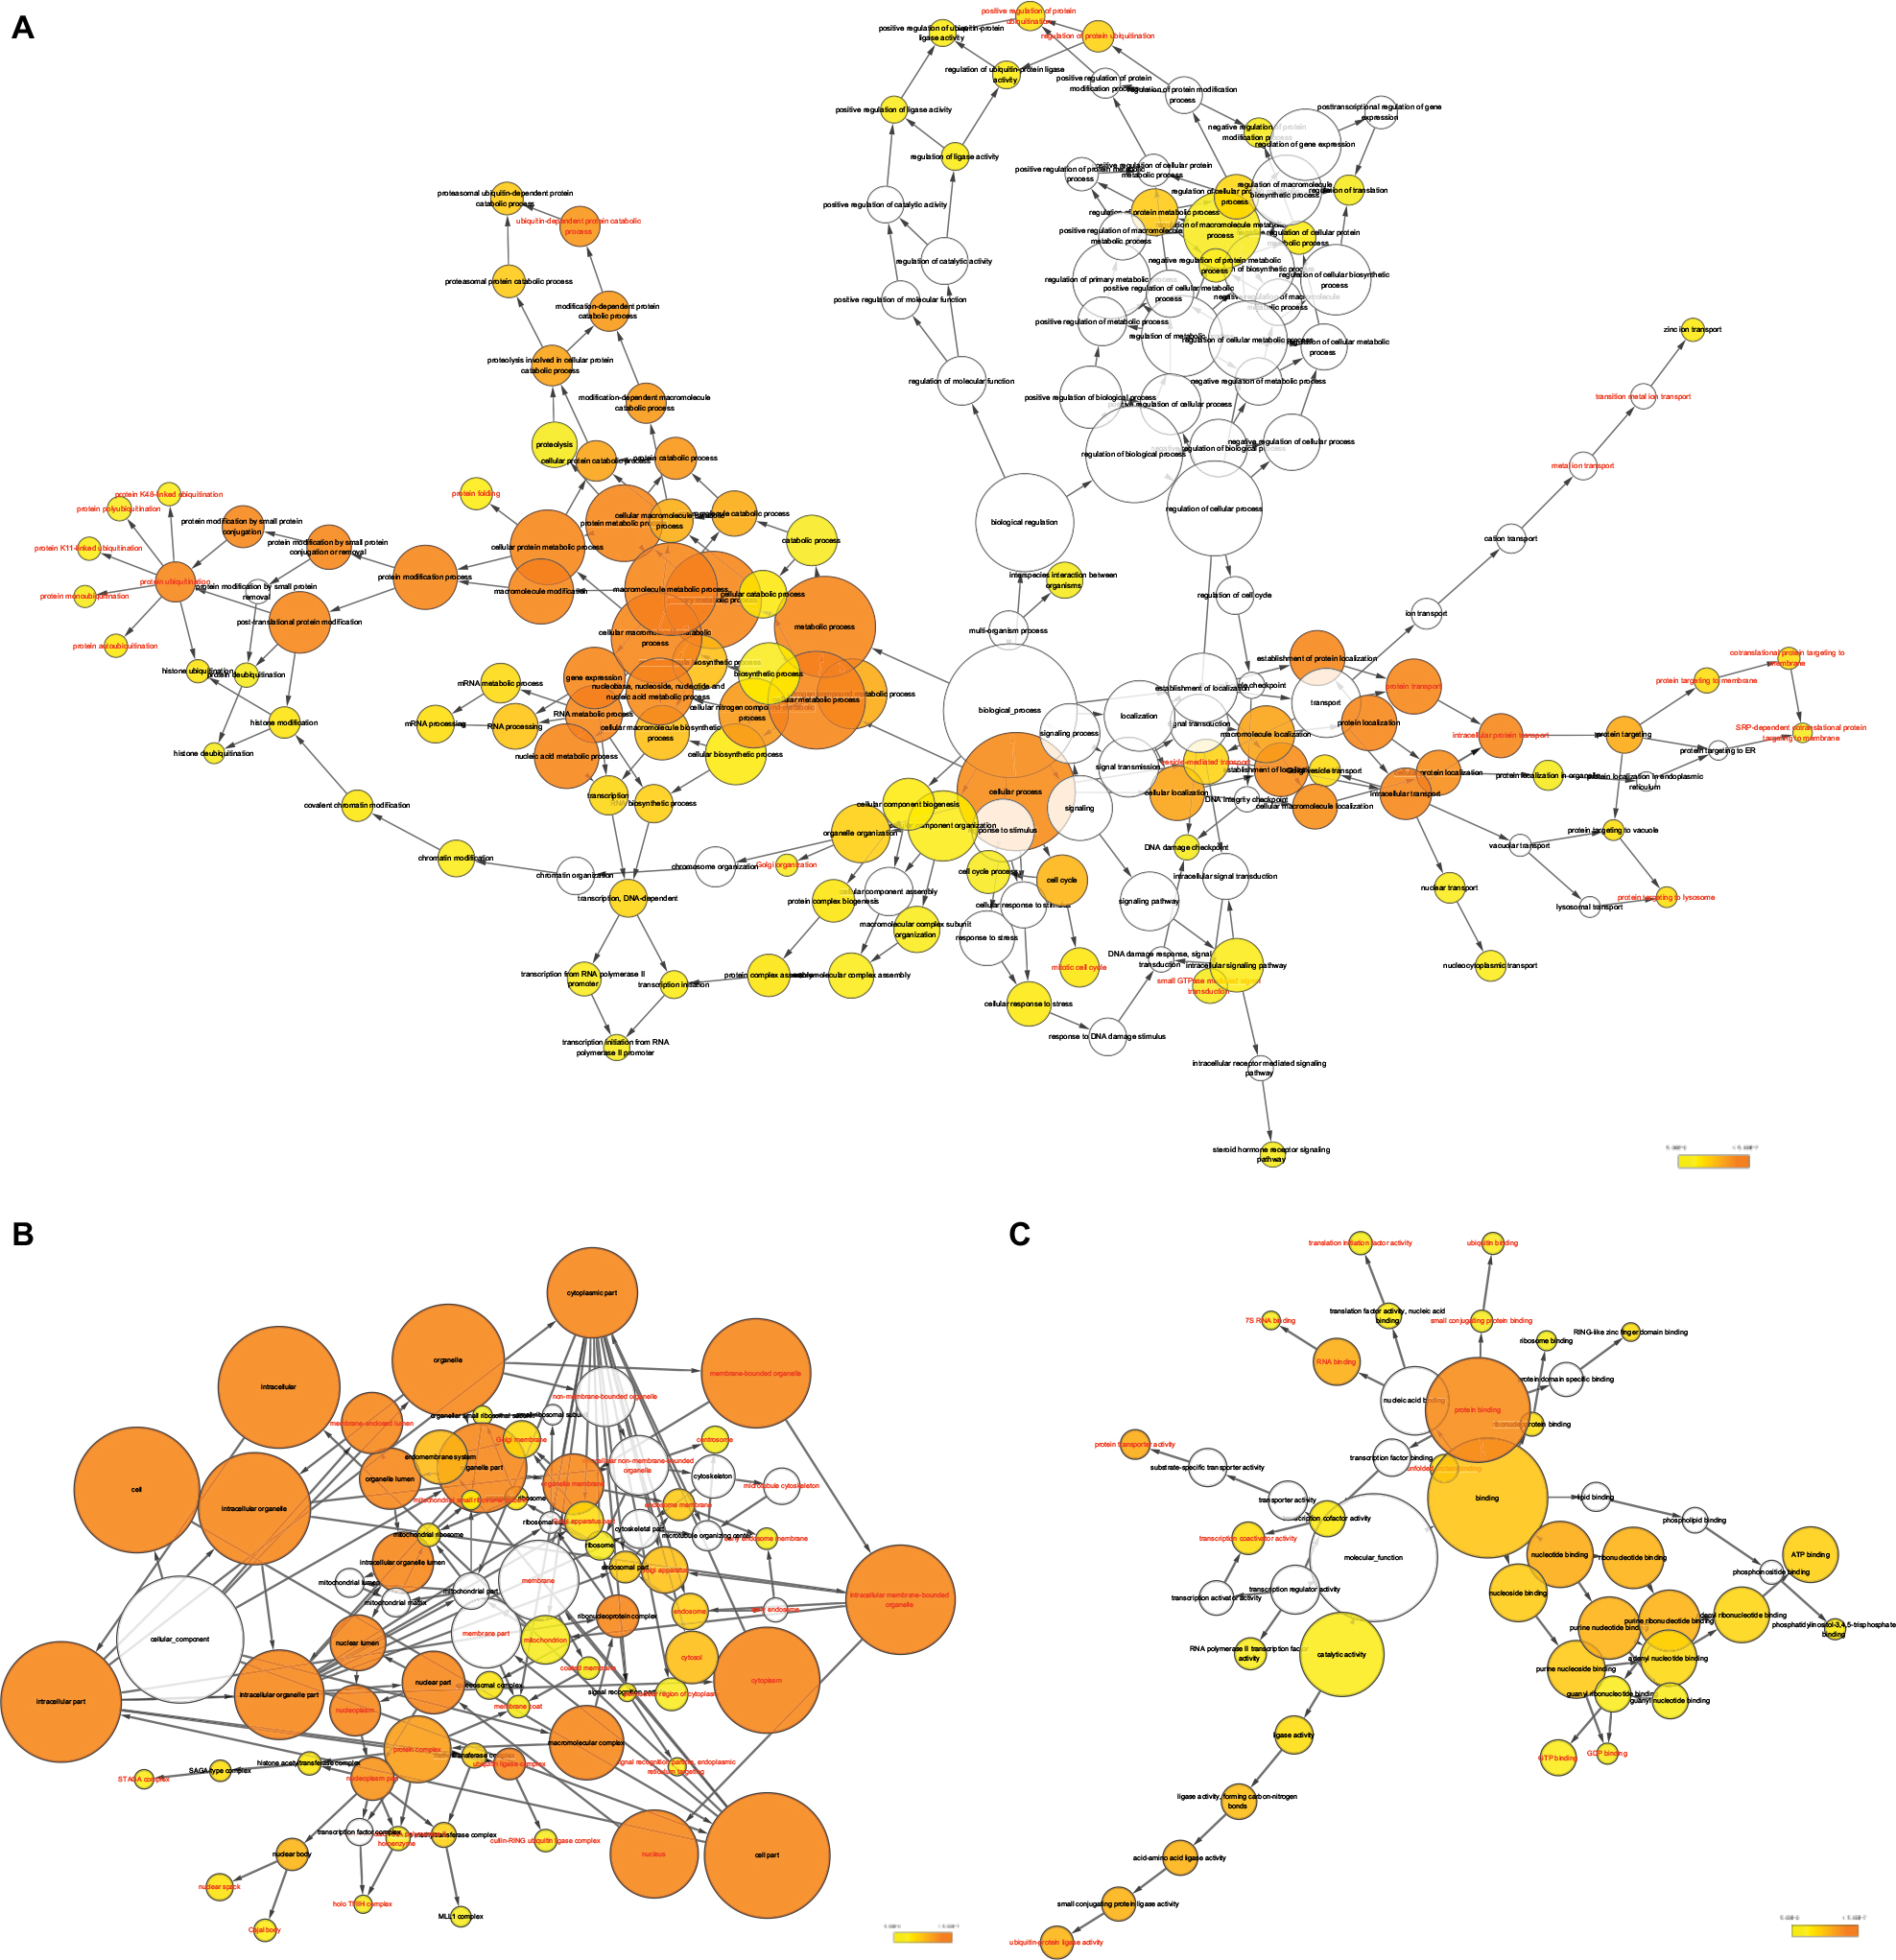 | Figure 10 GO analysis of functional enrichment by BiNGO for all the correlated genes. Note: (A) BP outcomes; (B) CC outcomes; and (C) MF outcomes of GO analysis of functional enrichment by BiNGO. Abbreviations: BiNGO, Biological Networks Gene Ontology; BP, biological process; CC, cellular component; DCTN, dynactin; ER, endoplasmic reticulum; GO, gene ontology; MF, molecular function; MLL, myeloid/lymphoid leukemia; SRP, signal recognition particle; TFIIH, transcription factor II H. |
The results of co-expression examination by GeneMANIA are presented in Figure 11. The integration of protein–protein co-expression examination by STRING is presented in Figure 12. These genes were correlated with cell cycle, protein ubiquitination, protein binding, protein transport, and some cancer-related procedures including nuclear factor-κB (NF-κB) signaling pathways and cellular adhesion.
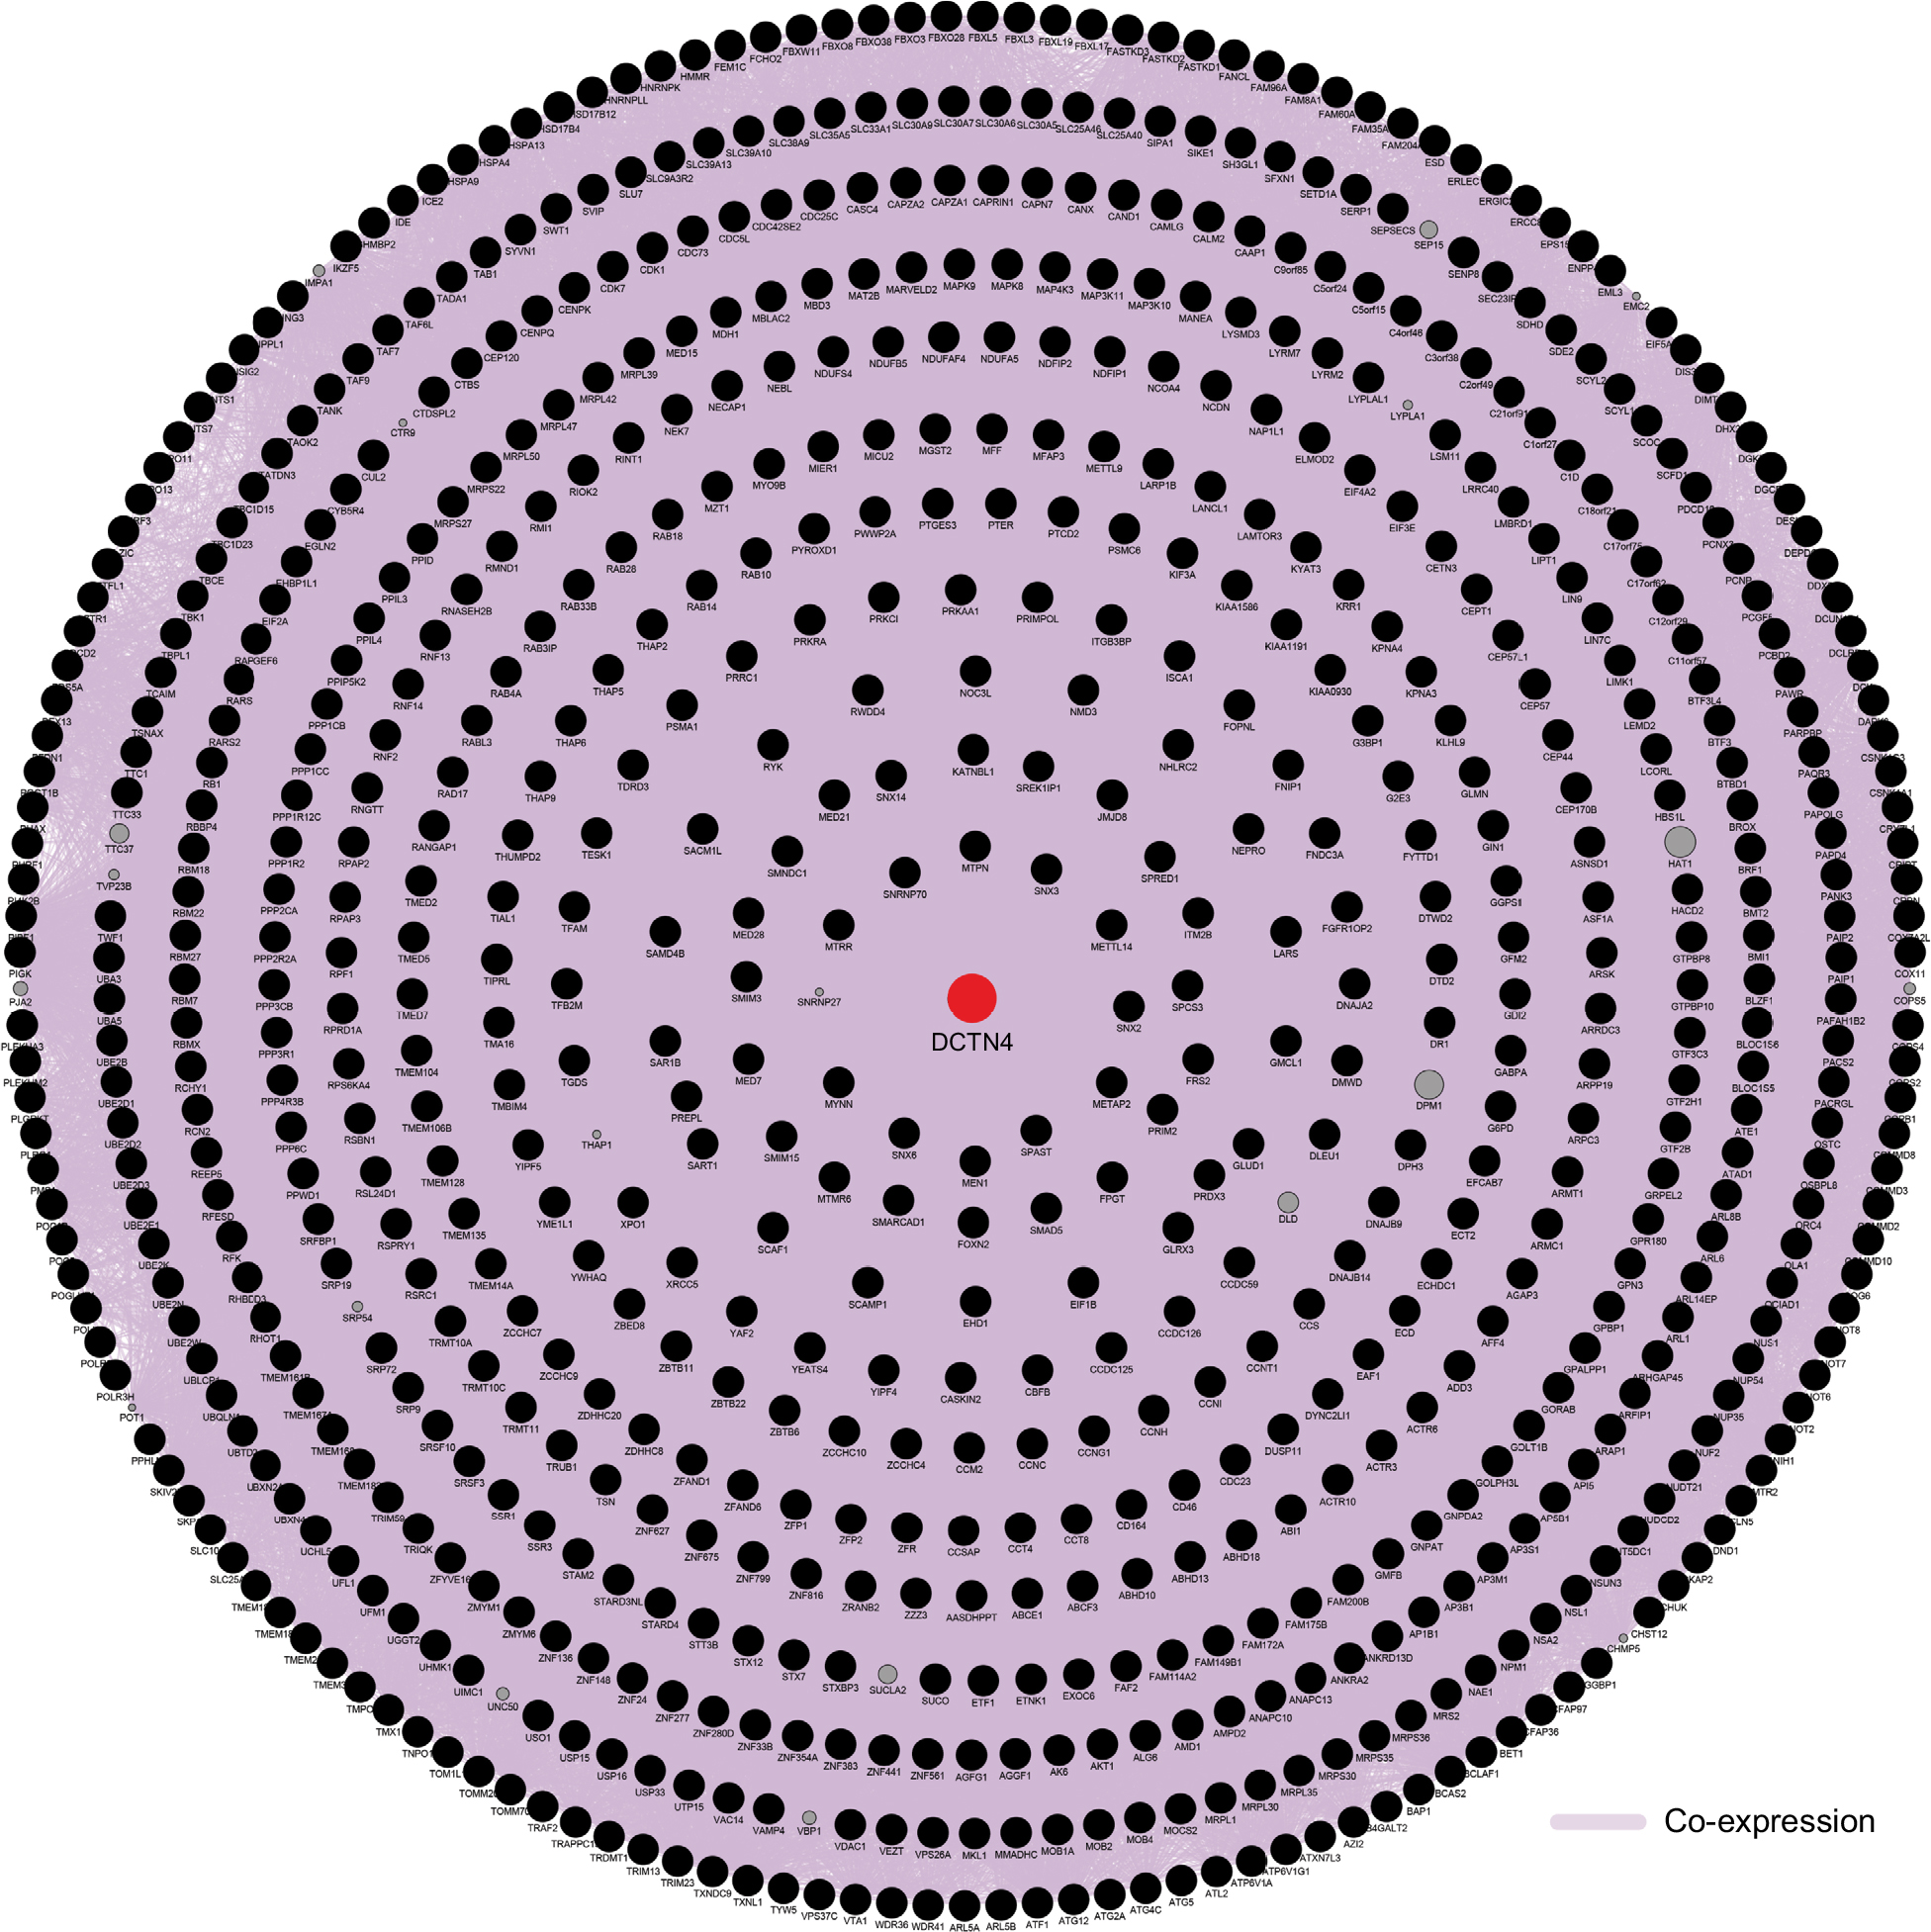 | Figure 11 Gene contact networks between DCTN4 and potential-linked COAD gene cohort of TCGA generated by GeneMANIA. Abbreviations: COAD, colon adenocarcinoma; DCTN, dynactin; GeneMANIA, Gene Multiple Connection Network Integration Algorithm; TCGA, The Cancer Genome Atlas. |
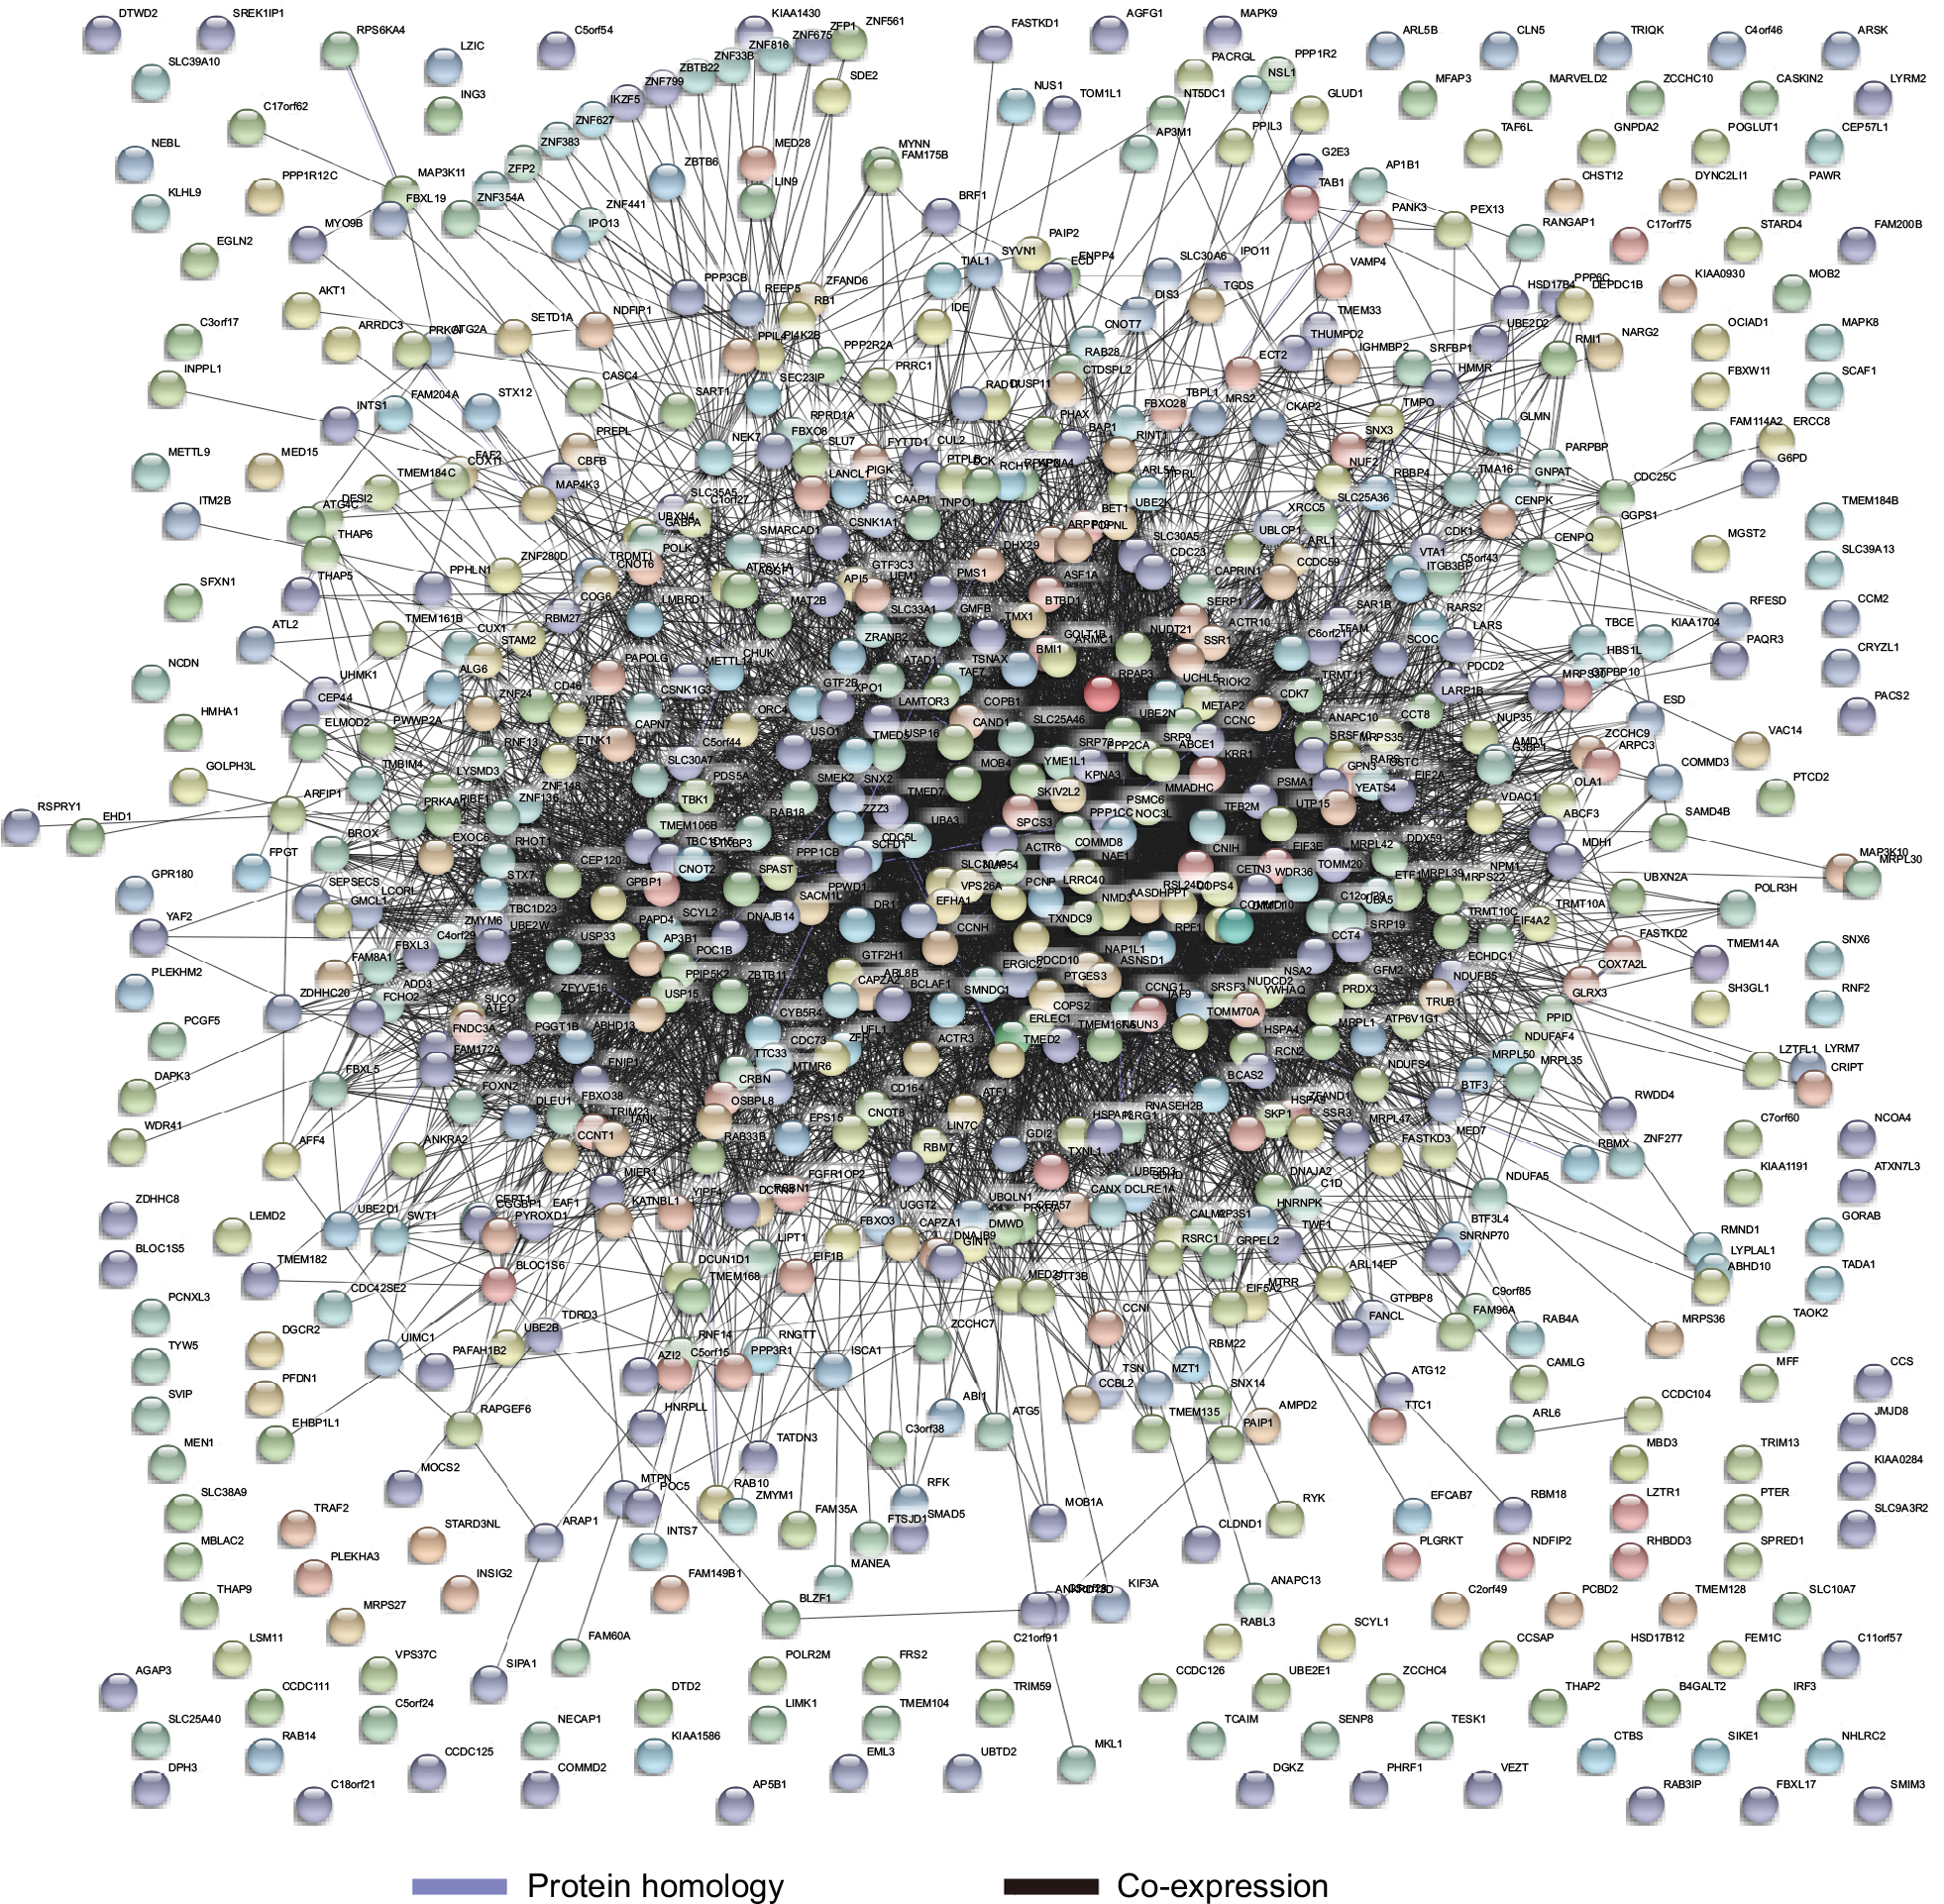 | Figure 12 STRING connections with functional and physical DCTN4 and correlated genes. Abbreviations: DCTN, dynactin; STRING, The Search Tool for the Retrieval of Interacting Genes/Proteins. |
Discussion
In the current study, we investigated the prognostic and diagnostic values of the DCTN gene family based on the TCGA database. Higher expression of DCTN4 was found to be correlated with favorable OS in COAD, and the expression levels of DCTN1, DCTN2, and DCTM4 may be used to predict the occurrence of colon cancer. In addition, we investigated the GO function analysis, KEGG pathway, and protein–protein relationships among DCTN4 and correlated genes to predict the function of DCTN4.
Dynactin is a multiple-subunit protein compound involved in the activation of most forms of cytoplasmic dynein in eukaryotes.8 Dynactin connects to cytoplasmic dynein, dynein cargo adaptors, and microtubules.9 The existence of six subunits of dynactin, DCTN1, DCTN2, DCTN3, DCTN4, DCTN5, and DCTN6, has been verified, and all of them are encoded through their corresponding genes. DCTN1 is considered the largest subunit of dynactin,23 and DCTN1 has been implicated in many neurodegenerative diseases.10–12 DCTN2 connects with DCTN1 and DCTN3 to form a complex subunit.23 DCTN4 was found to be associated with Wilson’s disease24 and chronic Pseudomonas aeruginosa infection.25
In addition to its dynactin functions,8,26 the DCTN gene family plays a crucial role in many cancers. Some research on this subject has been published. Our previous research found that DCTN1, DCTN2, and DCTN5 were upregulated in cutaneous melanoma, while DCTN6 was downregulated and linked with favorable OS.27 DCTN1 has been observed to be associated with multiple cancers or cancer cell lines,28 including lung cancer29 and Spitz tumors.30 DCTN2 was observed to be over expressed in SJSA-1 osteosarcoma cells.31 Nevertheless, the correlation between DCTN4 and cancer was not stated. Here, we have employed statistics from TCGA on expression and medical data in COAD to investigate correlations between DCTN gene family expression levels and prognosis and to identify biomarkers that can be used for prognosis and diagnosis in patients with COAD.
We observed that DCTN4 had a positive correlation with several pathways as follows. The eukaryotic initiation factor (EIF) pathway was correlated with cell apoptosis,32,33 necroptosis,34,35 cellular senescence,36 proteoglycans in cancer,37 and choline metabolism in cancer.38,39 The cell cycle phase was observed to be associated with the tumor owing to stability of the genome and uncontrolled cellular growth process. Nevertheless, the detailed mechanisms of molecules that link dysfunctionality in such pathways to the beginning of specific tumors are not stated in the majority of cases.40 In our functional assessment performed by GO and KEGG, we observed that the function of DCTN4 was significantly enriched in multiple cell cycle processes, including cell cycle S phase and G2/M change in the mitotic cell cycle. DCTN4 and correlated genes were found to be linked with NF-κB signaling, which played a crucial role in initiating human cancer, cancer progression, metastasis, and resistance.41–43 Cell–cell adhesion, as found on BP examination, is an essential cellular process and may result in cancer.44,45 All the results discussed herein were essential aspects in the process of occurrence, progression, and prognosis in COAD.
The functionality of the DCTN4 subunit is yet not clear, although its nonappearance does not have a significant impact on the stabilization of dysfunction.46 In colon tumors, dysfunction of several factors may have an impact on the Wnt signaling pathway, which increases the signaling performance.47,48 Our KEGG analysis showed that a higher expression level of DCTN4 was correlated with cell metastasis, together with cancer relapse and the cell cycle, which may be a part of the pathway associated with cancer occurrence. Particularly in the colon tumor recurrence pathway, DCTN4 may be an indispensable factor in patients with COAD.
In the present research, we observed that only a higher expression level of DCTN4 was correlated with favorable OS, out of all the DCTN family mRNA expression levels. We also constructed a nomogram, showing that the contribution of tumor stage was increased with advancing stage, and a higher expression level of DCTN4 had a lower influence on time-related survival percentage. Comparing these two possible factors associated with risk, the role of tumor stage was much greater than that of DCTN4 expression. By applying this model, we could forecast the time-related survival percentage. The 1-, 5-, and 10-year survival rates were much better for patients with lower total points than for those with higher total points.
A number of traditional biomarkers have been used to try to detect the frequency of COAD, including metastasis-associated in colon cancer-1 (MACC1)49 and adenomatous polyposis coli (APC).50 In the present research, the ROC curves indicated that the expression levels of DCTN1, DCTN2, and DCTN4 can be used to distinguish adjacent normal tissues from colon tumor-bearing tissues.
This research has several limitations. First, further study with a larger sample size is necessary to improve the consistency of our results. Second, more clinical information will be needed in further studies, such as smoking and alcohol history, hereditary non-polyposis CRC, size of the primary tumor, radical resection position, family history, body mass index, and pathological diagnosis. Third, the relevant patient data were extracted from one source; thus, the results need further validation for use in other groups.
Despite these limitations, this is the first study to show that upregulated DCTN4 in COAD is correlated with a satisfactory prognosis. This gene may be applied as a biomarker for prognosis in COAD patients. In addition, expression of DCTN1, DCTN2, and DCTN4 can be employed as prognostic biomarkers in patients with COAD.
Conclusion
The present research found that expression of DCTN1, DCTN2, and DCTN4 was downregulated among COAD tumor and paracancerous tissue and may have possible diagnostic value for COAD. We also observed that a higher level of DCTN4 expression was significantly correlated with a favorable prognosis for patients with COAD and could serve as a prognostic biomarker for patients with COAD. In the current research work, we also examined the possible mechanism of DCTN4 in COAD OS by means of GSEA and genome-wide co-expression examination and established a nomogram composed of DCTN4 and tumor stage in a bid to predict OS in COAD. Nevertheless, all of these outcomes require validation in future research.
Acknowledgment
The researchers acknowledge the contribution of TCGA (https://cancergenome.nih.gov/) and the UCSC Xena (http://xena.ucsc.edu/) database for sharing the COAD data with open access.
Disclosure
The authors report no conflicts of interest in this work.
References
Siegel RL, Miller KD, Fedewa SA, et al. Colorectal cancer statistics, 2017. CA Cancer J Clin. 2017;67(3):177–193. | ||
Siegel RL, Miller KD, Jemal A. Cancer statistics, 2018. CA Cancer J Clin. 2018;68(1):7–30. | ||
Watson AJ, Collins PD. Colon cancer: a civilization disorder. Dig Dis. 2011;29(2):222–228. | ||
Cunningham D, Atkin W, Lenz HJ, et al. Colorectal cancer. Lancet. 2010;375(9719):1030–1047. | ||
Kuipers EJ, Grady WM, Lieberman D, et al. Colorectal cancer. Nat Rev Dis Primers. 2015;1:15065. | ||
Church TR, Wandell M, Lofton-Day C, et al; PRESEPT Clinical Study Steering Committee, Investigators and Study Team. Prospective evaluation of methylated SEPT9 in plasma for detection of asymptomatic colorectal cancer. Gut. 2014;63(2):317–325. | ||
Grützmann R, Molnar B, Pilarsky C, et al. Sensitive detection of colorectal cancer in peripheral blood by septin 9 DNA methylation assay. PLoS One. 2008;3(11):e3759. | ||
Schroer TA. Dynactin. Annu Rev Cell Dev Biol. 2004;20:759–779. | ||
Cianfrocco MA, DeSantis ME, Leschziner AE, Reck-Peterson SL. Mechanism and regulation of cytoplasmic dynein. Annu Rev Cell Dev Biol. 2015;31:83–108. | ||
Heiman-Patterson TD, Blankenhorn EP, Sher RB, et al. Genetic background effects on disease onset and lifespan of the mutant dynactin p150Glued mouse model of motor neuron disease. PLoS One. 2015;10(3):e0117848. | ||
Steele JC, Guella I, Szu-Tu C, et al. Defining neurodegeneration on Guam by targeted genomic sequencing. Ann Neurol. 2015;77(3):458–468. | ||
Dierick I, Baets J, Irobi J, et al. Relative contribution of mutations in genes for autosomal dominant distal hereditary motor neuropathies: a genotype-phenotype correlation study. Brain. 2008;131(Pt 5):1217–1227. | ||
Carithers LJ, Ardlie K, Barcus M, et al. A Novel Approach to High-Quality Postmortem Tissue Procurement: The GTEx Project. Biopreserv Biobank. 2015;13(5):311–319. | ||
Huang da W, Sherman BT, Lempicki RA. Bioinformatics enrichment tools: paths toward the comprehensive functional analysis of large gene lists. Nucleic Acids Res. 2009;37(1):1–13. | ||
Huang da W, Sherman BT, Lempicki RA. Systematic and integrative analysis of large gene lists using DAVID bioinformatics resources. Nat Protoc. 2009;4(1):44–57. | ||
Maere S, Heymans K, Kuiper M. BiNGO: a Cytoscape plugin to assess overrepresentation of gene ontology categories in biological networks. Bioinformatics. 2005;21(16):3448–3449. | ||
Warde-Farley D, Donaldson SL, Comes O, et al. The GeneMANIA prediction server: biological network integration for gene prioritization and predicting gene function. Nucleic Acids Res. 2010;38(Web Server issue):W214–W220. | ||
Szklarczyk D, Franceschini A, Wyder S, et al. STRING v10: protein-protein interaction networks, integrated over the tree of life. Nucleic Acids Res. 2015;43(Database issue):D447–D452. | ||
Shaul YD, Yuan B, Thiru P, et al. MERAV: a tool for comparing gene expression across human tissues and cell types. Nucleic Acids Res. 2016;44(D1):D560–D566. | ||
Balachandran VP, Gonen M, Smith JJ, DeMatteo RP. Nomograms in oncology: more than meets the eye. Lancet Oncol. 2015;16(4):e173–e180. | ||
Subramanian A, Tamayo P, Mootha VK, et al. Gene set enrichment analysis: a knowledge-based approach for interpreting genome-wide expression profiles. Proc Natl Acad Sci U S A. 2005;102(43):15545–15550. | ||
Shannon P, Markiel A, Ozier O, et al. Cytoscape: a software environment for integrated models of biomolecular interaction networks. Genome Res. 2003;13(11):2498–2504. | ||
Urnavicius L, Zhang K, Diamant AG, et al. The structure of the dynactin complex and its interaction with dynein. Science. 2015;347(6229):1441–1446. | ||
Lim CM, Cater MA, Mercer JF, La Fontaine S. Copper-dependent interaction of dynactin subunit p62 with the N terminus of ATP7B but not ATP7A. J Biol Chem. 2006;281(20):14006–14014. | ||
Emond MJ, Louie T, Emerson J, et al; National Heart, Lung, and Blood Institute (NHLBI) GO Exome Sequencing Project. Exome sequencing of extreme phenotypes identifies DCTN4 as a modifier of chronic Pseudomonas aeruginosa infection in cystic fibrosis. Nat Genet. 2012;44(8):886–889. | ||
Schroer TA, Sheetz MP. Two activators of microtubule-based vesicle transport. J Cell Biol. 1991;115(5):1309–1318. | ||
Wang Q, Wang X, Liang Q, et al. Prognostic Value of Dynactin mRNA Expression in Cutaneous Melanoma. Med Sci Monit. 2018;24:3752–3763. | ||
Packham S, Warsito D, Lin Y, et al. Nuclear translocation of IGF-1R via p150(Glued) and an importin-β/RanBP2-dependent pathway in cancer cells. Oncogene. 2015;34(17):2227–2238. | ||
Iyevleva AG, Raskin GA, Tiurin VI, et al. Novel ALK fusion partners in lung cancer. Cancer Lett. 2015;362(1):116–121. | ||
Busam KJ, Kutzner H, Cerroni L, Wiesner T. Clinical and pathologic findings of Spitz nevi and atypical Spitz tumors with ALK fusions. Am J Surg Pathol. 2014;38(7):925–933. | ||
Bransfield KL, Askham JM, Leek JP, Robinson PA, Mighell AJ. Phenotypic changes associated with DYNACTIN-2 (DCTN2) over expression characterise SJSA-1 osteosarcoma cells. Mol Carcinog. 2006;45(3):157–163. | ||
Savitskaya MA, Onishchenko GE. Mechanisms of Apoptosis. Biochemistry (Mosc). 2015;80(11):1393–1405. | ||
Orrenius S, Zhivotovsky B, Nicotera P. Regulation of cell death: the calcium-apoptosis link. Nat Rev Mol Cell Biol. 2003;4(7):552–565. | ||
Brenner D, Blaser H, Mak TW. Regulation of tumour necrosis factor signalling: live or let die. Nat Rev Immunol. 2015;15(6):362–374. | ||
Vanden Berghe T, Linkermann A, Jouan-Lanhouet S, Walczak H, Vandenabeele P. Regulated necrosis: the expanding network of non-apoptotic cell death pathways. Nat Rev Mol Cell Biol. 2014;15(2):135–147. | ||
Di Mitri D, Alimonti A. Non-Cell-Autonomous Regulation of Cellular Senescence in Cancer. Trends Cell Biol. 2016;26(3):215–226. | ||
Bourguignon LY. Hyaluronan-mediated CD44 activation of RhoGTPase signaling and cytoskeleton function promotes tumor progression. Semin Cancer Biol. 2008;18(4):251–259. | ||
Glunde K, Bhujwalla ZM, Ronen SM. Choline metabolism in malignant transformation. Nat Rev Cancer. 2011;11(12):835–848. | ||
Ridgway ND. The role of phosphatidylcholine and choline metabolites to cell proliferation and survival. Crit Rev Biochem Mol Biol. 2013;48(1):20–38. | ||
Kastan MB, Bartek J. Cell-cycle checkpoints and cancer. Nature. 2004;432(7015):316–323. | ||
Xia Y, Shen S, Verma IM. NF-κB, an active player in human cancers. Cancer Immunol Res. 2014;2(9):823–830. | ||
Chaturvedi MM, Sung B, Yadav VR, Kannappan R, Aggarwal BB. NF-κB addiction and its role in cancer: ‘one size does not fit all’. Oncogene. 2011;30(14):1615–1630. | ||
Wang F, Ma J, Wang KS, Mi C, Lee JJ, Jin X. Blockade of TNF-α-induced NF-κB signaling pathway and anti-cancer therapeutic response of dihydrotanshinone I. Int Immunopharmacol. 2015;28(1):764–772. | ||
Okegawa T, Pong RC, Li Y, Hsieh JT. The role of cell adhesion molecule in cancer progression and its application in cancer therapy. Acta Biochim Pol. 2004;51(2):445–457. | ||
Hirohashi S, Kanai Y. Cell adhesion system and human cancer morphogenesis. Cancer Sci. 2003;94(7):575–581. | ||
Lee IH, Kumar S, Plamann M. Null mutants of the neurospora actin-related protein 1 pointed-end complex show distinct phenotypes. Mol Biol Cell. 2001;12(7):2195–2206. | ||
Ionov Y, Peinado MA, Malkhosyan S, Shibata D, Perucho M. Ubiquitous somatic mutations in simple repeated sequences reveal a new mechanism for colonic carcinogenesis. Nature. 1993;363(6429):558–561. | ||
Abdul Khalek FJ, Gallicano GI, Mishra L. Colon cancer stem cells. Gastrointest Cancer Res. 2010 (Suppl 1):S16–S23. | ||
Stein U, Walther W, Arlt F, et al. MACC1, a newly identified key regulator of HGF-MET signaling, predicts colon cancer metastasis. Nat Med. 2009;15(1):59–67. | ||
Markowitz SD, Bertagnolli MM. Molecular origins of cancer: Molecular basis of colorectal cancer. N Engl J Med. 2009;361(25):2449–2460. |
 © 2018 The Author(s). This work is published and licensed by Dove Medical Press Limited. The
full terms of this license are available at https://www.dovepress.com/terms
and incorporate the Creative Commons Attribution
- Non Commercial (unported, 3.0) License.
By accessing the work you hereby accept the Terms. Non-commercial uses of the work are permitted
without any further permission from Dove Medical Press Limited, provided the work is properly
attributed. For permission for commercial use of this work, please see paragraphs 4.2 and 5 of our Terms.
© 2018 The Author(s). This work is published and licensed by Dove Medical Press Limited. The
full terms of this license are available at https://www.dovepress.com/terms
and incorporate the Creative Commons Attribution
- Non Commercial (unported, 3.0) License.
By accessing the work you hereby accept the Terms. Non-commercial uses of the work are permitted
without any further permission from Dove Medical Press Limited, provided the work is properly
attributed. For permission for commercial use of this work, please see paragraphs 4.2 and 5 of our Terms.