Back to Journals » Psychology Research and Behavior Management » Volume 16
Distinct Classes of Statistical Anxiety: Latent Profile and Network Psychometrics Analysis of University Students
Authors Huang F ![]() , Zheng S, Fu P, Tian Q
, Zheng S, Fu P, Tian Q ![]() , Chen Y, Jiang Q, Liao M
, Chen Y, Jiang Q, Liao M
Received 9 May 2023
Accepted for publication 12 July 2023
Published 21 July 2023 Volume 2023:16 Pages 2787—2802
DOI https://doi.org/10.2147/PRBM.S417887
Checked for plagiarism Yes
Review by Single anonymous peer review
Peer reviewer comments 2
Editor who approved publication: Professor Mei-Chun Cheung
Fajie Huang,1 Siqi Zheng,2 Peng Fu,1 Qianfeng Tian,1 Ye Chen,1 Qin Jiang,1,* Meiling Liao1,*
1School of Health, Fujian Medical University, Fuzhou, People’s Republic of China; 2Fujian Institute of Education, Fuzhou, People’s Republic of China
*These authors contributed equally to this work
Correspondence: Meiling Liao; Qin Jiang, No. 1 Xuefu North Road, University New District, Fuzhou, 350122, People’s Republic of China, Email [email protected]; [email protected]
Purpose: Many university students will experience statistical anxiety. Consequentially, the relationship between such anxiety and learning performance has been of concern to various educational researchers. To date, however, there has been no consistent resolution to this problem. Because previous studies have mainly used the perspective of variant-centered analysis rather than taking into account individual differences, this study argues that the different classes of statistical anxiety among university students may be an important influencing factor.
Participants and Methods: In this study, 1607 Chinese university students who had just completed a statistics course were assessed using the Statistical Anxiety Scale, Statistics Learning Self-Efficacy Scale, and Learning Engagement Scale, and an exploratory study was conducted to determine whether university students’ statistical anxiety could be divided into different classes. Latent profile and network psychometrics analyses were then used to analyze the data.
Results: (1) The latent profile analysis found that university students’ statistical anxiety could be divided into three different latent classes: mild test anxiety, moderate text anxiety, and severe statistical anxiety. (2) The correlation analysis showed that the relationships among the three latent classes of statistical anxiety and learning performance were not entirely consistent, indicating that there was heterogeneity in the statistical anxiety of these university students. (3) Further network psychometrics analysis showed that the statistical anxiety network structure of the three latent classes has different core nodes that reflected the most important symptoms of statistical anxiety.
Conclusion: There is heterogeneity in university students’ statistical anxiety that can be divided into three latent classes. These core nodes in the statistical anxiety networks of the three latent classes were different, helping statistics instructors to better understand the nature of these latent classes, take different intervention measures for different latent classes of university students.
Keywords: statistical anxiety, latent profile analysis, network psychometrics analysis, learning performance, educational strategy
Introduction
In recent years, more and more universities have included statistics courses as a requirement for degrees because statistical knowledge can help students improve their critical reasoning and conditional logic.1,2 Statistics also plays a substantial role in many academic and professional fields,3 such as medicine, psychology, education, and other disciplines. Surprisingly, statistics is also one of the most anxiety-inducing courses in university curricula.4,5 Students often have a negative emotional reaction to the process of statistics education, thus producing statistical anxiety. Specifically, statistical anxiety is a kind of excessive worry, intrusive thinking, and/or nervousness that students experience when exposed to the concepts, formulae, problems, cases, and instruction and examination situations related to the learning of statistics.5,6 It is a persistent, habitual anxiety.7,8 As previous studies have shown, up to 80% of students experience some form of statistical anxiety.6 Thus, many educational researchers are concerned about whether statistical anxiety affects the learning outcomes of university students.
Usually, it is normal for students to have a certain degree of anxiety related to the process of learning. Moderate anxiety can stimulate excitement, leading to a positive learning effect.9 As a special type of subject anxiety, we considered whether statistical anxiety would also promote a positive learning effect in university students. Previous researchers have also studied the relationship between statistical anxiety and the learning behaviors of university students, including the impact of statistical anxiety on learning performance, learning efficacy, and learning motivation,10 as well as the effects of demographic differences such as gender, professional class, and so on. In this research, an appropriate number of university students were selected as the research object. Then, statistical anxiety, statistical learning performance, and other related scales were applied and the appropriate data analyzed. Previous studies using a similar research design have not yielded consistent conclusions. For example, only a few have found that statistical anxiety can positively promote students’ learning performance.11 Others have found no significant relationship between statistical anxiety and learning performance,11–13 while yet others have found that increased statistical anxiety has a negative impact on academic performance.14–16 Students with higher statistical anxiety have shown obvious negative symptoms such as nervousness and panic in class, and a small number of students were even unable to complete statistics courses or were suspended from school because of excessive anxiety.17 Thus, previous studies have come to conflicting conclusions about the relationship between statistical anxiety and learning performance in university students.
Why have previous studies reached inconsistent conclusions on this issue? Through a detailed comparative analysis, the present research found that although previous studies have used similar research designs, there may be an important factor resulting in this confusion: the heterogeneity of university students’ statistical anxiety groups. In terms of the sampling of research objects, previous studies have generally used a certain university or major, resulting in a relatively small sample size and single source. Because statistical anxiety is a state anxiety,18 it is easily affected by external conditions such as the teaching and learning environment, etc. Different studies may have different levels of heterogeneity in their samples, leading to variations in the research results. Therefore, it is better to ensure diversity in the sample. It is also critical that previous studies have mainly used a variable-centered perspective in their data analysis.19 That is, they used the total score for statistical anxiety (ie, the sum of the scores of all dimensions of statistical anxiety) as a dependent variable index and then analyzed the relationship between statistical anxiety and learning performance. Statistical anxiety is a multidimensional construct that includes six dimensions: explanation anxiety, test anxiety, questioning anxiety, statistical value, statistical self-identity, and fear of teachers.20–22 Some studies have found that approximately 80% of university students may have different forms of statistical anxiety.4 Thus, a student’s statistical anxiety may only be of a certain aspect or a combination of several anxiety dimensions such as explanation or test anxiety. Therefore, this research speculated that the heterogeneity of university students’ statistical anxiety groups may be an important reason for the inconsistent results found in previous work.
In recent years, latent profile analysis (LPA) has been used widely in the classification of heterogeneous groups in psychology, psychiatry, and other disciplines, and can be applied to the classification of different classes of statistical anxiety. LPA assumes that there are several different latent classes (or manifestations) within a population. It was used to identify and divide subjects into a few mutually exclusive latent classes, according to their scores for explicit variables (ie, different dimensions of statistical anxiety). It is informative to further examine latent classes and their relationship to related variables (in this case, learning performance).19,23 Therefore, based on a study of sampling diversity, the present research introduced LPA to explore the heterogeneity of university students’ statistical anxiety, fully considering the different dimensions of statistical anxiety. The university students with statistical anxiety were then divided into different classes. Doing so allowed us to more accurately examine the relationship between statistical anxiety and learning performance for the different subgroups of university students.
After identifying the heterogeneity of statistical anxiety, we considered how to better understand the essential characteristics of the different latent classes. For some time, researchers have mainly understood psychological disorders from the perspective of the traditional latent variable model, believing that symptoms (ie, observed variables) originated from latent disease entities (ie, latent variables) and symptoms were the external reflection of those entities. The latent variable model assumes that latent variables have full explanatory power for observed variables, and each observed variable (or symptom) is independent of one another.24,25 However, this view clearly ignores interactions among symptoms because causal relationships between symptoms are very common and a basic phenomenon in psychological disorders. To this end, Borsboom proposed a new perspective for understanding psychological disorders: psychopathology network theory. Psychological disorders are the result of the interaction of different symptoms and not the result of latent variables. The emergence and maintenance of psychological disorders are the result of causal interactions and a feedback loop operating between symptoms.25 Based on this new theory, a popular network psychometrics analysis method was developed that presents the characteristics of or information related to a certain system (or psychological disorder) in the form of a network composed of nodes and edges and determines the core symptoms of the network structure (ie, high centrality symptoms) according to the centrality indicators of the network (ie, intermediary, proximity, and strength). Therefore, if we analyzed different latent classes of statistical anxiety by network measurement and explored their core symptoms, we would be able to provide a new perspective for understanding statistical anxiety. In addition, if there was a negative relationship between a certain class of statistical anxiety and learning performance, educational researchers could also use the core symptoms as a foundation for establishing targeted educational countermeasures, ultimately reducing students’ statistical anxiety and improving their statistics-related learning ability.20,26
In sum, in order to better explore the heterogeneity of university students’ statistical anxiety, this study built upon a previous research design and incorporated certain improvements. Research subjects were selected from multiple majors and units to the greatest extent possible, in order to avoid additional factors interfering with the research results. Moreover, variables related to learning performance, such as course achievement, learning engagement, and learning efficacy were included to examine the relationship between statistical anxiety and learning performance in a comprehensive manner. Regarding the methods of data analysis, LPA was introduced to explore the different latent classes of statistical anxiety (Aim 1). Next, the relationships among the different latent classes of statistical anxiety and learning performance were investigated to verify the heterogeneity of university students’ statistical anxiety (Aim 2). In order to better understand that heterogeneity and provide practical enlightenment for the design of targeted intervention strategies in statistical teaching, the core symptoms of the different latent classes were then explored using the method of network psychometrics analysis (Aim 3).
Methods
Participants
In this study, students who had just finished a statistics course were selected from 11 universities in Fujian Province via convenience sampling, and an online scale test was carried out. A total of 1607 distributed scales were recovered, and all met the screening criteria. The specific distribution of the participants was 433 boys and 1174 girls. A total of 187 were from Fujian Medical University (representing the disciplines of psychology, clinical medicine, public health, etc.), 50 were from Fujian Normal University (psychology), 32 from Fuzhou University (psychology), 67 from Minnan Normal University (psychology), 56 from Quanzhou Normal University (psychology), 36 from Longyan University (psychology), and 31 from Minnan University of Science and Technology. Sunshine University provided 60 students (psychology), Xiamen Medical University 945 (clinical medicine, public health, etc.), Sanming University 43 (pedagogy), and Hanshan Normal University 100 (psychology, preschool education). All subjects voluntarily participated in the psychological test and completed all scales in the study. After completion, they were informed of the main purpose of the test.
Measures
Statistical Anxiety Scale
The Statistical Anxiety Scale (STARS) was developed by Cruise et al.21 It includes 51 items and six dimensions: explanation anxiety, test anxiety, questioning anxiety, statistical value, statistical self-identity, and fear of teachers. The Likert scale scores range from 1 to 5, with 1 indicating “no anxiety” and 5 meaning “very anxious”. The higher the score is, the higher is the statistical anxiety. The Chinese version of the scale has been revised and found to have good reliability and validity, and is suitable for the assessment of the statistical anxiety of university students.27 The alpha coefficient of this scale for the present study was 0.98, and for the six sub-dimensions were 0.94, 0.94, 0.89, 0.97, 0.93, and 0.95.
Statistics Learning Self-Efficacy Scale
This scale was developed by Finney and Schraw.28 It is a one-dimensional Likert scale with 14 items. Scores range between 1 and 7, with 1 meaning “no confidence at all” and 7 meaning “full confidence”. The higher the score is, the stronger is the learning efficacy. For the present study, the scale was first translated into Chinese and then translated back by a researcher with an English major. The reliability and validity indicators were good, with an alpha coefficient of 0.98. Confirmatory factor analysis fit well, χ2 = 234.57, df = 74, TLI = 0.96, CFI = 0.97, AIC = 1,1851.01, BIC = 12,030.28, SRMR = 0.024, and RMSEA = 0.074.
Learning Engagement Scale
This scale was developed by Fang, Shi, and Zhang.29 It has 17 items and three dimensions: vigor, dedication, and absorption. Scores range from 1 to 7, with 1 representing “never” and 7 representing “always”. The higher the score is, the higher is the degree of learning engagement and better is the psychological enthusiasm for learning. The scale has good reliability and validity. In the present study, the alpha coefficient of the scale was 0.98, and the three sub-dimensions were 0.95, 0.94, and 0.94.
In addition, all participants were asked to report their final exam scores in statistics.
Statistical Analysis
First, this study conducted a common method bias test on the research data. The results of the exploratory factor analysis showed that the variation explained by the first factor without rotation analysis was 34.86%, which was less than the 40% critical value, indicating that the common method bias did not have a significant impact on the results. Second, according to the three research aims outlined in the introduction, this study conducted a statistical analysis of the data related to university students’ statistical anxiety, as follows.
For Aim 1, in order to explore the latent classes of university students’ statistical anxiety, Mplus8.0 software was used to analyze the latent classes of the data, starting from the model of one class and gradually increasing the number of classes and calculating the fit indicators for all models. The fit index of the evaluation model was comprised of a likelihood ratio Chi-squared test (LL) and Akaike information criterion (AIC), Bayesian information criterion (BIC), and adjusted Bayesian information criterion (aBIC). The smaller the value was, the better was the model fit effect. The larger the entropy index was, the higher was the classification accuracy. If entropy > 0.8, the classification accuracy of the model was more than 90%. The Lo-Mendell-Rubin (LMR) likelihood ratio bootstrapped likelihood ratio test (BLRT) indicated that the K class model was significantly better than the K-1 class model if the test result was p < 0.05. To ensure the simplicity and interpretability of the model, the fit indicators were integrated to determine the best latent profile model.19
For Aim 2, in order to investigate the relationship between university students’ statistical anxiety and related variables and whether performance was different for different latent classes, SPSS26.0 was used to analyze the data via correlation and variance analyses.
For Aim 3, in order to better understand the nature of the three different latent classes of statistical anxiety, the R qgraph package was used to measure and analyze new network data via the partial correlation method.30 The centrality indices of strength, closeness, and betweenness were calculated. The higher the centrality index of a node was, the more important was the node (or symptom) in the network, allowing for identification of the core node (or symptom). Strength centrality refers to the sum of the absolute values of the link strengths between a node and other nodes. Closeness centrality is the average distance between a node and all other nodes in the network and is the reciprocal of the sum of the shortest path distance between the node and other nodes in the network structure. Intermediary centrality refers to the number of times a node appears on the shortest path between any two nodes. Consistent with previous studies, this research selected the top five symptoms in the centrality index as the core symptoms.31 A network comparison test was used, and permutation was adopted to test the stability of the three centrality indices of the network structure, namely whether the centrality indices were still unchanged after some samples or nodes were removed. A total of 5000 permutations were executed to ensure the quality of the test. The results were expressed in terms of the correlation stability (CS) coefficient values, which should be higher than 0.25 and are better above 0.5.32
Results
Latent Profile Analysis of University Students’ Statistical Anxiety
In order to explore the latent classes of university students’ statistical anxiety, the mean value of the six dimensions of the statistical anxiety rating scale was used as the index for the LPA analysis, and the latent profile models for one to six classes were successively established. The fit indices of the models are shown in Table 1. The entropy values for all models were greater than 0.9, and Class 3 showed little change. The LL, AIC, BIC, and aBIC model fit index values showed a decreasing trend with an increase in the number of classes. Both the LMR and BLRT measures reached significant levels, indicating that the addition of classes may have improved the model. However, after the BIC index of each class model was drawn into a steep slope map, the decline in the BIC index began to become gentle after the third class model, indicating that the third class model was the inflection point of change for the fit index. Considering the simplicity and interpretability of the model, this study determined that the three-class model was the best latent profile fit model.
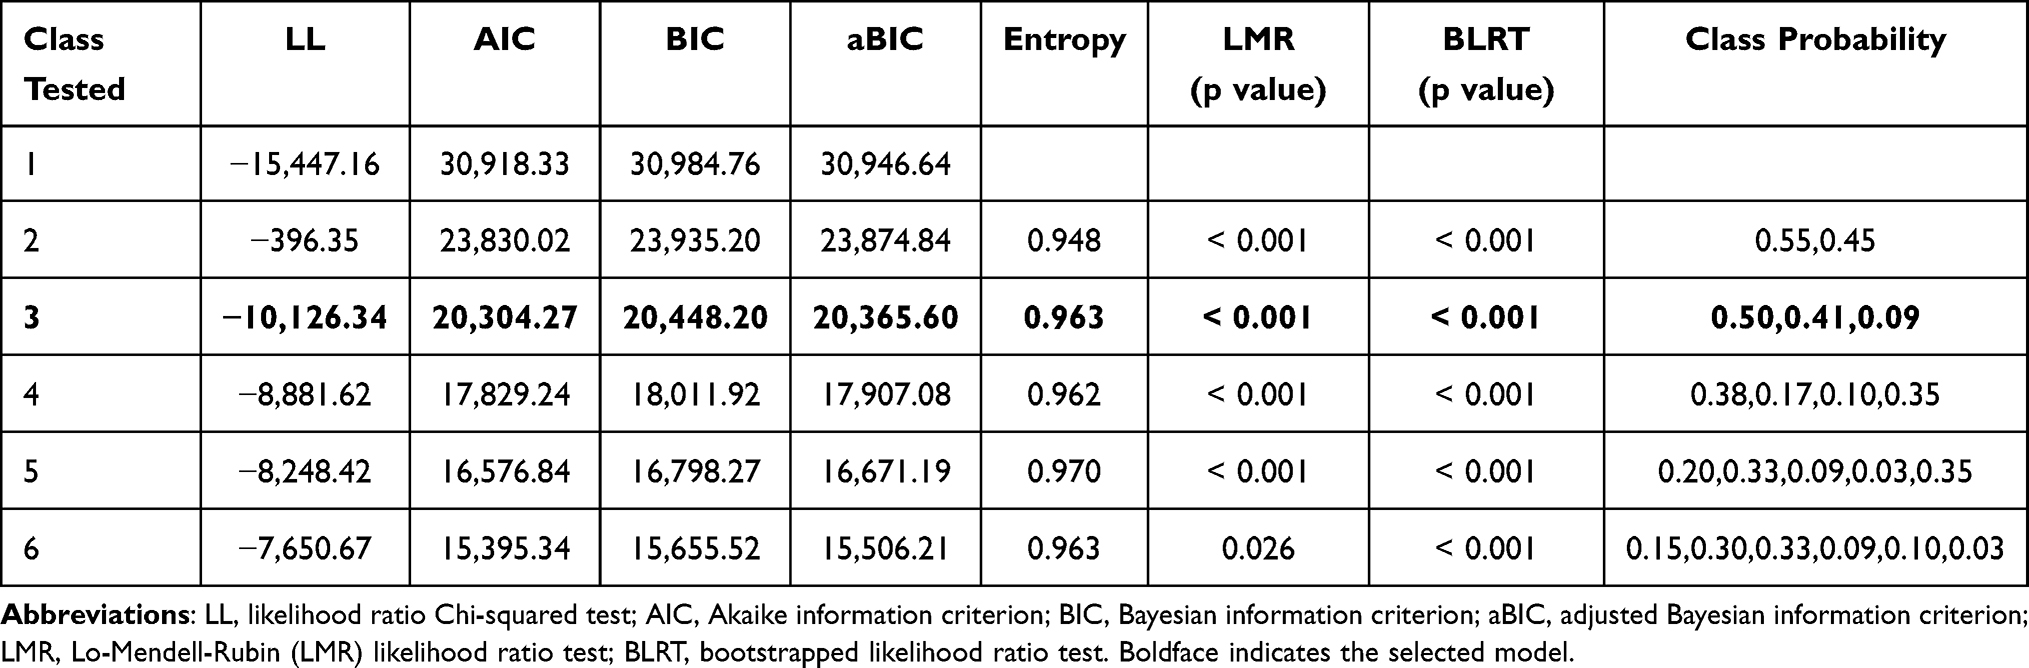 |
Table 1 Fit Index of the Latent Profile Models of Statistical Anxiety in University Students (n = 1607) |
In order to better name the three latent classes, based of the aforementioned LPA analysis, the average of the six dimensions of statistical anxiety was divided into dependent variables, latent classes, and dimensions as independent variables, and the characteristic differences among the three latent classes were analyzed. The results of a variance analysis showed that the main effect of the latent class was significant, F (2, 1604) = 3571.61, p < 0.001. The main effect of the dimensions was also significant, F (2, 1604) = 84.38, p < 0.001, as was the interaction effect of latent class and dimensions F (2, 1601) = 24.68, p < 0.001. As shown in Figure 1 and Table 2, the results of a simple effect analysis found that there were significant differences among the three classes in terms of the average scores for the six statistical anxiety dimensions (Fs > 1040.82, ps < 0.001). That is, the average score of Class 1 was the lowest, Class 2 second, and Class 3 the highest.
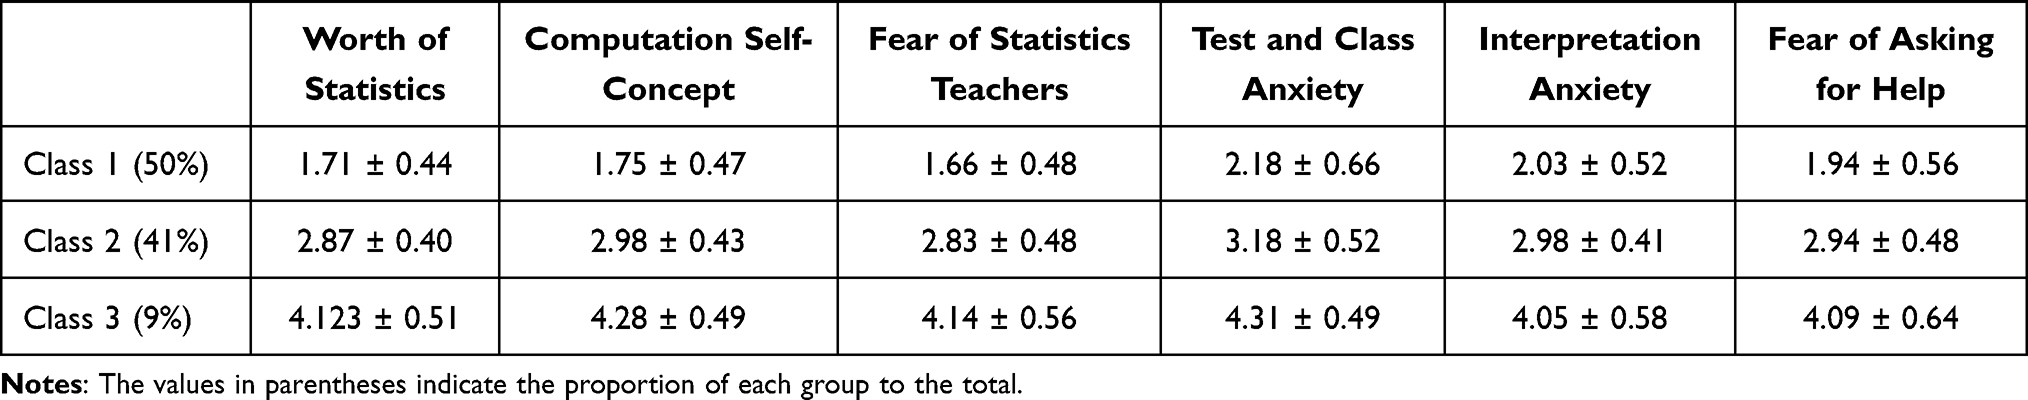 |
Table 2 Descriptive Statistics of Three Latent Classes of University Students for Each Dimension of Statistical Anxiety (n = 1607) |
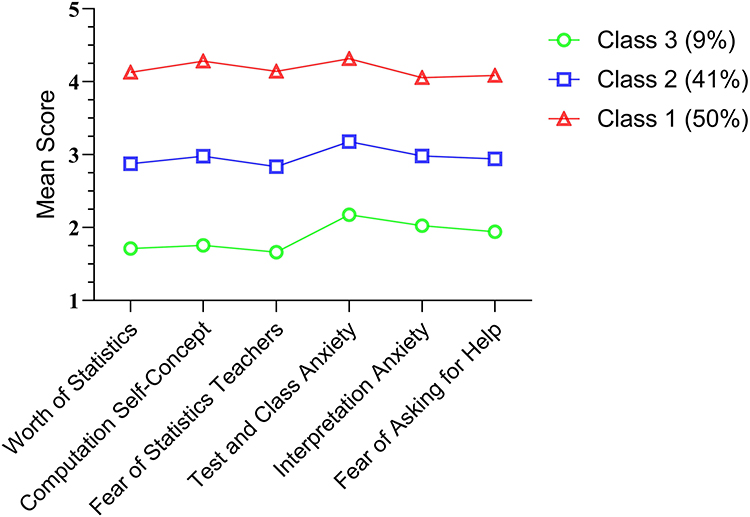 |
Figure 1 Line graph of the mean values of the three latent classes of university students for each dimension of statistical anxiety. |
Second, the three latent classes of statistical anxiety were named according to the score characteristics of the three latent classes of university students and six dimensions of statistical anxiety, as follows. In Class 1, the main effect of the dimensions was significant, F (5, 1600) = 84.89, p < 0.001, and the results of multiple comparisons showed that the scores of the six dimensions were significantly different (ps < 0.001). Scores from high to low were: test and class anxiety, interpretation anxiety, fear of asking for help, worth of statistics, fear of statistics teachers, and computation self-concept. Only test and class anxiety scored significantly higher than 2 (ie, somewhat anxious). There was no significant difference between interpretation anxiety and 2, and the scores of the other dimensions were significantly lower than 2. Therefore, Class 1 was named the “mild test anxiety group”.
In Class 2, the main effect of the dimension was significant, F (5, 1600) = 41.57, p < 0.001, and multiple post-hoc comparisons showed that the score for test and class anxiety was significantly higher than those of the other five dimensions (ps < 0.001). The score for interpretation anxiety was significantly higher than that of worth of statistics or fear of statistics teachers (ps < 0.001). Fear of asking for help scored significantly higher than fear of statistics teachers (p = 0.001). Worth of statistics scored significantly higher than fear of statistics teachers and significantly lower than computation self-concept (p1 < 0.05, p2 < 0.001). The score for fear of statistics teachers was significantly lower than that of computation self-concept (p < 0.001), and there was no significant difference in the other scores (p > 0.05). Because only the score for test and class anxiety was significantly higher than 3 (ie, moderate anxiety), and the scores of other factors were significantly higher than 2 but significantly lower than 3 (ps > 0.05), test and class anxiety was more prominent than the other five factors. Thus, Class 2 was named the “moderate test anxiety group”.
In Class 3, the main effect of the dimension was significant, F (5, 1600) = 12.94, p < 0.05, and the results of multiple comparisons showed that computation self-concept scored significantly higher than interpretation anxiety, fear of asking for help, worth of statistics, and fear of statistics teachers (ps < 0.01). The scores for test and class anxiety were significantly higher than those of interpretation anxiety, fear of asking for help, and worth of statistics (p1 < 0.001, p2 < 0.001, p3 < 0.05), with no significant difference (ps > 0.05). In addition, the scores for test and class anxiety, worth of statistics, fear of statistics teachers, and computation self-concept were significantly higher than 4 (ie, severe anxiety). There were no other significant differences (ps > 0.05). Because most of the factor scores were close to 4, Class 3 was named the “severe statistical anxiety group”.
The Relationship Between Statistical Anxiety and Gender, Academic Achievement, Learning Performance, and Learning Efficacy for the Three Latent Classes of University Students
In order to investigate whether the relationship between university students’ statistical anxiety and related variables was different for the three latent classes and to provide a reference for studies of statistical anxiety, the following were carried out. First, as shown in Table 3, based on the total sample (n = 1607), a Pearson correlation analysis found that there was a significant negative correlation between statistics anxiety (2.53 ± 0.80) and learning engagement (3.96 ± 0.80), statistics scores (82.33 ± 10.96), and statistical learning self-efficacy (2.58 ± 0.91), r1 = −0.22, p1 < 0.001, r2 = −0.21, p2 < 0.001, r3 = −0.45, p3 < 0.001. The results of an independent sample t-test showed that the statistical anxiety of female students (2.55 ± 0.81) was slightly higher than that of male students (2.46 ± 0.78), t (1605) = 2.26, p < 0.05.
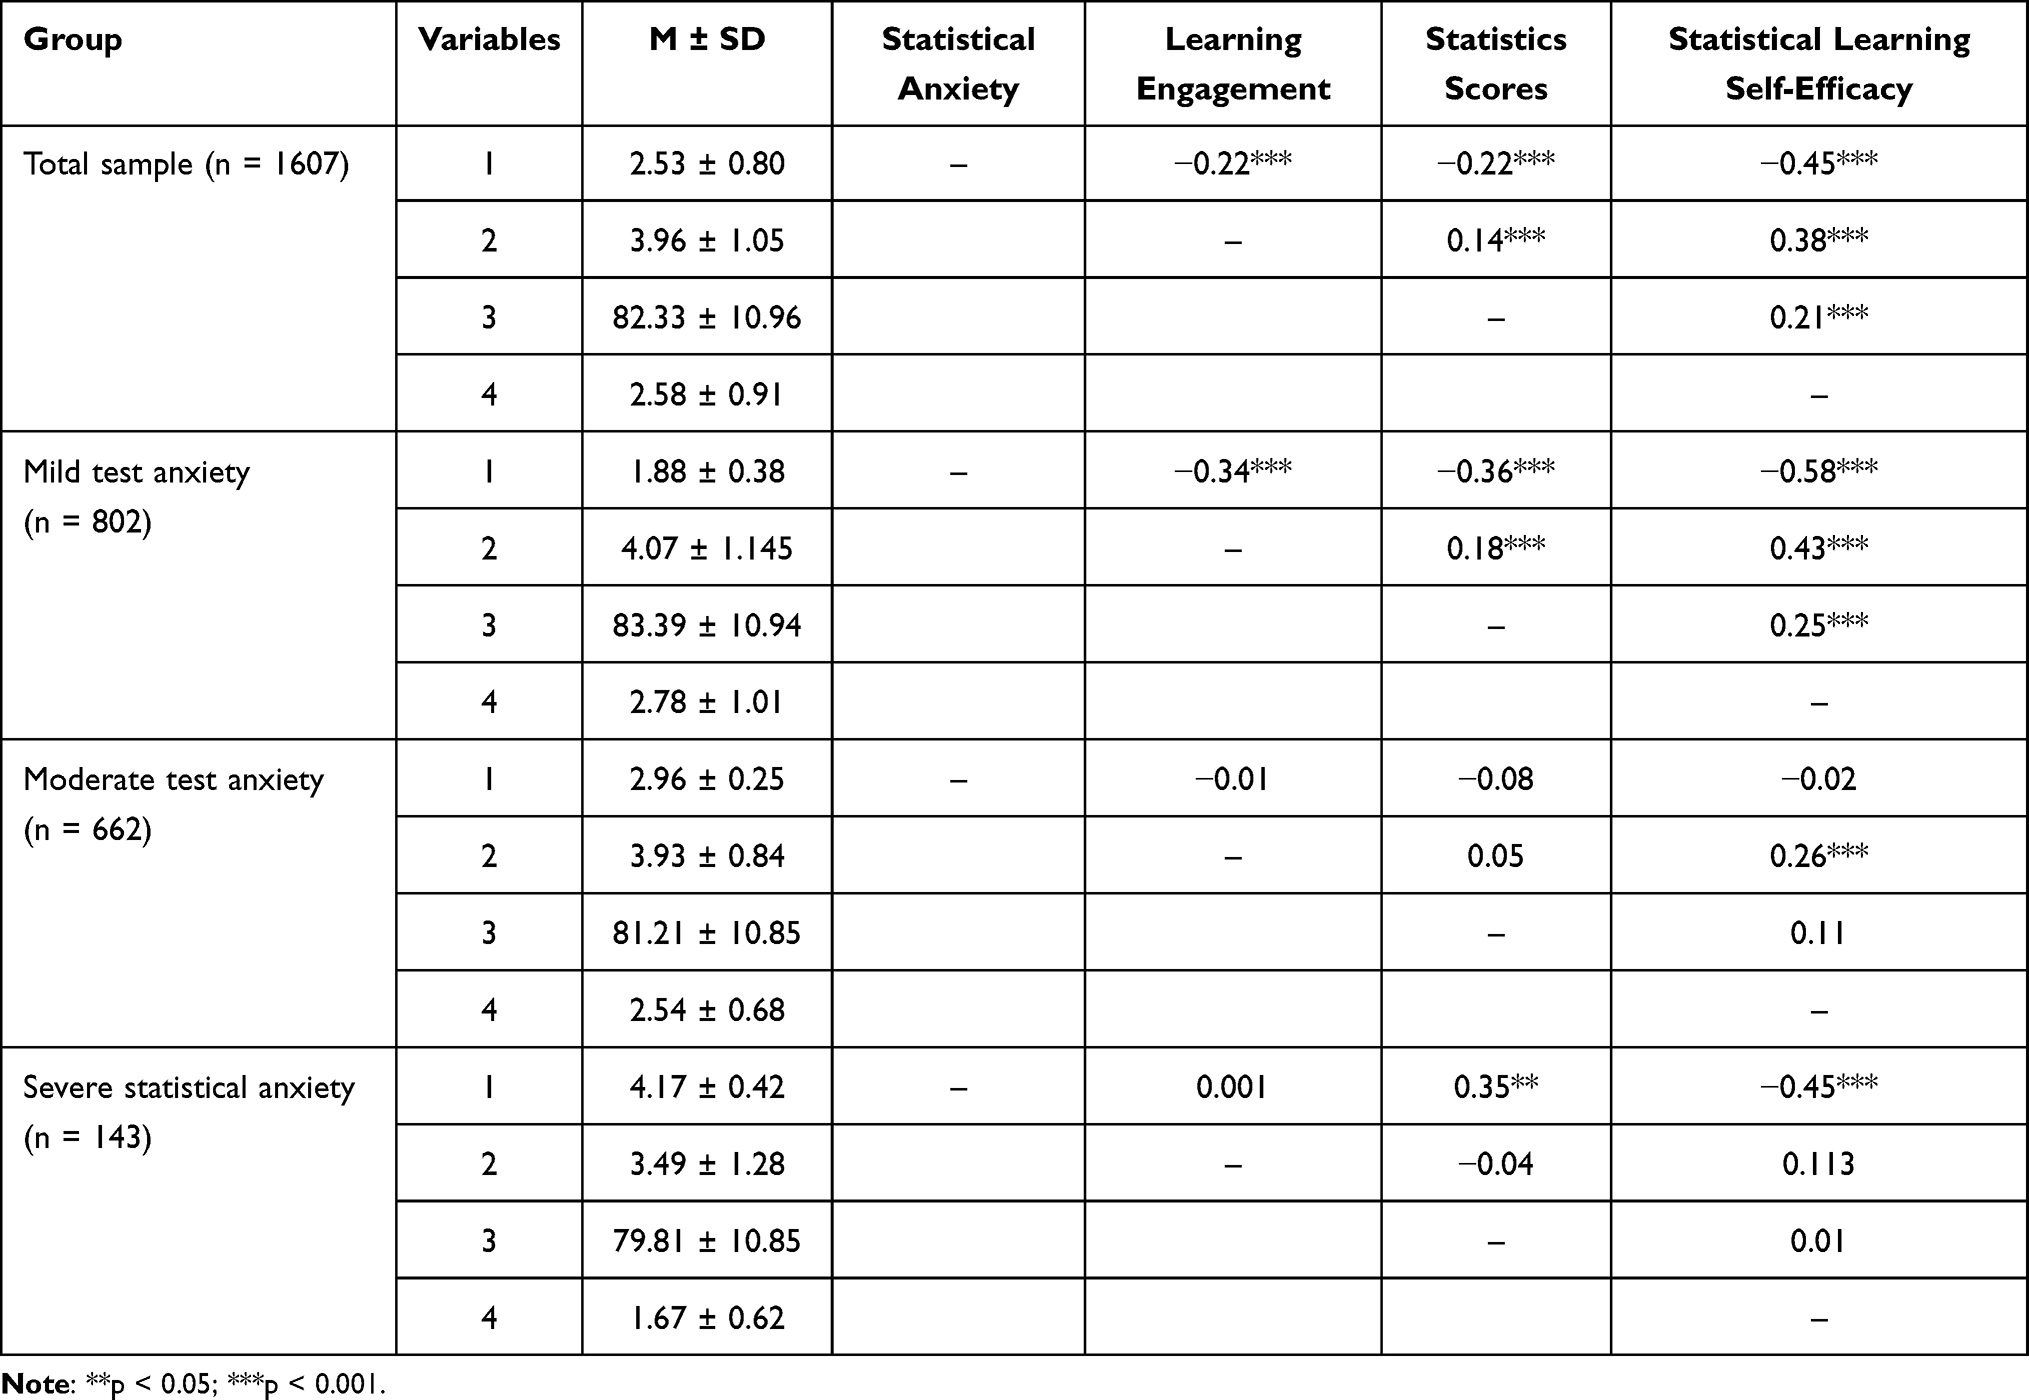 |
Table 3 Correlation Analysis of Variables Related to Statistical Anxiety and the Learning Performance of University Students in Different Latent Classes |
Secondly, a statistical analysis similar to the previous one described above was carried out on samples of university students. The results showed that in Class 1 (n = 802), there was a significant negative correlation between statistics anxiety (2.53 ± 0.80) and learning engagement (3.96 ± 0.80), statistics scores (82.33 ± 10.96), and statistical learning self-efficacy (2.58 ± 0.91), r1 = −0.34, p1 < 0.001, r2 = −0.36, p2 < 0.001, r3 = −0.58, p3 < 0.001. In Class 2 (n = 662), there was no significant correlation between statistics anxiety (2.53 ± 0.80) and learning engagement (3.96 ± 0.80), statistics scores (82.33 ± 10.96), and statistical learning self-efficacy (2.58 ± 0.91), rs < −0.08, ps > 0.05. In Class 3 (n = 143), statistics anxiety (2.53 ± 0.80) had no obvious relationship with learning engagement (3.96 ± 0.80), r = 0.35, p = 0.001 and a significant positive correlation with statistics scores (82.33 ± 10.96). There was a significant negative correlation between statistics anxiety and statistical learning self-efficacy (2.58 ± 0.91), r = −0.45, p < 0.001.
Subsequently, taking statistical anxiety as the dependent variable and gender and latent class as the independent variables, the results of the two-factor analysis of variance showed that the main effect of gender was not significant, F (1, 1601) = 2.28, p > 0.05. The interaction effect between gender and latent class was also not significant, F (2, 1601) = 2.28, p > 0.05. Only the main effect of the latent class was significant, F (2, 1601) = 2563.49, p < 0.001, η2p = 0.76. The results of multiple comparisons showed that the degree of statistical anxiety was divided from high to low into Class 3 (4.17 ± 0.42), Class 2 (2.96 ± 0.26), and Class 1 (1.91 ± 0.38), indicating that there should be no significant gender difference in statistical anxiety. There were significant differences in the different latent classes.
In the overall sample, although there was a significant negative correlation between university students’ statistical anxiety and learning engagement, statistics scores, and statistical learning self-efficacy, it was of note that in the different latent classes, the performance of this relationship was not consistent. This supports the heterogeneity of university students’ statistical anxiety, which was proposed in the introduction. The different classes of statistical anxiety need to be further distinguished.
Analysis of Statistical Anxiety of University Students in Three Latent Classes Based on Network Psychometrics
Based on the LPA results, three different statistical anxiety network structures were constructed by network psychometrics analysis, using the Rqgraph package for three latent classes of statistical anxiety (ie, the mild, moderate, and severe statistical anxiety groups),30 in order to better understand the nature of the three different latent classes of statistical anxiety and how they differ. It is of note that in the statistical anxiety network structure, each node represented an item on the STARS. If there was a correlation between items, a line connection was established between the nodes. The color of the connecting line indicated the nature of the correlation. A red line indicated a positive correlation and a green line a negative correlation. The thickness of the connecting line indicated the intensity of the correlation; the thicker the line was, the stronger was the correlation intensity, and conversely, the thinner the line was, the lower was the correlation intensity. The results were as follows.
In terms of the overall network structure, the three different latent statistical anxiety network structures were obviously different. As shown in Figure 2, for the “mild test anxiety group”, there were strong connections between Nodes 41 and 42, 49 and 51, 37 and 38, 41 and 40, and 25 and 26. As shown in Figure 3, for the “moderate test anxiety group”, only Nodes 41 and 42 and 37 and 38 were strongly connected; the other nodes were not closely connected. As shown in Figure 4, for the “severe test anxiety group”, there were strong connections between Nodes 29 and 23, 19 and 50, 23 and 10, 31 and 46, 41 and 40, and 42 and 29.
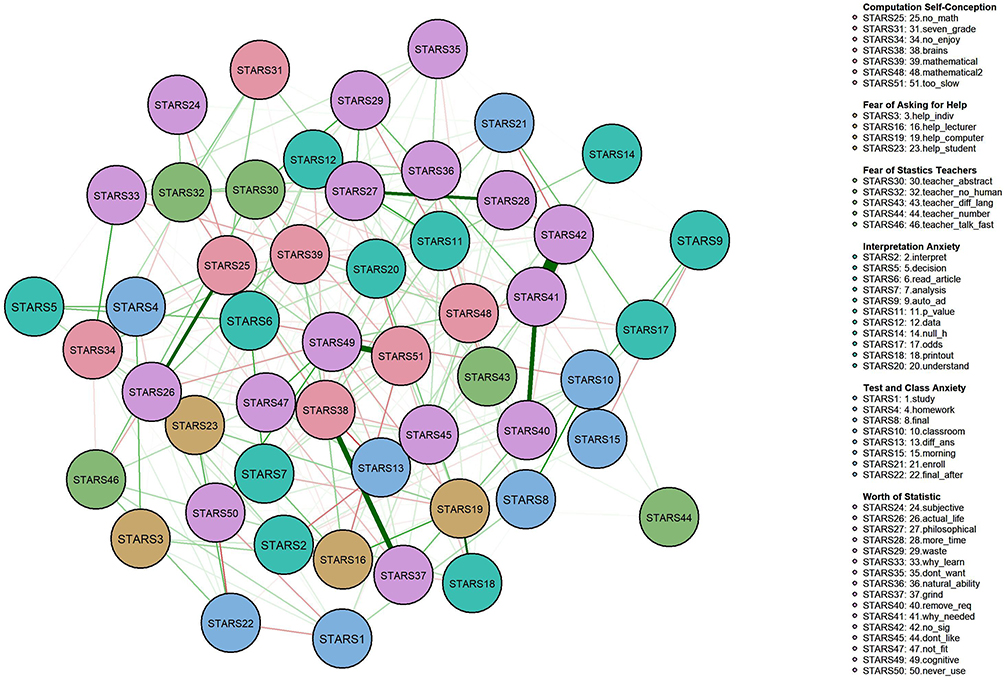 |
Figure 2 Overall network structure of the statistical anxiety of university students with mild test anxiety. Notes: The mild test anxiety network formed by pairwise correlations of the 51 items in the Statistical Anxiety Rating Scale based on the responses from students with the mild test anxiety score. Each node in the network represents an item on the statistical anxiety scale. Connections between nodes represents correlations between items. The thick line indicates that the correlation coefficient is close to 1.0, and the thin line indicates that the correlation coefficient is close to 0. All the lines are green, indicating that all the correlations are positive. The right side of the figure shows the core project term represented by each node, for example, the core term for STAR25 is no_math. |
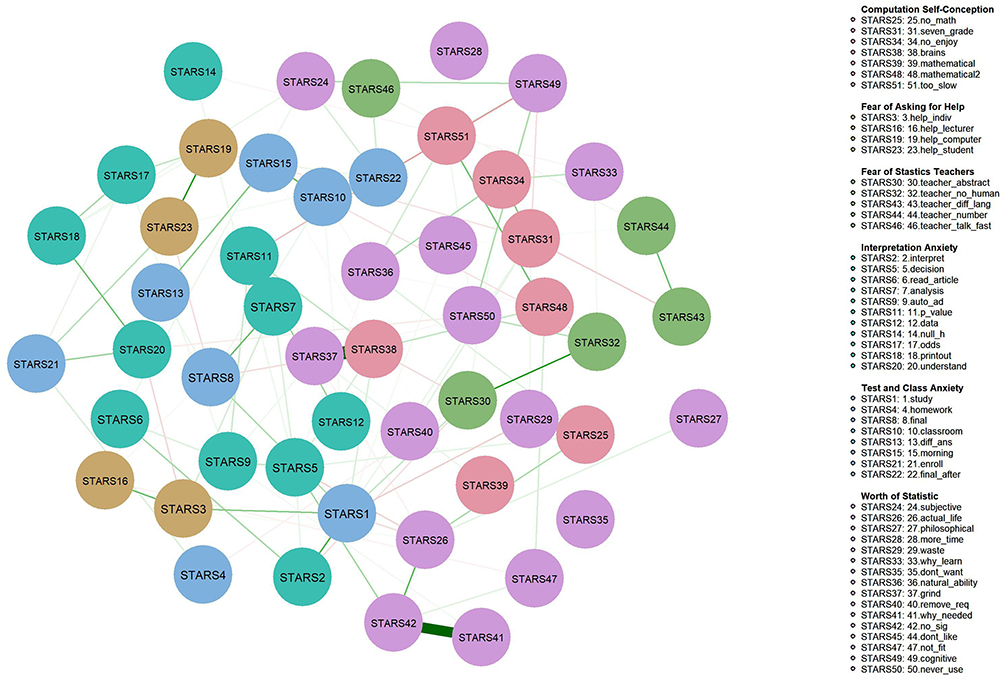 |
Figure 3 Overall network structure of the statistical anxiety of university students with moderate test anxiety. Notes: The moderate test anxiety network formed by pairwise correlations of the 51 items in the Statistical Anxiety Rating Scale based on the responses from students with the moderate test anxiety score. Each node in the network represents an item on the statistical anxiety scale. Connections between nodes represents correlations between items. The thick line indicates that the correlation coefficient is close to 1.0, and the thin line indicates that the correlation coefficient is close to 0. All the lines are green, indicating that all the correlations are positive. The right side of the figure shows the core project term represented by each node, for example, the core term for STAR25 is no_math. |
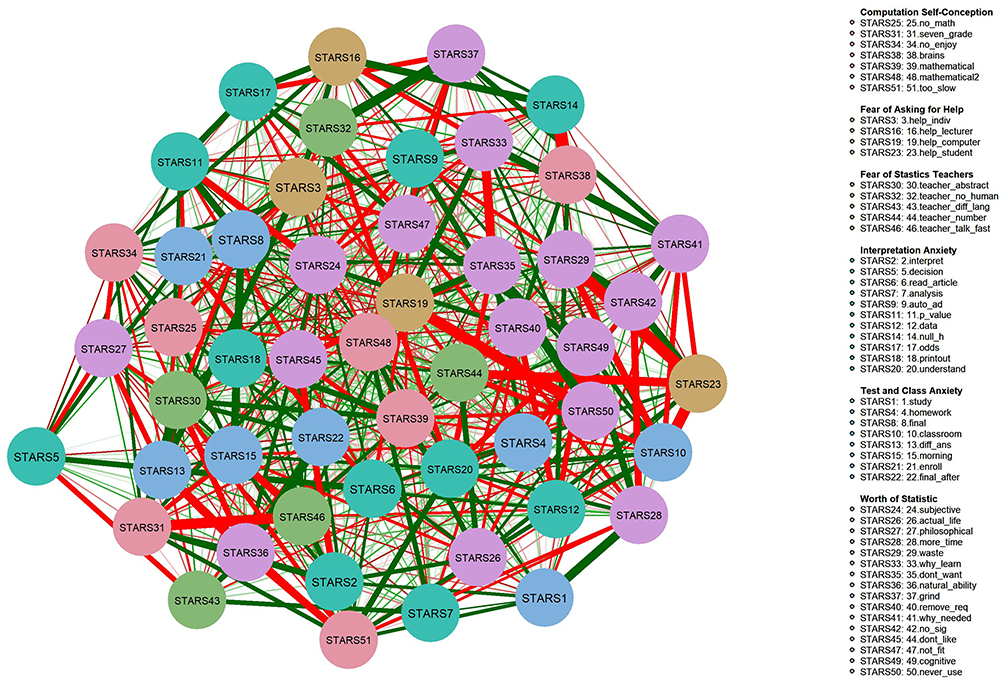 |
Figure 4 Overall network structure of the statistical anxiety of university students with severe statistical anxiety. Notes: The severe statistical anxiety network formed by pairwise correlations of the 51 items in the Statistical Anxiety Rating Scale based on the responses from students with the severe statistical anxiety score. Each node in the network represents an item on the statistical anxiety scale. Connections between nodes represents correlations between items. The thick line indicates that the correlation coefficient is close to 1.0, and the thin line indicates that the correlation coefficient is close to 0. All the lines are green, indicating that all the correlations are positive. The right side of the figure shows the core project term represented by each node, for example, the core term for STAR25 is no_math. |
The centrality analyses and betweenness, closeness, and strength values of 51 nodes in three latent statistical anxiety networks are shown in Figure 5. The top five items in the centrality analysis indices for the three anxiety networks are shown in Table 4, from high to low. The five nodes with the highest betweenness centrality values were 49, 10, 38, 6, and 19 for the mild test anxiety network; 1, 5, 38, 26, and 42 for the moderate test anxiety network; and 33, 22, 11, 5, and 17 for the severe test anxiety network. The five nodes with the highest closeness centrality values were 38, 49, 51, 25, and 27 for the mild test anxiety network; 38, 1, 5, 37, and 30 for the moderate test anxiety network; and 22, 44, 21, 14, and 11 for the severe test anxiety network. The five nodes with the highest strength centrality were 49, 38, 51, 27, and 41 for the mild test anxiety network; 38, 5, 1, 37, and 50 for the moderate test anxiety network; and 44, 5, 20, 7 and 21 for the severe test anxiety network.
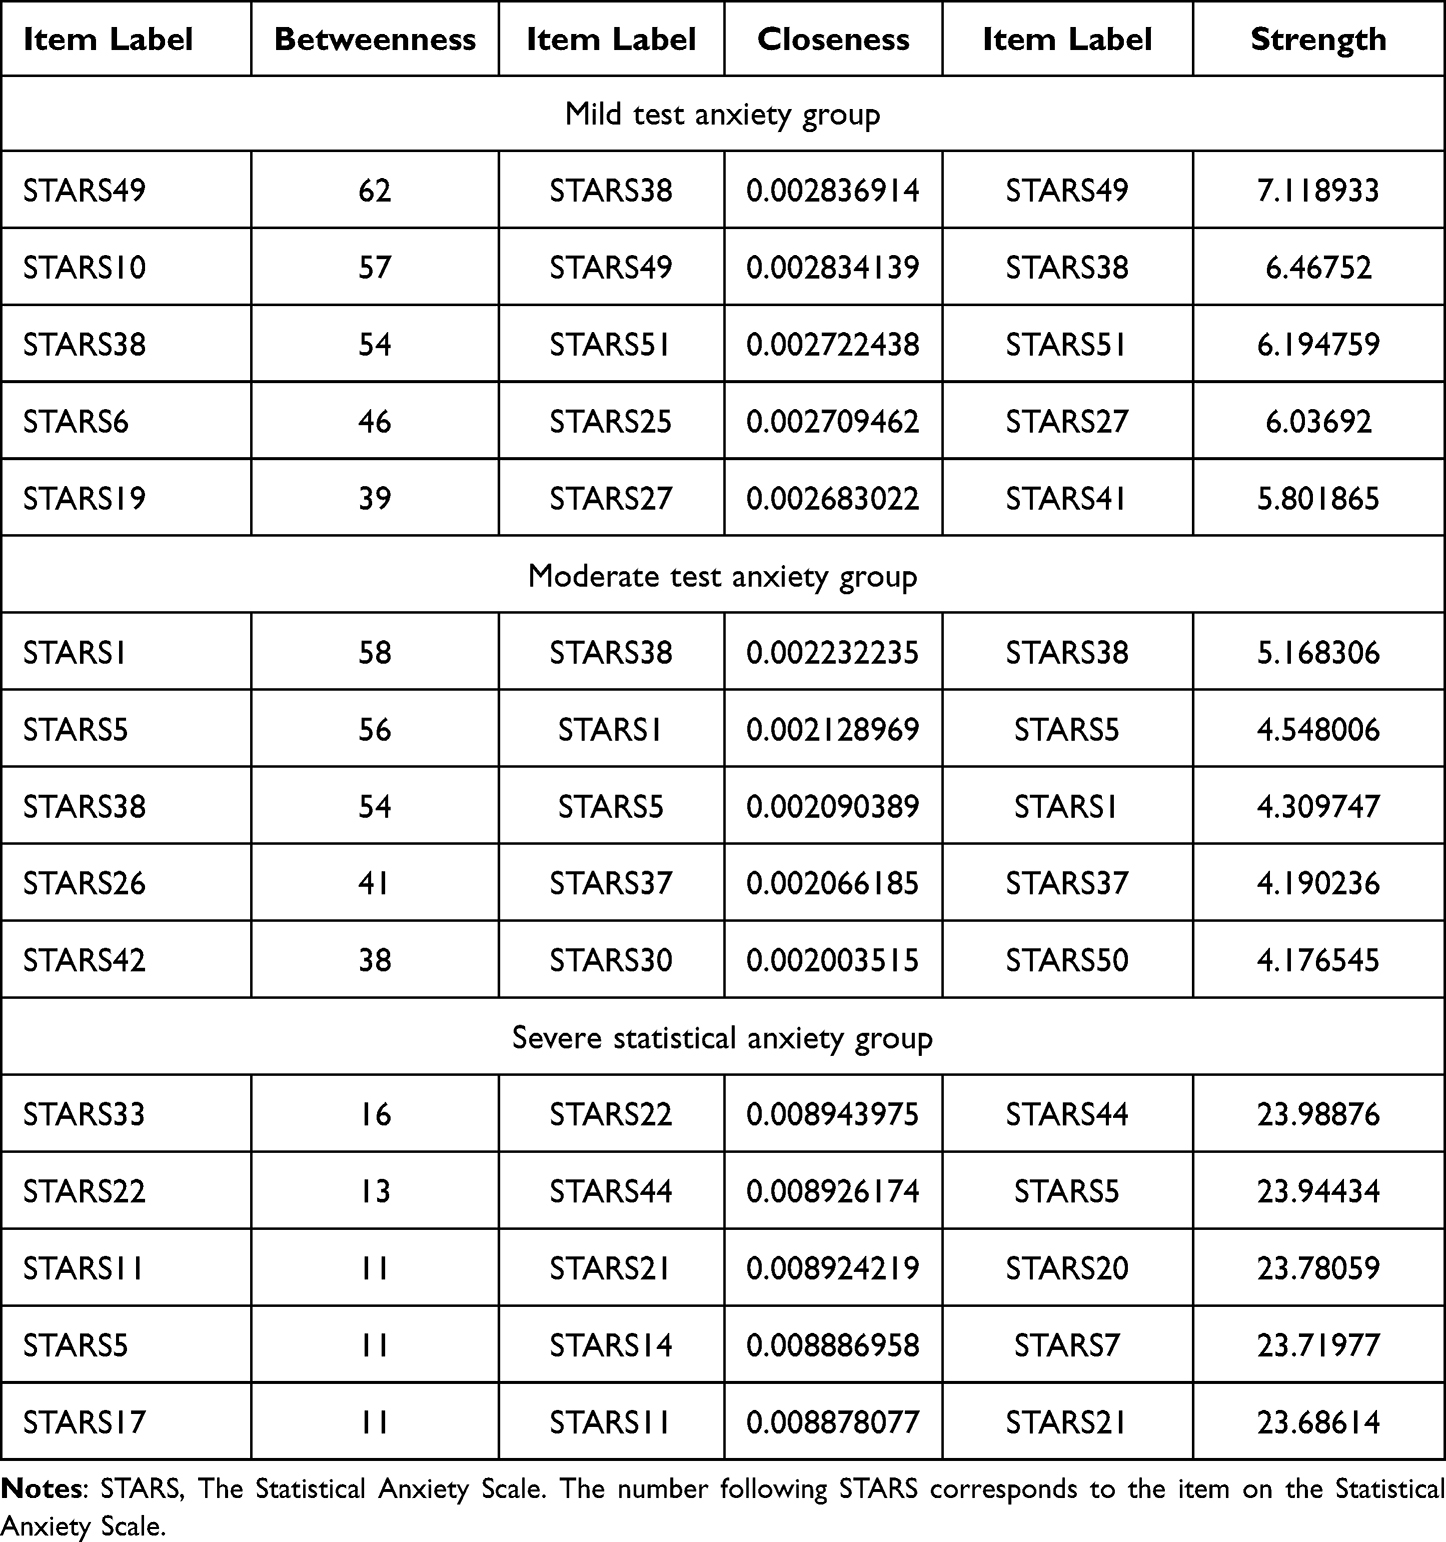 |
Table 4 Top Five Items for the Three Anxiety Network Structural Centrality Analysis Indicators |
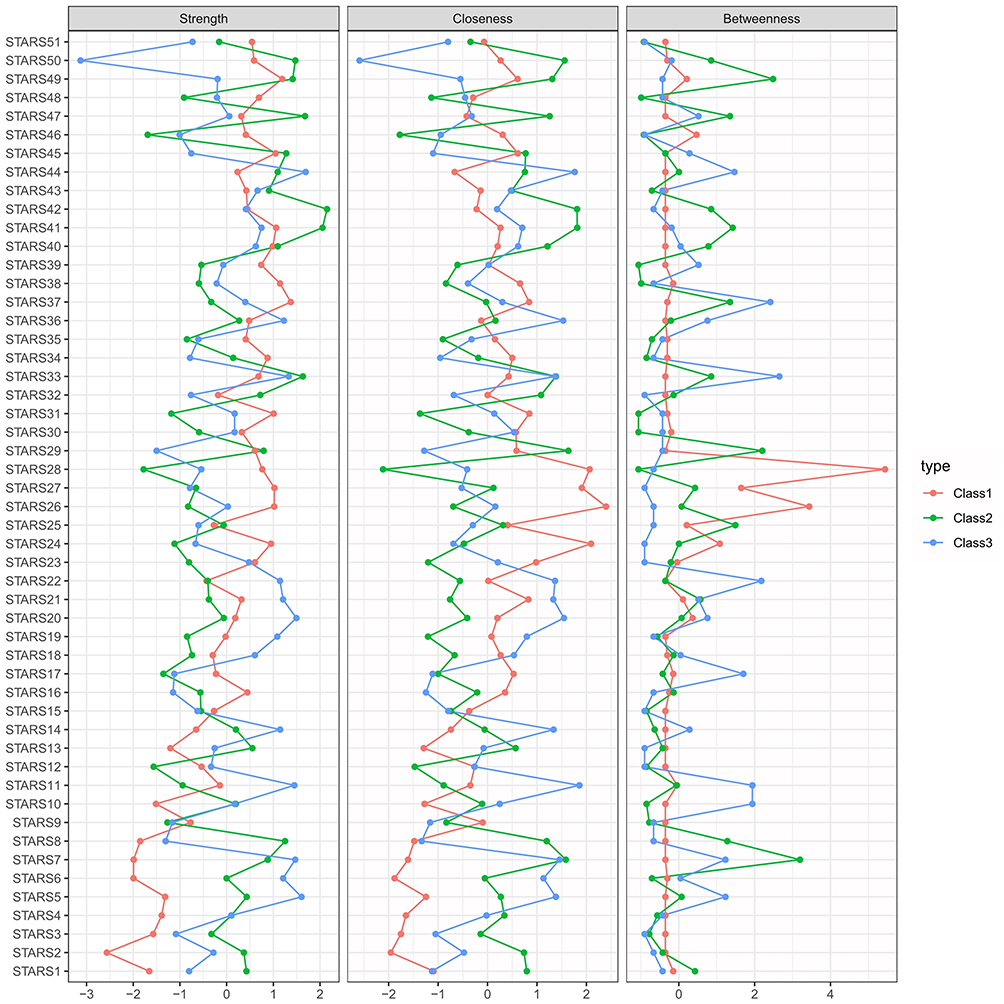 |
Figure 5 Summary of the structural centrality analysis indicators for the three anxiety networks. |
It is worth noting that there were several node centrality analysis indicators with high values in different classes, among which Node 38 (STARS38_brains) was the center for both the mild test anxiety network and moderate statistical anxiety network. Node 5 (STARS5_decision) was the center of both the moderate test anxiety network and severe statistical anxiety network; other nodes were the centers of only one network. Identifying the centers or important nodes in these anxiety networks plays an important role in understanding different classes of statistical anxiety and will serve as a starting point for statistics teachers seeking to reduce students’ statistical anxiety resulting from the teaching process.
Discussion
Heterogeneity of University Students’ Statistical Anxiety and Three Latent Classes
In order to verify the heterogeneity of college students’ statistical anxiety, this study was the first to use LPA to differentiate among the performances of university students according to six dimensions. The results showed that there were three latent classes of statistical anxiety among university students: the mild test anxiety group, moderate test anxiety group, and severe statistical anxiety group. The mild test anxiety group mainly showed mild test anxiety, and there was no obvious anxiety level in other dimensions. The students in this group accounted for 50% of the total sample. The moderate test anxiety group showed a certain degree of statistical anxiety in all six dimensions, but it was more obvious in test anxiety. The students in this group accounted for 41% of the total sample. Test anxiety and computation self-concept were prominent in the severe test anxiety group, but the other four statistics-related anxiety dimensions were also serious. This group of students accounted for 9% of the total sample. There were significant differences in the scores for the six dimensions of statistical anxiety, indicating that there was heterogeneity in the university students’ statistical anxiety that could be divided into three latent classes: mild test anxiety, moderate test anxiety, and severe statistical anxiety.
In the past, the heterogeneity of university students’ statistical anxiety was considered only to be affected by gender. That is, the tendency of university students’ statistical anxiety only differed between men and women. However, there has been ongoing disagreement on this topic. Some studies have found that female students tend to have higher statistical anxiety than do male students,33,34 while others have found that the statistical anxiety tendency in boys was higher than in girls.35 Still others found no difference between boys and girls.18,36 However, based on a comprehensive consideration of gender and latent class, the present research found that there were significant differences in the scores of the six dimensions of statistical anxiety among university students with mild test anxiety, moderate test anxiety, and severe statistical anxiety. The three latent classes had good discrimination for the six statistical anxiety indicators. This discrimination was not affected by gender, thus showing that the internal heterogeneity of university students’ statistical anxiety mainly stems from the three different latent classes.
It should be added that the statistical anxiety of university students can be divided into three different latent classes, and that statistical anxiety consists of six dimensions, among which the three latent classes of university students consistently showed the highest scores in the test anxiety dimension. This illustrates that test anxiety was the most typical form of expression in the university students’ statistical anxiety. The testing of statistics knowledge was found to be the most worrying aspect, supporting the results of the study.10 It is worth noting that test anxiety, a context-specific feature, included not only the anxiety and worry states experienced by students during the testing process, but also test anxiety about statistics in particular that is experienced before taking a statistics course.37 The latter had a strong negative correlation with the understanding of statistical concepts, indicating that there may be mutual influence among the six dimensions of statistical anxiety. Therefore, if we want to understand the statistical anxiety of university students more deeply, it would be useful to further investigate the network structure of different classes of statistical anxiety based on the various classes. Network psychometrics analysis could be used to provide additional relationships between variables within the same psychological characteristics.24,25 See the third part of the Discussion section for details.
Different Relationships Between Statistical Anxiety and Learning Performance for the Three Latent Classes of University Students
This study also considered the relationship between statistical anxiety and learning performance, finding that statistical anxiety and learning performance variables (ie, learning engagement, statistics scores, and statistical learning self-efficacy) showed a significant negative correlation. Interestingly, further group analysis showed that the relationship between statistical anxiety and learning performance was not completely consistent for the different latent classes. Specifically, in the mild test anxiety group, statistical anxiety was negatively correlated with all variables for learning performance. In the moderate test anxiety group, statistical anxiety was not significantly correlated with all variables of learning performance. In the severe test anxiety group, although there was a negative correlation between statistical anxiety and learning engagement and statistics scores, there was a significant positive correlation between statistical anxiety and statistical learning self-efficacy. Thus, the correlation between university students’ statistical anxiety and statistics scores was not completely consistent. There were differences between the various latent classes. This also explains why previous studies have not yet revealed a consistent answer to this question. More importantly, these results further support the classification characteristics of heterogeneity within university students’ statistical anxiety.
Because the correlation between statistical anxiety and course performance was not completely consistent for the different latent classes, this study speculates that the mechanisms of statistical anxiety and statistics course performance may also be different. In general, according to the cognitive interference approach,7,38 there is a direct relationship between statistical anxiety and statistics scores. That is, statistical anxiety will lead to an increase in university students’ attention to irrelevant information, absorbing attention resources. The attention resources allocated to course learning and examination tasks will thus be reduced, which will then lead to a decrease in the learning effect and examination performance in statistics courses. However, this effect may be different for different classes of statistical anxiety. Among these, for the mild test anxiety group, although the statistics scores were higher than for the other two groups, the goal of this group of students was likely to involve the pursuit of better statistics scores, and final test scores may have been lower than their initial expectations. Therefore, high learning self-efficiency was also negatively affected. In the group with high test anxiety, in order to avoid failing the final statistics test, their statistics anxiety may have prompted them to spend more time learning statistics, improving their statistics scores to a certain extent due to their increase in learning engagement. However, their learning performance, including course performance, was actually negatively affected by their statistical anxiety, so the final statistics scores for this group of students was also lower than those of the other two groups, and the learning self-efficiency of continuing to study statistics in the future was also negatively affected. In the moderate statistical anxiety group, there was no significant relationship between statistical anxiety and statistical learning performance. According to Macher et al,11 there may be certain variables that inhibit the relationship between statistical anxiety and learning performance, such as the individual’s self-concept of mathematics or interest in statistics. These variables are negatively correlated with statistical anxiety but positively correlated with learning performance, thus creating a “masking effect” between statistical anxiety and learning performance. Therefore, the interest or attitude of this group of students towards statistics may have been different from that of the two groups of students. In the network psychometrics analysis, the anxiety network of this group of students was also mainly manifested in their recognition of and attitude towards statistics. Therefore, the relationship between statistical anxiety and learning performance for this group of students was close to zero.
It should be noted that the aforementioned differences in the impact of statistical anxiety and statistics class performance for the different latent classes are only speculation, and they need to be confirmed by a series of future studies. However, we showed that the relationship between university students’ statistical anxiety and learning performance was different for different classes, which at least illustrates that there is heterogeneity within university students’ statistical anxiety.
Network Psychometric Characteristics of Statistical Anxiety for the Three Latent Classes of University Students
In this study, network psychometrics was used to examine the structure of the statistical anxiety networks, in order to better understand the nature of the different latent classes of statistical anxiety. First, this research found that the overall network structures of the three different latent classes of statistical anxiety were not significantly different, and all 51 nodes in the anxiety network were interconnected within a single network component (see Figure 1). This indicates that no matter what the class of statistical anxiety network, the overall network structure was not significantly different. All nodes in the network were closely related to one another, so the activation of any region in the statistical anxiety network was likely to spread and activate other parts of the network.
The centrality analysis of the statistical anxiety network structure in this study found that there were both similarities and differences in the important nodes (or symptoms) of the three different latent classes of statistical anxiety networks. First, the important nodes of three latent classes had similar symptom nodes. Specifically, in networks with mild and moderate test anxiety, “brains” (STARS38_brains: I do not have enough brains to get through statistics) was identified as an important node, and it was unavoidable to encounter statistical data processing, learning problems, learning data, and other problems in the process of statistics learning. In order to solve this issue, students must cognitively consume significant “brain power”, showing that students in the middle and low test anxiety groups believed that statistics was a subject requiring significant intelligence. Secondly, in the networks for moderate test anxiety and severe statistical anxiety, ‘decision’ (STARS5_decision: Making an objective decision based on empirical data) was important, under the overall assumption that the statistical estimation results of the existing samples were used. Thus, the process of statistical decision-making was seen to involve the basic idea of hypothesis testing (reduction to absurdity with a small probability). Hypothesis testing involves a certain degree of difficulty, running through inference statistics. In addition, hypothesis testing involves a certain degree of uncertainty (ie, error). This shows that the students in the medium and high anxiety groups were troubled by how to make decisions in statistics classes.
More importantly, due to the differences in the classes, the three statistical anxiety networks also had some uniquely important nodes. In the mild test anxiety group, Nodes 51 (STARS51_too_slow: I am too slow in my thinking to get through statistics) and 27 (STARS27_philosophical: Statistics is worthless to me since it’s empirical and my area of specialization is philosophical) were important. Students with mild test anxiety tendencies thought that their ability problems stemmed from their not being able to understand statistics, or they did not recognize that statistics might have important value. In the group with moderate test anxiety tendencies, Nodes 1 (STARS1_study: Studying for an examination in a statistics course) and 37 (STARS37_grind: Statistics is a grind, a pain I could do without) were important, showing that students with moderate test anxiety were concerned about examinations in statistics courses, or that learning statistics resulted in intolerable negative emotions. In the severe test anxiety group, Nodes 22 (STARS22_final_after: Going over a final examination in statistics after it has been graded), 21 (STARS21_enroll: Enrolling in a statistics course), and 11 (STARS11_p_value: Interpreting the meaning of a probability value once I have found it) were important, indicating that students with severe test anxiety not only had difficulties understanding statistical knowledge, but also felt anxious about the results of statistical learning in class and after a test.
Implications for Statistics Instructors
This study found that because the relationship between university students’ statistical anxiety and learning performance were not exactly the same, similar to previous research, we argue that different educational countermeasures should be taken for students with different classes of statistical anxiety.20,26 Specifically, statistics teachers should make targeted interventions according to the core symptoms of students with different classes of statistics anxiety. Combining the results of the centrality analysis of the different classes, this study argues that students with mild test anxiety need to deal with the perception that statistics is difficult to understand and that it has practical value, since employers in various industries have attached great importance to statistics knowledge.39,40 In addition to dealing with statistics not being easy to understand, the moderate test anxiety group must also address how to deal with anxiety related to statistics tests. For the severe statistical anxiety group, it is necessary to address classroom anxiety, master statistical knowledge as much as possible, and have instructors who guide their learning efficacy as much as possible after experiencing test anxiety. Through appropriate interventions for students with different classes of statistical anxiety, all students will be able to achieve better learning results.
There are some limitations to this study. To begin with, this research used cross-sectional research approach, which does not give an accurate picture of the fluctuation of students’ statistical anxiety across time. Therefore, further researches should take into account longitudinal research methods to construct a longitudinal network of statistical anxiety to understand how the structure of statistical anxiety network changes over time, and provide more complete suggestions for statistical anxiety interventions.41 In addition, although this study distinguished the heterogeneity of statistical anxiety through LPA and network measurement analysis methods, it was still an exploratory study. Thus, future research should be conducted by referring to relevant theories, proposing prior hypotheses, and carrying out specific research work. Finally, This study was conducted with Chinese university students, and prior studies have suggested that there could be cultural differences in university students’ statistical anxiety.33 More researchers from various cultural backgrounds should participate in such research to gain a better understanding of the statistical anxiety.
Conclusion
In sum, there is heterogeneity in university students’ statistical anxiety that can be divided into three latent classes: mild test anxiety, moderate test anxiety, and severe statistical anxiety. Moreover, the important nodes in the statistical anxiety networks of the three latent classes were not the same. What is important is understanding the key nodes in the statistical anxiety networks. Doing so will provide teachers with some specific areas of focus, enhancing students’ learning performance in this area.
Data Sharing Statement
The raw data supporting the conclusions of this article will be made available by the authors, without undue reservation. The datasets are available from the corresponding author upon reasonable request. Requests to access these datasets should be directed to Meiling liao at [email protected], either Qin Jiang at [email protected].
Ethics and Consent
The studies involving human participants were reviewed and approved by the Biomedical Research Ethics Committee of Fujian Medical University (Nos. 2023-118). We confirm that a written informed consent was obtained from the study participants. The guidelines outlined in the Declaration of Helsinki were also followed.
Acknowledgments
We thank all of the participants for their willingness to participate in the research. Meiling Liao is the first corresponding author.
Funding
This work was supported by the Fujian Provincial Education Science “14th Five-Year Plan” 2022 Annual Project (Nos. FJJKBK22-053). The funders had no role in the study design, data collection and analysis, decision to publish, or preparation of the manuscript.
Disclosure
The authors declare that the research was conducted in the absence of any commercial or financial relationships that could be construed as potential conflicts of interest.
References
1. Lehman DR, Nisbett RE. A longitudinal study of the effects of undergraduate training on reasoning. Dev Psychol. 1990;26:952–960. doi:10.1037/0012-1649.26.6.952
2. VanderStoep SW, Shaughnessy JJ. Taking a course in research methods improves reasoning about real-life events. Teach Psychol. 2016;24:122–124. doi:10.1207/s15328023top2402_8
3. Maat SM, Rosli MK. The rasch model analysis for statistical anxiety rating scale (STARS). Creat Educ. 2016;07:2820–2828. doi:10.4236/ce.2016.718261
4. Onwuegbuzie AJ, Wilson VA. Statistics anxiety: nature, etiology, antecedents, effects, and treatments--a comprehensive review of the literature. Teach High Educ. 2003;8:195–209. doi:10.1080/1356251032000052447
5. Zeidner M. Statistics and mathematics anxiety in social science students: some interesting parallels. Br J Educ Psychol. 1991;61(3):319–328. doi:10.1111/j.2044-8279.1991.tb00989.x
6. Onwuegbuzie AJ, Leech NL. Assessment in statistics courses: more than a tool for evaluation. Ass Eva Higher Educ. 2003;28:115–127. doi:10.1080/02602930301670
7. Macher D, Papousek I, Ruggeri K, et al. Statistics anxiety and performance: blessings in disguise. Front Psychol. 2015;6:1116. doi:10.3389/fpsyg.2015.01116
8. Onwuegbuzie AJ, Daley CE. Perfectionism and statistics anxiety. Pers Individ Dif. 1999;26:1089–1102. doi:10.1016/S0191-8869(98)00214-1
9. Tobias S. Anxiety research in educational psychology. J Educ Psychol. 1979;71:573–582. doi:10.1037/0022-0663.71.5.573
10. Trassi AP, Leonard SJ, Rodrigues LD, et al. Mediating factors of statistics anxiety in university students: a systematic review and meta-analysis. Ann N Y Acad Sci. 2022;1512:76–97. doi:10.1111/nyas.14746
11. Macher D, Paechter M, Papousek I, et al. Statistics anxiety, state anxiety during an examination, and academic achievement. Br J Educ Psychol. 2013;83:535–549. doi:10.1111/j.2044-8279.2012.02081.x
12. Chiesi F, Primi C. Cognitive and non-cognitive factors related to students’ statistics achievement. Stat Educ Res J. 2010;9:6–26. doi:10.52041/serj.v9i1.385
13. Nasser FM. Structural model of the effects of cognitive and affective factors on the achievement of Arabic-speaking pre-service teachers in introductory statistics. J Statist Educ. 2017;12. doi:10.1080/10691898.2004.11910717
14. Lalonde RN, Gardner RC. Statistics as a second language? A model for predicting performance in psychology students. Can J Behav Sci. 1993;25:108–125. doi:10.1037/h0078792
15. Macher D, Paechter M, Papousek I, et al. Statistics anxiety, trait anxiety, learning behavior, and academic performance. Eur J Psychol Educ. 2011;27:483–498. doi:10.1007/s10212-011-0090-5
16. Paechter M, Macher D, Martskvishvili K, et al. Mathematics anxiety and statistics anxiety. shared but also unshared components and antagonistic contributions to performance in statistics. Front Psychol. 2017;8:1–13. doi:10.3389/fpsyg.2017.01196
17. Onwuegbuzie AJ. Academic procrastination and statistics anxiety. Ass Eva Higher Educ. 2004;29:3–19. doi:10.1080/0260293042000160384
18. Baloğlu M. Individual differences in statistics anxiety among college students. Pers Individ Dif. 2003;34:855–865. doi:10.1016/s0191-8869(02)00076-4
19. McClintock MK, Dale W, Laumann EO, et al. Empirical redefinition of comprehensive health and well-being in the older adults of the United States. Proc Natl Acad Sci USA. 2016;113:3071–3080. doi:10.1073/pnas.1514968113
20. Chew PK, Dillon DB. Statistics anxiety update: refining the construct and recommendations for a new research agenda. Perspect Psychol Sci. 2014;9:196–208. doi:10.1177/1745691613518077
21. Cruise R, Cash R, Bolton D. Development and Validation of an Instrument to Measure Statistical Anxiety.
22. Onwuegbuzie AJ, Daros D, Ryan JM. The components of statistics anxiety: a phenomenological study. Focus Learn Prob Math. 1997;19:11–35. doi:10.46743/2160-3715/2015.2101
23. Orbach L, Fritz A. A latent profile analysis of math anxiety and core beliefs toward mathematics among children. Ann NY Acad Sci. 2022;1509:130–144. doi:10.1111/nyas.14720
24. Borsboom D. Psychometric perspectives on diagnostic systems. J Clin Psychol. 2008;64:1089–1108. doi:10.1002/jclp.20503
25. Borsboom D. A network theory of mental disorders. World Psychiatry. 2017;16:5–13. doi:10.1002/wps.20375
26. Nilsson J, Carlsson Hauff J. Reducing statistics anxiety using limited teaching resources. J Int Educ Bus. 2018;11:312–323. doi:10.1108/JIEB-03-2018-0010
27. Ky H. Pre-Service Teachers’ Statistic Anxiety’s Level and the Influence Factors. Changchun: Northeast Normal University; 2010.
28. Finney SJ, Schraw G. Self-efficacy beliefs in college statistics courses. Contemp Educ Psychol. 2003;28:161–186. doi:10.1016/S0361-476X(02)00015-2
29. Fang LT, Shi K, Zhang FH. Research on reliability and validity of Utrecht work engagement scale-student. Chin J Clin Psychol. 2008;16:618–620. doi:10.16128/j.cnki.1005-3611.2008.06.023
30. Epskamp S, Cramer AOJ, Waldorp LJ, et al. qgraph: network visualizations of relationships in psychometric data. J Stat Softw. 2012;48:1–18. doi:10.18637/JSS.V048.I04
31. Siew CSQ, McCartney MJ, Vitevitch MS. Using network science to understand statistics anxiety among college students. Sch Teach Learn Psychol. 2019;5:75–89. doi:10.1037/stl0000133
32. van Borkulo C, Boschloo L, Borsboom D, et al. Association of symptom network structure with the course of corrected depression. JAMA Psych. 2015;72:1219–1226. doi:10.1001/jamapsychiatry.2015.2079
33. Baloğlu M, Deniz ME, Kesici Ş. A descriptive study of individual and cross-cultural differences in statistics anxiety. Learn Individ Differ. 2011;21:387–391. doi:10.1016/j.lindif.2011.03.003
34. Ralston K. Sociologists Shouldn’t Have to Study Statistics’: epistemology and anxiety of statistics in sociology students. Sociol Res Online. 2019;25:219–235. doi:10.1177/1360780419888927
35. Ralston K, Gorton V, MacInnes J, et al. Anxious women or complacent men? Anxiety of statistics in a sample of UK sociology undergraduates. Int J Soc Res Methodol. 2020;24:79–91. doi:10.1080/13645579.2020.1761186
36. Mji A. Differences in university students’ attitudes and anxiety about statistics. Psychol Rep. 2009;104:737–744. doi:10.2466/PR0.104.3.737-744
37. Zanakis SH, Valenzi ER. Student anxiety and attitudes in business statistics. J Educ Bus. 2010;73:10–16. doi:10.1080/08832329709601608
38. Eysenck MW, Derakshan N, Santos R, et al. Anxiety and cognitive performance: attentional control theory. Emotion. 2007;7:336–353. doi:10.1037/1528-3542.7.2.336
39. Harraway JA, Barker RJ. Statistics in the workplace: a survey of use by recent graduates with higher degrees. Stat Educ Res J. 2005;4:43–58. doi:10.52041/serj.v4i2.514
40. Pefanis Schlee R, Harich KR. Knowledge and skill requirements for marketing jobs in the 21st century. J Mark Educ. 2010;32:341–352. doi:10.1177/0273475310380881
41. Steglich C, Snijders TAB, Pearson M. Dynamic networks and behavior: separating selection from influence. Sociol Methodol. 2010;40:329–393. doi:10.1111/j.1467-9531.2010.01225.x
 © 2023 The Author(s). This work is published and licensed by Dove Medical Press Limited. The
full terms of this license are available at https://www.dovepress.com/terms
and incorporate the Creative Commons Attribution
- Non Commercial (unported, 3.0) License.
By accessing the work you hereby accept the Terms. Non-commercial uses of the work are permitted
without any further permission from Dove Medical Press Limited, provided the work is properly
attributed. For permission for commercial use of this work, please see paragraphs 4.2 and 5 of our Terms.
© 2023 The Author(s). This work is published and licensed by Dove Medical Press Limited. The
full terms of this license are available at https://www.dovepress.com/terms
and incorporate the Creative Commons Attribution
- Non Commercial (unported, 3.0) License.
By accessing the work you hereby accept the Terms. Non-commercial uses of the work are permitted
without any further permission from Dove Medical Press Limited, provided the work is properly
attributed. For permission for commercial use of this work, please see paragraphs 4.2 and 5 of our Terms.