Back to Journals » International Journal of Nanomedicine » Volume 19
Dissolving Microneedle-Based Cascade-Activation Nanoplatform for Enhanced Photodynamic Therapy of Skin Cancer
Authors Ma J, Tai Z ![]() , Li Y, Li Y, Wang J, Zhou T, Shen M, Xin R, Shen C, Zhu Q, Chen Z
, Li Y, Li Y, Wang J, Zhou T, Shen M, Xin R, Shen C, Zhu Q, Chen Z ![]()
Received 9 October 2023
Accepted for publication 23 February 2024
Published 5 March 2024 Volume 2024:19 Pages 2057—2070
DOI https://doi.org/10.2147/IJN.S443835
Checked for plagiarism Yes
Review by Single anonymous peer review
Peer reviewer comments 4
Editor who approved publication: Professor Eng San Thian
Jinyuan Ma,1,2,* Zongguang Tai,1,2,* Ying Li,1,2,* Yang Li,3 Jiandong Wang,1,2 Tao Zhou,1,2 Min Shen,1,2 Rujuan Xin,1,2 Cuie Shen,1,2 Quangang Zhu,1,2 Zhongjian Chen1,2
1Shanghai Skin Disease Hospital, School of Medicine, Tongji University, Shanghai, People’s Republic of China; 2Shanghai Engineering Research Center for Topical Chinese Medicine, Shanghai, People’s Republic of China; 3CAS Key Laboratory of Design and Assembly of Functional Nanostructures, Fujian Institute of Research on the Structure of Matter, Chinese Academy of Sciences, Fuzhou, People’s Republic of China
*These authors contributed equally to this work
Correspondence: Quangang Zhu; Zhongjian Chen, Shanghai Skin Disease Hospital, School of Medicine, Tongji University, 1278 Baode Road, Shanghai, 200443, People’s Republic of China, Tel/Fax +86 21 36803155 ; +86 21 36803007, Email [email protected]; [email protected]
Purpose: Photodynamic therapy (PDT) has been an attractive strategy for skin tumor treatment. However, the hypoxic microenvironment of solid tumors and further O2 consumption during PDT would diminish its therapeutic effect. Herein, we developed a strategy using the combination of PDT and hypoxia-activated bioreductive drug tirapazamine (TPZ).
Methods: TPZ was linked to DSPE-PEG-NHS forming DSPE-PEG-TPZ to solve leakage of water-soluble TPZ and serve as an antitumor agent and monomer molecule further forming the micellar. Chlorin e6 (Ce6) was loaded in DSPE-PEG-TPZ forming DSPE-PEG-TPZ@Ce6 (DPTC). To further improve tumor infiltration and accumulation, hyaluronic acid was adopted to make DPTC-containing microneedles (DPTC-MNs).
Results: Both in vitro and in vivo studies consistently demonstrated the synergistic antitumor effect of photodynamic therapy and TPZ achieved by DPTC-MNs. With laser irradiation, overexpressions of PDT tolerance factors NQO1 and HIF-1α were inhibited by this PDT process.
Conclusion: The synergistic effect of PDT and TPZ significantly improved the performance of DPTC-MNs in the treatment of melanoma and cutaneous squamous cell carcinoma and has good biocompatibility.
Keywords: photodynamic therapy, hypoxia activation, combination therapy, PDT enhancement
Graphical Abstract:

Introduction
Photodynamic therapy (PDT) has been an attractive strategy because of its spatiotemporal control effect and minimal invasiveness, playing an important role in clinical application especially in the region of skin tumor treatment. PDT employs reactive oxygen species (ROS) production to achieve effective cancer therapy through a reaction between photosensitizers and O2 presented in tumors triggered by laser irradiation. The delivery of photosensitizers is usually a pivotal point because of poor water solubility and insufficient tissue distribution of photosensitizers; thus, drug delivery systems are designed to expand the application of photosensitizers.
Owing to the heterogeneous phenotypic characteristics and distance from the blood vessels of solid tumors, a hypoxic microenvironment is a typical feature of solid tumors, and oxygen consumption during PDT may aggravate hypoxia, which affects the application of PDT. PDT-induced tissue hypoxia is a result of vascular damage and photochemical oxygen consumption. Many studies have attempted to improve the O2 supply in tumor treatment, for example, by suppressing glucose metabolism to retain adequate amounts of oxygen,1 directly transporting O2 via designed carriers to tumors2 and catalyzing H2O2 to produce O2 via a catalyzer.3,4 Besides, photodynamic therapy (PDT) combined with chemotherapy drugs that inhibit tumor hypoxia can also enhance the effectiveness and efficacy of anti-tumor therapy. For instance, Song et al developed amphiphilic nanoparticles by conjugating the photosensitive molecule Ce6 with PEG. These nanoparticles were utilized for the simultaneous delivery of cisplatin and metformin, a drug commonly used to treat diabetes. Metformin enhances sensitivity to tumor therapy by inhibiting tumor hypoxia induced by nuclear factor kpab signaling. This innovative approach has demonstrated the ability to effectively eradicate tumors both in vitro and in vivo through hypoxia-targeted multimodal therapy.5
In addition, there is an alternative approach: the use of bioreducing drugs, such as telaprazine (TPZ), which can selectively induce the production of cytotoxic substances only in hypoxic conditions. TPZ specifically targets mildly hypoxic tissues, while remaining non-toxic to normal tissue. Interestingly, TPZ exhibits 300 times higher toxicity in hypoxic conditions compared to aerobic conditions. TPZ has already undergone a Phase II/III clinical trial for squamous cell carcinoma of the head and neck. However, the clinical results indicate that not all patients benefit equally due to variations in hypoxia levels among different tumor sites and different types of tumors.6 By the combination of TPZ and photosensitizers, PDT-induced hypoxia can further activate TPZ, leading to the accurate destruction of solid tumors. For example, Zhang et al developed a novel semiconducting molecule (ITTC) with excellent photostability, high photothermal conversion efficiency and good 1O2 generation ability and combined it with TPZ to achieve chemotherapy after oxygen consumption by the photodynamic therapy of ITTC nanoparticles.7 However, the problem of drug leakage during the delivery of water-soluble drug also need to be solved. Thus, to prevent the leakage of soluble TPZ and achieve simultaneous administration of TPZ and Ce6, Ce6 was loaded into DSPE-PEG to prepare nano assemblies (DPC), and TPZ was connected with DSPE-PEG-NHS to further prepare DSPE-PEG-TPZ@Ce6 nano assemblies (DPTC). The most common and the second most common skin cancers—melanoma and cutaneous squamous cell (cSCC), respectively—were selected as the skin tumor models for the present study.8,9 Upon 660-nm laser illumination, DPTC showed obvious inhibition of the growth of both melanoma and cutaneous squamous cell carcinoma (cSCC) models.
Hypoxia-inducible factor-1a (HIF-1a) is a major transcription factor involved in angiogenesis, hematopoiesis, and anaerobic energy metabolism, which allows tumor cells to adapt to hypoxia and promote their proliferation.10 In normoxic cells, HIF-1a is continuously degraded. However, in hypoxic cells, it translocates to the nucleus and heterodimerizes with HIF-1b. The formed HIF-1 protein can activate hypoxia-responsive genes, such as vascular endothelial growth factor, growth factors, and glycolytic enzymes,11 which could be considered as compensatory mechanisms that allowed tumor cells to escape from hypoxic stress.12 NAD(P)H-quinone oxidoreductase 1 (NQO1) is overexpressed in many tumors including melanoma.13 The upregulation of NQO1 was reported to protect cells against various cytotoxic quinones and oxidative stress.14 Recently, NQO1 was found to directly bind to the oxygen-dependent domain of HIF-1a and inhibit the proteasome-mediated degradation of HIF-1a.14 Thus, strategies to reduce NQO1 activity in cancer cells along with the combination therapy of bioreductive drugs might be promising.15
Melanoma is one of the most aggressive and dangerous types of skin cancers. In the United States, the incidence of melanoma ranks the fifth in cancer incidence. The mortality rate of melanoma is 64% of skin tumors. Melanoma easily becomes resistant to conventional therapies such as radiotherapy and chemotherapy. In recent years, targeted therapy and immunotherapy drugs have been developed rapidly for clinical applications in melanoma treatment; however, these drugs continue to show a low response rate.16 The incidence of cSCC has been increasing worldwide and surgical resection, radiotherapy, chemotherapy, immunotherapy, as well as biological therapy have remained relatively common treatments.8,17,18 However, topical treatment can still be an important and direct therapeutic modality besides those system treatment with rather high compliance and minimized systemic adverse effects.19,20 Moreover, transdermal delivery technology can help realize precise delivery of therapeutic agents into skin tumor lesions.21 However, stratum corneum is considered as a barrier for drug penetration.22 Traditional means of improving transdermal drug delivery include chemical penetration enhancers,23 electroporation,24 iontophoresis,25 nanoemulsions,26 liquid crystals,1 and transfersomes27 among others. Specifically, microneedles (MNs) can help directly pierce the stratum corneum to allow painless delivery of photosensitizers to the solid portion of the skin tumor. Accordingly, we chose hyaluronic acid (HA) as a material for our soluble MNs to integrate DPTC (or DPC) for better tissue penetration.28 DPTC-containing HA MNs (DPTC-MNs) were finally developed to achieve sufficient accumulation of photosensitizers in tumors and avoid systemic phototoxicity, which may be caused by its distribution throughout the body. We subsequently investigated the effective internal logical mechanism of DPTC, antitumor effects and biocompatibility, and regulation of NQO1 and HIF-1α after treatment with DPTC, providing clues for possible clinical treatment of skin tumors (Figure 1).
 |
Figure 1 Schematic illustration of DPTC-MNs for topical treatment of skin tumor. (A) Preparation route of DPTC. (B) Application of DPTC-MNs and topical delivery of DPTC. (C) Synergistic effect of PDT and TPZ significantly improved the performance of DPTC-MNs in the treatment of skin tumor. |
Materials and Methods
Regent and Materials
TPZ and coumarin 6 were purchased from Sigma-Aldrich (Shanghai, China). Ce6 was purchased from Frontier Scientific (Logan, UT). HA (molecular weight [Mw], 10 kDa) was obtained from Freda Biochem Co., Ltd. (Shandong, China). DSPE-PEG-NHS and DSPE-PEG-OCH3 were obtained from Ponsure Biotechnology. All chemicals were of analytical reagent grade and available from commercial sources. Milli-Q water was used throughout this study. Dulbecco’s modified Eagle’s medium (DMEM), fetal bovine serum (FBS), and PBS were obtained from Gibco (Grand Island, USA). DAPI, Lyso-Tracker Red, and Mito-Tracker Red were bought from Beyotime Biotech. Inc., (Shanghai, China).
Cell Culture
Melanoma B16 cells and cutaneous squamous carcinoma were both obtained from Hunan Fenghui Biotechnology Co., Ltd. (China). Melanoma B16 cells were cultured in DMEM supplemented with 10% FBS, penicillin (100 units/mL), and streptomycin (100 μg/mL). Cutaneous squamous carcinoma SCL-1 cells were cultured in RPMI1640 supplemented with 10% FBS, penicillin (100 units/mL), and streptomycin (100 μg/mL). Both cells were cultured in a humid atmosphere containing 5% CO2 at 37°C.
Animals
Female Balb/c nude mice (4–6 weeks old) were purchased from Shanghai JieSiJie Laboratory Animal Co., Ltd. (Shanghai, China). All procedures performed were in accordance with Tongji University’s guidelines for the welfare of experimental animals. The animal study was approved by the ethics committee of Shanghai Skin Disease Hospital (Approval number: 2020–002).
Preparation and Characterization of DSPE-PEG-TPZ
TPZ was attached to DSPE-PEG-NHS via the amidation reaction between NHS and amino of TPZ. Briefly, DSPE-PEG-NHS and TPZ were mixed in dimethylformamide (DMF) and kept stirred for 48 h. Then, the mixture was transferred into a dialysis bag with Mw cutoff of 3500 kd and dialyzed with 1 L of Milli-Q water to eliminate the unreacted TPZ for 48 h. The dialysate was changed every 2 h. The yellow product was finally collected, lyophilized, and then stored at −20°C.
Preparation and Characterization of DPC, DPTC, and DPTC6 NPs
First, 1 mg of L-Ce6 was dissolved in 100 μL of DMF to formulate into 10 mg/mL. The C6 solution was prepared with 1 mg of C6 dissolved into 1 mL of ethyl alcohol. DSPE-PEG-TPZ (5 mg) and Ce6 (50 μL, 10 mg/mL) were mixed in 500 μL of methylene dichloride at a mass ratio of 10:1. Then, the mixture was added to 2 mL of double distilled water. An emulsion was formed via ultrasonic emulsification and then stirred for at least 3 h to evaporate the methylene dichloride. Finally, the DPTC was formed. DPC and DPTC6 were fabricated similarly, except that DSPE-PEG-TPZ was replaced by DSPT-PEG-OCH3 in the former one, and 50 μL of the Ce6 solution prepared was replaced by the C6 solution (1 mg/mL). The TEM images of those NPs were captured by a Tecnai G2 spirit (Thermo FEI). The NP solutions (0.25 mg/mL) were dipped onto a copper grid, stained with uranyl acetate solution (2wt %), and dried at room temperature until imaging. The hydrodynamic diameters of freshly prepared solutions of NPs were assessed using a Malvern Nano-ZS90 instrument (Malvern Instruments, Malvern, UK) at 25°C.
Fabrication and Morphological Analyses of DPC-MNs, DPTC-MNs, and DPTC6-MNs
A polydimethylsiloxane (PDMS) micromold with a base diameter of 200 μm and the height of each needle cavity of 600 μm were utilized. These needle cavities were arranged in a 10×10 array with a tip-to-tip distance of 500 μm. To fabricate the DPTC-MNs, 1 mL of the aqueous solutions of DPTC (equivalent to 0.25 mg/mL Ce6) and 200 mg of HA were well-mixed, and 100 μL of the mixture was deposited on the PDMS micromold, followed by centrifugation at 4000 rpm for 10 min to force the mixture into the needle voids. The micromold containing the mixture was placed in a desiccator at room temperature overnight. The process was repeated with another 100 μL added. Finally, the dried DPTC-MN patch was formed and carefully detached from the micromold. DPC-MNs and DPTC6-MNs were fabricated similarly, except that DPTC was replaced by DPC or DPTC6. The morphology of those MN patches was determined through SEM (TM-1000, Hitachi) and stereomicroscopy (SMZ18, Nikon).
Intracellular Uptake Evaluation
The intracellular uptake of DPC and DPTC with the equivalent Ce6 concentration (0.5 μg/mL) was imaged by CLSM. B16 or SCL-1 cells were seeded in 12-well dishes at a density of 2×10⁵ cells/well with cell slide. After 24 h of incubation, a fresh medium without FBS containing free Ce6, DPC or DPTC was added. Cells were incubated for 1 or 4 h. Subsequently, the supernatant was removed, and cells were rinsed with PBS three times. Finally, cells were fixed with 4% paraformaldehyde and counterstained with DAPI for CLSM observations (FV3000, Olympus, Japan). B16 or SCL-1 cells were seeded in 6-well dishes at a density of 5×10⁵ cells/well. Fresh medium without FBS containing DPTC6 was added at different times followed by digestion. Cells were washed with PBS and centrifuged at 1200 rpm for 5 min for three cycles. Then cells were resuspended for detection of intracellular fluorescence of C6 via flow cytometry (Cytoflex, Beckman). For Co-localization assay, DPTC (2.5μg/mL) was incubated with B16 or SCL-1 cells for 4 h. Then the cells were subjected to fresh medium containing 75 nM Lyso-Tracker Red or Mito-Tracker Red for 60 min followed by rinsed with PBS, counterstained with DAPI for CLSM observations.
In vitro ROS Generation of DPC and DPTC
ROS generation was detected using DCFH-DA, a ROS-sensitive fluorescence sensor. B16 cells were seeded at a density of 5×10⁴ cells/well. After 24 h with cells adhering to the wells, the medium was replaced by a new medium without FBS containing PBS or DPTC. Cells were then incubated for 4 h, and a DCFH-DA-containing medium (10 μM) was added and then incubated for another 30 min. Later, the cells were irradiated with a 660-nm laser at 75 mW/cm2 for 1 min. Finally, the intracellular fluorescence of DCF was observed by VS200 (Olympus).
In vitro Cytotoxicity Assays
CCK-8 was used to evaluate the cytotoxicity of DSPE-PEG-TPZ NPs, DPC, and DPTC. Briefly, B16 or SCL-1 cells were seeded into 96-well plates at a density of 5×10³ cells/well and incubated at 37°C for 24 h. Cells were then treated with serial dilutions of DSPE-PEG-TPZ NPs, DPC, and DPTC for 4 h in a fresh medium without FBS. Then, the cells were irradiated with a 660-nm laser at 75 mW/cm2 for 1 min. The untreated cells were taken as controls. After incubation for another 20 h, the cell medium was replaced by 100 μL of a blank medium without FBS containing 10 μL of theCCK-8 solution. After incubation for another 1 h, the absorbance of the CCK8 was determined at 450 nm using a microplate reader (Multiskan FC, Thermo Fisher Scientific). The relative percentage of the untreated cells was adjusted to represent 100% cell viability.
Expression of NQO1 and HIF-1α
B16 or SCL-1 cells were seeded in 6-well dishes at a density of 5×10⁵ cells/well. After 24 h of incubation, a fresh medium without FBS containing DPC or DPTC (concentration of Ce6 was 0.266 μg/mL) was added. The cells were incubated for another 4 h and then irradiated with a 660-nm laser at 75 mW/cm2 for 1 min. Cells were incubated for another 24 h and then harvested in a lysis buffer, sonicated, and centrifuged for 5 min at 12,000 g. The BCA assay was adopted to determine the protein concentration of the supernatant. Sodium dodecyl sulfate−poly-acrylamide gel electrophoresis (SDS-PAGE) was performed, and proteins on gels were then transferred to polyvinylidene difluoride membranes and blocked with 5% nonfat milk in TBST (pH 8.0) buffer for 1 h. After incubation with primary and secondary antibodies, the blots were visualized with the ECL Plus Western blotting detection reagents.
Establishment of the B16 and SCL-1 Xenograft Model
The study was approved by the Animal Ethics Committee of Tongji University. To establish the xenograft mouse model, B16 (5 × 10⁵) or SCL-1 (106) cells were inoculated subcutaneously into the right flanks of Balb/C nude mice. At 1 (B16) or 2 (SCL-1) weeks later, the tumor diameter can be approximately 6 mm. Tumor-bearing mice could be included for further experiments.
Skin Insertion Capacity Evaluation
To evaluate the skin insertion and infiltration capacity, DPTC6-MNs were applied to the tumor region of B16 or SCL-1 tumor-bearing mice for 24 h until the DPTC6-MNs dissolved. The mouse was anesthetized, and the tumor was separated, embedded in OCT compound, frozen, and sectioned into 5 μm-thick serial slices perpendicular to the skin (Leica Microsystems). Skin sections were then examined under a digital slide scanner to evaluate the fluorescence intensity and distribution of C6 (VS200, Olympus). DPTC6 aqueous solutions were also smeared topically in the tumor area or injected via the tail vein both at the equivalent dose of C6, and the tumors were separated for comparison.
Antitumor Efficacy and in vivo Safety Evaluation of DPC and DPTC
Tumor-bearing mice were randomly assigned into four groups (n = 5 for each group), namely, untreated group, DPC + laser group, DPTC + laser group, and DTPC group. The last three groups of mice were anesthetized and administered with DPC or DPTC. A patch of DPC or DPTC containing approximately 50μg of Ce6 was pressed on the tumor to insert from the skin surface for 24 h until the MNs dissolved. Subsequent, in the DPC + laser and DPTC + laser groups, the tumor areas of mice were treated with 660-nm laser at 75 mW/cm2 for 5 min every day. The DPTC (without irradiation) and untreated groups (without any treatment) served as controls. The tumor volume of each mouse was measured with a caliper and recorded and calculated every day using the following formula:  . Body weight of mice was also recorded for in vivo safety evaluation. After 14 days, the mice were sacrificed, and the major organs and tumor tissues of mice were collected.
Histological and Immunofluorescence Staining
Major organs (such as the heart, liver, spleen, lung, and kidney) and tumors were harvested from the mice in different groups after 14 days of treatment and fixed with formaldehyde (4%, w/v). After dehydration, the fixed tissues were subsequently embedded in paraffin, and sections of 5-μm thickness were prepared for H&E staining and then visualized under a microscope (Olympus IX53, Japan). Apoptosis of tumor sections was also assessed with a TUNEL and DAB kit and observed under a microscope (Olympus IX53, Japan).
Statistical Analysis
All results are presented as mean ± standard deviation. The statistical significance of measurements was evaluated by One-Way ANOVA. The threshold for statistical significance was as follows: *p < 0.05; **p < 0.01; ***p < 0.001. All statistical analyses were carried out with Prism (PRISM 6.0, GraphPad Software).
Results and Discussion
Fabrication and Characterization of DPC and DPTC
DSPE-PEG-TPZ was synthesized by an amide reaction between DSPE-PEG-N-hydroxysuccinimide (NHS) and TPZ (Figure 2A) and FT-IR spectrum and 1H-NMR spectra spectrum (Figures S1 and S2) indicated the successful connection of DSPE-PEG-NHS and TPZ by amide bond. Ultrasonic emulsification was utilized to form DSPE-PEG-TPZ@Ce6 (DPTC) with the final mass ratio of DSPE-PEG-TPZ and Ce6 of 10:1. The loading capacity of TPZ and Ce6 were calculated to be 0.16% and 6.21%, respectively.
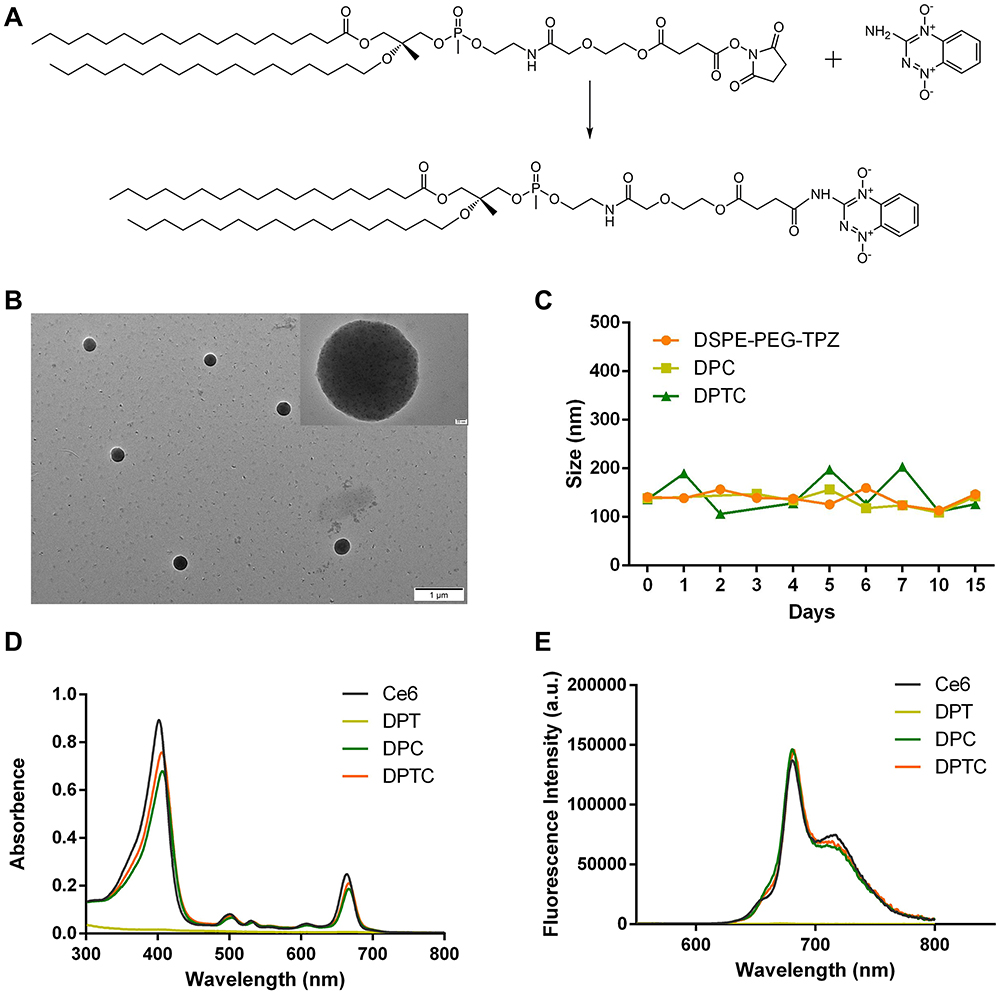 |
Figure 2 Construction and characterization of DPTC. (A) Composition of DSPE-PEG-TPZ. (B) TEM images of DPTC. (C) Size distribution of DSPE-PEG-TPZ NPs, DPC, and DPTC. (D) UV–vis spectrum of Ce6, DPT, DPC, and DPTC after demulsification. (E) Fluorescence spectrum of Ce6, DPT, DPC, and DPTC after demulsification. |
DSPE-PEG@Ce6 (DPC) was also prepared by a similar method, except that DSPE-PEG-TPZ was replaced by an equal mass of DSPE-PEG-OCH3. Transmission electron microscopy (TEM) images showed that the DPTC and DPC nanoparticles (NPs) were both spherical, with particle sizes between 100 nm and 200 nm (Figures 2B and S3), which correlated with the hydrodynamic diameters determined by dynamic light scattering (DLS) measurement as ~142.7 nm and ~126.6 nm. DLS was adopted to observe the short-term stability of DSPE-PEG-TPZ, DPC, and DPTC for 15 days. Results showed good stability in phosphate-buffered saline (PBS) (Figure 2C). UV-vis-NIR absorption spectra and fluorescence spectra confirmed the formations of DPC and DPTC (Figure 2D and E).
Fabrication and Characterization of DPC-MNs and DPTC-MNs
DPC or DPTC was integrated into fast-dissolving HA MNs forming DPC or DPTC patch containing equivalently approximately 0.05 mg of Ce6 per patch, and the MNs were arranged in a 10×10 array. This showed the differences between blank HA MNs and DPTC-MNs, of which the latter was green, showing that the DPTC was successfully loaded (Figure 3A). With photon microscopy and scanning electron microscopy (SEM), the DPTC-MNs were pyramid-shaped, with a needle height of 495.1 ± 2.9 μm and a base diameter of 293.2 ± 4.5 μm (Figure 3B and C).
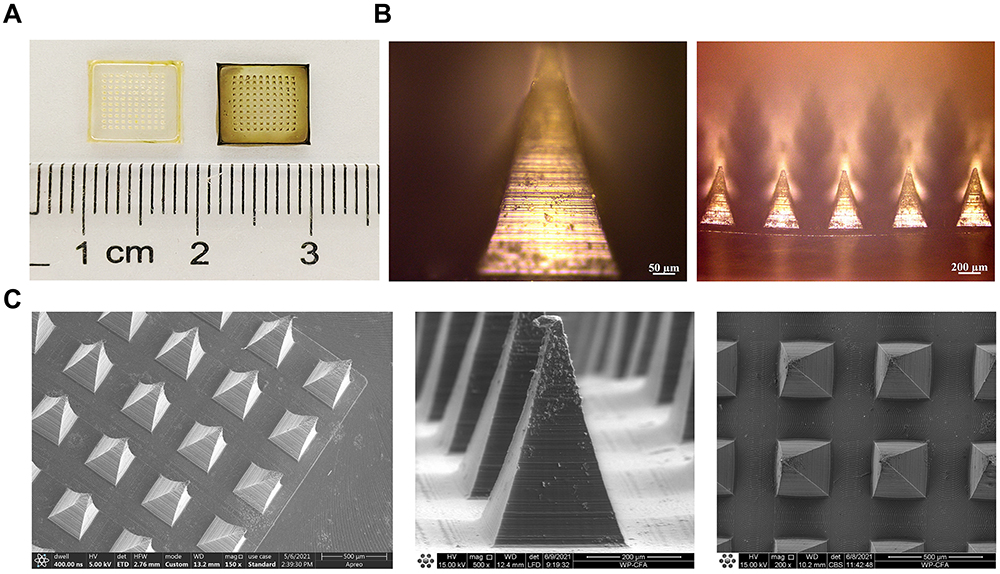 |
Figure 3 Image acquisition of DPTC-MNs. (A) Blank HA MN and DPTC-MNs. (B) Photon microscope images of DPTC-MNs. (C) SEM images of DPTC-MNs. |
Cellular Uptake and Cytotoxicity of DPTC
Confocal microscopy (CLSM) and flow cytometry were utilized to investigate the cellular uptake behaviors of DPTC by B16 melanoma cells and cutaneous squamous carcinoma cells of SCL-1. The CLSM image showed that the red fluorescence intensity in B16 (Figures 4A and S4) and SCL-1 (Figures 4B and S5) cells was stronger after 4 h of treatment by DPC or DPTC than 1 h. However, no red fluorescence was observed in the blank control. The red fluorescence intensity in B16 or SCL-1 cells treated with DPTC were also higher than free Ce6 after 4 h incubation (Figures S6 and S7). Flow cytometry also revealed time-dependent enhancement of the red fluorescent intensity of DPTC6 (Figure 4C). As shown in Figure 4D and E, DPTC was localized in the cytoplasm. The red fluorescence of DPTC and the fluorescence of mitochondria or lysosomes were mostly located in the same region. The co-localization index of fluorescence between mitochondria and DPTC was calculated to be 0.795 and 0.706 in B16 and SCL-1 cells, respectively. Additionally, the co-localization index of fluorescence between lysosomes and DPTC were calculated to be 0.717 and 0.812 in B16 and SCL-1 cells, respectively.
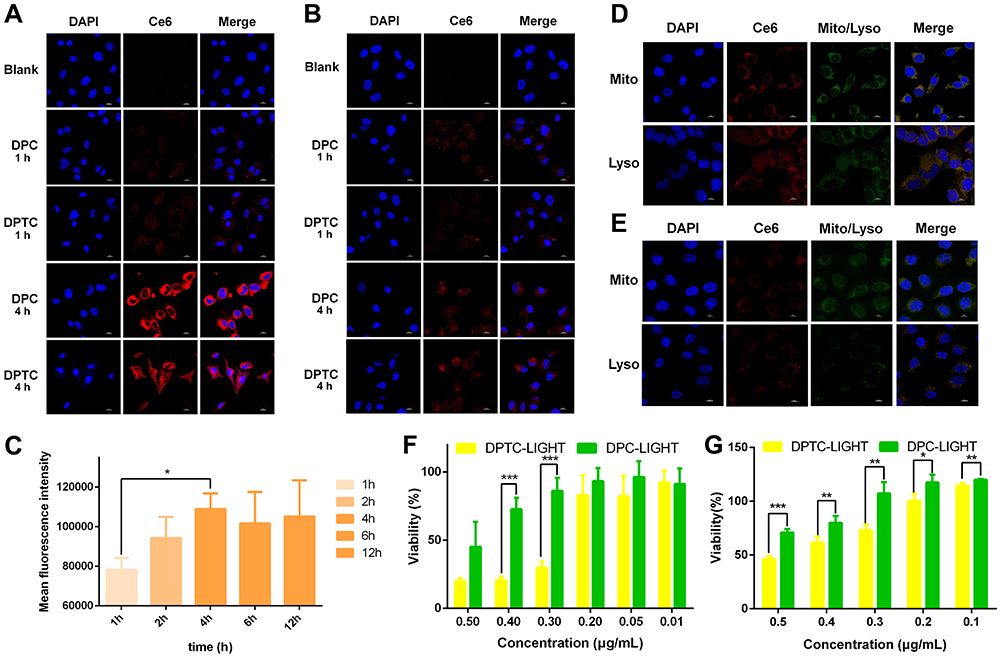 |
Figure 4 Cellular uptake and cytotoxicity determined on B16 and SCL-1 cells. (A) CLSM images of B16 cells treated with DPT or DPTC for 1 h and 4 h (×1000). (B) CLSM images of SCL-1 cells treated with DPT or DPTC for 1 h and 4 h (×1000). The scale bar represents a length of 10 μm. (C) Flow cytometry of B16 cells treated with DPTC6. (*p < 0.05, **p < 0.01, and ***p < 0.001). (D) Colocalization of DPTC and mitochondria or lysosome in B16 cells. (E) Colocalization of DPTC and mitochondria or lysosome in SCL-1 cells. The scale bar represents a length of 10 μm. (F) Cytotoxicity of DPTC investigated on B16 cells. (G) Cytotoxicity of DPTC investigated on SCL-1 cells. *p < 0.05, **p < 0.01, and ***p < 0.001. |
Cell Counting Kit-8 (CCK-8) was used to investigate the cytotoxicity of DSPE-PEG-TPZ NPs, DPC, and DPTC against B16 and SCL-1 cells under 660-nm laser with an intensity of 75 mW/cm2 for 1 min in an obviously concentration-dependent manner. In B16 cells, the viability of DPC was higher than that of DPTC in each concentration if irradiated by laser. The IC50 values of DPC and DPTC were 0.8179 and 0.2559 μg/mL, respectively (Figure 4F). In SCL-1 cells, with laser irradiation, both DPC and DPTC showed a concentration-dependent cell-killing effect, with IC50 values of approximately 0.5764 and 0.4640 μg/mL of DPC and DPTC, respectively (Figure 4G). DPTC showed significantly higher cytotoxicity than DPC for TPZ activation caused by a PDT-triggered hypoxic state. However, DSPE-PEG-TPZ NPs exhibited minimal harm to cells, with or without laser treatment, under normoxic conditions. However, under hypoxic conditions, concentration-dependent toxicity was observed in both B16 and SCL1 cells (Figures S8–S10). Free Ce6 showed significantly lower cytotoxicity to B16 (Figure S11) and SCL-1 (Figure S12) cells. DPTC demonstrated negligible harm to normal HaCat cells in the absence of light, indicating good biosafety (Figure S13).
ROS Generation and Expression of NQO1 and HIF-1α
We used the 2′,7′-dichlorofluorescein diacetate (DCFH-DA) probe to detect ROS levels in B16 cells. DCFH can react with intracellular ROS to generate the green fluorescent product DCF, which could not spread out of cells. The fluorescence intensity of DCF was significantly higher in the DPTC group irradiated with a laser than the other three circumstances, including the DPTC group without laser and the two PBS groups. It indicated that DPTC (and DPC) could increase the production of intracellular ROS after 660-nm laser irradiation (Figure 5A).
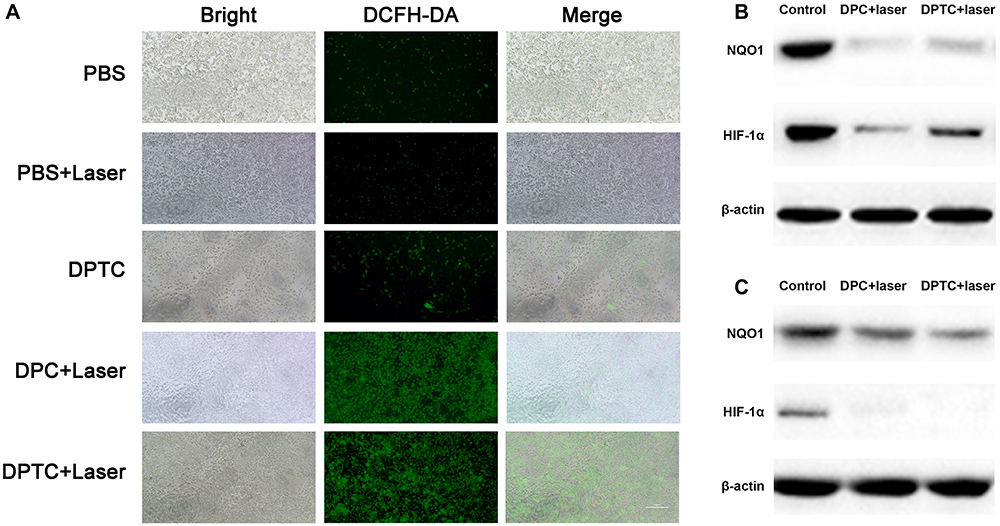 |
Figure 5 Synergistic mechanisms of DPTC. (A) Fluorescent images of intracellular ROS levels with different treatments of DPTC in B16 cells. The scale bar represents a length of 100 μm. Western blot results of NQO1 and HIDF-1α on (B) B16 cells and (C) SCL-1 cells. |
Loredana et al investigated the regulation of NQO1 expression after PDT. Although PDT was expected to induce NQO1 expression,15,29 the normalized fold expression tended to become lower than the baseline 3 h after treatment.30 The expression of NQO1 in B16 and SCL-1 cells was verified by Western blot. The expressions in the DPC and DPTC groups were significantly lower than those in the others. NQO1 inhibits proteasome-mediated degradation of HIF-1α. NQO1 knockdown was dedicated to suppressing HIF-1 signaling and tumor growth in some cell lines.10 In B16 and SCL1 cells, HIF-1α downregulation was also observed in DPC and DPTC (Figure 5B and C). Conceivably, DPC- or DPTC-induced PDT process might suppress NQO1 expression, thus downregulating HIF-1α that activate hypoxia-responsive genes allowing tumor survival12 and destroying the defense of tumor cells against oxidative stress.31
Infiltration Behavior of DSPE-PEG-TPZ-Based NPs and MNs
To evaluate the infiltration of DSPE-PEG-TPZ-based NPs, coumarin 6 was loaded instead of Ce6 forming DSPE-PEG-TPZ@coumarin 6 (DPTC6) to work as a tracer of NPs under a fluorescence microscope. DPTC6 was administered through HA MNs (DPTC6 MNs) or given by DPTC6-containing aqueous solution topically. After treatment for 24 h in both B16 and SCL-1 models, coumarin 6 fluorescence signals were detected throughout the skin and deep into the tumor of mice treated with DSPE-PEG-TPZ@C6 MNs (Figure 6A and B), whereas only a small amount of coumarin 6 fluorescence was observed in B16 or SCL-1 tumor of mice treated with DSPE-PEG-TPZ@C6 aqueous solution, especially accumulating in the skin corneum and hair follicles (Figure 6C and D), indicating that the MNs could help penetrate the skin effectively and DSPE-PEG-TPZ-based NPs could infiltrate solid tumors. Besides, DPTC6 was injected in the vein in SCL-1 tumor-bearing mouse. However, the DPTC6 fluorescence intensity appeared to be lower than that of DPTC6 MNs. Moreover, the fluorescence was more obvious in a deep solid tumor area than in the skin, which might be due to the enhanced permeability and retention effect of NPs (Figure S14).
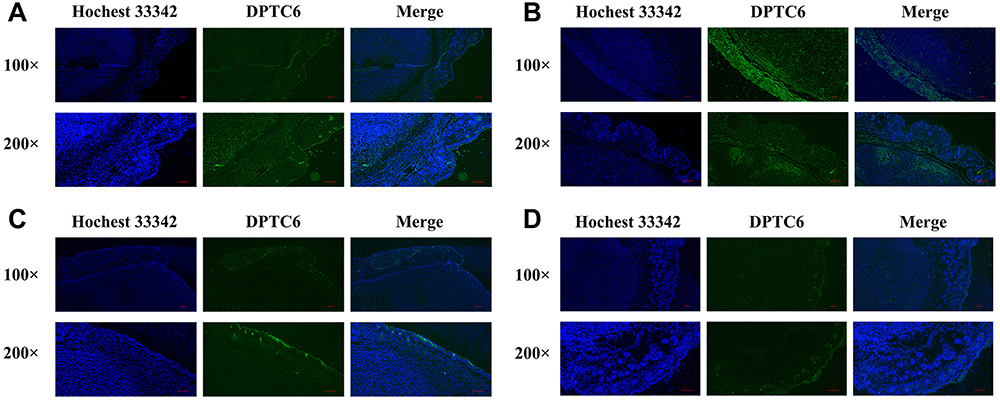 |
Figure 6 Fluorescence signal distribution on xenograft tumors. DSPE-PEG-TPZ@C6 MNs was administered to B16 (A) and SCL-1 (B) xenograft tumors. DPTC6-containing aqueous solution was administered to B16 (C) or SCL-1 (D) xenograft tumors. |
In vivo Antitumor Effects and Biosafety of DPC and DPTC
The in vivo anticancer efficacy and biosafety of B16 and SCL-1 xenograft mice were investigated with the regimen illustrated in Figure 7A. During 14 days of treatment, the DPC + laser group and the DPTC + laser group showed significant inhibition of tumor growth compared with the untreated group. However, no significant difference was found between the two groups, although the in vitro experiments can exaggerate the difference. The effect of PDT was too strong to cover up the chemotherapy effect of TPZ. Without laser, the antitumor effect could not be triggered in the DPTC group (Figure 7B). As shown in Figure 7C, the body weight of mice from all groups remained almost stable in 14 days. The treatment was relatively safe for mice. The same results could be observed in SCL-1 cells (Figure 7D and E). The apoptosis of tumors was evaluated using hematoxylin and eosin (H&E) and terminal-deoxynucleotidyl transferase-mediated dUTP-biotin nick end labeling (TUNEL) staining. As shown in Figure 8A, the weakest cell proliferation and the most severe apoptosis and necrosis were observed in DPC + laser and DPTC + laser groups, which were consistent with the therapeutic outcomes. The same results could be observed in SCL-1 cells (Figure 8B). Furthermore, H&E staining of major organs, such as the heart, liver, spleen, lung, and kidney, showed no obvious damage in the B16 tumor-bearing mice compared with the control group, suggesting that DPTC has good biocompatibility (Figure S15).
 |
Figure 7 In vivo therapeutic efficacy of DPC-MNs and DPTC-MNs on B16 tumor-bearing mice. (A) Treatment regimen of tumor-bearing mice. (B) Relative tumor volume curves of B16 tumor-bearing mice after various treatments in 14 days (*p < 0.05, **p < 0.01, and ***p < 0.001). (C) Body weight trend of B16 tumor-bearing mice after during 14 days of treatment. (D) Relative tumor volume curves of SCL-1 tumor-bearing mice after various treatments in 14 days (*p < 0.05, ***p < 0.001). (E) Body weight trend of SCL-1 tumor-bearing mice during 14 days of treatment. |
 |
Figure 8 The histological analysis of tumors. (A) H&E and TUNEL staining images of B16 tumor slides from different groups after 14 days of treatment. (B) H&E and TUNEL staining images of SCL-1 tumor slides from different groups after 14 days of treatment. Scale bar: 50 μm. |
Conclusion
DPTC-MNs were designed and used as an effective platform for B16 and SCL-1 skin tumors. The well-designed DPTC nanoplatform presented a powerful therapeutic effect on hypoxic tumors by the combination of PDT- and PDT-triggered hypoxic response of TPZ. In vitro and in vivo studies consistently demonstrated the remarkable antitumor effect of DPTC. MNs can help the DPTC to better accumulate at tumor sites for targeted therapy while causing less toxicity to normal tissues, making DPTC-MNs attractive for skin tumor therapy.
Abbreviations
CLSM, Confocal microscopy; DLS, Dynamic light scattering; DMEM, Dulbecco’s modified Eagle’s medium; DPTC: DSPE-PEG-TPZ forming DSPE-PEG-TPZ@Ce6; DPTC-MNs: DPTC-containing microneedles; FBS, Fetal bovine serum; H&E, Hematoxylin and eosin; HA, Hyaluronic acid; MNs, Microneedles; NHS, N-hydroxysuccinimide; PBS, Phosphate-buffered saline; ROS, Reactive oxygen species; SEM, Scanning electron microscopy; TEM, Transmission electron microscopy.
Acknowledgments
This work was supported by the National Natural Science Foundation of China [grant numbers 82003295, 82172706, 82073385], the Science and Technology Commission of Shanghai Municipality [grant numbers 20DZ2255200, 21S21900900, 22S21902700, 23S11901300], and Shanghai Sailing Program [grant number 19YF1443700].
Disclosure
The authors report no conflicts of interest in this work.
References
1. Su Y, Lu K, Huang Y, et al. Targeting Warburg effect to rescue the suffocated photodynamic therapy: a cancer-specific solution. Biomaterials. 2023;294:122017. doi:10.1016/j.biomaterials.2023.122017
2. Gong X, Li J, Xu X, et al. Microvesicle-inspired oxygen-delivering nanosystem potentiates radiotherapy-mediated modulation of tumor stroma and antitumor immunity. Biomaterials. 2022;290:121855. doi:10.1016/j.biomaterials.2022.121855
3. Yu H, Cheng Y, Wen C, Sun YQ, Yin XB. Triple cascade nanocatalyst with laser-activatable O(2) supply and photothermal enhancement for effective catalytic therapy against hypoxic tumor. Biomaterials. 2022;280:121308. doi:10.1016/j.biomaterials.2021.121308
4. Zhao Z, Wang W, Li C, et al. Reactive oxygen species–activatable liposomes regulating hypoxic tumor microenvironment for synergistic photo/chemodynamic therapies. Adv Funct Mater. 2019;29(44):1905013. doi:10.1002/adfm.201905013
5. Song C, Tang C, Xu W, et al. Hypoxia-targeting multifunctional nanoparticles for sensitized chemotherapy and phototherapy in head and neck squamous cell carcinoma. Int j Nanomed. 2020;15:347–361. doi:10.2147/ijn.S233294
6. Marcu L, Olver I. Tirapazamine: from bench to clinical trials. Curr Clin Pharmacol. 2006;1(1):71–79. doi:10.2174/157488406775268192
7. Zhang G, Wang W, Zou H, et al. Novel semiconducting nano-agents incorporating tirapazamine for imaging guided synergistic cancer hypoxia activated photo-chemotherapy. J Mat Chem B. 2021;9(26):5318–5328. doi:10.1039/d1tb00659b
8. Knackstedt TJ, Knackstedt RW, Djohan M, Djohan R, Gastman BR, Crowe DR. New developments in the management of cutaneous squamous cell carcinoma. Plast Reconst Surg. 2021;147(3):492–504. doi:10.1097/PRS.0000000000007678
9. Waldman A, Schmults C. Cutaneous squamous cell carcinoma. Hematol Oncol Clin N Am. 2019;33(1):1–12. doi:10.1016/j.hoc.2018.08.001
10. Ji Z, Yang G, Shahzidi S, et al. Induction of hypoxia-inducible factor-1alpha overexpression by cobalt chloride enhances cellular resistance to photodynamic therapy. Cancer Lett. 2006;244(2):182–189. doi:10.1016/j.canlet.2005.12.010
11. Brahimi-Horn MC, Pouysségur J. The hypoxia-inducible factor and tumor progression along the angiogenic pathway. Int Rev Cytol. 2005;242:157–213. doi:10.1016/s0074-7696(04)42004-x
12. Ratcliffe PJ, O’Rourke JF, Maxwell PH, Pugh CW. Oxygen sensing, hypoxia-inducible factor-1 and the regulation of mammalian gene expression. J Exp Biol. 1998;201(Pt 8):1153–1162. doi:10.1242/jeb.201.8.1153
13. Zhang K, Chen D, Ma K, Wu X, Hao H, Jiang S. NAD(P)H: Quinone Oxidoreductase 1 (NQO1) as a therapeutic and diagnostic target in cancer. J Med Chem. 2018;61(16):6983–7003. doi:10.1021/acs.jmedchem.8b00124
14. Oh ET, Kim JW, Kim JM, Kim SJ, Lee JS. NQO1 inhibits proteasome-mediated degradation of HIF-1α. Nat Commun. 2016;7:13593. doi:10.1038/ncomms13593
15. Lamberti MJ, Morales Vasconsuelo AB, Chiaramello M, et al. NQO1 induction mediated by photodynamic therapy synergizes with β-Lapachone-halogenated derivative against melanoma. Biomed Pharmacother. 2018;108:1553–1564. doi:10.1016/j.biopha.2018.09.159
16. Siegel RL, Miller KD, Wagle NS, Jemal A. Cancer statistics, 2023. Ca a Cancer J Clinicians. 2023;73(1):17–48. doi:10.3322/caac.21763
17. Stratigos AJ, Garbe C, Dessinioti C, et al. European interdisciplinary guideline on invasive squamous cell carcinoma of the skin: part 2. Treatment. Eur J Cancer. 2020;128:83–102. doi:10.1016/j.ejca.2020.01.008
18. Migden MR, Rischin D, Schmults CD, et al. PD-1 blockade with cemiplimab in advanced cutaneous squamous-cell carcinoma. New Engl J Med. 2018;379(4):341–351. doi:10.1056/NEJMoa1805131
19. Cullen JK, Simmons JL, Parsons PG, Boyle GM. Topical treatments for skin cancer. Adv Drug Delivery Rev. 2020;153:54–64. doi:10.1016/j.addr.2019.11.002
20. Lalotra AS, Singh V, Khurana B, Agrawal S, Shrestha S, Arora D. A comprehensive review on nanotechnology-based innovations in topical drug delivery for the treatment of skin cancer. Curr Pharm Des. 2020;26(44):5720–5731. doi:10.2174/1381612826666200819202821
21. Yang D, Chen M, Sun Y, et al. Microneedle-mediated transdermal drug delivery for treating diverse skin diseases. Acta Biomater. 2021;121:119–133. doi:10.1016/j.actbio.2020.12.004
22. Menon GK, Cleary GW, Lane ME. The structure and function of the stratum corneum. Int J Pharm. 2012;435(1):3–9. doi:10.1016/j.ijpharm.2012.06.005
23. Lopes LB, Garcia MT, Bentley MV. Chemical penetration enhancers. Ther Deliv. 2015;6(9):1053–1061. doi:10.4155/tde.15.61
24. Ita K. Perspectives on transdermal electroporation. Pharmaceutics. 2016;8(1):9.
25. Wang Y, Thakur R, Fan Q, Michniak B. Transdermal iontophoresis: combination strategies to improve transdermal iontophoretic drug delivery. Eur J Pharm Biopharm. 2005;60(2):179–191. doi:10.1016/j.ejpb.2004.12.008
26. Pawar KR, Babu RJ. Lipid materials for topical and transdermal delivery of nanoemulsions. Crit Rev Ther Drug Carrier Syst. 2014;31(5):429–458. doi:10.1615/critrevtherdrugcarriersyst.2014010663
27. Wani TU, Mohi-Ud-Din R, Majeed A, Kawoosa S, Pottoo FH. Skin permeation of nanoparticles: mechanisms involved and critical factors governing topical drug delivery. Curr Pharm Des. 2020;26(36):4601–4614. doi:10.2174/1381612826666200701204010
28. Au SH. Dissolving microneedle vaccination—no magic needled. Sci Trans Med. 2018;10(460):eaav0343.
29. Lamberti MJ, Vittar NB, da Silva Fde C, Ferreira VF, Rivarola VA. Synergistic enhancement of antitumor effect of β-Lapachone by photodynamic induction of quinone oxidoreductase (NQO1). Phytomedicine. 2013;20(11):1007–1012. doi:10.1016/j.phymed.2013.04.018
30. Serpe L, Ellena S, Barbero N, et al. Squaraines bearing halogenated moieties as anticancer photosensitizers: synthesis, characterization and biological evaluation. Eur J Med Chem. 2016;113:187–197. doi:10.1016/j.ejmech.2016.02.035
31. Dinkova-Kostova AT, Talalay P. Persuasive evidence that quinone reductase type 1 (DT diaphorase) protects cells against the toxicity of electrophiles and reactive forms of oxygen. Free Radic Biol Med. 2000;29(3–4):231–240. doi:10.1016/s0891-5849(00)00300-2
 © 2024 The Author(s). This work is published and licensed by Dove Medical Press Limited. The
full terms of this license are available at https://www.dovepress.com/terms
and incorporate the Creative Commons Attribution
- Non Commercial (unported, 3.0) License.
By accessing the work you hereby accept the Terms. Non-commercial uses of the work are permitted
without any further permission from Dove Medical Press Limited, provided the work is properly
attributed. For permission for commercial use of this work, please see paragraphs 4.2 and 5 of our Terms.
© 2024 The Author(s). This work is published and licensed by Dove Medical Press Limited. The
full terms of this license are available at https://www.dovepress.com/terms
and incorporate the Creative Commons Attribution
- Non Commercial (unported, 3.0) License.
By accessing the work you hereby accept the Terms. Non-commercial uses of the work are permitted
without any further permission from Dove Medical Press Limited, provided the work is properly
attributed. For permission for commercial use of this work, please see paragraphs 4.2 and 5 of our Terms.