Back to Journals » Journal of Pain Research » Volume 19
Dissecting the Genetic Basis of Low Back Pain Independent of BMI Through Genomic Structural Equation Modeling
Authors Huo L, Tan L, Wang F, Sun J, Niu Y, Jiang Y, Wu M, Shi J, Hao Y, Wang J, Huang S, Chen Z ![]()
Received 15 November 2025
Accepted for publication 1 February 2026
Published 3 March 2026 Volume 2026:19 581757
DOI https://doi.org/10.2147/JPR.S581757
Checked for plagiarism Yes
Review by Single anonymous peer review
Peer reviewer comments 2
Editor who approved publication: Dr Alaa Abd-Elsayed
Litao Huo,* Lin Tan,* Fei Wang,* Jing Sun, Yifan Niu, Ying Jiang, Mengzi Wu, Jialin Shi, Yongyu Hao, Jiaxu Wang, Shibo Huang, Zhiming Chen
Department of Spine Surgery, The Ninth Medical Center of PLA General Hospital, Beijing, 100101, People’s Republic of China
*These authors contributed equally to this work
Correspondence: Zhiming Chen, Department of Spine Surgery, The Ninth Medical Center of PLA General Hospital, Beijing, 100101, People’s Republic of China, Email [email protected]
Background: Low back pain (LBP) is a leading cause of disability worldwide. Although body mass index (BMI) is a well-established risk factor for LBP, a substantial proportion of patients with LBP do not present with abnormal BMI, suggesting the involvement of BMI-independent mechanisms. However, the genetic architecture underlying BMI-independent LBP remains poorly understood. This study aimed to identify and characterize genetic variants associated with LBP that are independent of BMI.
Methods: This study was a secondary analysis of publicly available genome-wide association study (GWAS) summary statistics. Genetic associations were analyzed using a Genomic Structural Equation Modeling (Genomic SEM) framework. BMI summary statistics were obtained from the Genetic Investigation of ANthropometric Traits (GIANT) consortium (~700,000 individuals of European ancestry), and LBP data were derived from the FinnGen cohort, including 60,099 cases and 440,249 controls of European ancestry, with LBP defined by the International Classification of Diseases, 10th Revision (ICD-10) code M54. Genome-wide association study by subtraction (GWAS-by-subtraction) was applied to identify BMI-independent LBP associations. Statistical fine-mapping, transcriptome-wide association studies (TWAS), proteome-wide association studies (PWAS), and colocalization analyses were subsequently performed to prioritize putative causal genes.
Results: Three independent genome-wide significant loci associated with BMI-independent LBP were identified: rs6916321 at B7NZA1 (P = 2.41 × 10− 10), rs2596501 near HLA-B (P = 6.56 × 10⁻9), and a novel locus rs4148946 at SEC24C (P = 1.74 × 10⁻8). Fine-mapping highlighted rs2596501 as a likely causal variant with a posterior inclusion probability of 0.9999. Multi-omic integration consistently prioritized CHST3 as a candidate gene (P = 4.49 × 10⁻5 in PWAS). Pathway enrichment analyses implicated neuronal signaling and immune-related pathways, with cell-type enrichment observed in differentiated neurons (P = 0.0063). These findings were derived from large population-based cohorts of European ancestry.
Conclusion: This study refines the genetic architecture of BMI-independent LBP and identifies novel loci with convergent multi-omic evidence implicating CHST3 in disease susceptibility. The results highlight biological mechanisms beyond adiposity that may contribute to LBP risk and provide a foundation for future functional and translational research.
Keywords: low back pain, GWAS-by-subtraction, BMI, genetics, immune regulation
Introduction
Low back pain (LBP) is one of the leading causes of disability worldwide, exerting a substantial burden on healthcare systems and quality of life.1 Current management strategies often rely on physical therapy and exercise. Recent studies have highlighted the efficacy of aerobic and core stabilization exercises in improving functional capacity in chronic LBP patients.2 However, the etiology of LBP remains incompletely understood.
One of the major challenges in dissecting the genetic architecture of LBP is the strong correlation with body mass index (BMI). Elevated BMI is an established risk factor for LBP, not only through increased mechanical loading of the spine but also through systemic metabolic inflammation and neuroimmune pathways.3 Conventional GWAS approaches often fail to distinguish between these mechanisms, identifying loci that may simply reflect obesity rather than intrinsic back pathology. This lack of clarity hinders the development of targeted therapies for patients where weight loss alone does not resolve symptoms.
Collectively, our study makes three contributions to the literature: (i) it disentangles BMI-dependent and BMI-independent genetic components of LBP using Genomic Structural Equation Modeling (Genomic SEM)–based GWAS-by-subtraction;4,5 (ii) it identifies BMI-independent loci, including a novel signal at SEC24C; and (iii) it prioritizes putative causal genes through convergent fine-mapping, TWAS, PWAS, and colocalization, highlighting CHST3 as a leading candidate.
Methods
Ethics Statement
This study is a secondary analysis of publicly available, de-identified summary-level data and did not involve direct interaction with human participants or access to identifiable private information. According to the Institutional Review Board of the Ninth Medical Center of PLA General Hospital, studies based solely on publicly available anonymized summary statistics are exempt from Institutional Review Board review and approval. All original studies contributing to the publicly available datasets had obtained ethical approval from their respective institutional review boards, and written informed consent was obtained from all participants.
Data Source
This study was a cross-sectional secondary genetic association analysis based on publicly available GWAS summary statistics from large population-based cohorts. Genome-wide association summary statistics for BMI were obtained from the Genetic Investigation of ANthropometric Traits (GIANT) consortium (~700,000 individuals of European ancestry).6 The meta-analysis combined multiple population-based cohorts with standardized quality control and imputation procedures, providing high-resolution estimates of genetic associations with BMI across the genome.
Summary statistics for low back pain (LBP) were obtained from FinnGen release 12 (R12) (https://www.finngen.fi/en). FinnGen is a large-scale genomics initiative that integrates genetic information from over 500,000 Finnish biobank samples with national health registry data to investigate disease mechanisms and genetic predispositions.7 LBP cases were defined using Classification of Diseases (ICD-10) code M54 (dorsalgia), consistent with common registry-based definitions of back pain in FinnGen. Diagnoses were recorded by licensed physicians and captured through national healthcare registries, ensuring standardized clinical coding. The GWAS included 60,099 cases and 440,249 controls of predominantly European ancestry.
Statistical Analysis Overview
All statistical analyses were conducted using established and validated methods for complex trait genetics, including Genomic SEM, fine-mapping, and multi-omic integration.
GWAS-by-Subtraction Analysis
The objective of our GWAS-by-subtraction analysis was to identify, for each SNP, its association with LBP that is independent of its association with BMI. This approach, also known as Genomic-SEM, aims to “subtract” the influence of BMI from each SNP’s effect on LBP, revealing the SNP’s specific effect on LBP that is not mediated by BMI.4,8 While we assumed zero genetic correlation between the residual factors to identify independent effects, we acknowledge that this mathematical simplification may not fully capture complex biological pleiotropy.
We performed the GWAS-by-subtraction analysis using the Genomic-SEM R package (version 0.0.5c)9 and leveraged publicly available GWAS summary statistics for both LBP and BMI. The analysis was based on a structural equation model (illustrated in Figure 1), which regressed the LBP and BMI summary statistics on two latent variables: BMI and non-BMI. The BMI latent variable captured the effect of the SNP on the BMI phenotype and the non-BMI latent variable represented the component of the SNP’s effect on LBP that was independent of BMI. The “non-BMI” factor is a statistically derived component of the LBP GWAS signal after removing genetic covariance with BMI, rather than a separately measured clinical phenotype. This model allowed us to decompose the SNP’s total effect on LBP into two distinct pathways: one fully mediated by BMI and another that was independent of BMI. From the output summary statistics of the GWAS-by-subtraction, we identified genome-wide significant SNPs with a P-value threshold of P<5×10⁻⁸. To define independent lead SNPs, we performed clumping using an r2<0.1 threshold for SNPs located within a 250 kb distance. The genetic correlation (rg) between the BMI-dependent and non-BMI-dependent latent factors was set to zero in the primary analysis. In a sensitivity analysis, we investigated the robustness of our results by setting rg to 0.1 or 0.2 to explore the consequences of a potential violation of this assumption.
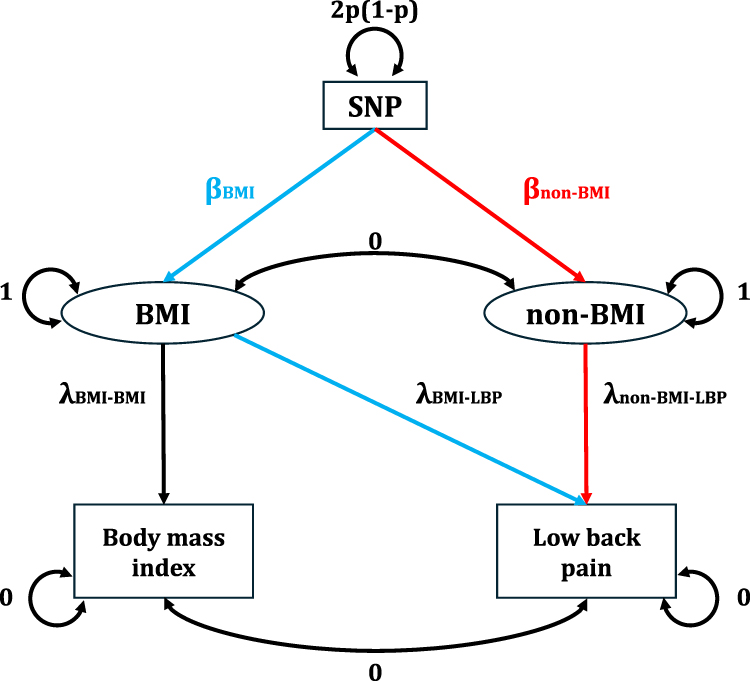 |
Figure 1 Flowchart of the GWAS-by-Subtraction Analysis. This figure illustrates the structural equation model used for the GWAS-by-subtraction analysis. The model decomposes the total effect of a SNP on low back pain (LBP) into two components. The two phenotypes, LBP and BMI, are regressed on two latent variables: a BMI latent variable representing the SNP’s effect on body mass index and a non-BMI latent variable capturing the SNP’s effect on LBP that is independent of BMI. The path from the SNP to the latent variables represents the genetic effect, while the paths from the latent variables to the phenotypes represent their influence on the observed summary statistics. In the primary analysis, the genetic correlation between the latent variables was set to zero. |
Fine-Mapping with SuSiE
Fine-mapping was conducted using the Sum of Single Effects (SuSiE) statistical framework,10 which models the effects of multiple causal variants within a locus using summary-level association statistics. We defined 95% credible sets for each locus, retaining single-nucleotide polymorphisms (SNPs) with posterior inclusion probability (PIP) > 0.8 as putative causal variants.
Transcriptome-Wide Association Study (TWAS)
TWAS was performed using the FUSION software11 to integrate LBP GWAS summary statistics with gene expression prediction models from the Genotype-Tissue Expression (GTEx) v8 reference panel,12 covering 49 human tissues. TWAS Z-scores were computed for each gene–tissue pair, and significance was determined using a false discovery rate (FDR) threshold of 0.05.
Proteome-Wide Association Study (PWAS)
We conducted PWAS using summary-level proteomic data from the UK Biobank Pharma Proteomics Project (UKBPPP), generated via Olink proximity extension assays and processed with the Biomarker expression Level Imputation using Summary-level Statistics (BLISS) framework.13 The dataset comprised 49,341 European-ancestry individuals and quantitative measurements for 2802 proteins. PWAS tests were performed by imputing genetically regulated protein abundance into the LBP GWAS summary statistics.
Colocalization Analysis with fastENLOC
Colocalization was assessed using fastENLOC,14 incorporating SuSiE-derived credible sets as GWAS input. Pre-formatted GTEx v8 eQTL data for 49 tissues were used as the molecular QTL reference. Colocalization was quantified using the gene-level colocalization posterior probability (GLCP), representing the probability that a gene harbors at least one signal cluster with local colocalization posterior (LCP) > 0. Genes with GLCP > 0.5 were considered to have strong evidence of colocalization.
Gene-Based Enrichment Analysis
Gene-based association testing was conducted using Multi-marker Analysis of Genomic Annotation (MAGMA)15 to aggregate SNP-level P-values for each gene and identify genes significantly associated with the BMI-independent LBP phenotype. Gene-based P-values were adjusted for multiple testing using a Benjamini-Hochberg FDR correction. We also performed a gene-set enrichment analysis using MAGMA to test for enrichment of the BMI-independent LBP signal in various biological pathways and gene sets from the GO, KEGG, and Reactome databases.
Cell Type Enrichment Analysis
We used the R package CellEnrich to assess whether the genetic associations for BMI-independent LBP are enriched in specific developmental cell types. This analysis leverages single-cell RNA sequencing data to identify cell types where genes associated with the trait are highly expressed. We tested for enrichment across a panel of annotated cell types to determine if the genetic signal for BMI-independent LBP is concentrated in a particular cellular context.
Results
GWAS-by-Subtraction Identifies Novel Variants Associated with LBP
In the discovery stage, we performed a GWAS of LBP and employed a GWAS-by-subtraction approach by removing the genetic effects associated with BMI. This approach identified three independent genome-wide significant SNPs (p < 5 × 10⁻8) from three separate regions that were associated with the LBP component, after adjusting for BMI effects (Figure 2 and Table 1).
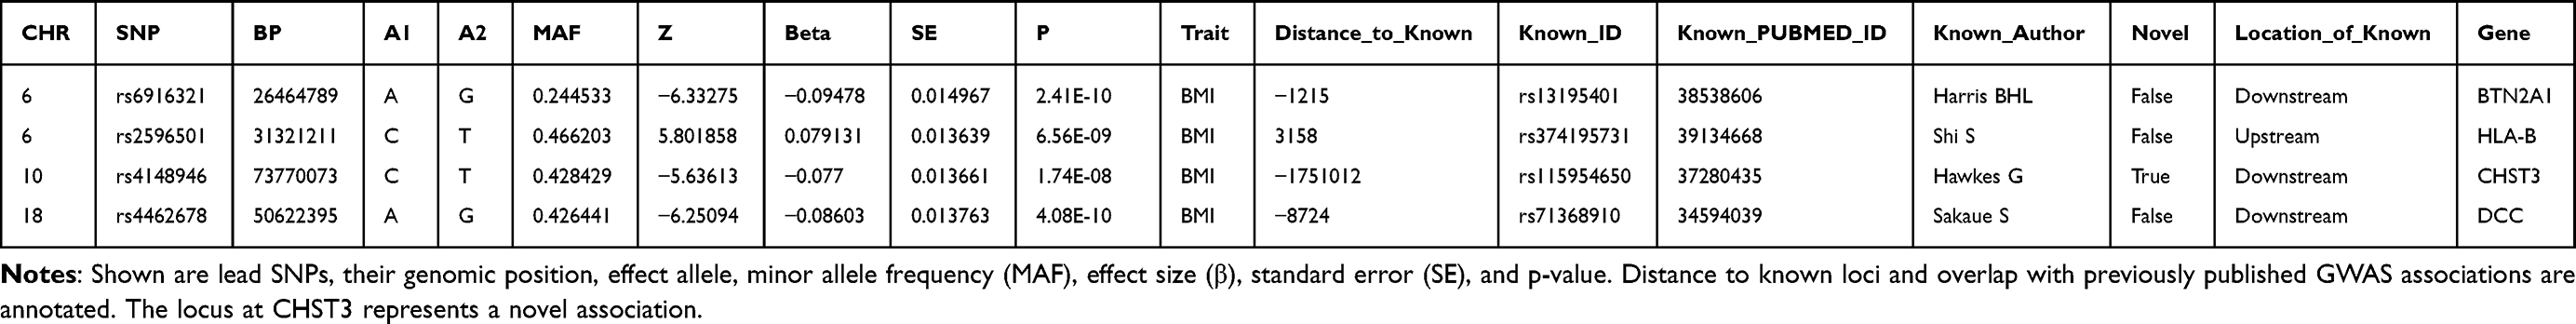 |
Table 1 Genome-Wide Significant Loci from Non-BMI-Associated LBP GWAS |
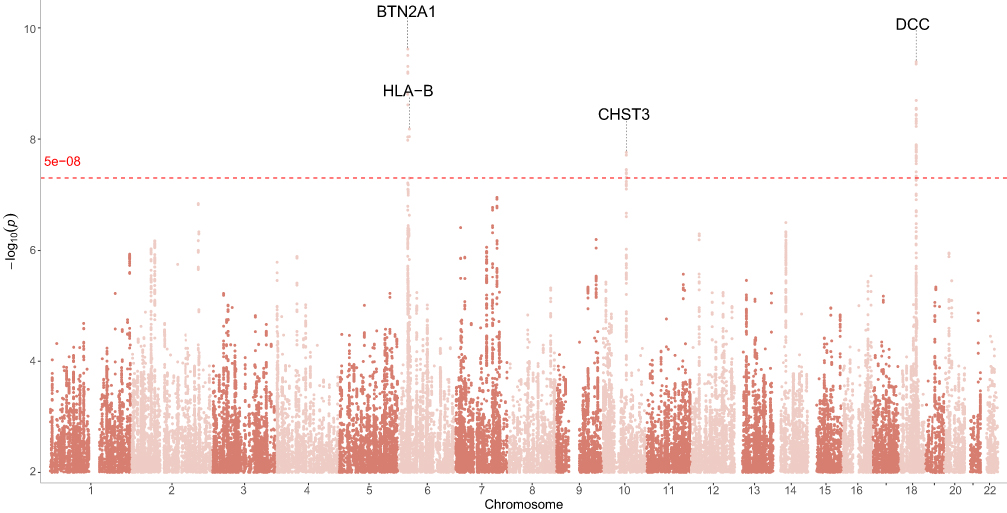 |
Figure 2 Manhattan plot of genome-wide association study results for low back pain. The x-axis represents chromosomal position, and the y-axis shows –log10(p). The red dashed line indicates the genome-wide significance threshold of p < 5 × 10⁻8. Notable genome-wide significant loci include CHST3, DCC, BTN2A1, and HLA-B. |
Of these, two lead SNPs corresponded to known loci previously associated with LBP or related traits: rs6916321 at the BTN2A1 locus on chromosome 6 (P=2.41×10⁻¹⁰) and rs2596501 near the HLA-B locus, also on chromosome 6 (P=6.56×10⁻⁹). Additionally, a novel genome-wide significant signal was identified at rs4148946 on chromosome 10 (P=1.74×10⁻8), a region not previously reported in relation to LBP susceptibility.
Fine-Mapping of Associated Loci
We next performed fine-mapping of the non-BMI-associated LBP loci using the SuSiE algorithm. As shown in Figure 3, the Manhattan-style fine-mapping plot illustrates PIP values across the genome, with the threshold PIP ≥ 0.8 denoting high-confidence candidate causal variants. One such SNP, rs2596501 at 6p21 (annotated to LINC02571), achieved a PIP of 0.9999, indicating very strong evidence of being a putative causal variant at this locus.
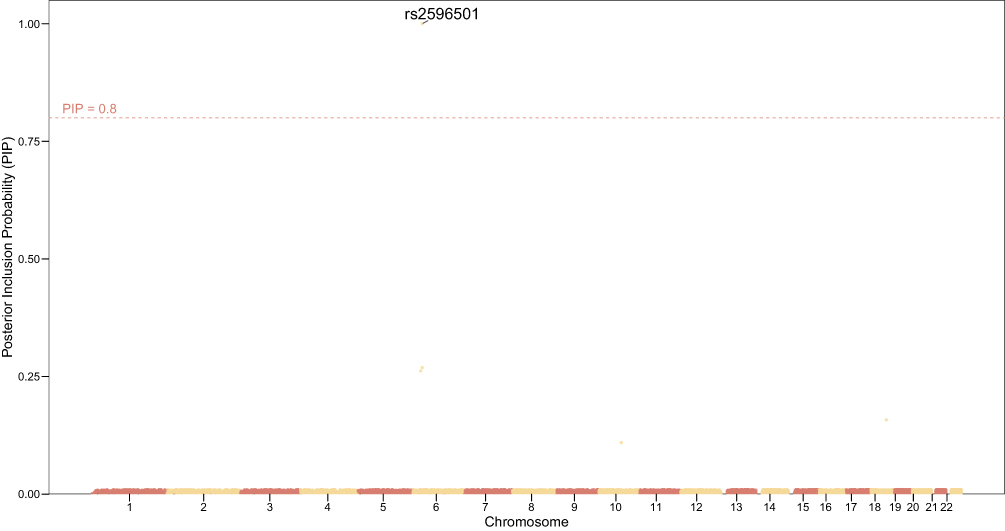 |
Figure 3 Fine-mapping of non-BMI-associated LBP loci using SuSiE. Shown are posterior inclusion probabilities (PIP) of SNPs across chromosomes. The red dashed line indicates the PIP ≥ 0.8 threshold for high-confidence causal variants. Notably, rs2596501 on chromosome 6 surpassed this threshold with PIP ≈ 1.0, suggesting strong evidence of causality. |
Table 2 provides detailed annotations of the fine-mapped SNPs. Beyond rs2596501, several additional variants achieved moderate PIP values: rs3131636 (chr6, HCP5, PIP ≈ 0.27), rs6916321 (chr6, BTN2A1, PIP ≈ 0.26), rs4462678 (chr18, MAPK4, PIP ≈ 0.16), and rs4148946 (chr10, SEC24C, PIP ≈ 0.11). These credible set members refine the association signals highlighted in the primary GWAS analysis and prioritize potential biological targets located in immune-related (LINC02571, HCP5), metabolic (MAPK4), and protein trafficking (SEC24C) pathways.
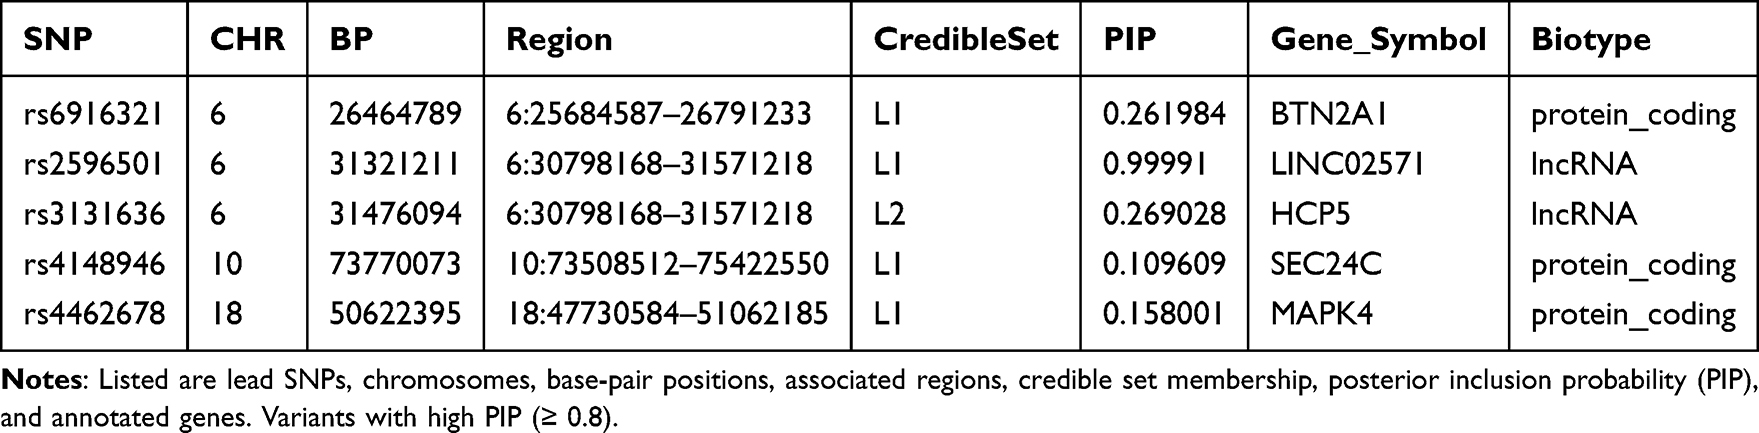 |
Table 2 Fine-Mapped Variants from SuSiE Analysis |
Transcriptome-Wide Integrative Analysis
TWAS using expression prediction models across GTEx tissues identified a set of significant gene–trait associations (FDR < 0.05). The Manhattan-style TWAS plot (Figure 4) illustrates gene-level significance across multiple tissues, with strong signals observed for RNF212, FOXP2, NSUN5, and CHST3.
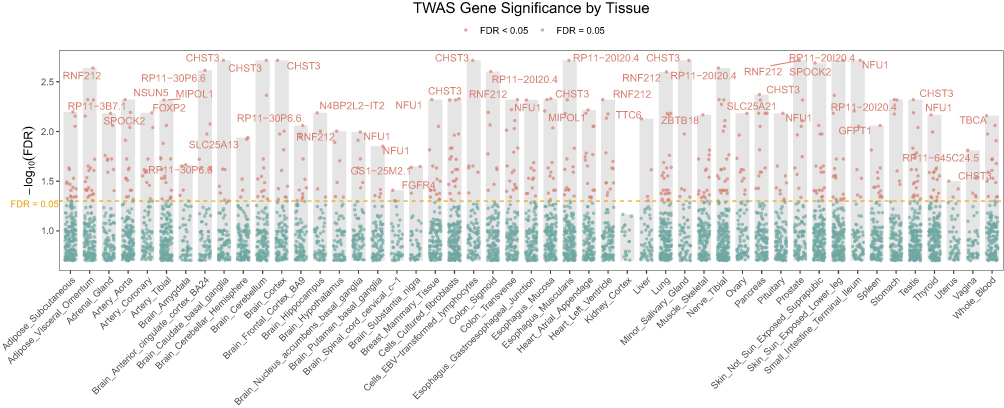 |
Figure 4 Transcriptome-wide association study results across GTEx tissues. The y-axis shows –log10(FDR), with the red line indicating the significance threshold at FDR = 0.05. Significant genes include RNF212, FOXP2, NSUN5, and CHST3. Tissue-level signals highlight contributions from adipose, neural, and musculoskeletal contexts to BMI-associated transcriptional regulation. |
Consistent with these findings, our table of significant TWAS hits (Supplementary Table 1) highlights loci with robust evidence linking genetically predicted expression and non-BMI-associated LBP. For example, in adipose subcutaneous tissue, MIPOL1 (TWAS Z = –4.09, FDR = 0.0377), SLC25A21 (Z = –4.81, FDR = 0.0070), and NFU1 (Z = 4.20, FDR = 0.0295) were significantly associated. Several associations were also observed in neural tissues relevant to non-BMI-associated LBP regulation and pain susceptibility, including RNF212 in arterial and brain tissues (FDR < 0.05), FOXP2 in adrenal gland and arterial tissues (TWAS Z ≈ 4.30, FDR = 0.0241), and NSUN5 in aortic and cortical brain regions (FDR ≈ 0.01–0.04). Notably, CHST3—a gene also implicated in the primary LBP GWAS and fine-mapping analyses—emerged as a recurrent TWAS hit in multiple brain regions (eg, caudate, cortex, hippocampus; TWAS Z between –5.46 and –5.59, FDR < 0.01).
Overall, TWAS results point to convergent evidence linking adipose metabolic pathways (eg, SLC25A21, MIPOL1, NFU1) and neuronal regulatory genes (RNF212, FOXP2, CHST3, NSUN5) with non-BMI-associated LBP variation.
Predicted Proteome-Wide Association Study Identifies Significant Genes
To identify genes whose predicted protein expression levels are associated with non-BMI-related LBP, we conducted a predicted PWAS (Figure 5). Seven genes reached the FDR significance threshold of 0.05 (Table 3).
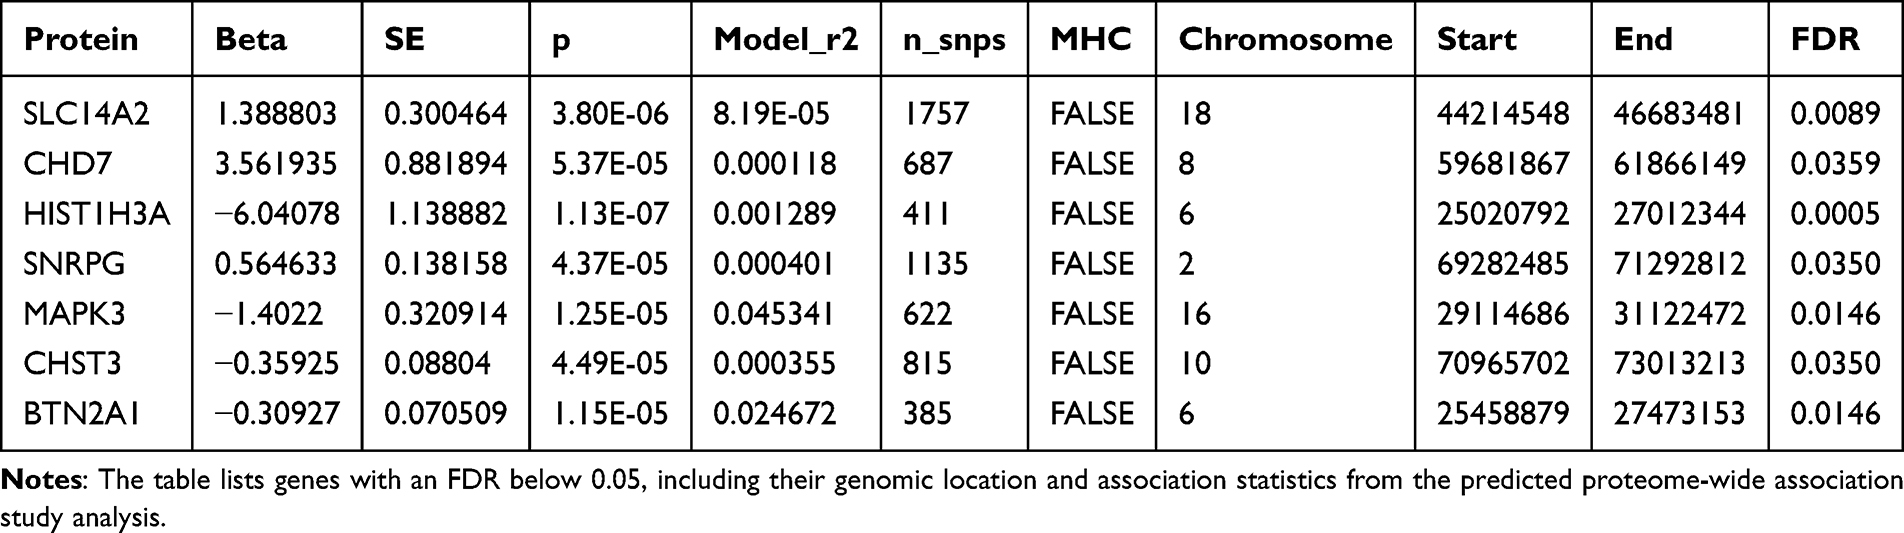 |
Table 3 Summary of Significant Genes Identified in the Predicted Proteome-Wide Association Study for Low Back Pain |
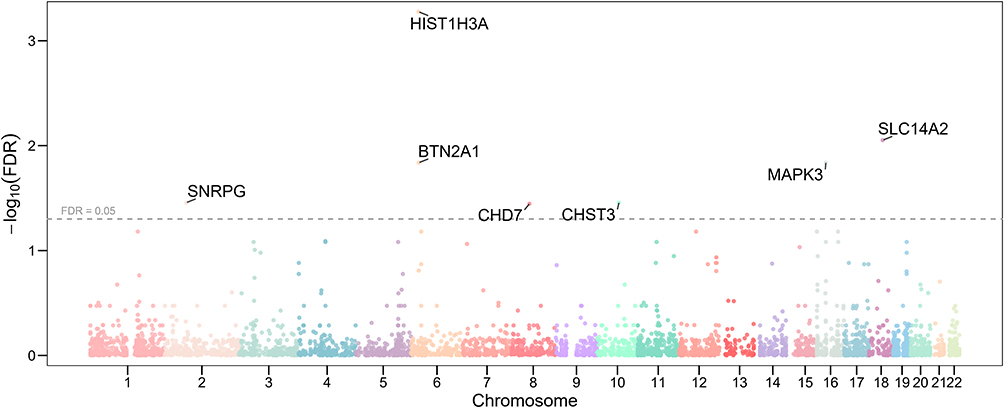 |
Figure 5 Manhattan plot of predicted proteome-wide association study results for low back pain. The x-axis represents chromosomal position, and the y-axis shows the negative logarithm of the false discovery rate (FDR) for each gene’s association. The horizontal red line indicates the significance threshold of FDR=0.05. Key genes with significant predicted protein expression levels are labeled, including HIST1H3A, BTN2A1, SNRPG, SLC14A2, MAPK3, CHD7, and CHST3. |
The most significant gene identified was HIST1H3A on chromosome 6, with a p-value of 1.13×10⁻⁷ and an FDR of 0.0005. Other highly significant genes included SLC14A2 on chromosome 18 (P=3.80×10⁻⁶, FDR =0.0089) and CHD7 on chromosome 8 (P=5.37×10⁻⁵, FDR =0.0359). A notable finding was the identification of CHST3 on chromosome 16 (P=4.49×10⁻⁵, FDR =0.0350), which was also found to be genome-wide significant in our initial GWAS analysis, providing convergent evidence for its association with LBP.
Colocalization Analysis
To identify plausible causal genes and tissues, we performed a colocalization analysis using fastENLOC. We identified 15 genes that showed evidence of colocalization (GLCP > 0) in at least one tissue. Of these, 9 genes exhibited strong evidence of colocalization (GLCP > 0.5) in 14 distinct gene-tissue pairs (Figure 6 and Table 4). Notably, the gene CHST3 showed strong colocalization in eight different tissues, including several brain regions (eg, Brain Caudate basal ganglia, Brain Frontal Cortex BA9) and lymphoid cells. Other genes with significant colocalization included DDX39B in two brain tissues and MICB in two tissues.
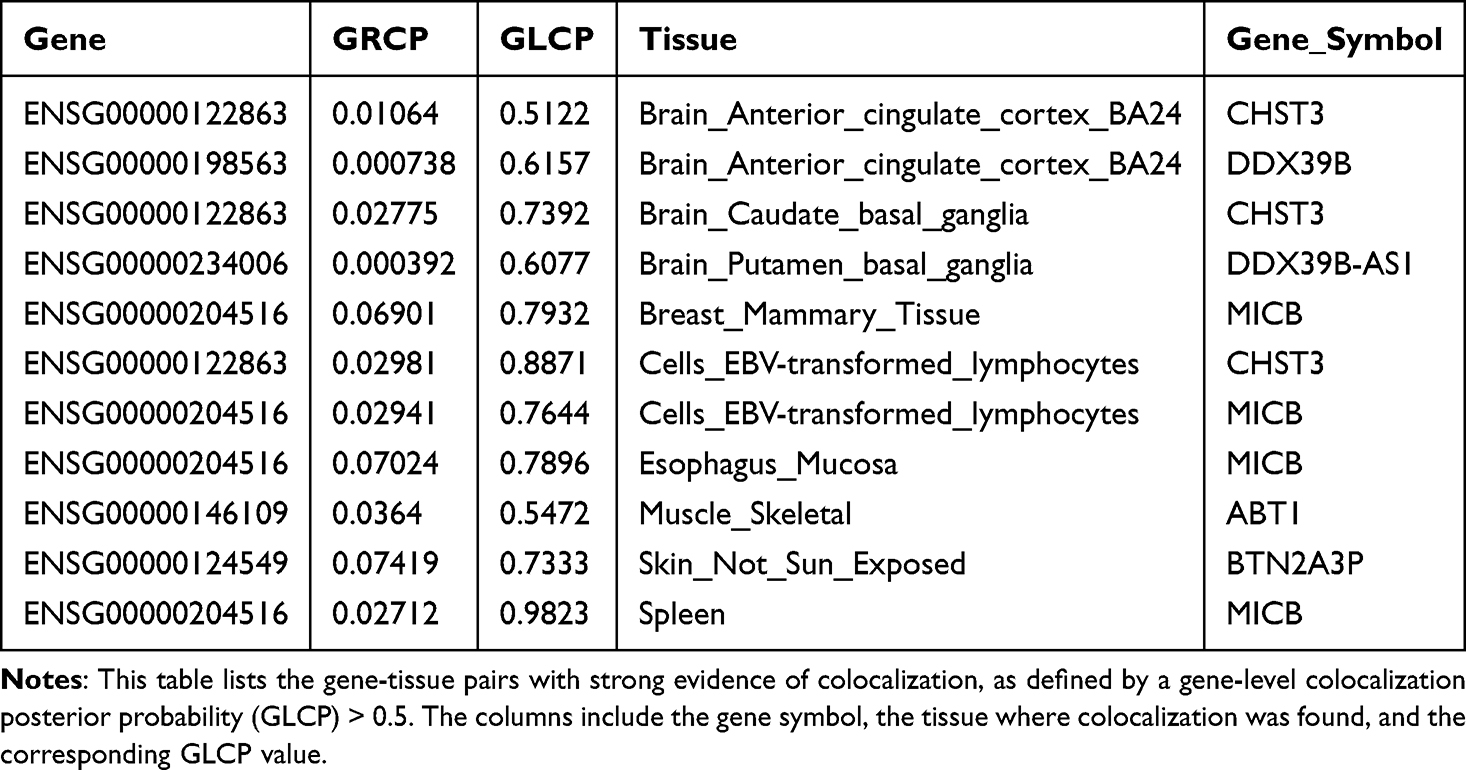 |
Table 4 Significant Gene-Tissue Colocalization Pairs |
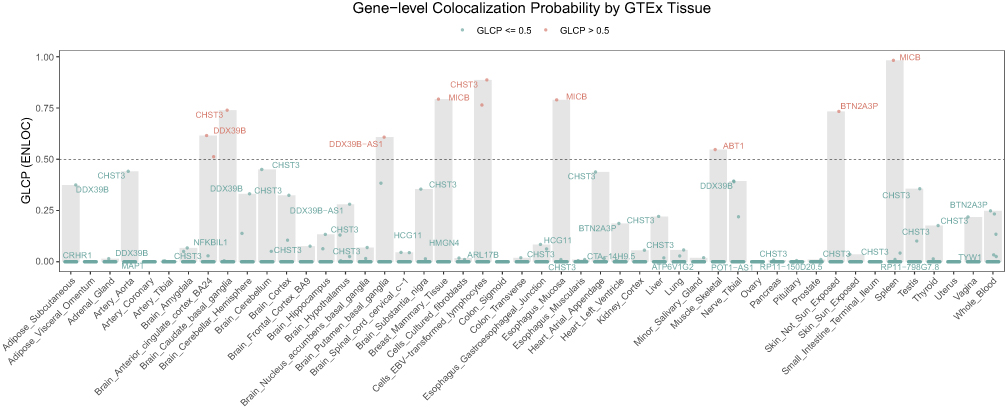 |
Figure 6 Gene-level Colocalization Probability of 15 Genes across 49 GTEx Tissues. The heatmap displays the Gene-level Colocalization Probability (GLCP) values for 15 genes that passed colocalization screening (LCP > 0) across 49 GTEx tissues. Each cell represents a unique gene-tissue pair, with the color intensity corresponding to the GLCP value. A GLCP value greater than 0.5 (represented by a darker shade) indicates strong evidence of colocalization between a GWAS locus and an eQTL signal for the given gene-tissue pair. Genes with multiple tissues showing strong colocalization are highlighted. |
Cross-Omics Convergence Analysis
We conducted an integrative cross-omics comparison between TWAS-, PWAS-, and colocalization-identified loci (Figure 7). The majority of significant findings were unique to one analytic framework: 148 genes were exclusive to TWAS, 5 to PWAS, and 1 to colocalization. Importantly, CHST3 emerged as the sole gene consistently identified across all three methods.
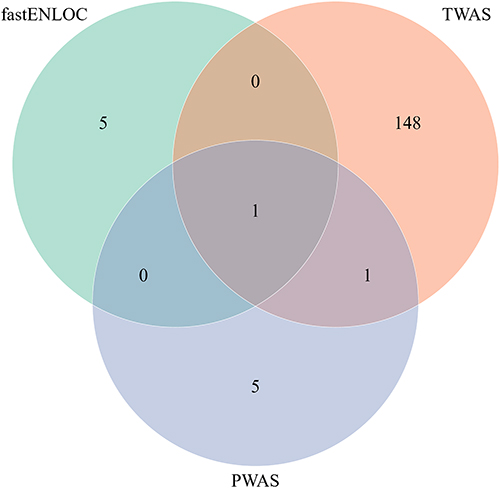 |
Figure 7 Integrative cross-omics overlap of significant TWAS, PWAS, and colocalization results. Venn diagram summarizing the overlap of significant genes identified across transcriptome-wide association study (TWAS), predicted proteome-wide association study (PWAS), and colocalization analysis (fastENLOC). A total of 148 genes were unique to TWAS, 5 to PWAS, and 1 to ENLOC, while a minimal number of genes were shared across methods. Notably, CHST3 was the only gene detected by all three analytic approaches, reinforcing its role as a convergent and potentially causal candidate in non-BMI-associated low back pain (LBP). |
This convergence is notably because CHST3 not only showed genome-wide significance in our GWAS fine-mapping but also demonstrated significant predicted transcriptomic associations (TWAS Z between –5.46 and –5.59, FDR < 0.01 in multiple brain regions), significant predicted proteomic association (P = 4.49×10⁻5, FDR = 0.035), and strong colocalization signals (GLCP > 0.7) in multiple relevant tissues including brain and lymphoid cells.
Gene- and Pathway-Level Enrichment
To extend beyond single-variant associations, we performed gene-based and pathway-based enrichment analyses using MAGMA. At the gene level, 20 loci reached significance after FDR correction (Figure 8a). The strongest associations were observed for APOE, TOMM40, and PSORS1C2, alongside several genes located in the major histocompatibility complex region (CCHCR1, BTN2A1, HLA-associated histone genes). Additional significant associations included GFPT1 (involved in hexosamine biosynthesis), MIPOL1 (developmental regulation), DCC (neuronal axon guidance), and NFU1 (mitochondrial metabolism). These results highlight a convergence of metabolic, immune, and neurodevelopmental gene pathways underlying non-BMI-associated-LBP genetic architecture.
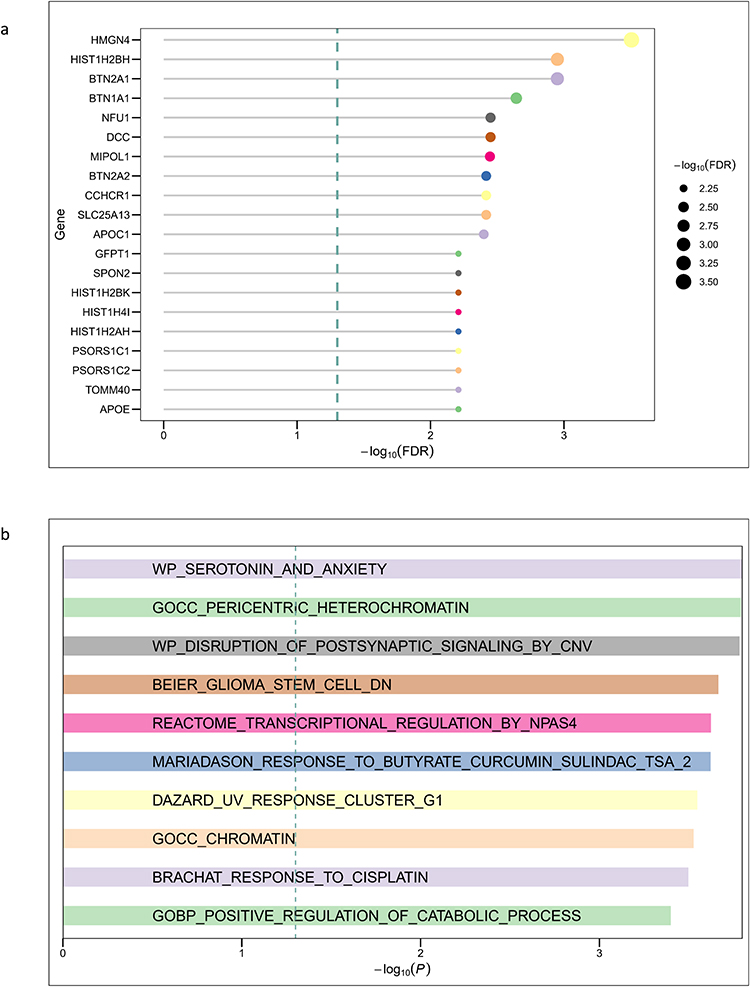 |
Figure 8 Gene- and Pathway-Level Enrichment analysis with MAGMA. (a) Gene-level associations identified by MAGMA. The bar plot shows the top 20 genes ranked by –log10(FDR). Significant loci include classical candidates such as APOE and TOMM40, immune-related genes within the MHC (PSORS1C2, CCHCR1, BTN2A1), and additional candidates related to neuronal function (DCC, MIPOL1) and mitochondrial metabolism (NFU1). (b) Top 10 MAGMA Enriched Gene Sets. Shown are the top enriched biological processes and pathways ranked by –log10(P). Enriched gene sets highlight serotonergic signaling (WP_SEROTONIN_AND_ANXIETY), postsynaptic transmission (WP_DISRUPTION_OF_POSTSYNAPTIC_SIGNALING_BY_CNV), chromatin organization (GOCC_PERICENTRIC_HETEROCHROMATIN, GOCC_CHROMATIN), and cellular stress–related responses (BRACHAT_RESPONSE_TO_CISPLATIN, DAZARD_UV_RESPONSE_CLUSTER_G1). |
At the pathway level (Figure 8b), enriched biological processes included neurotransmission and psychiatric-relevant pathways, chromatin-associated structural pathways, and gene sets related to cellular stress. The enrichment of serotonergic signaling and postsynaptic regulation pathways suggests a role of neuronal processes, whereas chromatin and stress-response pathways emphasize epigenetic modulation.
Cell-Type Specific Enrichment and Identification of Influential Genes
To pinpoint the specific cell types and genes that may mediate the genetic effects on our trait of interest, we conducted a series of integrative analyses. First, we mapped the non-BMI genetic associations with LBP onto developmental cell populations using UMAP (Figure 9). The analysis revealed distinct transcriptional clusters across mesodermal, ectodermal, and endodermal lineages. Notably, non-BMI effects on LBP were enriched in neuroectodermal populations, including sensory neurons and Schwann cells. Additional associations were observed in craniofacial fibroblasts and mesodermal derivatives such as lateral plate mesoderm, suggesting potential contributions of connective tissue and musculoskeletal development. Our enrichment analysis, a bar plot shown in Figure 10, revealed a significant enrichment of the Differentiated neurons cell type, with a p-value of P=0.0063, surpassing all other cell types.
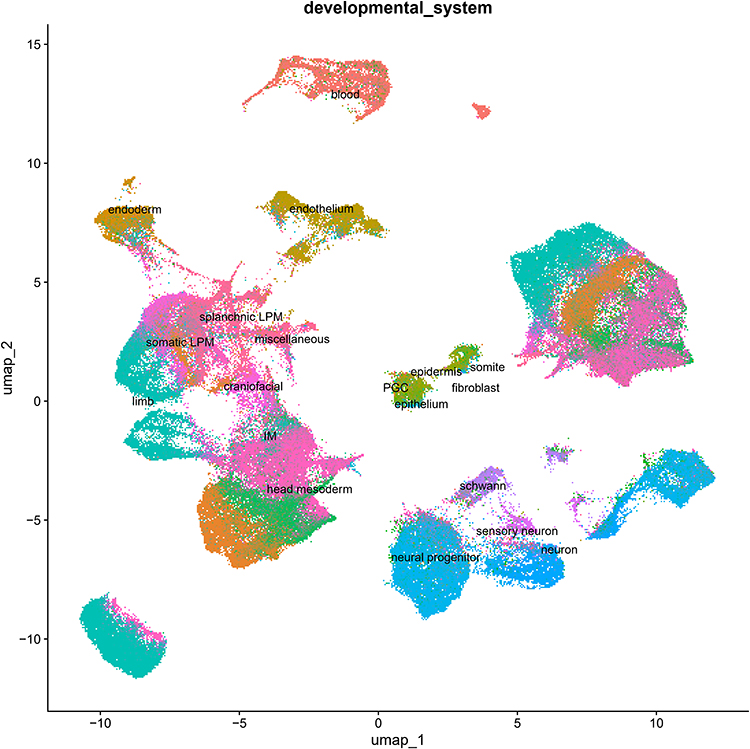 |
Figure 9 UMAP Plot of Developmental Cell Types. This UMAP plot visualizes the various developmental cell types analyzed. Each point represents a single cell, with different colors assigned to each cell type, illustrating their distribution and relationships. |
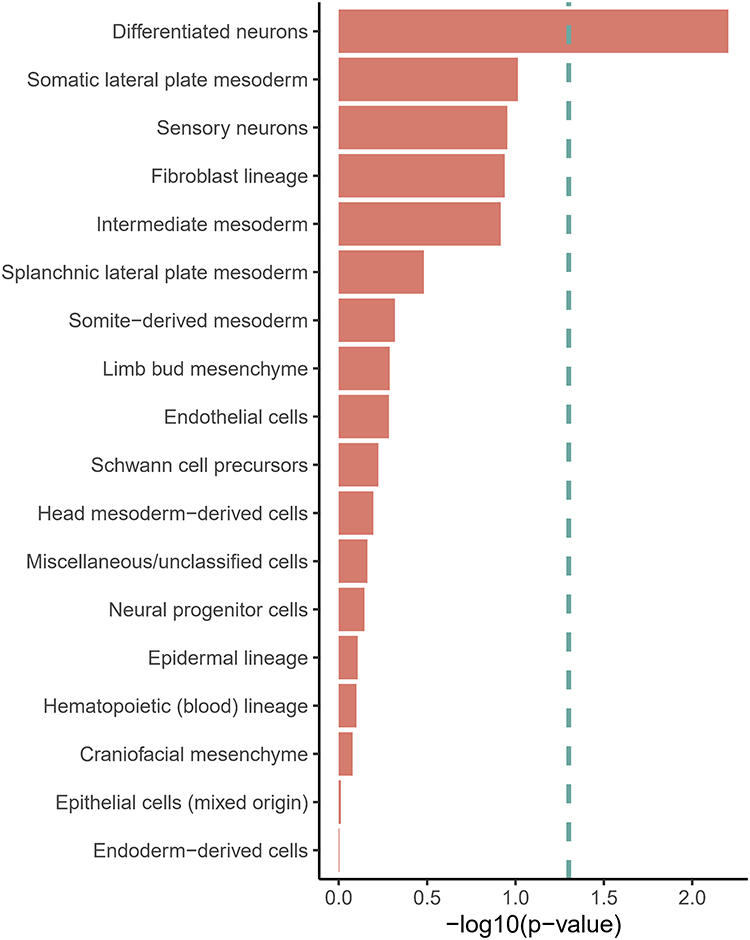 |
Figure 10 Cell Type Enrichment Analysis. This bar plot shows the results of the cell type enrichment analysis. The y-axis lists the different developmental cell types, and the x-axis represents the negative logarithm of the p-value (-log10(p-value)). A longer bar indicates a more significant enrichment, with Differentiated neurons showing the highest significance. |
Following this key finding, we performed a more granular analysis to identify “influential genes” within the Differentiated neurons cell type. This approach integrates a gene’s specificity to the cell type with its overall risk score (z-score), allowing us to prioritize genes that are both highly expressed in differentiated neurons and strongly associated with the trait. The results, presented in a scatter plot (Figure 11), highlight a number of influential genes. Among the most prominent, GNG3 (z-score = 2.27, specificity = 0.52), NHLH1 (z-score = 2.93, specificity = 0.37), and RND2 (z-score = 3.31, specificity = 0.30) were identified as highly influential, possessing both high gene risk and cell-type specificity. Other notable influential genes included HIST1H2BD, INA, DPYSL5, ZSCAN9, MAP1A, KLF7, and VAT1.
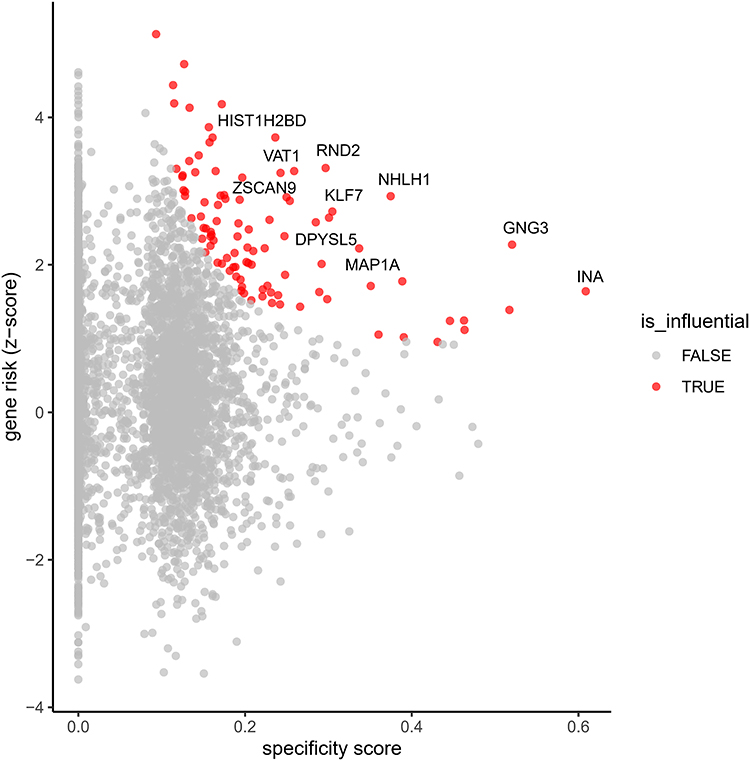 |
Figure 11 Identification of Influential Genes in Differentiated Neurons. This scatter plot visualizes the influential genes within the “Differentiated neurons” cell type. The x-axis represents the gene specificity score, while the y-axis represents the gene risk (z-score). Each point corresponds to a gene, with influential genes highlighted in blue and non-influential genes in gray. The plot identifies genes that are both highly specific to differentiated neurons and strongly associated with the trait, such as GNG3, NHLH1, and RND2. |
Summary of Main Findings
In summary, our analyses isolated BMI-independent LBP associations, pinpointing CHST3 as a convergent multi-omic candidate. The results consistently highlighted specific biological pathways involving neuroimmune regulation, synaptic signaling, and extracellular matrix maintenance, distinct from general adiposity-related mechanisms.
Discussion
In this study, we applied a GWAS-by-subtraction framework to identify genetic variants associated with LBP that act independently of BMI. By disentangling BMI-related effects from the genetic signal of LBP, we discovered three genome-wide significant loci—including a novel association at SEC24C (rs4148946)—and uncovered convergent multi-omic evidence implicating CHST3 as a causal candidate. Integrative analyses further highlighted immune processes, neuronal development, and metabolic pathways as mediators of BMI-independent LBP susceptibility. These results refine the understanding of the genetic architecture of LBP and emphasize mechanistic pathways beyond mechanical or adiposity-driven influences.
Genetic Basis of BMI-Independent LBP
Previous GWAS have identified several loci related to LBP, including SOX5, CCDC26/GSDMC, and DCC, genes implicated in neuronal development and spinal structural integrity.16 Our analysis extends this literature by isolating loci that remain significant after statistically removing the effects of BMI. The persistence of signals at the BTN2A1/HLA-B region supports a role for the major histocompatibility complex (MHC) in pain-related phenotypes, consistent with its established contribution to autoimmunity and inflammation.17,18 The novel locus near SEC24C has not previously been linked to musculoskeletal disease; as an essential COPII vesicle coat component required for intracellular transport, variants at this locus may influence neuronal protein trafficking and pain transmission.19 This finding illustrates how BMI-independent analysis can reveal pathways not captured in conventional GWAS.
CHST3 as a Convergent Causal Gene
The strongest multi-omic convergence emerged for CHST3. This gene encodes chondroitin 6-sulfotransferase, regulating glycosaminoglycan sulfation within cartilage extracellular matrix. Mutations in CHST3 cause spondyloepiphyseal dysplasia with severe spinal manifestations20,21 and common variants have been linked to intervertebral disc degeneration,22 a key risk factor for LBP. In our analyses, CHST3 reached suggestive fine-mapping support, emerged as a recurrent TWAS hit across multiple brain regions, showed significant predicted proteomic associations, and colocalized with eQTL signals in eight tissues. This convergence across regulatory, transcriptomic, and proteomic layers underscores CHST3 as a supported by convergent evidence mediator of BMI-independent LBP risk. Functionally, altered glycosaminoglycan sulfation could impair disc homeostasis while modifying neuronal extracellular signaling, spanning both structural and sensory determinants of pain.
Immune Contributions
Our enrichment analyses pointed to multiple immune-related loci within the MHC, including BTN2A1, NFKBIL1, and PSORS1C2. Immune pathways are increasingly recognized in chronic pain states; microglial activation and T-cell infiltration have been implicated in hypersensitivity and maladaptive pain persistence.23 Beyond LBP, immune-related variants in the MHC also confer risk for rheumatoid arthritis and other autoimmune diseases.24,25 The involvement of such loci in BMI-independent LBP suggests that immune dysregulation contributes to pain generation apart from mechanical stress associated with body weight. These results are consistent with clinical observations linking systemic inflammation to back pain symptom severity.26
Neuronal and Developmental Pathways
In parallel, we observed strong evidence for neuronal processes. Pathway enrichment implicated serotonergic signaling and postsynaptic transmission, aligning with clinical data showing that serotonergic modulation influences pain experience and antidepressant response in chronic LBP.27 Our cell-type enrichment analysis revealed significant signals in differentiated neurons, with prioritized genes including GNG3, a G-protein subunit critical for synaptic signaling,28 NHLH1, a transcription factor promoting neuronal differentiation,29 and RND2, which regulates dendritic spine morphogenesis.30 Together, these findings underscore the role of neuronal development and excitability in producing vulnerability to LBP independent of BMI, highlighting a central nervous system dimension to pain susceptibility.
Notably, genes such as MIPOL1 and NFU1 identified in TWAS and PWAS analyses point toward developmental and mitochondrial processes, respectively. Mitochondrial dysfunction has been implicated in neuropathic pain,31 suggesting that impaired energy metabolism may amplify neuronal sensitivity in LBP. These results collectively implicate cross-system biological pathways—from neuronal differentiation to metabolism—in the etiology of BMI-independent LBP.
Multi-Omics Integration
A further advancement of this study is the integration of fine-mapping with transcriptomic, proteomic, and colocalization analyses. Multi-omic overlap was modest, consistent with the complexity of trait regulation, but the convergence on CHST3 across all three modalities provides compelling evidence of causality. Such integrative strategies improve prioritization of true susceptibility genes by reducing reliance on single-signal evidence, an approach increasingly used in complex trait genetics. Beyond individual loci, this cross-omics evidence reinforces the need to study LBP not as a purely mechanical disorder but as a condition shaped by multi-layered biological regulation.
Strengths and Limitations
The principal strength of this work is the use of GWAS-by-subtraction to reveal loci invisible in conventional GWAS due to BMI confounding. Nevertheless, several limitations warrant caution. First, the LBP summary statistics were derived from the FinnGen cohort. While FinnGen provides high-quality data from a well-phenotyped population, it is a genetic isolate. The unique population structure and potential founder effects may limit the generalizability of our identified variants to non-European or more genetically diverse populations.7 Second, the GWAS-by-subtraction model assumes zero genetic correlation between the residual factors to identify independent effects; this is a mathematical simplification that may not fully capture complex biological pleiotropy. Additionally, pain phenotyping based on ICD codes (M54) relies on electronic health records, which may underrepresent clinical chronicity compared to detailed imaging studies. Formal sample size calculation was not performed, as the study leveraged the maximum available sample sizes from existing GWAS consortia to optimize statistical power, consistent with standard practice in large-scale genetic association studies. Last, as this study was based on summary-level GWAS data, individual-level inclusion and exclusion criteria were defined in the original studies and could not be reassessed in the present analysis.
Implications and Future Research
By distinguishing BMI-independent genetic contributions, our findings suggest that distinct biological processes underlie LBP beyond weight-related mechanical pathways. The robust implicating of CHST3 highlights extracellular matrix sulfation as a promising candidate target that warrants functional validation. However, we emphasize that direct clinical application is currently premature. While identifying pathways like glycosaminoglycan biosynthesis suggests potential for drug repurposing, these targets must undergo rigorous functional validation in experimental models before they can be translated into clinical practice. Future directions should include replication in multi-ancestry cohorts and experimental work dissecting functional effects of SEC24C and CHST3 variants.
Conclusion
In summary, this study provides the first large-scale dissection of BMI-independent genetic risk factors for LBP. We identified novel risk loci, emphasized the convergent role of CHST3, and revealed immune, neuronal, and metabolic mechanisms that act independently of BMI. These findings refine the genetic architecture of LBP and suggest novel avenues for mechanistic research. While these findings strengthen the biological basis of BMI-independent LBP, they are not yet ready for direct clinical implementation and require replication and functional validation.
Declaration of Use of Generative AI
Generative AI tools (ChatGPT by OpenAI) were used during the preparation of this manuscript to assist with language refinement, structural organization. All content was subsequently reviewed, edited, and validated by the authors to ensure accuracy and originality. No AI-generated content was used in place of critical analysis, data interpretation, or authorship responsibilities.
Data Sharing Statement
The genome-wide association summary statistics for body mass index (BMI) are publicly available from the Genetic Investigation of ANthropometric Traits (GIANT) consortium (https://giant-consortium.web.broadinstitute.org/GIANT_consortium_data_files). Summary statistics for low back pain (LBP) can be accessed through FinnGen release 12 (R12) at the project website (https://www.finngen.fi/en). All data analyzed in this study are de-identified, publicly available, and can be obtained from the above sources without restriction.
Acknowledgments
We want to acknowledge the participants and investigators of the FinnGen study.
Author Contributions
All authors made a significant contribution to the work reported, whether that is in the conception, study design, execution, acquisition of data, analysis and interpretation, or in all these areas; took part in drafting, revising or critically reviewing the article; gave final approval of the version to be published; have agreed on the journal to which the article has been submitted; and agree to be accountable for all aspects of the work.
Disclosure
The authors report no conflicts of interest in this work.
References
1. GBD 2021 Low Back Pain Collaborators. Global, regional, and national burden of low back pain, 1990–2020, its attributable risk factors, and projections to 2050: a systematic analysis of the Global Burden of Disease Study 2021. Lancet Rheumatol. 2023;5(6):e316–17. doi:10.1016/S2665-9913(23)00098-X
2. Kuzu Ş, Canli M, Valamur İ, Özüdoğru A, Alkan H, Hartavi A. Effects of aerobic exercise in addition to core stabilization exercises on functional capacity, physical performance and fall risk in geriatric individuals with chronic non-specific low back pain. BMC Sports Sci Med Rehabil. 2025;17(1):218. doi:10.1186/s13102-025-01271-7
3. Wang F, Yang Y, Xu J, Zhao M, Ma H, Xu Q. The shifting global landscape of low back pain attributable to high body mass index: burden, growth, and inequalities. Prev Med Rep. 2025;53:103031. doi:10.1016/j.pmedr.2025.103031
4. Grotzinger AD, Rhemtulla M, de Vlaming R, et al. Genomic SEM provides insights into the multivariate genetic architecture of complex traits. Nat Hum Behav. 2019;3(5):513–525. doi:10.1038/s41562-019-0566-x
5. Ruan J, Yi X. Genomic structural equation modeling elucidates the shared genetic architecture of allergic disorders. J Transl Med. 2025;23(1):445. doi:10.1186/s12967-025-06465-8
6. Yengo L, Sidorenko J, Kemper KE, et al. Meta-analysis of genome-wide association studies for height and body mass index in ∼700000 individuals of european ancestry. Hum Mol Genet. 2018;27(20):3641–3649. doi:10.1093/hmg/ddy271
7. Kurki MI, Karjalainen J, Palta P, et al. FinnGen provides genetic insights from a well-phenotyped isolated population. Nature. 2023;613(7944):508–518. doi:10.1038/s41586-022-05473-8
8. Demange PA, Malanchini M, Mallard TT, et al. Investigating the genetic architecture of noncognitive skills using GWAS-by-subtraction. Nat Genet. 2021;53(1):35–44. doi:10.1038/s41588-020-00754-2
9. GenomicSEM/GenomicSEM. 2025. Available from: https://github.com/GenomicSEM/GenomicSEM.
10. Zou Y, Carbonetto P, Wang G, Stephens M. Fine-mapping from summary data with the “sum of single effects” model. PLOS Genet. 2022;18(7):e1010299. doi:10.1371/journal.pgen.1010299
11. Gusev A, Ko A, Shi H, et al. Integrative approaches for large-scale transcriptome-wide association studies. Nat Genet. 2016;48(3):245–252. doi:10.1038/ng.3506
12. GTEx Consortium. The GTEx Consortium atlas of genetic regulatory effects across human tissues. Science. 2020;369(6509):1318–1330. doi:10.1126/science.aaz1776
13. Wu C, Zhang Z, Yang X, Zhao B. Large-scale imputation models for multi-ancestry proteome-wide association analysis. bioRxiv. 2023;
14. Wen X, Pique-Regi R, Luca F. Integrating molecular QTL data into genome-wide genetic association analysis: probabilistic assessment of enrichment and colocalization. PLoS Genet. 2017;13(3):e1006646. doi:10.1371/journal.pgen.1006646
15. de Leeuw CA, Mooij JM, Heskes T, Posthuma D. MAGMA: generalized gene-set analysis of GWAS data. PLoS Comput Biol. 2015;11(4):e1004219. doi:10.1371/journal.pcbi.1004219
16. Lie MU, Pedersen LM, Heuch I, et al. Low back pain with persistent radiculopathy; the clinical role of genetic variants in the genes SOX5, CCDC26/GSDMC and DCC. Front Genet. 2022;12. doi:10.3389/fgene.2021.757632
17. Khoshbakht S, Başkurt D, Vural A, Vural S. Behçet’s disease: a comprehensive review on the role of HLA-B*51, antigen presentation, and inflammatory cascade. Int J Mol Sci. 2023;24:16382. doi:10.3390/ijms242216382
18. Ishigaki K, Lagattuta KA, Luo Y, James EA, Buckner JH, Raychaudhuri S. HLA autoimmune risk alleles restrict the hypervariable region of T cell receptors. Nat Genet. 2022;54(4):393–402. doi:10.1038/s41588-022-01032-z
19. Bögershausen N, Cavdarli B, Nagai TH, et al. SEC24C deficiency causes trafficking and glycosylation abnormalities in an epileptic encephalopathy with cataracts and dyserythropoeisis. JCI Insight. 2025;10(9):e173484. doi:10.1172/jci.insight.173484
20. Kausar M, Ain NU, Hayat F, et al. Biallelic variants in CHST3 cause spondyloepiphyseal dysplasia with joint dislocations in three Pakistani kindreds. BMC Musculoskelet Disord. 2022;23(1):818. doi:10.1186/s12891-022-05719-6
21. Otaify GA, Elhossini RM, Abdel-Ghafar SF, et al. CHST3‐related skeletal dysplasia in 14 patients: identification of 8 novel variants and further expansion of the phenotypic spectrum. Am J Med Genet A. 2023;191(8):2100–2112. doi:10.1002/ajmg.a.63246
22. Guan Y, Sun C, Zou F, et al. Carbohydrate sulfotransferase 3 (CHST3) overexpression promotes cartilage endplate‐derived stem cells (CESCs) to regulate molecular mechanisms related to repair of intervertebral disc degeneration by rat nucleus pulposus. J Cell Mol Med. 2021;25(13):6006–6017. doi:10.1111/jcmm.16440
23. Fiore NT, Debs SR, Hayes JP, Duffy SS, Moalem-Taylor G. Pain-resolving immune mechanisms in neuropathic pain. Nat Rev Neurol. 2023;19(4):199–220. doi:10.1038/s41582-023-00777-3
24. Houtman M, Hesselberg E, Rönnblom L, Klareskog L, Malmström V, Padyukov L. Haplotype-specific expression analysis of MHC class II genes in healthy individuals and rheumatoid arthritis patients. Front Immunol. 2021;12:707217. doi:10.3389/fimmu.2021.707217
25. Qiu W, Liu Y. DNA methylation of the MHC region in rheumatoid arthritis: perspectives and challenges. J Rheumatol. 2020;47(11):1597–1599. doi:10.3899/jrheum.191404
26. Ye F, Lyu FJ, Wang H, Zheng Z. The involvement of immune system in intervertebral disc herniation and degeneration. JOR Spine. 2022;5(1):e1196. doi:10.1002/jsp2.1196
27. Wilczyński K, Mazurski A, Kotucha K. Antidepressant efficacy in managing nonspecific chronic lower back pain among older adults: a review. J Pain Palliat Care Pharmacother. 2024;38(4):379–393. doi:10.1080/15360288.2024.2384961
28. Downes GB, Copeland NG, Jenkins NA, Gautam N. Structure and mapping of the G protein gamma3 subunit gene and a divergently transcribed novel gene, gng3lg. Genomics. 1998;53(2):220–230. doi:10.1006/geno.1998.5508
29. Masuda A, Nishida K, Ajima R, et al. A global gene regulatory program and its region-specific regulator partition neurons into commissural and ipsilateral projection types. Sci Adv. 2024;10(21):eadk2149. doi:10.1126/sciadv.adk2149
30. Kerloch T, Farrugia F, Bouit L, et al. The atypical rho GTPase Rnd2 is critical for dentate granule neuron development and anxiety-like behavior during adult but not neonatal neurogenesis. Mol Psychiatry. 2021;26(12):7280–7295. doi:10.1038/s41380-021-01301-z
31. Chen X-J, Wang L, Song X-Y. Mitoquinone alleviates vincristine-induced neuropathic pain through inhibiting oxidative stress and apoptosis via the improvement of mitochondrial dysfunction. Biomed Pharmacother. 2020;125:110003. doi:10.1016/j.biopha.2020.110003
 © 2026 The Author(s). This work is published and licensed by Dove Medical Press Limited. The
full terms of this license are available at https://www.dovepress.com/terms
and incorporate the Creative Commons Attribution
- Non Commercial (unported, 4.0) License.
By accessing the work you hereby accept the Terms. Non-commercial uses of the work are permitted
without any further permission from Dove Medical Press Limited, provided the work is properly
attributed. For permission for commercial use of this work, please see paragraphs 4.2 and 5 of our Terms.
© 2026 The Author(s). This work is published and licensed by Dove Medical Press Limited. The
full terms of this license are available at https://www.dovepress.com/terms
and incorporate the Creative Commons Attribution
- Non Commercial (unported, 4.0) License.
By accessing the work you hereby accept the Terms. Non-commercial uses of the work are permitted
without any further permission from Dove Medical Press Limited, provided the work is properly
attributed. For permission for commercial use of this work, please see paragraphs 4.2 and 5 of our Terms.