")
Back to Journals » Neuropsychiatric Disease and Treatment » Volume 15
Disrupted topological organization of human brain connectome in diabetic retinopathy patients
Authors Huang X, Tong Y, Qi CX , Xu YT, Dan HD, Shen Y
Received 3 May 2019
Accepted for publication 3 August 2019
Published 27 August 2019 Volume 2019:15 Pages 2487—2502
DOI https://doi.org/10.2147/NDT.S214325
Checked for plagiarism Yes
Review by Single anonymous peer review
Peer reviewer comments 2
Editor who approved publication: Dr Jun Chen
Xin Huang, Yan Tong, Chen-Xing Qi, Yang-Tao Xu, Han-Dong Dan, Yin Shen
Eye Center, Renmin Hospital of Wuhan University, Wuhan 430060, Hubei, People’s Republic of China
Correspondence: Yin Shen
Eye Center, Renmin Hospital of Wuhan University, No 238, Jie Fang Road, Wu Chang District, Wuhan 430060, Hubei, People’s Republic of China
Tel +86 1 387 155 0513
Email [email protected]
Objective: There is increasing neuroimaging evidence that type 2 diabetes patients with retinal microvascular complications show abnormal brain functional and structural architecture and are at an increased risk of cognitive decline and dementia. However, changes in the topological properties of the functional brain connectome in diabetic retinopathy (DR) patients remain unknown. The aim of this study was to explore the topological organization of the brain connectome in DR patients using graph theory approaches.
Methods: Thirty-five DR patients (18 males and 17 females) and 38 healthy controls (HCs) (18 males and 20 females), matched for age, sex, and education, underwent resting-state magnetic resonance imaging scans. Graph theory analysis was performed to investigate the topological properties of brain functional connectome at both global and nodal levels.
Results: Both DR and HC groups showed high-efficiency small-world network in their brain functional networks. Notably, the DR group showed reduction in the clustering coefficient (P=0.0572) and local efficiency (P=0.0151). Furthermore, the DR group showed reduced nodal centralities in the default-mode network (DMN) and increased nodal centralities in the visual network (VN) (P<0.01, Bonferroni-corrected). The DR group also showed abnormal functional connections among the VN, DMN, salience network (SN), and sensorimotor network (SMN). Altered network metrics and nodal centralities were significantly correlated with visual acuity and fasting blood glucose level in DR patients.
Conclusion: DR patients showed abnormal topological organization of the human brain connectome. Specifically, the DR group showed reduction in the clustering coefficient and local efficiency, relative to HC group. Abnormal nodal centralities and functional disconnections were mainly located in the DMN, VN, SN, and SMN in DR patients. Furthermore, the disrupted topological attributes showed correlations with clinical variables. These findings offer important insight into the neural mechanism of visual loss and cognitive deficits in DR patients.
Keywords: diabetic retinopathy, graph theory, functional connectome, resting-state functional magnetic resonance imaging
Introduction
Type 2 diabetes mellitus (T2DM) is the most common metabolic disease worldwide, which is characterized by insulin resistance and high blood glucose. The prevalence of diabetes is reportedly 10.9% among adults in People’s Republic of China.1 Long-term T2DM patients exhibit various microvascular complications, which affect cerebral,2 retinal,3 renal,4 and cardiac functions.5 Diabetic retinopathy (DR) is a serious diabetic retinal microvascular complication and one of the major causes of blindness worldwide.6 The main pathological changes in DR are capillary non-perfusion, as well as vascular leakage and degeneration. These are followed by proliferative retinal detachment and eventual blindness. The retinal vasculature shares similar anatomic, physiological, and embryological characteristics to cerebral vessels. Moreover, DR also leads to retinal neurodegeneration, which is related to cognitive impairment and brain structural changes. The retinal neurodegeneration can be an important index of cognitive status in DR patients.7,8 Sundstrom et al reported that diabetes-induced retinal neurodegeneration and brain neurodegenerative diseases share common pathogenic pathways.9 Ciudin et al demonstrated that retinal sensitivity assessed by microperimetry is related to brain neurodegeneration.10 There is increasing evidence that DR patients are at increased risk of small vessel disease and stroke.11–13 In addition, DR patients often show impaired cognition,14 and experience increased risks of dementia15–17and Alzheimer’s disease.18 Therefore, DR patients might exhibit abnormalities in the central nervous system.
Thus far, various neuroimaging studies have revealed that DR patients demonstrated widespread changes in brain structure and function. A voxel-based morphometry study reported the presence of significantly reduced gray-matter density in the right inferior frontal gyrus and right occipital lobe in DR patients, relative to healthy controls (HCs).19 Another study demonstrated that proliferative DR patients had increased apparent diffusion coefficient values in the orbitofrontal cortex, cingulated gyrus, and visual cortex.20 Tong et al found that the DR group showed lower N-acetylaspartate/creatine ratios in the frontal white matter and optic radiation, compared with HCs.21 van Duinkerken et al reported that proliferative DR patients had abnormal lower local path length and lower local clustering in the middle frontal, postcentral, and occipital areas in the gray-matter network, relative to HCs.22 Previous neuroimaging study demonstrated that reduced gray-matter volume was related to cerebral blood flow in corresponding brain region, which might affect the functional outcome.23 Meanwhile, the important brain structural changes might disrupt the large-scale functional network.24,25
In addition, they found that the DR group showed abnormal brain functional architecture. Wang et al revealed that the DR group had increased amplitude of low-frequency fluctuations (ALFF) in the bilateral occipital gyrus and decreased ALFF in the right posterior/anterior cerebellar lobe and the parahippocampal, fusiform, superior temporal, inferior parietal, and angular gyri, compared with HCs.26 van Duinkerken et al reported that DR patients had decreased connectivity with auditory and language, ventral attention, and left frontal-parietal networks.27 In addition, DR patients showed abnormal eigenvector centrality and degree centrality related to visual, sensorimotor, and auditory and language functional networks.28 However, the existing studies mainly focused on the altered functional and structural changes in brain regions and local functional network properties in DR patients. It is largely unknown whether and how the global and local topological organization of brain networks changes in DR patients.
The human brain is a complex functional connectome that uses a balance between integration and segregation to integrate various pieces of information. This approach is critical for the implementation of various neurophysiological functions, such as cognition,29–31 emotion and motivation,32 and executive function.33 Recent advances in graph theory approaches of resting-state functional magnetic resonance imaging (fMRI) have provided a powerful framework for characterization of the topological properties of the brain connectome.34,35 Graph theory approaches can reflect the features of the human brain in that they consist of nodes (brain regions) and edges (connections between nodes) in a large-scale network level. Previous neuroimaging studies demonstrated that the inclusion of a “small-world” network is a unique topological property of the human brain.36,37 Watts et al were the first to propose the mathematical concept of the small-world network, which is an intermediate stage between regular and random networks.38 The small-world network exhibits high clustering and low path length, thereby enabling rapid information transfer with a low “wiring cost.”39 Recently, graph theory approaches have been used to investigate the topological organization of functional networks in diabetes patients. van Bussel et al found that the T2DM patients exhibited a higher normalized clustering coefficient (γ) and higher local efficiency (Eloc), relative to HCs, and that this phenomenon was also apparent in prediabetic individuals.40 Another study reported that T2DM patients showed abnormal topological organization of the default-mode network (DMN), which was closely linked to episodic memory.41 Moreover, T2DM patients showed disrupted local and global network properties of the white matter network, which affected cognitive function.42,43 Importantly, these findings mainly focused on changes in the topological organization of patients who had diabetes without retinopathy. Dai et al reported that DR patients showed aberrant global network properties (small-world properties and Eloc and global efficiency [Eglob]) related to visual and cognitive impairment.44 However, it remains unknown whether DR patients display abnormal nodal centralities and functional connections.
Here, we aimed to determine whether DR patients show abnormal topological organization of the brain connectome compared to non-diabetic HCs. Moreover, we investigated the relationships between global and local network properties and clinical variables (visual function and biochemical examination) in DR patients. We hypothesized that disrupted topological organization of the functional network might be related to the visual loss and metabolic level in DR patients.
Materials and methods
Subjects: Thirty-five DR patients (type 2 diabetes mellitus) (18 males and 17 females) and 38 HCs (18 males and 20 females) – matched for age, sex, and education – participated in this study. The research protocol followed the Declaration of Helsinki and was approved by the medical ethics committee of the Renmin Hospital of Wuhan University. All subjects provided written informed consent to participate in the study.
All subjects met the following criteria: 1) no contraindications for MRI scanning (eg, no cardiac pacemaker or implanted metal devices); 2) no claustrophobia; and 3) they did not have heart disease and cerebral diseases.(The high-resolution T1-weighted imaging of all subjects was checked by an experienced radiologist.)
The diagnostic criteria of DR individuals were: 1) fasting plasma glucose ≥7.0 mmol/L, random plasma glucose ≥11.1 mmol/L, or 2 hrs glucose ≥11.1 mmol/L; 2) the nonproliferative DR group exhibited microaneurysms, hard exudates, and retinal hemorrhages. 3) All DR patients were nonproliferative DR. The classification of DR based on the original Early Treatment Diabetic Retinopathy Studygrading scheme and consists of mild and moderate nonproliferative DR (background DR), severe nonproliferative retinopathy (pre-proliferative diabetic retinopathy) and non-high risk and high risk proliferative DR (proliferative DR).
The exclusion criteria of DR individuals in the study were: 1) proliferative DR with retinal detachment; 2) vitreous hemorrhage; 3) additional ocular-related complications (eg, cataract, glaucoma, high myopia, or optic neuritis); and 4) DR individuals with diabetic nephropathy (urinary albumin/creatinine ratio >30 mg/g for more than 3 months), diabetic neuropathy.
All HCs met the following criteria: 1) fasting plasma glucose <7.0 mmol/L, random plasma glucose <11.1 mmol/L, and HbA1c <6.5%; 2) no ocular diseases (eg, myopia, cataracts, glaucoma, optic neuritis, or retinal degeneration); 3) binocular visual acuity ≥1.0; 4) no ocular surgical history; and 5) no mental disorders.
MRI parameters
MRI scanning was performed on a 3-T magnetic resonance scanner (Discovery MR 750W system; GE Healthcare, Milwaukee, WI, USA) with eight-channel head coil. Whole-brain T1 images were obtained with three-dimensional brain volume imaging (3D-BRAVO) MRI with the following parameters: repetition time [TR]/echo time [TE]=8.5/3.3, thickness=1.0 mm, no intersection gap, acquisition matrix=256×256, field of view=240×240 mm2, and flip angle=12°.
Functional images were obtained by using a gradient-echo-planar imaging sequence with the following parameters: TR/TE=2000 ms/25 ms, thickness=3.0 mm, gap=1.2 mm, acquisition matrix=64×64, flip angle=90°, field of view=240×240 mm2, voxel size =3.6×3.6×3.6 mm3, and 35 axial slices. All subjects were instructed to keep their eyes closed, remain as still as possible, not to think of anything in particular and not to fall asleep.
fMRI data processing
The fMRI data preprocessing was performed using the toolbox for Data Processing & Analysis of Brain Imaging (http://www.rfmri.org/dpabi),45 which is based on Statistical Parametric Mapping 8 (http://www.fil.ion.ucl.ac.uk) implemented in MATLAB 2013a (MathWorks, Natick, MA, USA). Briefly, following these steps: 1) DICOM format of the functional images were converted to NIFTI format, and the first ten volumes were discarded to reach equilibrium. 2) The remaining BOLD images were corrected for slice timing effects and then realigned to the first volume to correct for head motion. Data from subjects whose head motion was >2 mm or for whom rotation exceeded 2° during scanning were excluded.46,47 3) Individual 3D-BRAVO structural images were registered to the mean fMRI data, and the resulting aligned structural images were segmented using the Diffeomorphic Anatomical Registration Through Exponentiated Lie Algebra toolbox to improve spatial precision in the normalization of fMRI data.48 Normalized data (in Montreal Neurological Institute 152 space) were re-sliced at a resolution of 3×3×3 mm3 and smoothed with a 6-mm full-width at half-maximum Gaussian kernel. 4) Data with linear trends were removed and linear regression analysis was used to regress out several covariates (Friston 24-parameter parameters, mean framewise displacement [FD],49 global brain signal,50 and averaged signal from white matter signal and cerebrospinal fluid). 5) A temporal band-pass filter (0.01–0.08 Hz) was used to reduce the effects of low- and high-frequency physiological noise.
Functional network construction
Node and edge definitions
The network was constructed by using the graph theoretical network analysis toolbox GRETNA (http://www.nitrc.org/projects/gretna/).51 Node definition: each subject’s brain was divided into 90 cortical and subcortical regions of interest, based on the automated anatomic labeling (AAL) atlas52 (Table S1). To define the edges of the network, the mean time series of each region was acquired. Pearson’s correlation coefficients between the regional mean time series of all possible pairs of the 90 brain regions were then calculated as edges in the network, resulting in a 90×90 Pearson’s correlation. Then, this matrix was converted into a binary matrix, where the entry aij equaled 1 if the absolute Pearson correlation between regions i and j exceeded the threshold, and equaled 0 otherwise.53 All individual correlation maps were z-transformed with Fisher’s r-to-z transformation to reduce the influence of individual variation for group statistical comparisons.
Network analysis
Threshold selection
To avoid differences in correlation levels between groups, a wide range of sparsity (Sp) thresholds S to all correlation matrices. Sp was defined as the ratio of the existing edges, divided by the maximum possible number of edges in a network, which ensured that all resultant networks would have the same numbers of edges and minimized the effects of possible discrepancies in overall correlation strength between the groups. A wide range of threshold levels was established using the following criteria: 1) the average degree of each network was >2×log(N) ≈9 (where N=90 and the total number of edges of each network was therefore >405); and 2) the scalar small-worldness of each network was >1.1 for all subjects.53 In accordance with previous studies,54,55 a wide range of Sp levels (from 0.10< Sp <0.34, using intervals of 0.01) was used in this study. The area under the curve (AUC) of each network metric was calculated over the Sp range from S1 to Sn, with an interval of ∆S. This depicted changes in the topological characterization of the brain networks. The integrated AUC metric is sensitive for detecting topological alterations of brain functional connectome.
Global metrics and nodal metrics of functional networks
The topological properties of brain functional networks at both global and local levels were calculated at each threshold. The global metrics were of two types: small-world parameters,38 including clustering coefficient (Cp), characteristic path length (Lp), γ, normalized characteristic path length (λ), and scalar small-worldness (σ); and network efficiency,56 including Eglob and Eloc. The concepts of the small-world and network efficiency properties of Cp, Lp, γ, λ, σ, Eglob, and Eloc are shown in Table 1. A small-world network with a much higher Cp and similar Lp, compared with those of random networks (100 matched random networks), was designed using the following criteria: γ=Cpreal/Cprand >1, and λ=Lpreal/Lprand ≈1; these comprise the small-worldness equation, σ=γ/λ >1.
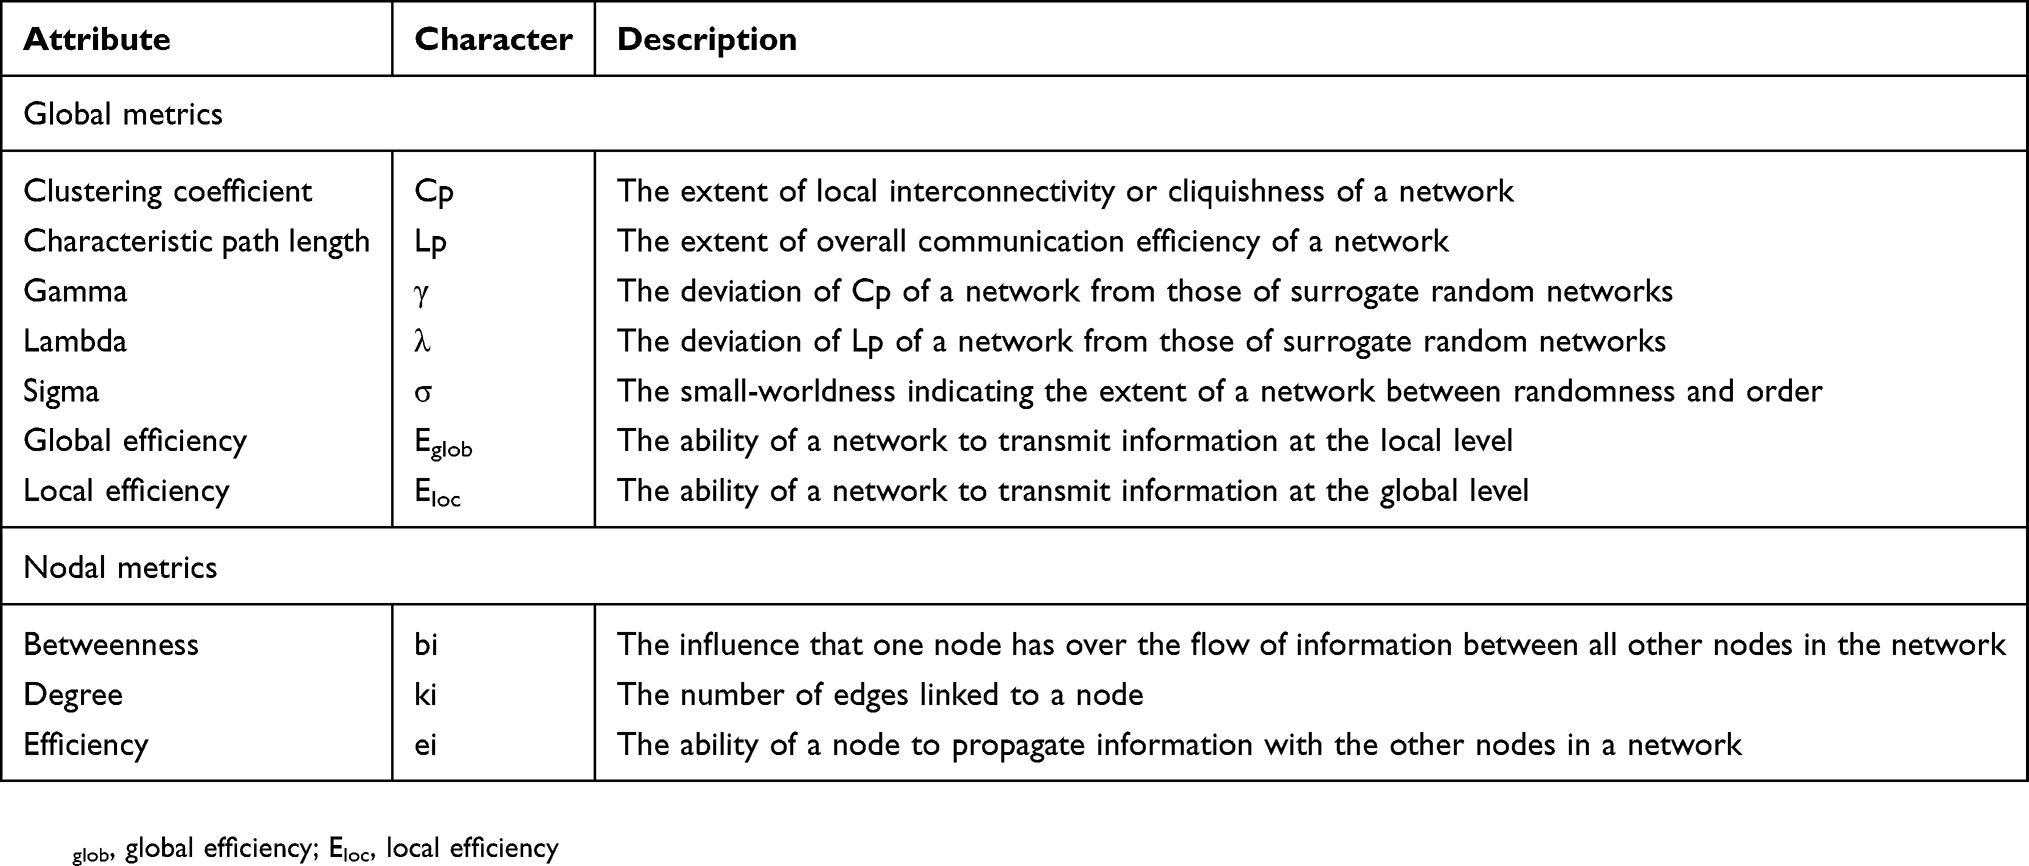 |
Table 1 Descriptions of the network metrics examined in this study |
Nodal metrics of functional networks: nodal degree, nodal efficiency (Enod), and nodal betweenness
The concepts of nodal metrics are listed in Table 1. The nodal characteristics of the brain networks measured the extent to which a given node was connected to all other nodes of a network and were regarded as indicators of the importance of specific brain areas in the network.57
Statistical analysis
The χ2 test and independent-samples t-test were both used to compare clinical variables between the two groups using SPSS version 16.0 (SPSS Inc., Chicago, IL, USA).
The two-sample t-test was used to compare group differences in the six global network parameters (P<0.05, Bonferroni-corrected), and the three regional nodal parameters (P<0.01, Bonferroni-corrected). The AUC of each metric was calculated for statistical comparison under the Sp range (0.10<Sp<0.34, using intervals of 0.01). Age, sex, educational level, and mean FD were entered as covariates.
To locate the specific pairs of brain regions with altered functional connectivity in DR patients, we identified region pairs that exhibited between-group differences in nodal characteristics and then used the network-based statistics (NBS) method (http://www.nitrc.org/projects/nbs/)58 to define a set of suprathreshold significant changes between any connected components (P<0.01; threshold T=2.649). The nonparametric permutation method (10,000 permutations) was used to calculate the significance of each component, with age, sex, educational level, and mean FD entered as covariates.
A partial correlation analysis was conducted to assess relationships between network metrics and clinical variables in the DR group using SPSS version 16.0 software (SPSS Inc.).
Results
Demographics and visual measurements
There were significant differences in best-corrected visual acuity (P<0.001) between two groups. There were no significant differences in sex, age, education, or body mass index between two groups. More details are shown in Table 2.
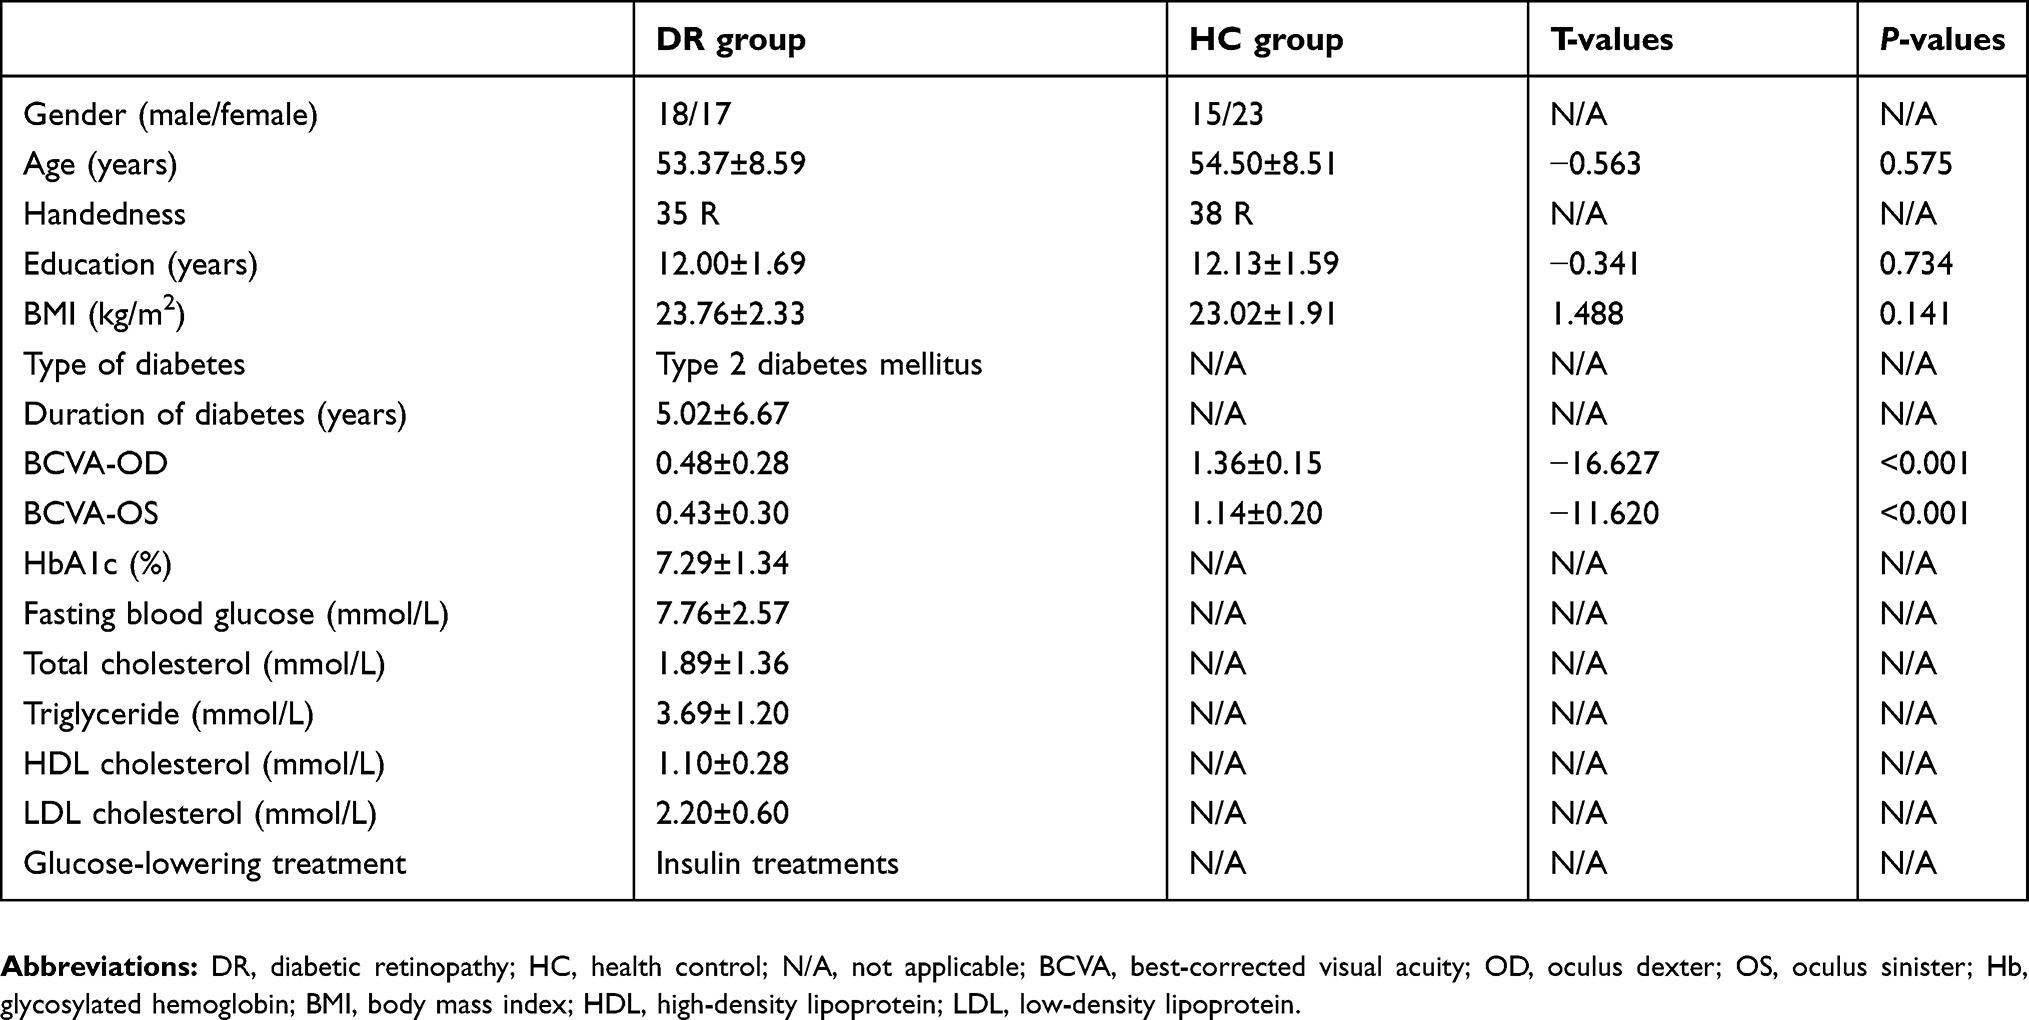 |
Table 2 Demographics and visual measurements between two groups |
Small-world properties of brain functional networks
In the defined threshold range (0.10<Sp<0.34, step =0.01), both DR and HC group showed small-world topological organization in the brain functional connectome. Compared with HCs, the DR group showed significant reductions in Cp (P=0.0572) and Eloc (P=0.0151). However, there were no significant differences in γ (P=0.1586), λ (P=0.1119), Lp (P=0.3996), σ (P=0.2764), and Eglob (P=0.2689) between two groups. (Table 3, Figure 1).
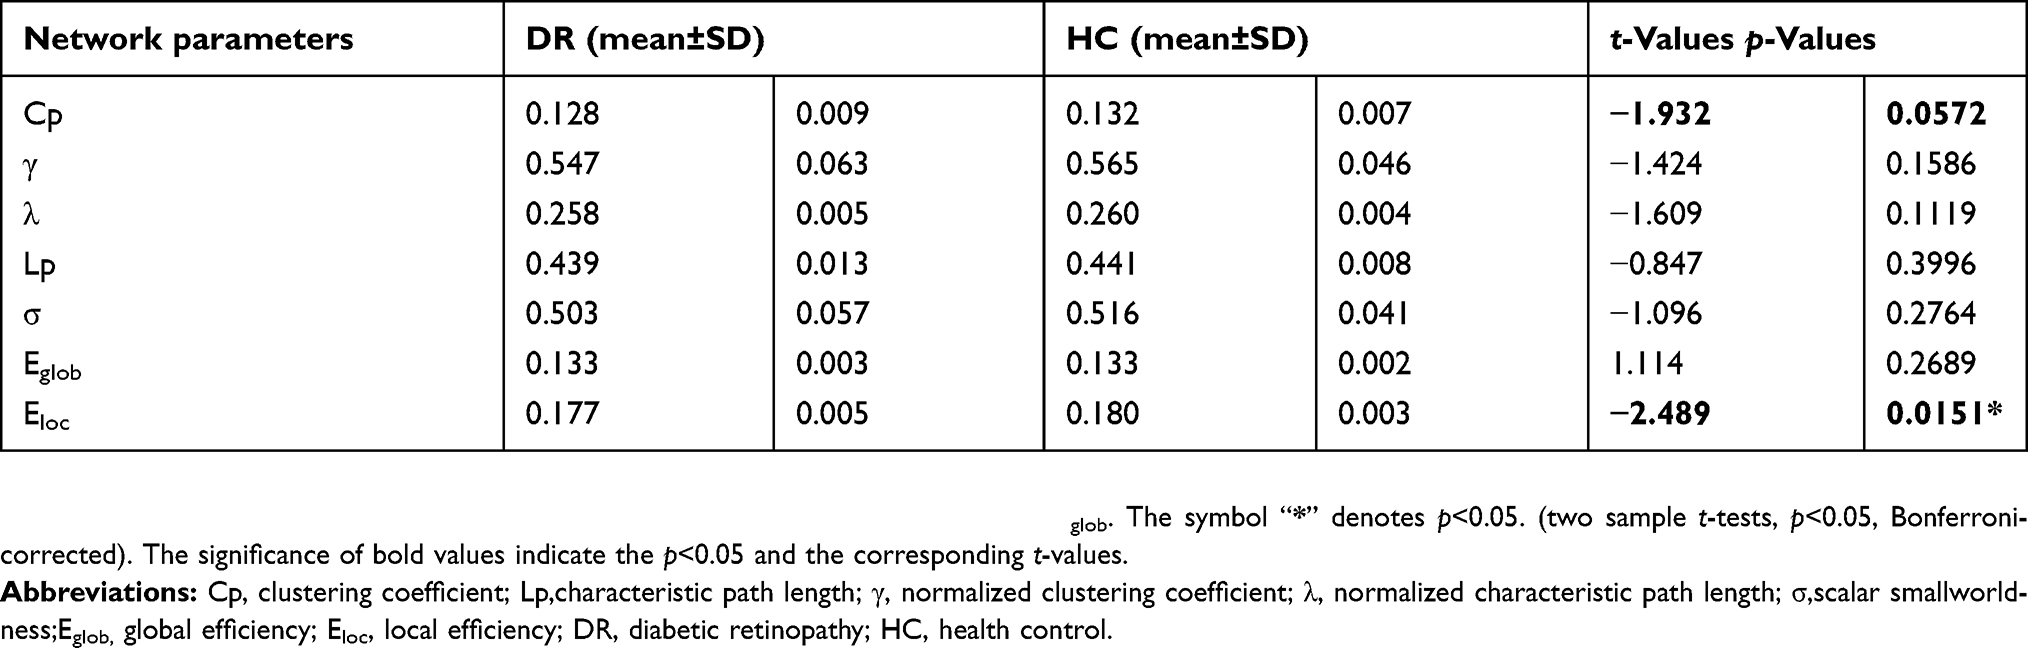 |
Table 3 Significant differences in integrated global network parameters between two groups |
Nodal characteristics of brain functional networks
We identified brain regions that showed significant between-group differences in at least one nodal metric (P<0.01, Bonferroni-corrected). Compared with the HC group, the DR group showed significant reductions in nodal centralities in the right superior frontal gyrus orbital part and right superior temporal gyrus, and increased nodal centralities in the right middle frontal gyrus orbital part, left calcarine, right cuneus, and right caudate (Table 4, Figure 2).
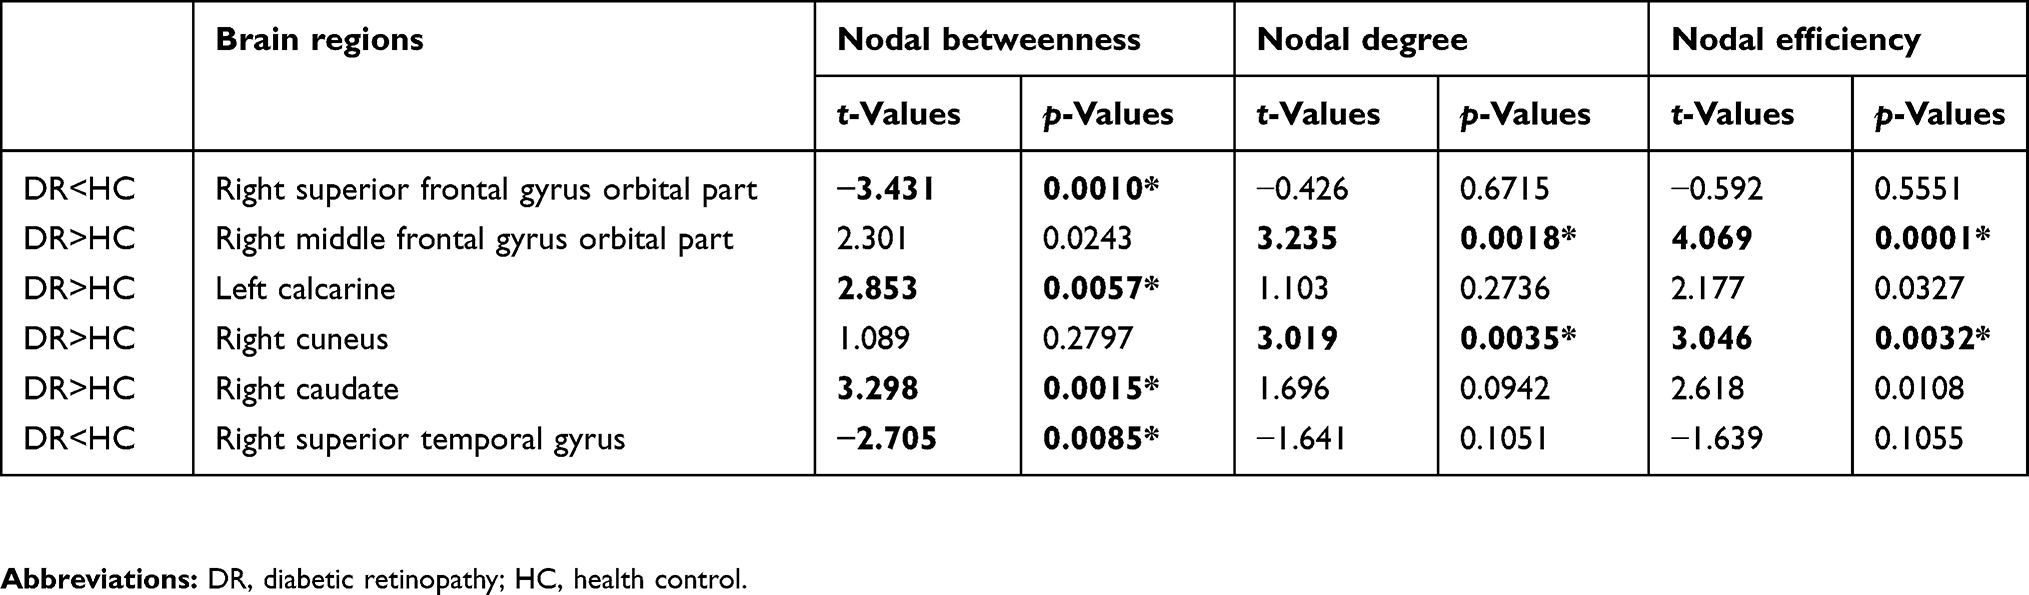 |
Table 4 Between-group differences in nodal characteristics in patients with DR and HC |
DR-related alterations in functional connectivity
The NBS method identified a significantly altered network (40 nodes and 52 connections) in the DR group, relative to HCs (P<0.01; threshold T=2.649). These nodes were mainly located in the frontal, prefrontal, occipital, parietal, and subcortical regions, which included the visual network (VN) (CUN, LING, SOG, and IOG), DMN regions (PCUN, middle frontal gyrus, ACG, and ANG), SN regions (insula and PAL), and sensorimotor network (SMN) regions (precentral gyrus [PreCG] and PCG). The connections were mainly involved in long-distance connections between different regions, including decreased functional connectivity in the frontal-parietal and temporal-parietal regions, as well as increased functional connectivity in the OLF-occipital and parietal-prefrontal regions. The connections were also involved in decreased short-distance connections within occipital regions and temporal regions (Table 5, Figure 3).
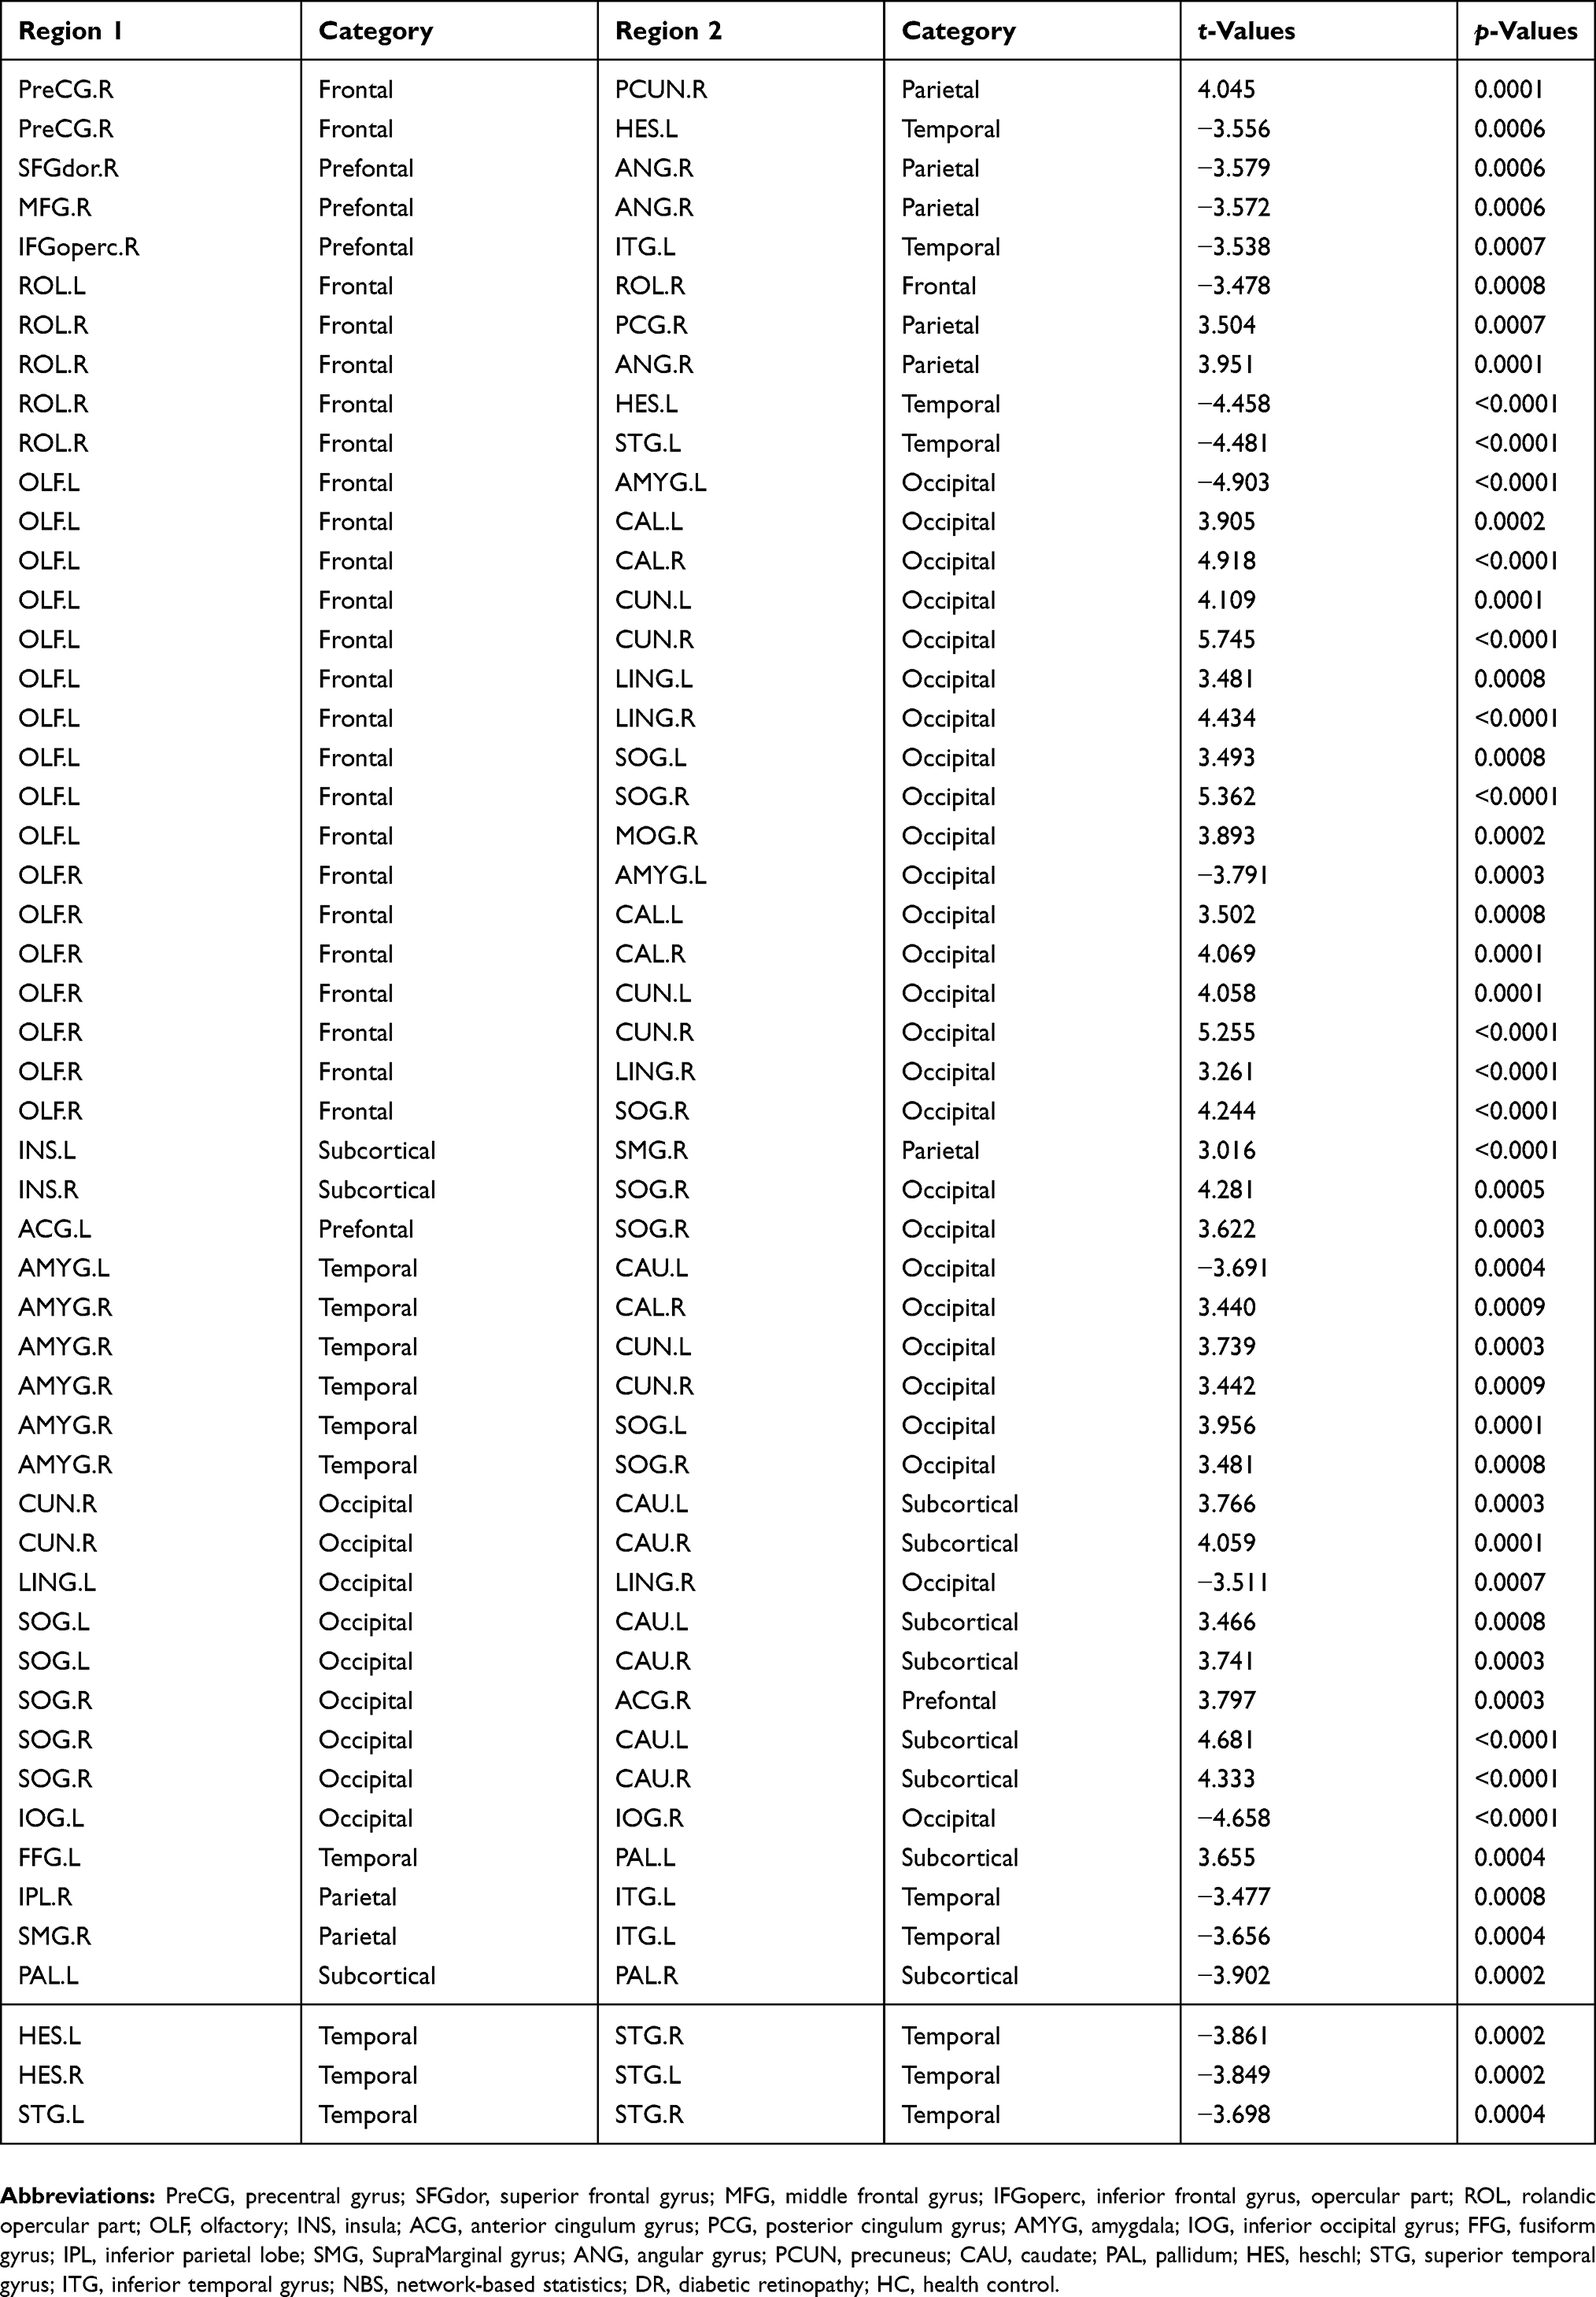 |
Table 5 Significantly altered functional connectivities in DR patients compared with HCs |
Relationships between network properties and clinical variables in the DR group
In DR group, visual acuity-OD was positively correlated with Cp (r=0.497, P=0.002), λ (r=0.540, P=0.001), Lp (r=0.512, P=0.002), and Eloc (r=0.397, P=0.018). Visual acuity-OD was negatively correlated with Eglob (r=−0.506, P=0.002) and Enod of CUN (r=−0.357, P=0.036). Fasting blood glucose level was negatively correlated with nodal degree of CUN (r=−0.379, P=0.025) (Figure 4).
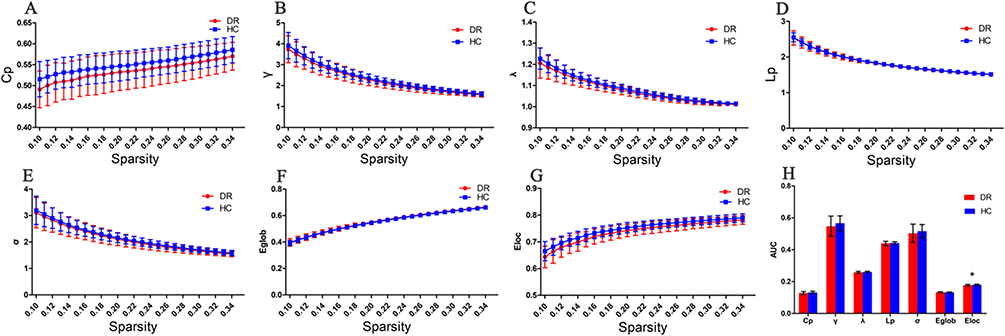 |
Figure 1 Graphs show that in the defined range of sparsity (0.10<S<0.34), both the DR and HC groups exhibited typical features of small-world properties (γ=Cpreal/Cprand>1,λ=Lpreal/Lprand≈1). The circle and square correspond to the mean value of DR and HCs, respectively, and error bars to the standard error of the subject group in each state. (A–G) The AUC of small-word properties and network efficiency was shownin histogram graphs (H). The symbol “*” denotes statistical significance. Abbreviations: Cp, clustering coefficient; Lp, characteristic path length; γ, normalized clustering coefficient; λ, normalized shortest path length; Eloc, local efficiency; Eglob, global efficiency; AUC, area under curve; DR, diabetic retinopathy; HC, health control. |
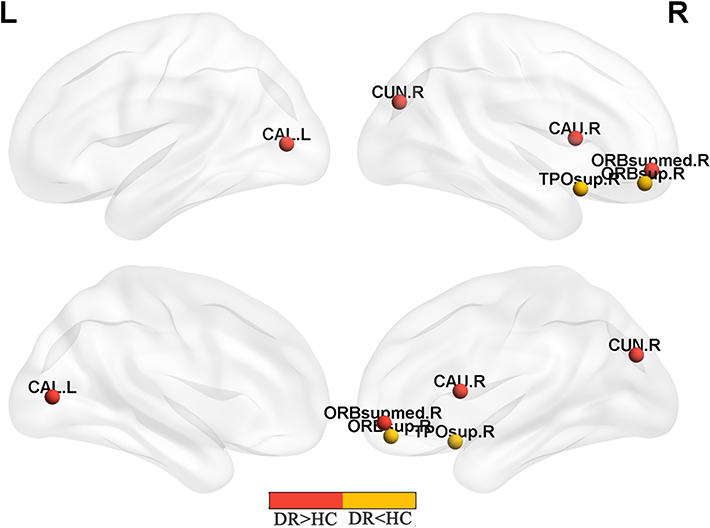 |
Figure 2 Significant nodal characteristics map the differences between two groups. Notes: Red color indicates increased nodal characteristics (DR>HC). Yellow color indicates decreased nodal characteristics (DR<HC) (P<0.01, Bonferroni-corrected). The DR group had a significant decreased nodal centralities in the ORBsup.R and TPOsup.R, and significant increased nodal centralities in ORBsupmed.R, CAL.L, CAU.R and CUN.R.Abbreviations: ORBsup, superior frontal gyrus orbital part; TPOsup, superior temporal gyrus; ORBsupmed, middle frontal gyrus orbital part; CAL, calcarine; CAN, caudate; CUN, cuneus; R, right; L, left; DR, diabetic retinopathy; HC, health control. |
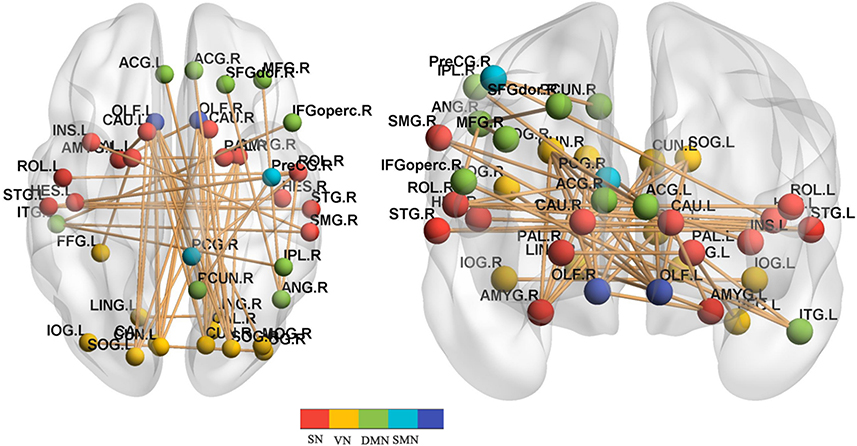 |
Figure 3 DR-related alterations in FC. Notes: NBS method identified a significantly altered network (40 nodes and 52 connections) in DR group relative to HCs. (P<0.01;threshold T=2.649). The DR patients showed abnormal long-distance and short-distance functional connections between/within SN, VN, DMN, and SMN. Abbreviations: PreCG, precentral gyrus; SFGdor, superior frontal gyrus; MFG, middle frontal gyrus; IFGoperc, inferior frontal gyrus, opercular part; ROL, rolandic opercular part; OLF, olfactory; INS, insula; ACG, anterior cingulum gyrus; PCG, posterior cingulum gyrus; AMYG, amygdala; IOG, inferior occipital gyrus; FFG, fusiform gyrus; IPL, inferior parietal lobe; SMG, SupraMarginal gyrus; ANG, angular gyrus; PCUN, precuneus; CAU, caudate; PAL, pallidum; HES, heschl; STG, superior temporal gyrus; ITG, inferior temporal gyrus; SN, salience network; VN, visual network; DMN, default-mode network; SMN, sensorimotor network; NBS, network-based statistics; DR, diabetic retinopathy; HC, health control. |
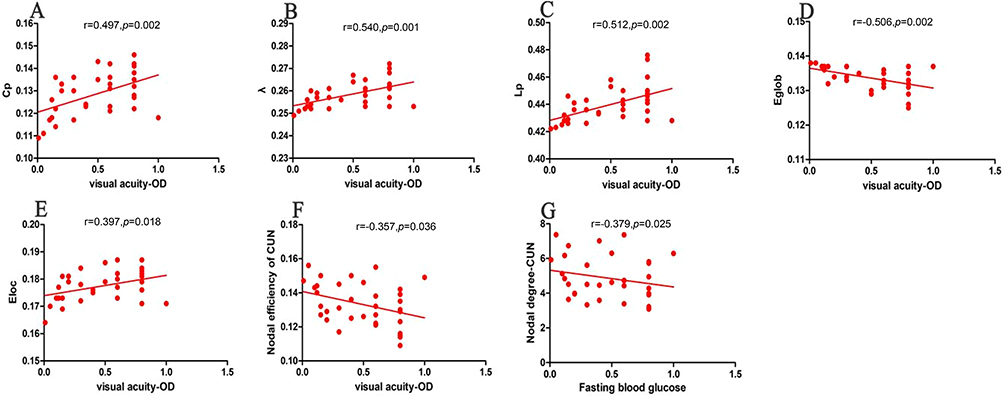 |
Figure 4 Correlations between topological properties and clinical variables in DR patients.The visual acuity-OD was positively correlated with Cp (r=0.497, p=0.002)(A), λ (r=0.540, p=0.001) (B), Lp (r=0.512, p=0.002) (C) and Eloc(r=0.397, p=0.018) (E). The visual acuity-OD was negatively correlated with Eglob(r=−0.506, p=0.002) (D) and nodal efficiency of CUN (r=−0.357, p=0.036) (F). The Fasting blood glucose level was negatively correlated with nodal degree of CUN ((r=−0.379, p=0.025) (G). Abbreviations: Cp, clustering coefficient; Lp, characteristic path length; γ, normalized clustering coefficient; λ, normalized characteristic path length; σ, scalar small worldness; Eglob, global efficiency; Eloc, local efficiency; OD, oculus dexter; CUN, cuneus; DR, diabetic retinopathy. |
Discussion
In our study, the graph theory approach was used to investigate the topological organization of the human brain connectome in DR patients, compared with non-diabetic HCs. Disrupted topological organization in local and global levels were identified in the DR group: 1) DR patients showed decreased Cp and Eloc, compared with HCs; 2) DR patients had significantly decreased nodal centralities in the right superior frontal gyrus orbital part and right superior temporal gyrus, and increased nodal centralities in the right middle frontal gyrus orbital part, VN regions (left calcarine and right cuneus) and right caudate; 3) DR-related alterations in functional connectivity were identified in the VN (CUN, LING, SOG, and IOG), DMN regions (PCUN, middle frontal gyrus, ACG, and ANG), SN regions (insula and PAL), and SMN regions (PreCG and PCG). 4) Visual acuity-OD was positively correlated with Cp, λ, Lp, and Eloc, and negatively correlated with Eglob and Enod of CUN. Fasting blood glucose level was negatively correlated with nodal degree of CUN.
The human brain is a complex, interconnected system and with various important topological features, including small-world network,59 high efficiency at a low cost,57 and highly connected hubs.60 The small-world network is characterized by a high Cp and low Lp, which facilitate efficient information segregation and integration at low wiring and energy cost.61 In the present study, both DR and HC groups showed similar small-world attributes in brain functional networks. However, DR patients showed decreased Cp and Eloc, compared with HCs. Cp indicates the tendency to which the neighboring nodes of a given node are interconnected reflecting the extent of local cliquishness.62 Thus, low Cp and Eloc indicate lower local connectivity in functional networks, and weaker efficiency in information transfer for interconnected regions in DR patients. A previous study reported that T2DM patients showed lower Cp and reduced Eglob in white matter networks, which were correlated with reduction of information processing speed.42 Zhang et al also demonstrated reduced Eglob and Eloc of white matter networks in T2DM patients.43 In contrast, van Bussel et al found that T2DM patients without retinopathy exhibited higher γ and higher Eloc of functional networks, relative to HCs.40 Type 1 diabetes mellitus (T1DM) patients with proliferative retinopathy showed lower clustering of gray-matter networks in the middle frontal, postcentral, inferior occipital, lingual, and fusiform regions.22 In line with these findings, our results suggested that DR patients displayed an impaired network Eloc, which might reflect the neural mechanism of cognitive deficits in these patients. Moreover, visual acuity-OD was positively correlated with Cp. Thus, vision loss might contribute to local network efficiency impairment in DR patients.
In addition to the global topologies, we also investigated the nodal centralities of functional network changes in DR patients. Nodal centralities are important nodes within the network, which play critical roles in the integration of diverse informational sources and facilitate the reduction of wiring and metabolism costs by limiting the numbers of long-distance connections used for integration of local networks. DR patients showed significant reduction in nodal betweenness in the right superior frontal gyrus, orbital part, and increased nodal degree and Enod in the right middle frontal gyrus, orbital part. These nodal centralities are core hubs of the DMN. Previous studies reported that T2DM patients exhibited a disrupted DMN, which was correlated with cognitive impairment.41,63 Thus, we speculated that DR patients might show an abnormal DMN.
In addition, we found that DR patients had increased nodal centralities in the VN regions (left calcarine and right cuneus). Wang et al reported that DR patients showed increased ALFF values in the bilateral occipital gyrus.26 Another study demonstrated increased eigenvector centrality in the lateral occipital cortex and right cuneus of T2DM patients with proliferative retinopathy. Moreover, the eigenvector centrality was related to improved cognition.28 However, Liu et al reported that T2DM patients without retinopathy showed reduced degree centrality in the bilateral lateral occipital cortices.64 Thus, reduced retinal input due to retinopathy might contribute to the disrupted VN in DR patients. In line with these findings, our results suggested that DR patients might show impaired information transmission efficiency within the VN. Moreover, nodal centralities in the right cuneus showed negative correlations with visual acuity and fasting blood glucose level. Thus, we speculated that dysfunction of nodal centralities in the VN might reflect vision loss and glucose level in DR patients.
A DR-related subnetwork (40 nodes and 52 connections) was identified mainly in the VN, SN, DMN, and SMN. The VN plays an important role in visual information processing. Our study revealed that widespread altered connectivity was present within the VN and frontal (olfactory) to occipital regions in DR group. Nonproliferative DR was associated with abnormal retinal microvascular findings (microaneurysms, retinal vascular hyperpermeability, exudates, and intraretinal “dot” hemorrhages), which followed proliferative DR and diabetic macular edema. Reduced retinal input might induce dysfunction in the VN in DR patients. Moreover, structural MRI demonstrated that T2DM patients had reduced gray-matter volume in the occipital gyrus65,66 and lower axial diffusivity in the right inferior fronto-occipital tract.67 Peng et al reported that T2DM patients had decreased regional homogeneity (ReHo) in the occipital lobe.68 T2DM patients showed decreased ALFF and ReHo values in the occipital lobe.69 Furthermore, T1DM patients with microangiopathy showed decreased connectivity in the VN.27 Consistent with these findings, we observed that DR patients had VN impairment, which might be due to vision loss in these patients. Remarkably, increased functional connectivity between the olfactory region and occipital lobe was observed in DR patients. The olfactory region is an important component of the sensory system, which plays an important role in olfactory function. There is increasing evidence that olfactory function is closely linked to cognitive decline.70,71 Previous studies revealed that olfactory dysfunction was observed in diabetes patients;72,73 olfactory deficits also showed a close correlation with cognitive impairment in diabetes patients.74,75 Here, we found that DR patients showed increased connectivity between the olfactory region and visual cortex, which might predict cognitive impairment in DR patients.
Disrupted functional connectivity within the DMN was observed in DR patients in the present study. The DMN is an important brain network that is active at rest and suppressed during tasks.76,77 It is involved in several key physiological functions, such as cognition (episodic memory, theory of mind and self-evaluation)78 and emotion.79 Cui et al demonstrated that T2DM patients showed disrupted DMN connectivity, which was closely related to cognitive decline.63 Chen et al found that T2DM patients showed abnormal topological organization in the DMN prior to the onset of memory impairment.41 Thus, disrupted connectivity in the DMN might reflect cognitive deficits in DR patients.
Disrupted functional connectivity in the SMN was observed in DR patients in the present study. Notably, diabetic peripheral neuropathy patients reportedly showed structural abnormalities in the somatosensory cortex;80 Liu et al also demonstrated that T2DM patients had decreased ReHo in the PreCG, relative to HCs.64 DR patients often show peripheral neuropathy.81 We found that DR pathology was associated with the SMN, suggesting sensorimotor function impairment in DR patients.
Some limitations must be acknowledged in our study. First, our study involved relatively small sample sizes. Second, our study was lack of an assessment of retinal neurodegeneration or neurodysfunction in DR patients. Third, the automated anatomic labeling atlas (90×90 brain regions) was used to identify brain regions, but differences in template regions may cause considerable variations in graph-based theoretical parameters, which must be explicitly compared in future work. Fourth, physiologic noise, including respiratory, head motion, and cardiac fluctuations, might have compromised our results.
Conclusion
Our results demonstrated that DR patients showed abnormal topological organization of the human brain connectome. Specifically, the DR group showed reductions in the Cp and Eloc, relative to those in the HC group. Abnormal nodal centralities and functional disconnections were mainly located in the DMN, VN, SN, and SMN in DR patients. Furthermore, the disrupted topological attributes were correlated with vision loss and fasting blood glucose.
Acknowledgment
This research was supported by the National Nature Science Foundation of China (Grant No. 81470628, 81800872) and the International Science & Technology Cooperation Program of China (2017YFE0103400).
Disclosure
The authors declare no conflicts of interest in this work.
References
1. Wang L, Gao P, Zhang M, et al. Prevalence and ethnic pattern of diabetes and prediabetes in China in 2013. JAMA. 2017;317(24):2515–2523. doi:10.1001/jama.2017.7596
2. Xu RS. Pathogenesis of diabetic cerebral vascular disease complication. World J Diabetes. 2015;6(1):54–66. doi:10.4239/wjd.v6.i1.54
3. Yau JW, Rogers SL, Kawasaki R, et al. Global prevalence and major risk factors of diabetic retinopathy. Diabetes Care. 2012;35(3):556–564. doi:10.2337/dc11-1909
4. Gray SP, Jandeleit-Dahm K. The pathobiology of diabetic vascular complications–cardiovascular and kidney disease. J Mol Med (Berl). 2014;92(5):441–452. doi:10.1007/s00109-014-1146-1
5. Bahtiyar G, Gutterman D, Lebovitz H. Heart failure: a major cardiovascular complication of diabetes mellitus. Curr Diab Rep. 2016;16(11):116. doi:10.1007/s11892-016-0809-4
6. Wong TY, Cheung CM, Larsen M, Sharma S, Simó R. Diabetic retinopathy. Nat Rev Dis Primers. 2016;2:16012. doi:10.1038/nrdp.2016.12
7. Simó R, Stitt AW, Gardner TW. Neurodegeneration in diabetic retinopathy: does it really matter? Diabetologia. 2018;61(9):1902–1912. doi:10.1007/s00125-018-4692-1
8. Simó R, Hernández C. Neurodegeneration in the diabetic eye: new insights and therapeutic perspectives. Trends Endocrinol Metab. 2014;25(1):23–33. doi:10.1016/j.tem.2013.09.005
9. Sundstrom JM, Hernández C, Weber SR, et al. Proteomic analysis of early diabetic retinopathy reveals mediators of neurodegenerative brain diseases. Invest Ophthalmol Vis Sci. 2018;59(6):2264–2274. doi:10.1167/iovs.17-23678
10. Ciudin A, Simó-Servat O, Hernández C, et al. Retinal microperimetry: a new tool for identifying patients with type 2 diabetes at risk for developing alzheimer disease. Diabetes. 2017;66(12):3098–3104. doi:10.2337/db17-0382
11. Woerdeman J, van Duinkerken E, Wattjes MP, et al. Proliferative retinopathy in type 1 diabetes is associated with cerebral microbleeds, which is part of generalized microangiopathy. Diabetes Care. 2014;37(4):1165–1168. doi:10.2337/dc13-1586
12. Sanahuja J, Alonso N, Diez J, et al. Increased burden of cerebral small vessel disease in patients with type 2 diabetes and retinopathy. Diabetes Care. 2016;39(9):1614–1620. doi:10.2337/dc15-2671
13. Hägg S, Thorn LM, Putaala J, et al. Incidence of stroke according to presence of diabetic nephropathy and severe diabetic retinopathy in patients with type 1 diabetes. Diabetes Care. 2013;36(12):4140–4146. doi:10.2337/dc13-0669
14. Crosby-Nwaobi RR, Sivaprasad S, Amiel S, Forbes A. The relationship between diabetic retinopathy and cognitive impairment. Diabetes Care. 2013;36(10):3177–3186. doi:10.2337/dc12-2141
15. Biessels GJ, Despa F. Cognitive decline and dementia in diabetes mellitus: mechanisms and clinical implications. Nat Rev Endocrinol. 2018;14(10):591–604. doi:10.1038/s41574-018-0048-7
16. Ciudin A, Espinosa A, Simó-Servat O, et al. Type 2 diabetes is an independent risk factor for dementia conversion in patients with mild cognitive impairment. J Diabetes Complications. 2017;31(8):1272–1274. doi:10.1016/j.jdiacomp.2017.04.018
17. Simó R, Ciudin A, Simó-Servat O, Hernández C. Cognitive impairment and dementia: a new emerging complication of type 2 diabetes-The diabetologist’s perspective. Acta Diabetol. 2017;54(5):417–424. doi:10.1007/s00592-017-0970-5
18. Kroner Z. The relationship between Alzheimer’s disease and diabetes: type 3 diabetes? Altern Med Rev. 2009;14(4):373–379.
19. Wessels AM, Simsek S, Remijnse PL, et al. Voxel-based morphometry demonstrates reduced grey matter density on brain MRI in patients with diabetic retinopathy. Diabetologia. 2006;49(10):2474–2480. doi:10.1007/s00125-006-0283-7
20. Wang Z, Lu Z, Li J, et al. Evaluation of apparent diffusion coefficient measurements of brain injury in type 2 diabetics with retinopathy by diffusion-weighted MRI at 3.0 T. Neuroreport. 2017;28(2):69–74. doi:10.1097/WNR.0000000000000703
21. Tong J, Geng H, Zhang Z, et al. Brain metabolite alterations demonstrated by proton magnetic resonance spectroscopy in diabetic patients with retinopathy. Magn Reson Imaging. 2014;32(8):1037–1042. doi:10.1016/j.mri.2014.04.020
22. van Duinkerken E, Ijzerman RG, Klein M, et al. Disrupted subject-specific gray matter network properties and cognitive dysfunction in type 1 diabetes patients with and without proliferative retinopathy. Hum Brain Mapp. 2016;37(3):1194–1208. doi:10.1002/hbm.23096
23. .Zhang S, Wang B, Xie Y, et al. Retinotopic changes in the gray matter volume and cerebral blood flow in the primary visual cortex of patients with primary open-angle glaucoma. Invest Ophthalmol Vis Sci. 2015;56(10):6171–6178. doi:10.1167/iovs.15-17286
24. Roland JL, Snyder AZ, Hacker CD, et al. On the role of the corpus callosum in interhemispheric functional connectivity in humans. Proc Natl Acad Sci U S A. 2017;114(50):13278–13283. doi:10.1073/pnas.1707050114
25. Johnston JM, Vaishnavi SN, Smyth MD, et al. Loss of resting interhemispheric functional connectivity after complete section of the corpus callosum. J Neurosci. 2008;28(25):6453–6458. doi:10.1523/JNEUROSCI.0573-08.2008
26. Wang ZL, Zou L, Lu ZW, et al. Abnormal spontaneous brain activity in type 2 diabetic retinopathy revealed by amplitude of low-frequency fluctuations: a resting-state fMRI study. Clin Radiol. 2017;72(4):
27. van Duinkerken E, Schoonheim MM, Sanz-Arigita EJ, et al. Resting-state brain networks in type 1 diabetic patients with and without microangiopathy and their relation to cognitive functions and disease variables. Diabetes. 2012;61(7):1814–1821. doi:10.2337/db11-1358
28. van Duinkerken E, Schoonheim MM, IJzerman RG, et al. Altered eigenvector centrality is related to local resting-state network functional connectivity in patients with longstanding type 1 diabetes mellitus. Hum Brain Mapp. 2017;38(7):3623–3636. doi:10.1002/hbm.23617
29. Cohen JR, D’Esposito M. The segregation and integration of distinct brain networks and their relationship to cognition. J Neurosci. 2016;36(48):12083–12094. doi:10.1523/JNEUROSCI.2965-15.2016
30. Mill RD, Ito T, Cole MW. From connectome to cognition: the search for mechanism in human functional brain networks. Neuroimage. 2017;160:124–139. doi:10.1016/j.neuroimage.2017.01.060
31. Park HJ, Friston K. Structural and functional brain networks: from connections to cognition. Science. 2013;342(6158):1238411. doi:10.1126/science.1238411
32. Kinnison J, Padmala S, Choi JM, Pessoa L. Network analysis reveals increased integration during emotional and motivational processing. J Neurosci. 2012;32(24):8361–8372. doi:10.1523/JNEUROSCI.0821-12.2012
33. Reineberg AE, Banich MT. Functional connectivity at rest is sensitive to individual differences in executive function: a network analysis. Hum Brain Mapp. 2016;37(8):2959–2975. doi:10.1002/hbm.23219
34. Bullmore ET, Bassett DS. Brain graphs: graphical models of the human brain connectome. Annu Rev Clin Psychol. 2011;7:113–140. doi:10.1146/annurev-clinpsy-040510-143934
35. Sporns O. The human connectome: a complex network. Ann N Y Acad Sci. 2011;1224:109–125. doi:10.1111/j.1749-6632.2010.05888.x
36. Bassett DS, Meyer-Lindenberg A, Achard S, Duke T, Bullmore E. Adaptive reconfiguration of fractal small-world human brain functional networks. Proc Natl Acad Sci U S A. 2006;103(51):19518–19523. doi:10.1073/pnas.0606005103
37. Suo X, Lei D, Li K, et al. Disrupted brain network topology in pediatric posttraumatic stress disorder: a resting-state fMRI study. Hum Brain Mapp. 2015;36(9):3677–3686. doi:10.1002/hbm.22871
38. Watts DJ, Strogatz SH. Collective dynamics of ‘small-world’ networks. Nature. 1998;393(6684):440–442. doi:10.1038/30918
39. Sporns O, Zwi JD. The small world of the cerebral cortex. Neuroinformatics. 2004;2(2):145–162. doi:10.1385/NI:2:2:145
40. van Bussel FC, Backes WH, van Veenendaal TM, et al. Functional brain networks are altered in type 2 diabetes and prediabetes: signs for compensation of cognitive decrements? The Maastricht Study. Diabetes. 2016;65(8):2404–2413. doi:10.2337/db16-0128
41. Chen Y, Liu Z, Wang A, et al. Dysfunctional organization of default mode network before memory impairments in type 2 diabetes. Psychoneuroendocrinology. 2016;74:141–148.
42. Reijmer YD, Leemans A, Brundel M, Kappelle LJ, Biessels GJ, Utrecht Vascular Cognitive Impairment Study Group. Disruption of the cerebral white matter network is related to slowing of information processing speed in patients with type 2 diabetes. Diabetes. 2013;62(6):2112–2115. doi:10.2337/db12-1644
43. Zhang J, Liu Z, Li Z, et al. Disrupted white matter network and cognitive decline in type 2 diabetes patients. J Alzheimers Dis. 2016;53(1):185–195. doi:10.3233/JAD-160111
44. Dai H, Zhang Y, Lai L, et al. Brain functional networks: correlation analysis with clinical indexes in patients with diabetic retinopathy. Neuroradiology. 2017;59(11):1121–1131. doi:10.1007/s00234-017-1900-5
45. Yan CG, Wang XD, Zuo XN, Zang Y-F. DPABI: Data Processing & Analysis for (Resting-State) Brain Imaging. Neuroinformatics. 2016;14(3):339–351. doi:10.1007/s12021-016-9299-4
46. Van Dijk KR, Sabuncu MR, Buckner RL. The influence of head motion on intrinsic functional connectivity MRI. Neuroimage. 2012;59(1):431–438. doi:10.1016/j.neuroimage.2011.07.044
47. Power JD, Barnes KA, Snyder AZ, Schlaggar BL, Petersen SE. Spurious but systematic correlations in functional connectivity MRI networks arise from subject motion. Neuroimage. 2012;59(3):2142–2154. doi:10.1016/j.neuroimage.2011.10.018
48. Goto M, Abe O, Aoki S, et al. Diffeomorphic anatomical registration through exponentiated Lie Algebra provides reduced effect of scanner for cortex volumetry with atlas-based method in healthy subjects. Neuroradiology. 2013;55(7):869–875. doi:10.1007/s00234-013-1193-2
49. Yan CG, Cheung B, Kelly C, et al. A comprehensive assessment of regional variation in the impact of head micromovements on functional connectomics. Neuroimage. 2013;76:183–201. doi:10.1016/j.neuroimage.2013.03.004
50. Fox MD, Zhang D, Snyder AZ, Raichle ME. The global signal and observed anticorrelated resting state brain networks.J. Neurophysiol. 2009;101(6):3270–3283. doi:10.1152/jn.90777.2008
51. Wang J, Wang X, Xia M, et al. GRETNA: a graph theoretical network analysis toolbox for imaging connectomics. Front Hum Neurosci. 2015;9:386.
52. Tzourio-Mazoyer N, Landeau B, Papathanassiou D, et al. Automated anatomical labeling of activations in SPM using a macroscopic anatomical parcellation of the MNI MRI single-subject brain. Neuroimage. 2002;15(1):273–289. doi:10.1006/nimg.2001.0978
53. Zhang J, Wang J, Wu Q, et al. Disrupted brain connectivity networks in drug-naive, first-episode major depressive disorder. Biol Psychiatry. 2011;70(4):334–342. doi:10.1016/j.biopsych.2011.05.018
54. Lei D, Li K, Li L, et al. Disrupted functional brain connectome in patients with posttraumatic stress disorder. Radiology. 2015;276(3):818–827. doi:10.1148/radiol.15141700
55. Suo X, Lei D, Li N, et al. Functional brain connectome and its relation to hoehn and Yahr stage in Parkinson disease. Radiology. 2017;285(3):904–913. doi:10.1148/radiol.2017162929
56. Latora V, Marchiori M. Efficient behavior of small-world networks. Phys Rev Lett. 2001;87(19):198701. doi:10.1103/PhysRevLett.87.272301
57. Achard S, Bullmore E. Efficiency and cost of economical brain functional networks. PLoS Comput Biol. 2007;3(2):e17. doi:10.1371/journal.pcbi.0030160
58. Zalesky A, Fornito A, Bullmore ET. Network-based statistic: identifying differences in brain networks. Neuroimage. 2010;53(4):1197–1207. doi:10.1016/j.neuroimage.2010.06.041
59. Bassett DS, Bullmore ET. Small-world brain networks revisited. Neuroscientist. 2017;23(5):499–516. doi:10.1177/1073858416667720
60. Bullmore E, Sporns O. The economy of brain network organization. Nat Rev Neurosci. 2012;13(5):336–349. doi:10.1038/nrn3214
61. Liao X, Vasilakos AV, He Y. Small-world human brain networks: perspectives and challenges. Neurosci Biobehav Rev. 2017;77:286–300. doi:10.1016/j.neubiorev.2017.03.018
62. Rubinov M, Sporns O. Complex network measures of brain connectivity: uses and interpretations. Neuroimage. 2010;52(3):1059–1069. doi:10.1016/j.neuroimage.2009.10.003
63. Cui Y, Jiao Y, Chen HJ, et al. Aberrant functional connectivity of default-mode network in type 2 diabetes patients. Eur Radiol. 2015;25(11):3238–3246. doi:10.1007/s00330-015-3746-8
64. Liu D, Duan S, Zhou C, et al. Altered brain functional hubs and connectivity in type 2 diabetes mellitus patients: a resting-state fMRI study. Front Aging Neurosci. 2018;10:55. doi:10.3389/fnagi.2018.00055
65. Zhang Y, Zhang X, Zhang J, et al. Gray matter volume abnormalities in type 2 diabetes mellitus with and without mild cognitive impairment. Neurosci Lett. 2014;562:1–6. doi:10.1016/j.neulet.2014.01.006
66. Ferreira FS, Pereira JMS, Reis A, et al. Early visual cortical structural changes in diabetic patients without diabetic retinopathy. Graefes Arch Clin Exp Ophthalmol. 2017;255(11):2113–2118.
67. van Bloemendaal L, Ijzerman RG, Ten Kulve JS, et al. Alterations in white matter volume and integrity in obesity and type 2 diabetes. Metab Brain Dis. 2016;31(3):621–629. doi:10.1007/s11011-016-9792-3
68. Peng J, Qu H, Peng J, et al. Abnormal spontaneous brain activity in type 2 diabetes with and without microangiopathy revealed by regional homogeneity. Eur J Radiol. 2016;85(3):607–615. doi:10.1016/j.ejrad.2015.12.024
69. Cui Y, Jiao Y, Chen YC, et al. Altered spontaneous brain activity in type 2 diabetes: a resting-state functional MRI study. Diabetes. 2014;63(2):749–760. doi:10.2337/db13-0519
70. Cross DJ, Anzai Y, Petrie EC, et al. Loss of olfactory tract integrity affects cortical metabolism in the brain and olfactory regions in aging and mild cognitive impairment. J Nucl Med. 2013;54(8):1278–1284. doi:10.2967/jnumed.112.116558
71. Devanand DP, Lee S, Manly J, et al. Olfactory deficits predict cognitive decline and Alzheimer dementia in an urban community. Neurology. 2015;84(2):182–189. doi:10.1212/WNL.0000000000001132
72. Gouveri E, Katotomichelakis M, Gouveris H, Danielides V, Maltezos E, Papanas N. Olfactory dysfunction in type 2 diabetes mellitus: an additional manifestation of microvascular disease? Angiology. 2014;65(10):869–876. doi:10.1177/0003319714520956
73. Kuczewski N, Fourcaud-Trocmé N, Savigner A, et al. Insulin modulates network activity in olfactory bulb slices: impact on odour processing. J Physiol. 2014;592(13):2751–2769. doi:10.1113/jphysiol.2013.269639
74. Zhang Z, Zhang B, Wang X, et al. altered odor-induced brain activity as an early manifestation of cognitive decline in patients with type 2 diabetes. Diabetes. 2018;67(5):994–1006. doi:10.2337/db17-1274
75. Sanke H, Mita T, Yoshii H, et al. Relationship between olfactory dysfunction and cognitive impairment in elderly patients with type 2 diabetes mellitus. Diabetes Res Clin Pract. 2014;106(3):465–473. doi:10.1016/j.diabres.2014.09.039
76. Raichle ME. The brain’s default mode network. Annu Rev Neurosci. 2015;38:433–447. doi:10.1146/annurev-neuro-071013-014030
77. Gusnard DA, Raichle ME, Raichle ME. Searching for a baseline: functional imaging and the resting human brain. Nat Rev Neurosci. 2001;2(10):685–694. doi:10.1038/35094500
78. Sestieri C, Corbetta M, Romani GL, Shulman GL. Episodic memory retrieval, parietal cortex, and the default mode network: functional and topographic analyses. J Neurosci. 2011;31(12):4407–4420. doi:10.1523/JNEUROSCI.3335-10.2011
79. Spies M, Kraus C, Geissberger N, et al. Default mode network deactivation during emotion processing predicts early antidepressant response. Transl Psychiatry. 2017;7(1):e1008. doi:10.1038/tp.2017.160
80. Selvarajah D, Wilkinson ID, Maxwell M, et al. Magnetic resonance neuroimaging study of brain structural differences in diabetic peripheral neuropathy. Diabetes Care. 2014;37(6):1681–1688. doi:10.2337/dc13-2610
81. Candrilli SD, Davis KL, Kan HJ, Lucero MA, Rousculp MD. Prevalence and the associated burden of illness of symptoms of diabetic peripheral neuropathy and diabetic retinopathy. J Diabetes Complications. 2007;21(5):306–314. doi:10.1016/j.jdiacomp.2006.08.002
Supplementary material
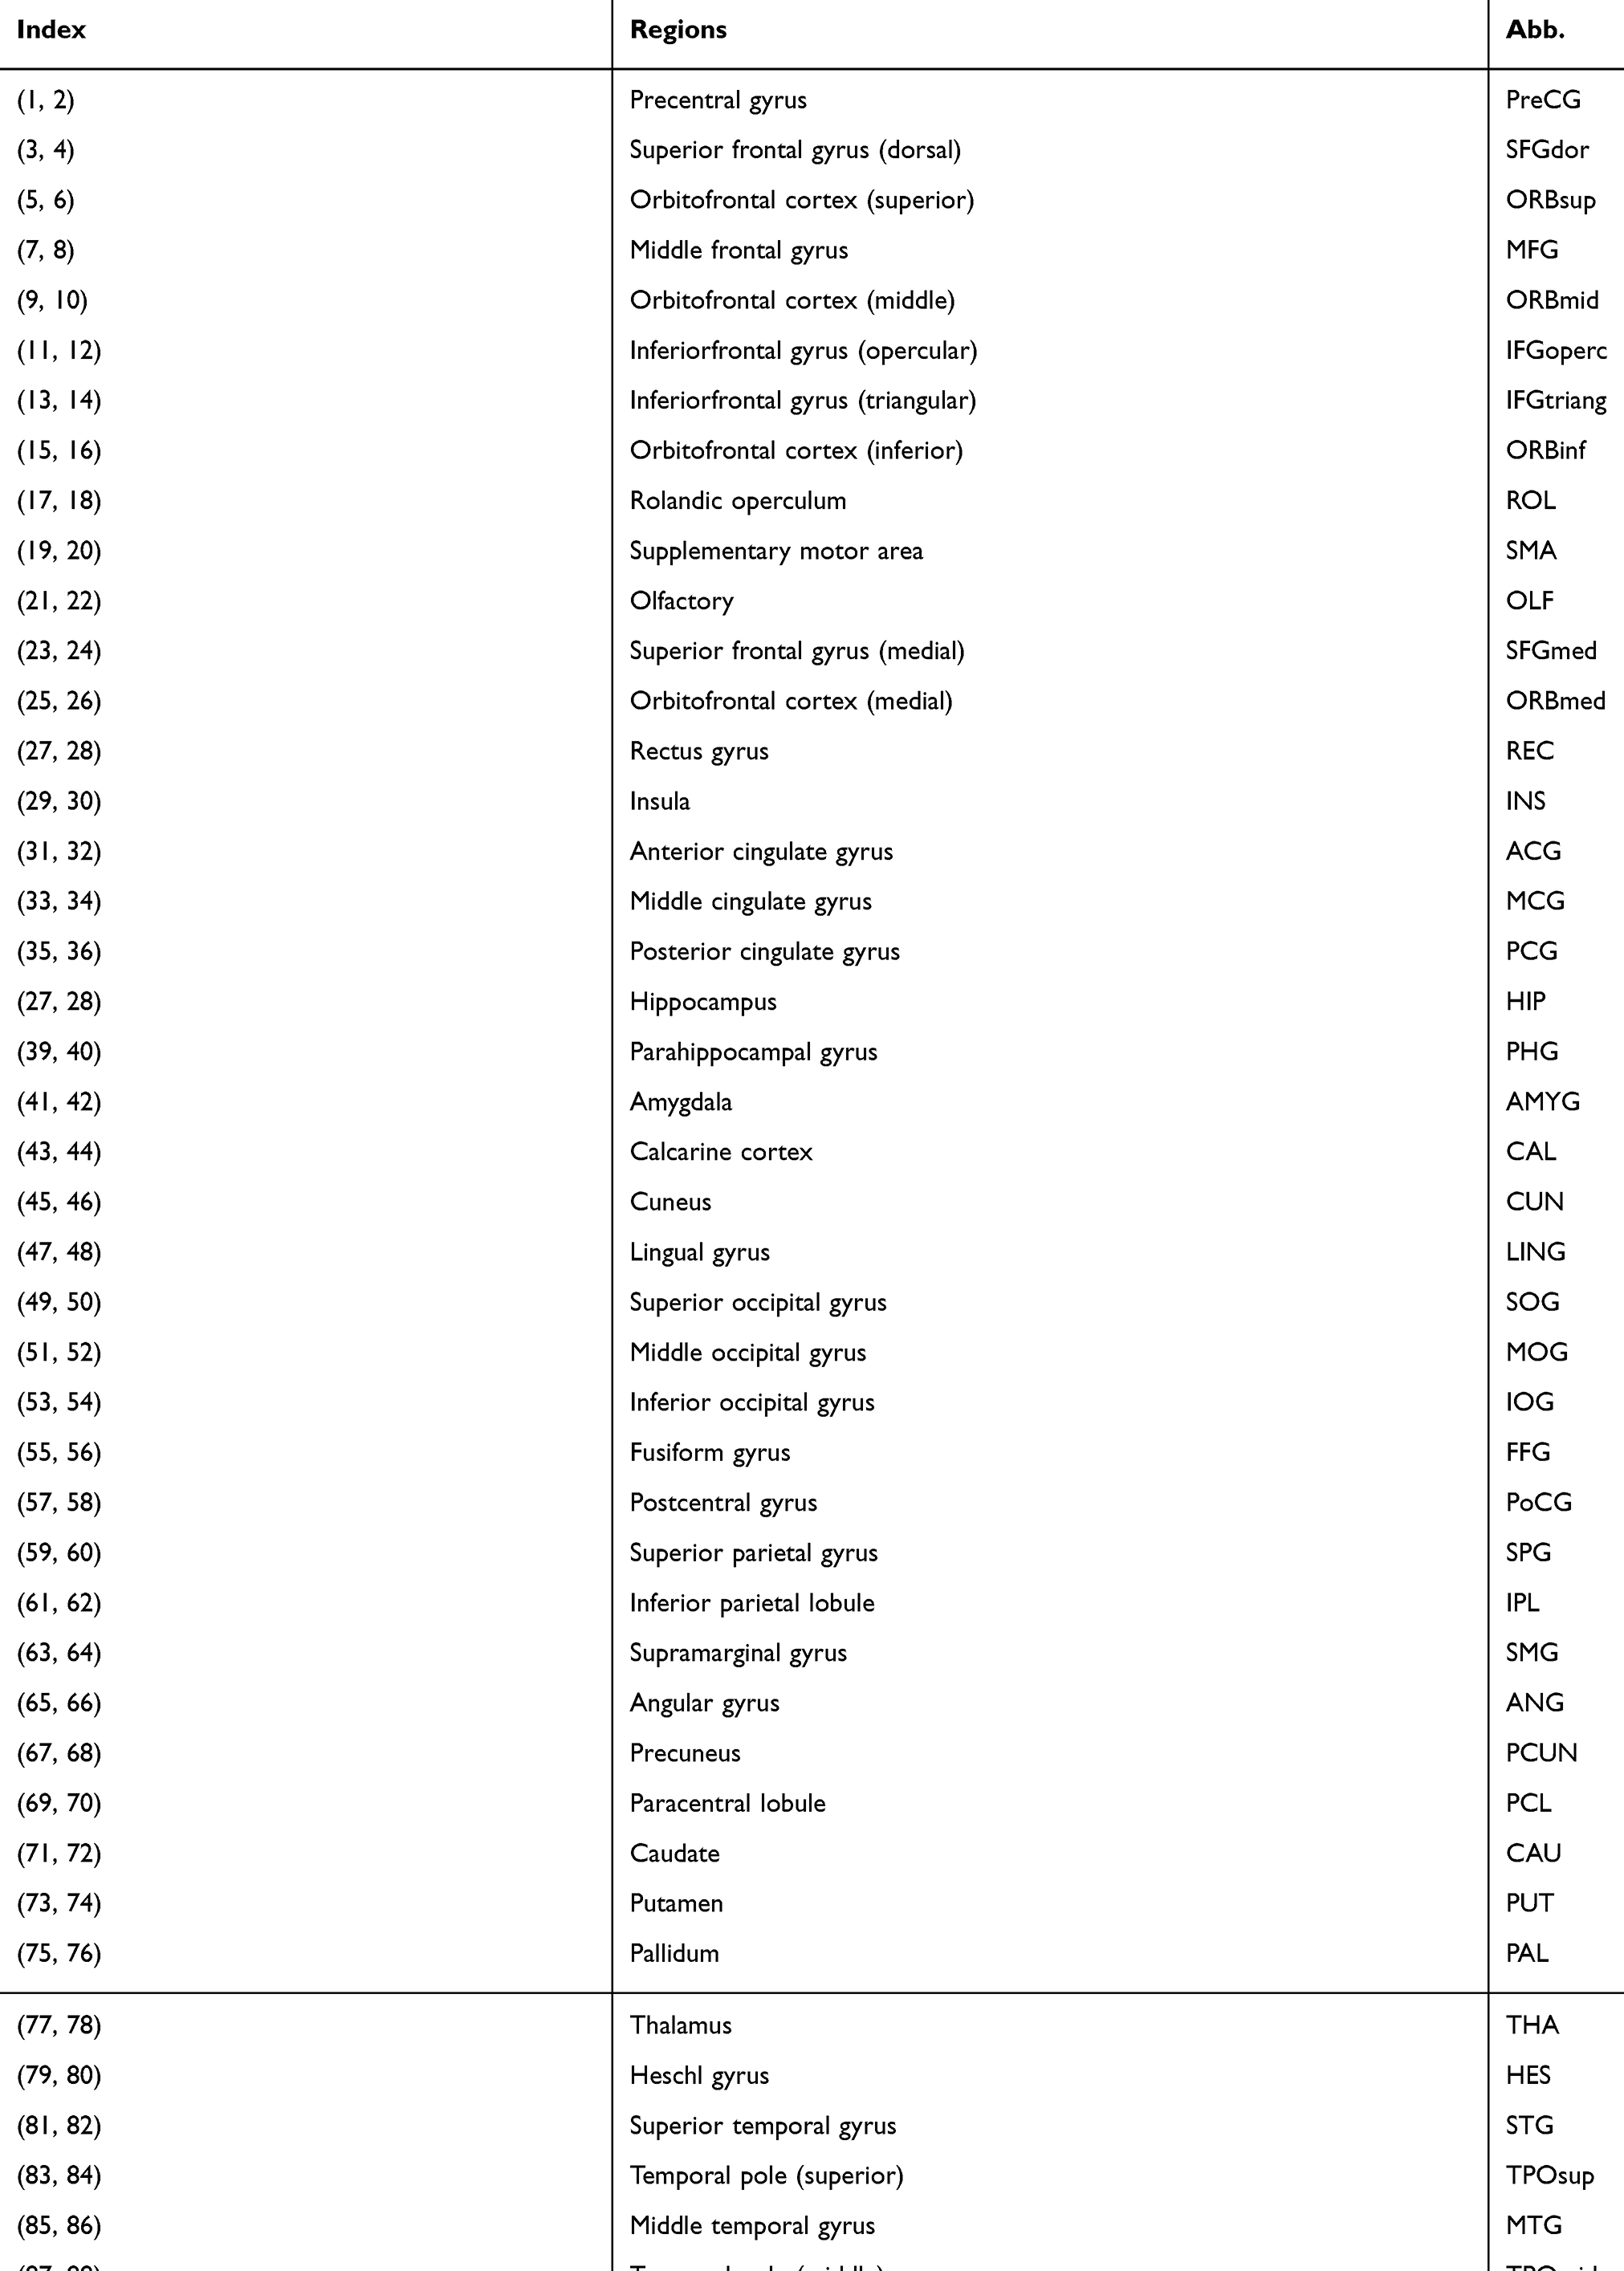 |
Table S1 Regions of interest and their abbreviations used in the construction of functional brain networks |
 © 2019 The Author(s). This work is published and licensed by Dove Medical Press Limited. The full terms of this license are available at https://www.dovepress.com/terms.php and incorporate the Creative Commons Attribution - Non Commercial (unported, v3.0) License.
By accessing the work you hereby accept the Terms. Non-commercial uses of the work are permitted without any further permission from Dove Medical Press Limited, provided the work is properly attributed. For permission for commercial use of this work, please see paragraphs 4.2 and 5 of our Terms.
© 2019 The Author(s). This work is published and licensed by Dove Medical Press Limited. The full terms of this license are available at https://www.dovepress.com/terms.php and incorporate the Creative Commons Attribution - Non Commercial (unported, v3.0) License.
By accessing the work you hereby accept the Terms. Non-commercial uses of the work are permitted without any further permission from Dove Medical Press Limited, provided the work is properly attributed. For permission for commercial use of this work, please see paragraphs 4.2 and 5 of our Terms.