Back to Journals » International Journal of Chronic Obstructive Pulmonary Disease » Volume 16
Discordant Quantitative and Visual CT Assessments in the Diagnosis of Emphysema
Authors Amaza IP ![]() , O'Shea AMJ, Fortis S, Comellas AP
, O'Shea AMJ, Fortis S, Comellas AP ![]()
Received 30 October 2020
Accepted for publication 1 March 2021
Published 3 May 2021 Volume 2021:16 Pages 1231—1242
DOI https://doi.org/10.2147/COPD.S284477
Checked for plagiarism Yes
Review by Single anonymous peer review
Peer reviewer comments 2
Editor who approved publication: Prof. Dr. Richard Russell
Iliya P Amaza,1 Amy MJ O’Shea,2,3 Spyridon Fortis,1,3 Alejandro P Comellas1
1University of Iowa, Roy J. and Lucille A. Carver College of Medicine, Department of Internal Medicine, Division of Pulmonary, Critical Care, and Occupational Medicine, Iowa City, IA, USA; 2University of Iowa, Roy J. and Lucille A. Carver College of Medicine, Department of Internal Medicine, Division of General Internal Medicine, Iowa City, IA, USA; 3Iowa City VA Health Care System, Center for Access & Delivery Research and Evaluation, Iowa City, IA, USA
Correspondence: Alejandro P Comellas
Roy J. and Lucille A. Carver College of Medicine, Department of Internal Medicine, Division of Pulmonary, Critical Care, and Occupational Medicine, 200 Hawkins Dr, W219B GH, Iowa City, Iowa City, 52242, USA
Tel +1 319 384 6484
Fax +1 319 353 6406
Email [email protected]
Purpose: Visual assessment of computed tomography (CT) of the lung is routinely employed in the diagnosis of emphysema. Quantitative CT (QCT) can complement visual CT but must be well validated. QCT emphysema is defined as ≥ 5% of lung volume occupied by low attenuation areas ≤− 950 Hounsfield units (LAA-950). Discordant visual and QCT assessments are not uncommon. We examined the association between visual and quantitative chest CT evaluation within a large cohort of subjects to identify variables that may explain discordant visual and QCT findings.
Materials and Methods: Volumetric inspiratory CT scans of 1221 subjects enrolled in phase 1 of the COPDGene study conducted at the University of Iowa were reviewed. Participants included never smokers, smokers with normal spirometry, preserved ratio impaired spirometry, and Global Initiative for Obstructive Lung Disease (GOLD) stages I–IV. CT scans were quantitatively scored and visually interpreted by both the COPDGene Imaging Center and the University of Iowa radiologists. Individual-level visual assessments were compared with QCT measurements. Agreement between the two sets of radiologists was calculated using kappa statistic. We assessed variables associated with discordant results using regression methods.
Results: There was a fair agreement for the presence or absence of emphysema between our center’s radiologists and QCT (61% concordance, kappa 0.22 [0.17– 0.28]). Similar comparisons showed a slight agreement between the COPDGene Imaging Center and QCT (56% concordance, kappa 0.16 [0.11– 0.21]), and a moderate agreement between both sets of visual assessments (80% concordance, kappa 0.60 [0.54– 0.65]). Current smoking and female gender were significantly associated with QCT-negative but visually detectable emphysema.
Conclusion: The slight-to-fair agreement between visual and quantitative CT assessment of emphysema highlights the need to utilize both modalities for a comprehensive radiologic evaluation. Discordant results may be attributable to one or more factors that warrant further exploration in larger studies.
Clinical Trial Registration: ClinicalTrials.gov Identifier NCT000608764.
Keywords: chest imaging, chronic obstructive pulmonary disease, interobserver agreement, Akaike information criterion
Introduction
The diagnosis of chronic obstructive pulmonary disease (COPD) is often determined by a combination of clinical and radiologic information. The radiologic features of emphysema and airway wall thickening have historically been determined by roentgenography and computed tomography (CT) scans. Visual assessments of chest CT scans are routinely employed in the radiologic diagnosis of emphysema. The advent of quantitative CT (QCT) has complemented visual CT but has been mostly utilized in research settings. In clinical practice, however, it is not uncommon to encounter CT scans that have been interpreted as normal visually but revealed emphysema on QCT, defined by the percentage of lung volume occupied by low attenuation areas (LAA) using a threshold of ≤−950 Hounsfield units (HU, LAA-950). This phenomenon has been described as the presence of discordant visual and QCT findings for the presence or absence of emphysema.1,2
The objective of this study was to examine the association between visual and QCT assessments within a large cohort of participants. We compared visual readings by radiologists from an academic center, expert thoracic radiologists from COPDGene and their subsequent emphysema quantification. In addition, we aimed to identify variables that may explain discordant visual and QCT findings. We also examined percent emphysema using quantitative CT in participants with normal visual CT findings, proportion of participants with >5% LAA-950 without visual CT emphysema, and degree of concordance between visual (University of Iowa radiologist reading) and quantitative CT scoring. Since QCT relies on lung density for detection of emphysema, we hypothesize that lung conditions that increase lung density such as inflammation and pulmonary edema will result in a discordant phenotype.
Materials and Methods
Data Collection
We conducted the study using data from the Genetic Epidemiology of COPD study (COPDGene). COPDGene is an ongoing multicenter observational study (http://www.copdgene.org/, ClinicalTrials.gov Identifier NCT000608764). Details of the study protocol have been published previously.3 We included all participants enrolled in phase 1 of COPDGene conducted at the University of Iowa. This study was conducted in accordance with the amended Declaration of Helsinki. The University of Iowa Institutional Review Board approved the study protocol (IRB# 200710717), and written informed consent was obtained from all participants.
Participants underwent volumetric CT scans using multi-detector CT scanners per protocol.3 Volumetric CT scans were obtained at full inspiration (total lung capacity, TLC) and at end-expiration (functional residual capacity, FRC) per protocol as previously described.3 Participant coaching was performed with several practice breathing maneuvers demonstrated prior to obtaining scans at both fixed volumes.4 Acquired images were reconstructed with the standard kernel.
QCT assessments were performed on segmented lung images, using VIDA software (VIDA, Coralville, Iowa, USA).3 Visual assessments were performed by the COPDGene Imaging Center according to the Fleischner Society classification system,1 which was collapsed into a binary emphysema outcome by combining all grades of centrilobular and panlobular emphysema into a single variable. The University of Iowa radiologists also performed independent visual assessments as part of a routine workflow for research imaging studies. These local visual assessments were abstracted from the electronic medical record to determine binary presence or absence of emphysema. We excluded participants who did not undergo CT scanning. We included all participants who had QCT analysis and visual assessments by both the COPDGene Imaging Center and a University of Iowa radiologist. Participants included never smokers, smokers with preserved ratio-impaired spirometry (PRISm),5,6 smokers with normal spirometry Global Initiative for Obstructive Lung Disease (GOLD) stage 0, and smokers with COPD GOLD stages I–IV.
Definitions and Outcomes
Quantitative emphysema was defined as ≥5% of the lung volume with LAA-950 on inspiratory CT.7 Visual assessment of emphysema by the COPDGene Imaging Center was based on the Fleischner Society classification system.1 To allow for comparison of both sets of visual assessments, we collapsed all grades of centrilobular emphysema and panlobular emphysema into a single category (parenchymal emphysema). Both mild paraseptal emphysema and substantial paraseptal emphysema were also grouped into a single “paraseptal emphysema” category. Given the variability in the degree and detail of interpretation, visual CT assessments by University of Iowa radiologists were abstracted in binary form as either present or absent for the presence of parenchymal emphysema (centrilobular and panlobular emphysema) and paraseptal emphysema. The “parenchymal emphysema” and “paraseptal emphysema” categories were not mutually exclusive as both types were identified in some participants. We also assumed the absence of any of these outcomes where a “normal scan” was reported, and we did not make any inferences (no response) regarding paraseptal emphysema when no comment was made. Gas trapping was quantified as the percentage of lung volume at FRC with attenuation values less than −856 HU.3 Chronic bronchitis was defined as productive cough for at least three consecutive months in the last two years.
Participants performed a spirometry that included two puffs of albuterol metered-dose inhaler using a spacer according to ATS-ERS guidelines.8 We used the National Health and Nutrition Examination Survey (NHANES) III spirometric reference values to calculate percentage of predicted values.9 Functional residual capacity or FRC was measured at end expiration. FRC and TLC percentage of predicted were calculated based on predicted values.10
Statistical Analysis
We first calculated the degrees of concordance between visually identified emphysema by the University of Iowa radiologists and QCT using the kappa statistic. Similar comparisons were also made between COPDGene radiologists and QCT, between both sets of radiologists for visual emphysema, and the subset of participants with paraseptal emphysema.
Participants were then categorized by QCT and visual CT assessments performed by University of Iowa radiologists into four groups: 1) concordant emphysema, 2) concordant no emphysema, 3) quantitative-only emphysema, and 4) visual-only emphysema. The latter two groups were also referred to as the discordant groups. We compared baseline characteristics between discordant groups using Student’s t-test or Wilcoxon rank-sum test for normal and non-normal continuous variables, respectively, and Fisher's exact or Chi-squared test for categorical variables.
Variables with significant differences between the discordant groups in the univariate analysis were considered for a multivariable stepwise logistic regression model using QCT emphysema >5% LAA-950 as the independent variable. The regression model included pack years in 10-year increments and forced expiratory volume in 1 second (FEV1) in 10% increments. We assessed variable multicollinearity using a variance inflation factor analysis.11
We also examined the sensitivity and specificity of various QCT thresholds (5% to 20% LAA-950) to diagnose visual emphysema with visual assessment by the University of Iowa radiologist serving as the “gold standard”.
To examine the association of various definitions of emphysema with symptoms and exercise capacity, we created multivariable linear regression models with a modified Medical Research Council (mMRC) dyspnea score, St. George’s Respiratory Questionnaire (SGRQ) score, and six-minute walk distance (6MWD) as the dependent variables (outcomes). To examine the association of various definitions of emphysema with exacerbations, we created zero-inflated negative binomial models which included age and current smoking status at enrollment, sex, race, pack-years smoked, and body mass index (BMI). Follow-up time was included as an offset in the models as previously described.12 We used a Cox proportional hazard regression analysis to examine the association of various definitions of emphysema with mortality. Age, sex, race, smoking status, smoking pack-years, and BMI were included as covariates. We used the Akaike information criterion (AIC) to compare the performance of the various models (various definitions of emphysema). Lower AIC by 7 indicates better model performance.13,14 We used R software for all statistical analyses.
Results
A total of 1245 participants were enrolled in phase 1 of the COPDGene study at the University of Iowa. Eight enrolled participants did not undergo CT scanning, 14 had no quantitative interpretation of their CT scans and 2 did not have visual interpretations by University of Iowa radiologists. After exclusions, 1221 participants were included. Supplementary Table 1 describes the entire cohort. Mean age of the entire cohort was 64.2 years, 49.4% were female, and 98.6% were Caucasian. Mean BMI was 29.8, and average smoking pack-years were 44.3 with 29.5% current smokers. Mean percent emphysema was 6.26 and mean percent gas trapping was 18.31. Mean FEV1% predicted was 83.1 and mean forced vital capacity (FVC) percent predicted was 90.71.
There was fair agreement for the presence or absence of emphysema between visual assessment by University of Iowa radiologists and QCT (61% concordance, kappa 0.22; Table 1). Similar comparisons showed a slight agreement between the COPDGene Imaging Center and QCT (56% concordance, kappa 0.16, Supplemental Table 2A). Comparisons of visual assessments by both sets of radiologists yielded an 80% concordance (kappa 0.60) for emphysema (Supplemental Table 2B) and 90% concordance (kappa 0.31) for participants also identified as having paraseptal emphysema (Supplemental Table 2C). Given the modest concordance between both sets of visual assessments, we then determined whether there was any similarity in the discordant groups arising from both sets of visual assessments. We found an overlap of 285 (of 320 for our assessments or 407 for COPDGene assessments) in visual-only emphysema (Figure 1A) and 107 (of 157 for our assessments or 133 for COPDGene assessments) in quantitative-only emphysema (Figure 1B).
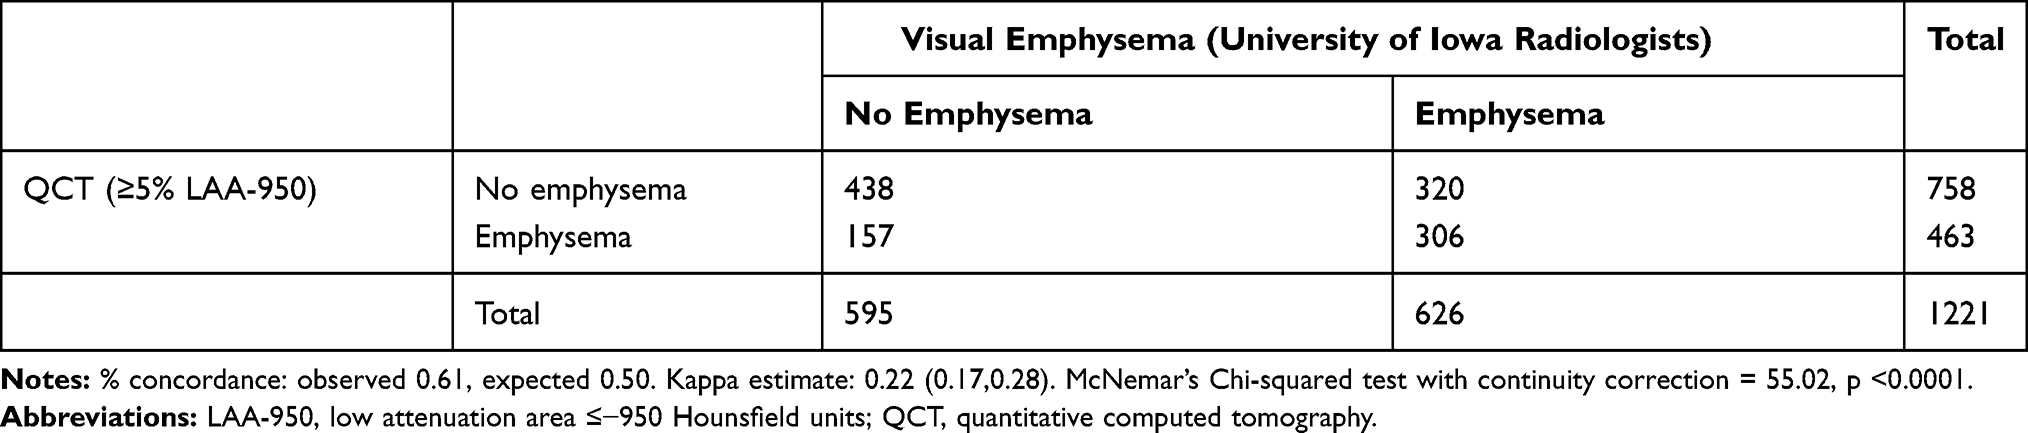 |
Table 1 Comparison of University of Iowa Radiologists’ Readings with QCT |
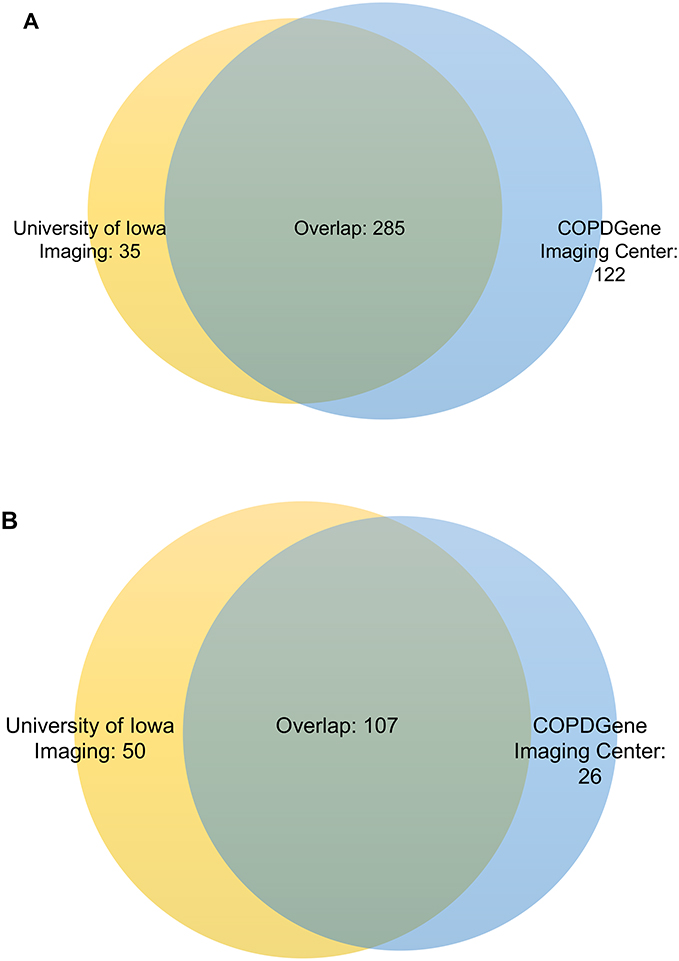 |
Figure 1 Overlap of discordant groups from comparisons of University of Iowa radiologists versus quantitative computed tomography (QCT) and COPDGene radiologists versus QCT. (A) Visual-only emphysema. (B) Quantitative-only emphysema. |
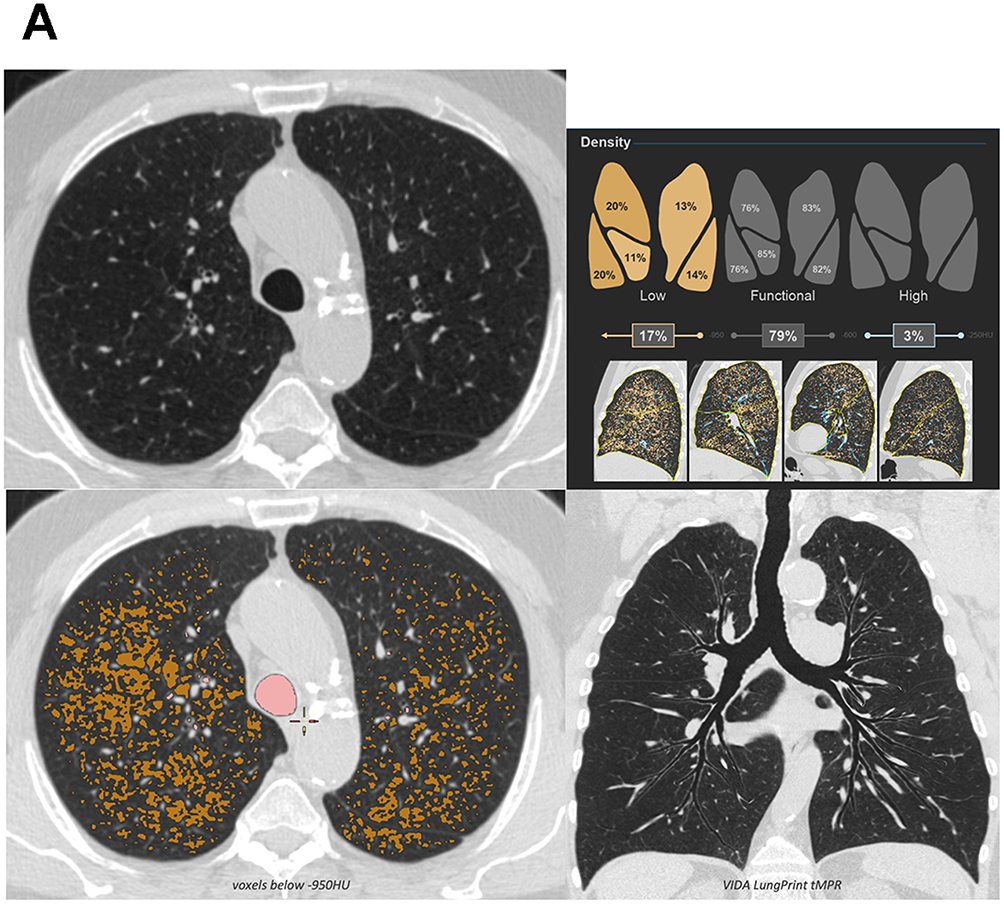 |
Figure 2 Continued. |
 |
Figure 2 Examples of discordant assessments. (A) The computed tomography was visually interpreted as negative for emphysema but emphysema was identified quantitatively; axial multiplanar reformat (MPR) (upper left), low attenuation area (LAA) percentages by lung lobe (upper right), axial MPR with LAA overlay (lower left), and topographic MPR (lower right) provided. Quantitative measures correlated with spirometry in this participant. (B) Visual-only identified emphysema. Small areas identified quantitatively but were not above the LAA ≤950 Hounsfield units 5% threshold; axial MPR (upper left), LAA percentages by lung lobe (upper right), axial MPR with LAA overlay (lower left), and topographic MPR (lower right) provided. Quantitative measures also correlated with spirometry. Images courtesy of VIDA, Coralville, Iowa, USA. |
Table 2 shows the cohort grouped by the agreement of QCT with visual assessments by University of Iowa radiologists. Mean percent emphysema was 15.64 in the concordant emphysema group and 2.01 in the concordant no emphysema group. Mean percent gas trapping was 36.34 in the concordant emphysema group and 9.14 in the concordant no emphysema group. No participant within the concordant emphysema group was a non-smoker while 7.3% of the concordant no emphysema group were non-smokers. GOLD severity was mostly spread across groups 0–3 in the concordant emphysema group while 65% of the concordant no emphysema group was GOLD 0. Furthermore, a higher FRC percent predicted and TLC percent predicted were seen in the concordant emphysema group while a higher FEV1 was seen in the concordant no emphysema group.
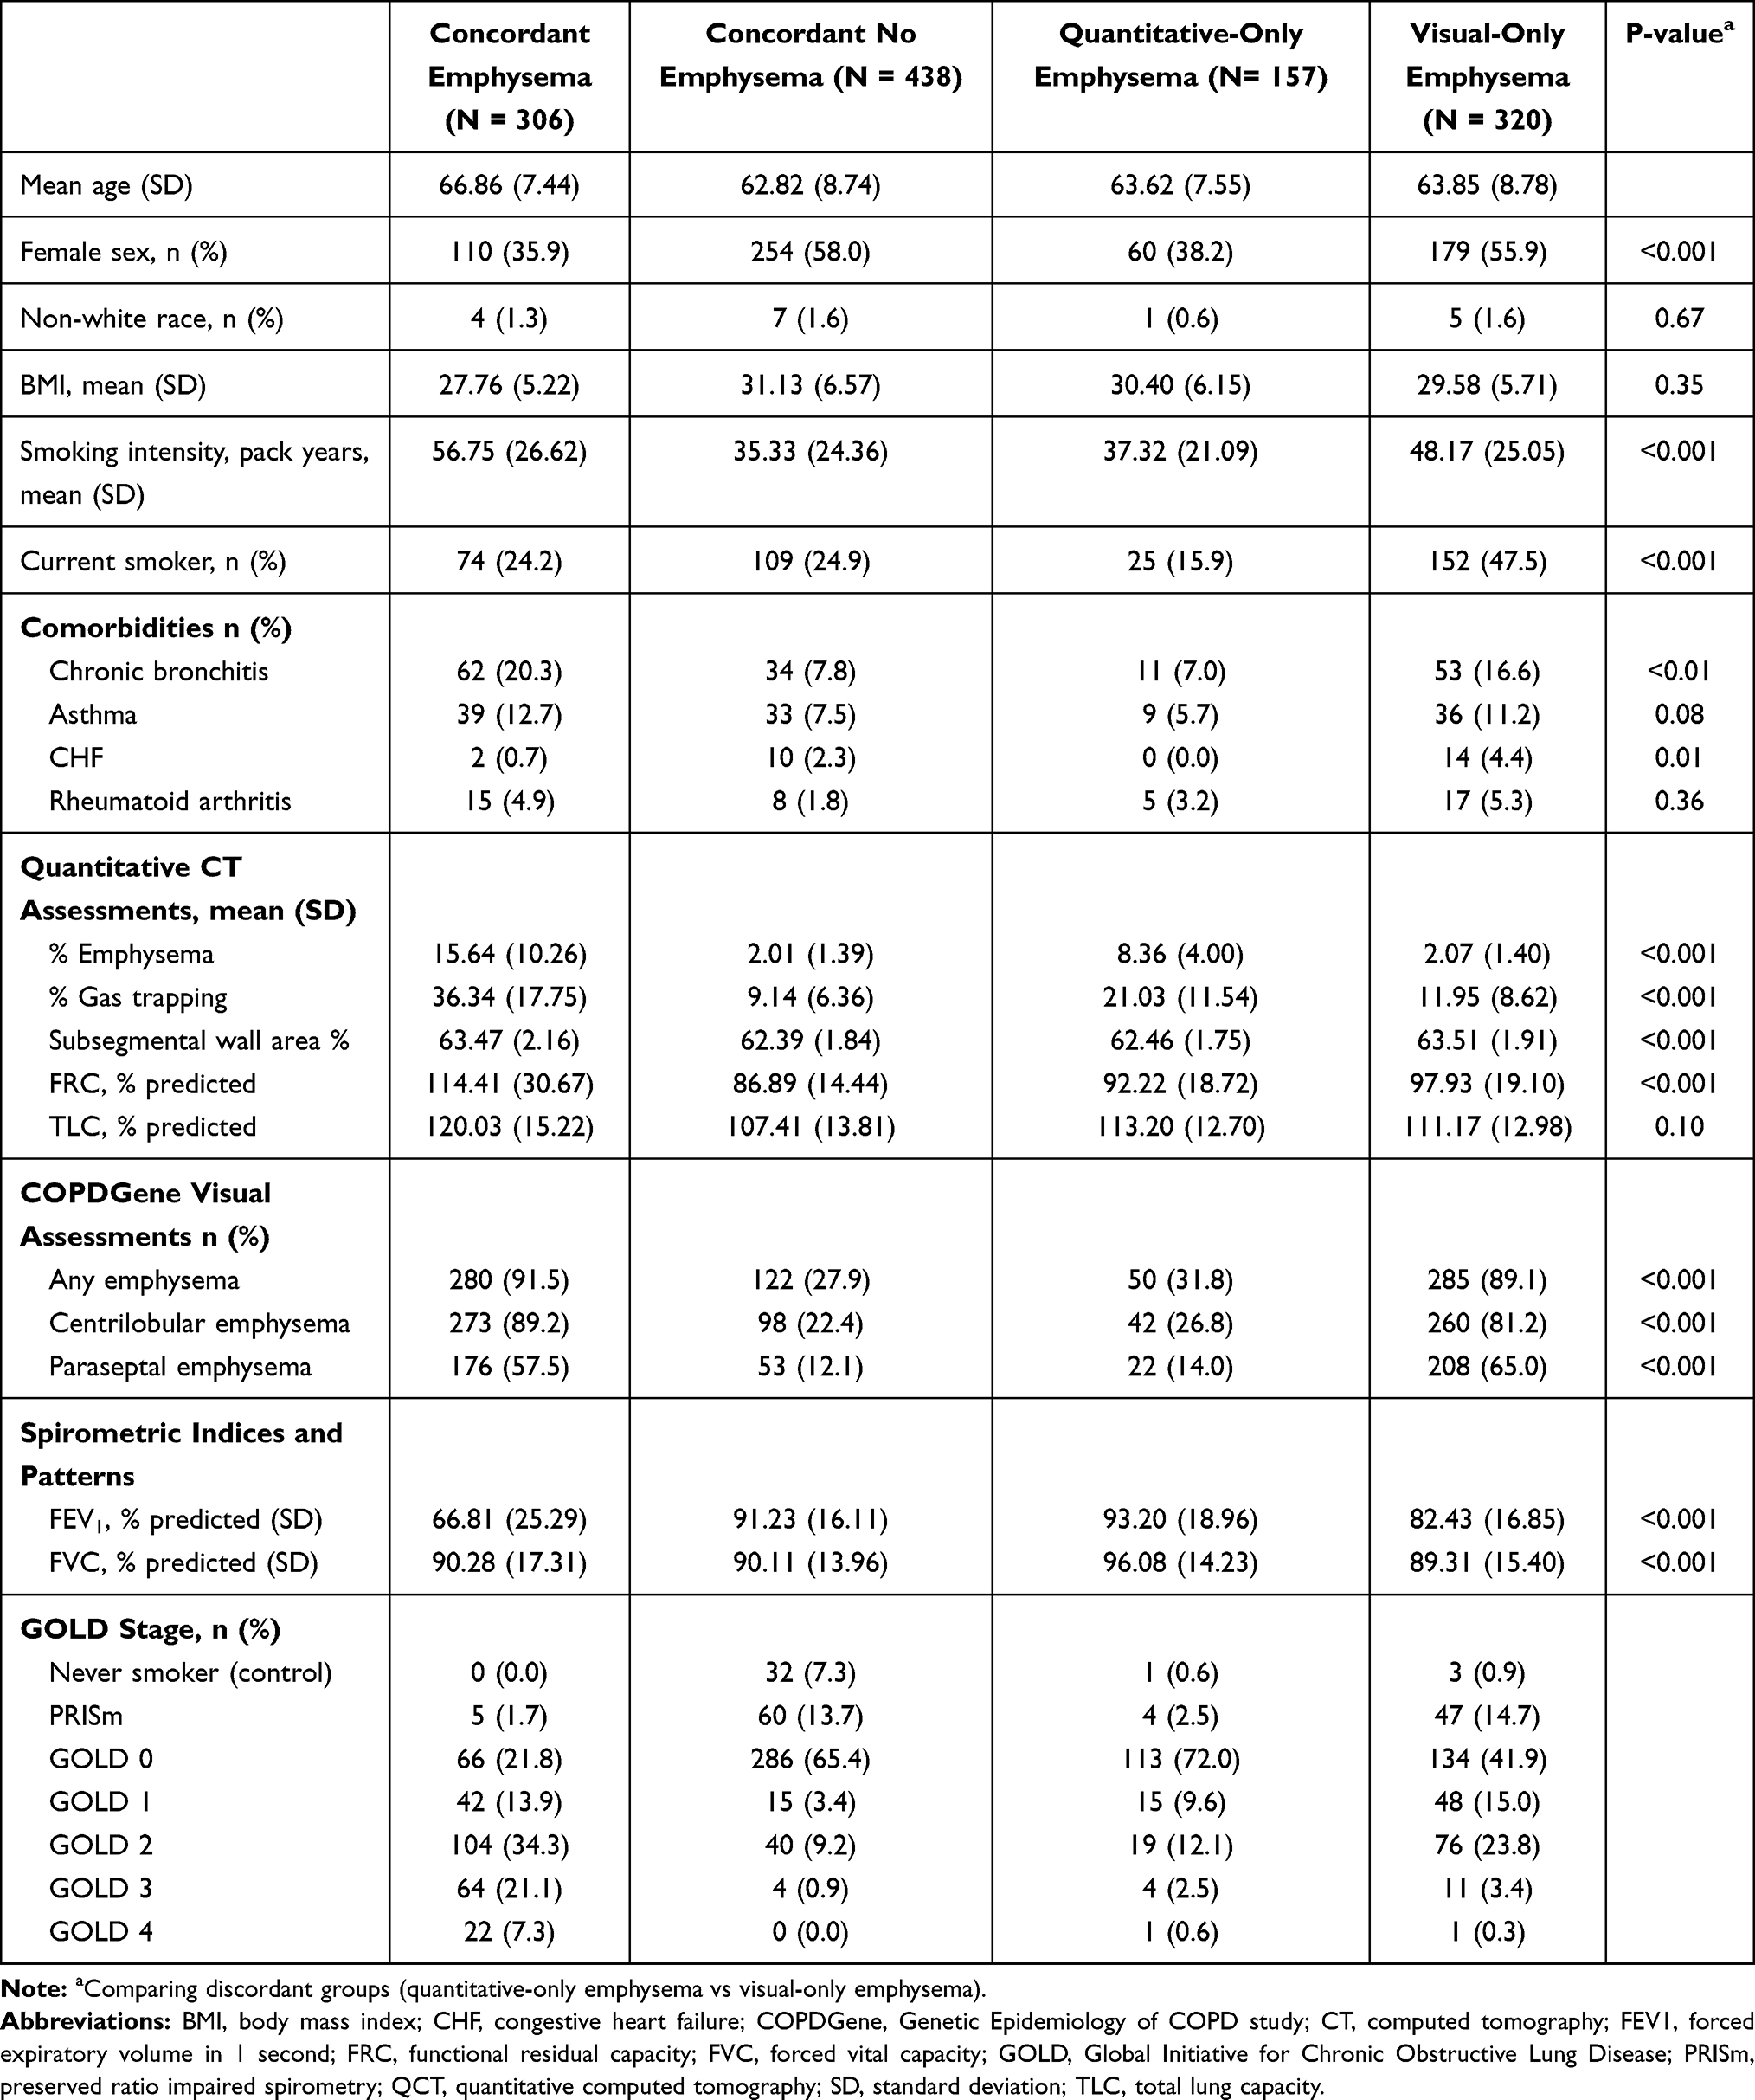 |
Table 2 Demographics and Baseline Assessments Grouped by the Agreement of Visual Assessments by University of Iowa Radiologists with QCT |
A total of 477 participants (39% of the cohort) belonged to discordant groups (157 in the quantitative-only group and 320 in the visual-only group). Representative CT images of a participant with quantitative-only emphysema and another with visual-only emphysema are shown in Figure 2. Table 1 shows univariate p-values when comparing Quantitative-only emphysema with visual-only emphysema. In the multivariable analysis, current smoking, tobacco use, and female gender were significantly associated with visual-only emphysema while every 10% predicted increase in FEV1 was significantly associated with quantitative-only emphysema (Figure 3).
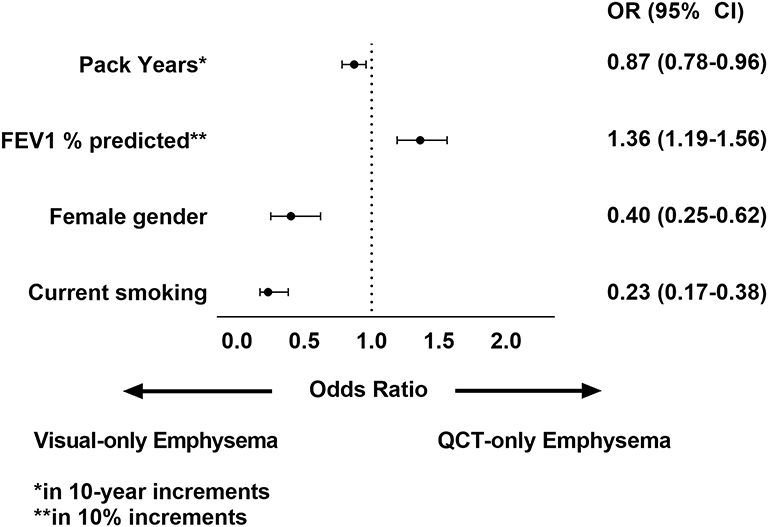 |
Figure 3 Factors associated with discordance (multivariable stepwise logistic regression) Adjusted analysis comparing quantitative-only emphysema and visual-only emphysema (University of Iowa). Variables tested but not retained in the final model: functional residual capacity percent predicted and chronic bronchitis. Abbreviations: FEV1, forced expiratory volume in1 second; OR, odds ratio; QCT, quantitative computed tomography. |
A diagnostic threshold of 5% LAA-950 yielded a sensitivity of 66.1%, 12.5% LAA-950 yielded a sensitivity of 92.7% with less steep increase in sensitivity at higher thresholds (Figure 4). The specificity of visual assessments for emphysema ranged from 52.25 to 57.8% for all tested diagnostic thresholds.
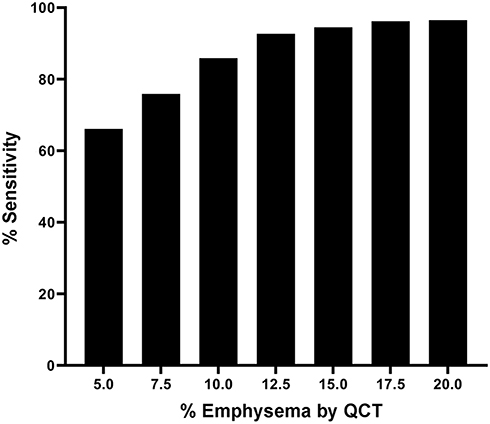 |
Figure 4 Sensitivity of visually-detected emphysema at various quantitative computed tomography diagnostic thresholds. Abbreviation: QCT, quantitative computed tomography. |
In the multivariable linear regression models, the detection of emphysema by the diagnostic modalities under comparison (exposure) was strongly associated with all tested dependent variables (outcomes) (Table 3). Among the mMRC dyspnea, SGRQ, 6MWD models, the models using Visual Emphysema (University of Iowa) performed better (lower AIC). In addition, the predictive values of the mortality models were similar regardless of whether the diagnosis of emphysema was based on quantification or visual assessment.
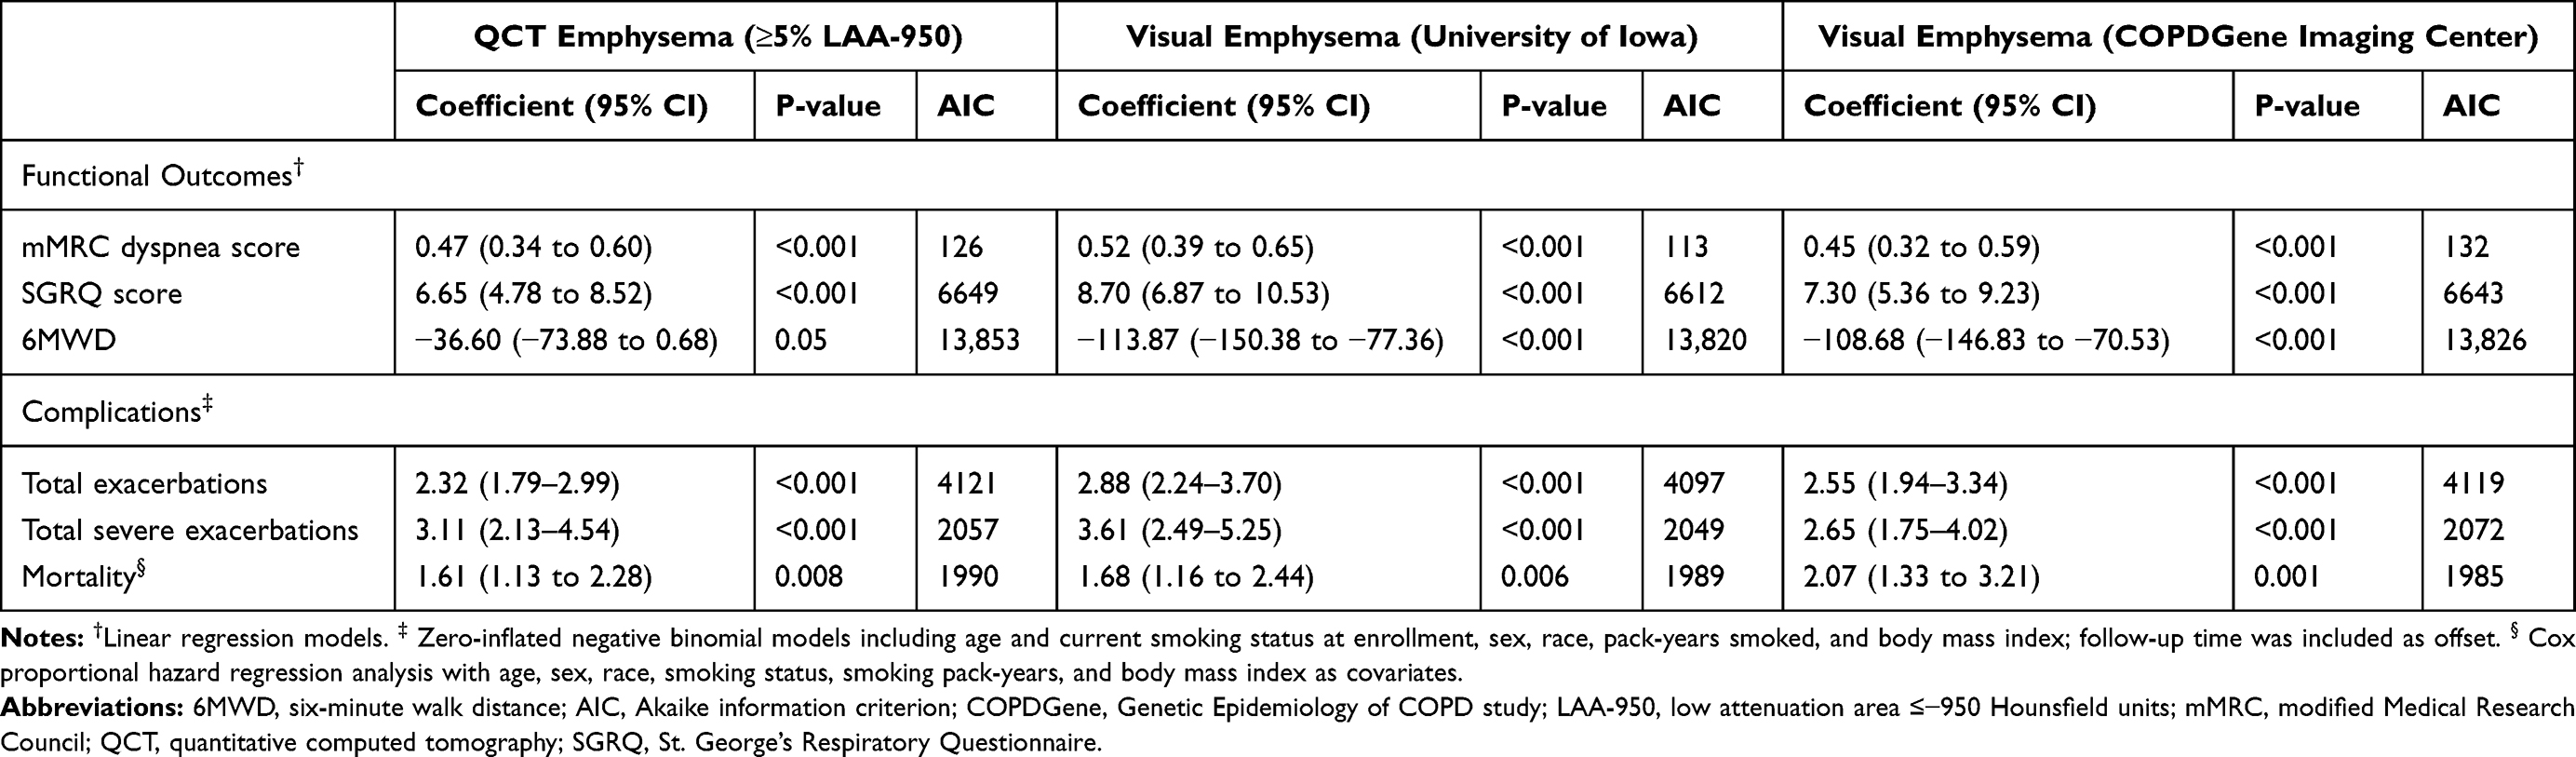 |
Table 3 Multivariable Regression Models with AIC |
Discussion
We sought to identify the degree of agreement between visual and quantitative CT analysis for the diagnosis of emphysema in a large cohort of participants. We found a slight-to-fair agreement between the visual assessments by the University of Iowa radiologists and QCT. A similar measurement of agreement was also observed between the COPDGene radiologists and QCT while the degree of concordance between the independent sets of visual assessments was much higher at 80%. Our observations are at variance with a prior effort in which a visual CT versus QCT concordance for emphysema of 75% was reported.2 However, there are some important methodological considerations in the study by Lynch et al as it involved 294 participants with 9–11 scorers per scan and a QCT diagnostic threshold defined as the 90th percentile value for % LAA-950 emphysema.2 Notably, Lynch et al also reported higher kappa values for agreement between visual readers.2 The similarity in these observations suggests a greater agreement between independent visual assessments than between QCT and visual scoring.
The mean %LAA-950 within the concordant emphysema group was 15.64% and much higher than the diagnostic threshold of 5%. Conversely, the mean %LAA-950 within the concordant no emphysema group was 2.01%. These findings are similar to the nationwide cohort of COPDGene participants (13.7% and 2.8%, respectively) as reported by Park et al.15 A discordant phenotype was more prevalent in our study when the %LAA-950 was between 2% and 15%, and participants with mild visual emphysema were more likely to have discordant assessments. This served as the basis for the exploratory analyses using different arbitrary thresholds with the finding that a 12.5% detection threshold was associated with a 92.7% sensitivity. This calls into question whether a diagnostic threshold for quantitatively detected emphysema should be revisited to improve specificity.
We observed a higher percentage of gas trapping in both groups with ≥5% LAA-950, with 36.34% and 21.03% in the concordant emphysema and quantitative-only emphysema groups, respectively. A similar degree of gas trapping would have been expected in participants with visually detected emphysema, given the loss of elasticity of the small airways arising from emphysematous destruction.1 This may be illustrative of the heterogeneity of COPD with multiple identified pathways.7
It is worth noting that 107 of 116 (92.2%) participants with PRISm did not have quantitative emphysema (51.7% with concordant no emphysema and 40.5% with visual-only emphysema). A study of PRISm participants (defined using fixed spirometric thresholds) within the nationwide COPDGene cohort revealed a higher proportion of females and current smokers.6 While our study did not examine this subset of participants, we did observe a similar demographic pattern within the concordant no emphysema and visual-only emphysema groups relative to the other two groups studied. Similarly, there was a higher proportion of PRISm participants within the visual-only emphysema group than in the quantitative-only emphysema group, as has been previously described.15
Within the concordant groups, we observed higher FRC and TLC in the concordant emphysema group, which is consistent with an obstructive physiology. As expected, a higher FEV1 was seen in the concordant no emphysema group, which is indicative of a less severe obstructive physiology.
The variables that persisted after modeling in the discordant groups were current smoking, female sex, and FEV1% predicted. Consistent with the findings by Park et al,15 participants with visual-only emphysema were more likely to be current smokers. A prevailing theory is that smoking-induced lung inflammation increases lung density, which can artificially decrease the LAA-950 on QCT, while visual emphysema can still be appreciable despite a lower %LAA-950.15 Similarly, a significant effect of smoking intensity, as measured in increments of 10 pack-years, was associated with visual-only emphysema.
In addition to smoking status and consistent with the findings by Park et al,15 participants with visual-only emphysema were more likely to be female. This gender-specific discordance can be attributed to anatomic differences with males having a more extensive airway tree (and thus an increased airway volume), which can reach the lung periphery and contribute to a decreased lung density on QCT.16 Furthermore, estradiol has been implicated in potentiating the oxidative stress and airway injury caused by cigarette smoking.17 This could result in more lung inflammation which will have a similar effect than smoking alone.
An alternative explanation for visual-only emphysema is the presence of alveolar fluid increasing lung density as seen in pulmonary edema. This possibility is evident given that, among the discordant groups, congestive heart failure was reported only in participants with visual-only emphysema. While a suboptimal inspiratory effort during CT image acquisition could also confound QCT detection of emphysema, the study protocol aimed at minimizing this factor by coaching participants in breathing maneuvers.
A higher FEV1% predicted was associated with discordance favoring quantitative-only emphysema. This could reveal early emphysema that is not readily appreciated visually, thus highlighting a potential clinical utility of QCT in the early diagnosis of emphysema and facilitating needed lifestyle changes. Conversely, this form of discordance could have been a false positive as air trapping from small airway disease can result in a low attenuation area on CT.18 This is evident in the higher percentage air trapping observed in the quantitative-only emphysema group. This highlights a potential utility of parametric response mapping (PRM), which can distinguish between emphysematous from nonemphysematous air trapping.18–20
The predictive value of visual emphysema for mMRC dyspnea score, SGRQ score, exercise capacity, and exacerbations was superior to that of quantitative emphysema. While the scope of this study primarily relates to the diagnosis of emphysema, it is also important that there is a link to important clinical outcomes, although this result should be interpreted with caution. Furthermore, visual emphysema assessment has the relative advantage of identifying paraseptal emphysema and distinguishing it from centrilobular emphysema, as presence of the former might have clinical implications. Historically thought to be of uncertain clinical significance,21,22 paraseptal emphysema has been associated with substantial disease progression,15 interstitial lung abnormalities,23 and adenocarcinoma of the lung24 although the possibility of a confounding effect of co-existing centrilobular emphysema needs to be considered.15
Our study has some important strengths: a good female representation with 49% females and our center’s uniqueness in having an additional set of routine visual assessments of chest CT scans. It does have important limitations: First, it is a single-center study with a lack of generalizability as our cohort is 98.6% non-Hispanic Caucasian. Secondly, CT technology continues to evolve, and the equipment used 10 years ago to obtain these images is not necessarily the same and applicable to newer CT imaging technologies. This analysis does not integrate inspiratory and expiratory images as employed in parametric response mapping (PRM),18–20,25 thus areas of low lung density presumed to be emphysema may be a result of air-trapping due to small airway disease. Finally, the absence of a “true” gold standard for diagnosing emphysema such as a lung biopsy precluded measurements of accuracy of the diagnostic methods assessed in this study.
Conclusion
Visual and quantitative CT analyses are complementary tools in the radiologic identification of emphysema. The slight-to-fair agreement between visual and quantitative CT assessment of emphysema highlights the need to utilize both modalities for a comprehensive radiologic evaluation. Discordant results may be attributable to one or more factors that warrant further exploration in larger studies. Awareness of the factors potentially affecting discordant results is necessary in making a clinical judgement about the presence or absence of emphysema.
Data Sharing Statement
The data that support the findings of this study are available from COPDGene and the University of Iowa. Restrictions apply to the availability of these data, which were used under license for this study. Data are available with the permission of COPDGene and the University of Iowa.
Acknowledgments
Kristina Greiner for editing and proof-reading the manuscript. VIDA, Coralville, Iowa, USA for providing sample quantitative CT images.
Author Contributions
All authors made substantial contributions to conception and design, acquisition of data, or analysis and interpretation of data; took part in drafting the article or revising it critically for important intellectual content; agreed to submit to the current journal; gave final approval of the version to be published; and agree to be accountable for all aspects of the work.
Funding
This work was supported by the US Department of Veterans Affairs, Veterans Health Administration, Office of Rural Health, Veterans Rural Health Resource Center (Award # 14380); and the US Department of Veterans Affairs Health Services Research and Development (HSR&D) Service through the Center for Access and Delivery Research and Evaluation (CADRE) (CIN 13-412). Role of sponsors: The sponsor had no role in the design of the study, the collection and analysis of the data, or the preparation of the manuscript. The views expressed in this article are those of the authors and do not necessarily reflect the position or policy of the Department of Veterans Affairs or the United States Government.
Disclosure
Dr Spyridon Fortis reports grants from the American Thoracic Society and Fisher Paykel, outside the submitted work; and is a Consultant for Genentech. Dr Alejandro P Comellas reports grants from the National Institutes of Health, non-financial support from VIDA, during the conduct of the study; personal fees from GlaxoSmithKline, outside the submitted work. The authors report no other conflicts of interest in this work.
References
1. Lynch DA, Austin JH, Hogg JC, et al. CT-definable subtypes of chronic obstructive pulmonary disease: a statement of the Fleischner society. Radiology. 2015;277(1):192–205. doi:10.1148/radiol.2015141579
2. Barr RG, Berkowitz EA, Bigazzi F, et al. A combined pulmonary-radiology workshop for visual evaluation of COPD: study design, chest CT findings and concordance with quantitative evaluation. COPD. 2012;9(2):151–159. doi:10.3109/15412555.2012.654923
3. Regan EA, Hokanson JE, Murphy JR, et al. Genetic epidemiology of COPD (COPDGene) study design. COPD. 2010;7(1):32–43. doi:10.3109/15412550903499522
4. COPDGene. Clinical center manual of procedures. Version 5.0; 2009. Available from: www.copdgene.org/sites/default/files/COPDGene%20MOP%2006.19.2009.pdf.
5. Wan ES, Hokanson JE, Murphy JR, et al. Clinical and radiographic predictors of GOLD-unclassified smokers in the COPDGene study. Am J Respir Crit Care Med. 2011;184(1):57–63. doi:10.1164/rccm.201101-0021OC
6. Wan ES, Castaldi PJ, Cho MH, et al. Epidemiology, genetics, and subtyping of preserved ratio impaired spirometry (PRISm) in COPDGene. Respir Res. 2014;15:89. doi:10.1186/s12931-014-0089-y
7. Lowe KE, Regan EA, Anzueto A, et al. COPDGene((R)) 2019: redefining the Diagnosis of Chronic Obstructive Pulmonary Disease. Chronic Obstr Pulm Dis. 2019;6(5):384–399.
8. Miller MR, Hankinson J, Brusasco V, et al. Standardisation of spirometry. Eur Respir J. 2005;26(2):319–338. doi:10.1183/09031936.05.00034805
9. Hankinson JL, Odencrantz JR, Fedan KB. Spirometric reference values from a sample of the general U.S. population. Am J Respir Crit Care Med. 1999;159(1):179–187. doi:10.1164/ajrccm.159.1.9712108
10. Stocks J, Quanjer PH. Reference values for residual volume, functional residual capacity and total lung capacity. ATS workshop on lung volume measurements. Official statement of the European respiratory society. Eur Respir J. 1995;8(3):492–506. doi:10.1183/09031936.95.08030492
11. Brecthel L, Gainey J, Penwell A, Nathaniel TI. Predictors of thrombolysis in the telestroke and non telestroke settings for hypertensive acute ischemic stroke patients. BMC Neurol. 2018;18(1):215. doi:10.1186/s12883-018-1204-3
12. Fortis S, Comellas A, Make BJ, et al. Combined forced expiratory volume in 1 second and forced vital capacity bronchodilator response, exacerbations, and mortality in chronic obstructive pulmonary disease. Ann Am Thorac Soc. 2019;16(7):826–835. doi:10.1513/AnnalsATS.201809-601OC
13. Fortis S, Eberlein M, Georgopoulos D, Comellas AP. Predictive value of prebronchodilator and postbronchodilator spirometry for COPD features and outcomes. BMJ Open Respir Res. 2017;4(1):e000213. doi:10.1136/bmjresp-2017-000213
14. Burns RJ, Deschenes SS, Schmitz N. Associations between depressive symptoms and social support in adults with diabetes: comparing directionality hypotheses with a longitudinal cohort. Ann Behav Med. 2016;50(3):348–357. doi:10.1007/s12160-015-9760-x
15. Park J, Hobbs BD, Crapo JD, et al. Subtyping COPD by using visual and quantitative CT imaging features. Chest. 2019;157(1):47–60.
16. Hoffman EA, Ahmed FS, Baumhauer H, et al. Variation in the percent of emphysema-like lung in a healthy, nonsmoking multiethnic sample. The MESA lung study. Ann Am Thorac Soc. 2014;11(6):898–907. doi:10.1513/AnnalsATS.201310-364OC
17. Tam A, Morrish D, Wadsworth S, Dorscheid D, Man SF, Sin DD. The role of female hormones on lung function in chronic lung diseases. BMC Womens Health. 2011;11:24. doi:10.1186/1472-6874-11-24
18. Pompe E, van Rikxoort EM, Schmidt M, et al. Parametric response mapping adds value to current computed tomography biomarkers in diagnosing chronic obstructive pulmonary disease. Am J Respir Crit Care Med. 2015;191(9):1084–1086. doi:10.1164/rccm.201411-2105LE
19. Pompe E, Galban CJ, Ross BD, et al. Parametric response mapping on chest computed tomography associates with clinical and functional parameters in chronic obstructive pulmonary disease. Respir Med. 2017;123:48–55. doi:10.1016/j.rmed.2016.11.021
20. Labaki WW, Gu T, Murray S, et al. Voxel-wise longitudinal parametric response mapping analysis of chest computed tomography in smokers. Acad Radiol. 2019;26(2):217–223. doi:10.1016/j.acra.2018.05.024
21. Edge J, Simon G, Reid L. Peri-acinar (paraseptal) emphysema: its clinical, radiological, and physiological features. Br J Dis Chest. 1966;60(1):10–18. doi:10.1016/S0007-0971(66)80016-5
22. Smith BM, Austin JH, Newell JD
23. Araki T, Nishino M, Zazueta OE, et al. Paraseptal emphysema: prevalence and distribution on CT and association with interstitial lung abnormalities. Eur J Radiol. 2015;84(7):1413–1418. doi:10.1016/j.ejrad.2015.03.010
24. Mouronte-Roibas C, Fernandez-Villar A, Ruano-Ravina A, et al. Influence of the type of emphysema in the relationship between COPD and lung cancer. Int J Chron Obstruct Pulmon Dis. 2018;13:3563–3570. doi:10.2147/COPD.S178109
25. Galban CJ, Han MK, Boes JL, et al. Computed tomography-based biomarker provides unique signature for diagnosis of COPD phenotypes and disease progression. Nat Med. 2012;18(11):1711–1715. doi:10.1038/nm.2971
 © 2021 The Author(s). This work is published and licensed by Dove Medical Press Limited. The
full terms of this license are available at https://www.dovepress.com/terms
and incorporate the Creative Commons Attribution
- Non Commercial (unported, 3.0) License.
By accessing the work you hereby accept the Terms. Non-commercial uses of the work are permitted
without any further permission from Dove Medical Press Limited, provided the work is properly
attributed. For permission for commercial use of this work, please see paragraphs 4.2 and 5 of our Terms.
© 2021 The Author(s). This work is published and licensed by Dove Medical Press Limited. The
full terms of this license are available at https://www.dovepress.com/terms
and incorporate the Creative Commons Attribution
- Non Commercial (unported, 3.0) License.
By accessing the work you hereby accept the Terms. Non-commercial uses of the work are permitted
without any further permission from Dove Medical Press Limited, provided the work is properly
attributed. For permission for commercial use of this work, please see paragraphs 4.2 and 5 of our Terms.