")
Back to Journals » Neuropsychiatric Disease and Treatment » Volume 11
Disconnection of the hippocampus and amygdala associated with lesion load in relapsing–remitting multiple sclerosis: a structural and functional connectivity study
Authors Zhou F , Zhuang Y, Wang L, Zhang Y, Wu L, Zeng X , Gong H
Received 14 March 2015
Accepted for publication 18 May 2015
Published 17 July 2015 Volume 2015:11 Pages 1749—1765
DOI https://doi.org/10.2147/NDT.S84602
Checked for plagiarism Yes
Review by Single anonymous peer review
Peer reviewer comments 3
Editor who approved publication: Professor Wai Kwong Tang
Fuqing Zhou,1,2,* Ying Zhuang,3,* Lingling Wang,4 Yue Zhang,5 Lin Wu,1,2 Xianjun Zeng,1,2 Honghan Gong1,2
1Department of Radiology, The First Affiliated Hospital, Nanchang University, 2Jiangxi Province Medical Imaging Research Institute, 3Department of Oncology, The Second Hospital of Nanchang, Nanchang, Jiangxi Province, 4Department of Geriatrics, The Fifth Affiliated Hospital of Sun Yat-sen University, Zhuhai, Guangdong Province, 5Department of Radiology, The Affiliated Hospital of Jiangxi University of Traditional Chinese Medicine, Nanchang, Jiangxi Province, People’s Republic of China
*These authors contributed equally to this work
Background and purpose: Little is known about the functional and structural connectivity (FC and SC) of the hippocampus and amygdala, which are two important structures involved in cognitive processes, or their involvement in relapsing–remitting multiple sclerosis (RRMS). In this study, we aimed to examine the connectivity of white-matter (WM) tracts and the synchrony of intrinsic neuronal activity in outer regions connected with the hippocampus or amygdala in RRMS patients.
Patients and methods: Twenty-three RRMS patients and 23 healthy subjects participated in this study. Diffusion tensor probabilistic tractography was used to examine the SC, the FC correlation coefficient (FC-CC) and combined FC strength (FCS), which was derived from the resting-state functional magnetic resonance imaging used to examine the FC, of the connection between the hippocampus or the amygdala and other regions, and the correlations of these connections with clinical markers.
Results: Compared with healthy subjects, the RRMS patients showed significantly decreased SC and increased FCS of the bilateral hippocampus, and left amygdala. Their slightly increased FC-CC was positively correlated with WM tract damage in the right hippocampus (ρ=0.57, P=0.005); an increased FCS was also positively correlated with WM tract damage in the right amygdala. A relationship was observed between the WM lesion load and SC alterations, including the lg(N tracts) of the right hippocampus (ρ=-0.68, P<0.05), lg(N tracts) (ρ=-0.69, P<0.05), and fractional anisotropy (ρ=-0.68, P<0.05) and radial diffusivity of the left hippocampus (ρ=0.45, P<0.05). A relationship between WM lesion load and FCS of the left amygdale was also observed.
Conclusion: The concurrent increased functional connections and demyelination-related structural disconnectivity between the hippocampus or amygdala and other regions in RRMS suggest that the functional–structural relationships require further investigation.
Keywords: relapsing–remitting multiple sclerosis, hippocampus, limbic system, functional connectivity, structural connectivity, fiber tractography
Introduction
Memory1 decline and emotion recognition deficits2 commonly occur in patients with multiple sclerosis (MS), as the clinical manifestations of the disease contribute to cognitive dysfunction.1–5 The hippocampus and amygdale, which serve as the main structures of the limbic system, are separately involved in memory- and emotion-related cognitive processing. Evidence for hippocampal6 or amygdala demyelination7 in MS has been reported in recent histopathological studies.6–8 Advanced magnetic resonance imaging (MRI) studies have also shown regional alterations, including structural damage,9,10 atrophy,11 and functional decreases,1,9,12 in the hippocampus or amygdala of MS patients. However, the relationship between the structural damage to the hippocampus or amygdala and functional alterations in MS and the correlations between such disturbances and clinical indices is not well established. Knowledge of the connections of the hippocampus and amygdala with the other brain structures will improve our understanding of the pattern of cognitive-related information processing, the functional and cognitive outcomes of MS, and development of novel therapeutic strategies that may be highly beneficial for these patients.
Although much is known about functional and structural connectivity (FC and SC), classic resting-state functional connectivity (rsFC) and diffusion tensor tractography13,14 can provide crucial information about the connections that may complement this knowledge. Diffusion tensor tractography can describe anatomical white-matter (WM) tracts to characterize the diffusivity of water,15,16 which has been reported as a component of SC to provide critical information to fully understand MS-related functional alterations.14 In classic rsFC analysis, quantitative FC correlation coefficient (FC-CC) studies have begun to provide important information concerning the communication between regions under normal and pathological conditions.9,14 However, quantitative FC-CC analyses ignore the cortical reorganization that occurs due to the increased connectivity of specific structures. Functional connectivity strength (FCS), a novel index is a strength property that is determined by counting the number of direct functional connections at the voxel level to provide crucial information on the connectivity architecture.17 FCS could provide additional information on the connectivity quantity, which is used to evaluate the FC.
Presently, whether the SC and FC of the hippocampus and amygdala are related to minimally disable relapsing–remitting MS (RRMS) remains unclear. Investigating the structural–functional relationship may be particularly important for understanding the impact of this disease on the hippocampus and amygdala. In this study, we hypothesized that both SC and FC of the hippocampus or amygdala and their correlated clinical indices are disrupted in RRMS. To test this hypothesis, we used probabilistic tractography to characterize WM tract connectivity, and FC-CC combined with FCS to characterize the intrinsic functional communication of the hippocampus or amygdala and to examine the mechanisms that might underlie the observed alterations. Studying the structural–functional relationship of the hippocampus and amygdala may enrich our understanding of the neural underpinnings of RRMS.
Materials and methods
Subjects
The present study was approved by the Medical Research Ethics Committee and the Institutional Review Board of the First Affiliated Hospital of Nanchang University. This study was performed according to the approved guidelines and was conducted in compliance with the principles of the Declaration of Helsinki. All subjects signed written consent forms for participation in the study.
Patients with clinically definite MS at the First Affiliated Hospital of Nanchang University participated in this study from May 2010 to December 2013. All patients received a series of clinical and MRI examinations, including the Expanded Disability Status Scale (EDSS). After diagnosis, the recruited patients were confirmed as follows: RRMS course;18 EDSS score <2.5, which corresponds to minimal disability;19 and treatment with immunomodulatory medication (20 with b-interferons, 3 with Glatiramer acetate). None of the recruited patients experienced any relapses or received corticosteroid treatment during the month preceding MRI acquisition. Twenty-three healthy control (HC) participants from the local community were individually matched to the patients by sex, age, education level, and lack of history of neurological or psychiatric disorders. After excluding patients due to excessive head motion during scanning (see “rs-fMRI data preprocessing”), 23 RRMS and 23 HC subjects remained in this study.
Image acquisition
All MRI data were obtained from a Trio 3.0-tesla MRI scanner (Siemens Medical Systems, Erlangen, Germany). During acquisition, all subjects were instructed to remain as still as possible in the scanner, to keep their eyes closed, to not think systematically and to stay awake. Resting-state functional MRI (rs-fMRI), diffusion tensor imaging (DTI), T2-weighted imaging (T2WI), and T1WI scans were performed using the following sequences:
- An echo planar imaging sequence for rs-fMRI scan with the following parameters: repetition time (TR)/echo time (TE) =2,000/30 ms, flip angle =90°, field of view (FOV) =200×200 mm, matrix =64×64, 30 interleaved axial slices with 4 mm thickness and an interslice gap of 1.2 mm, and number of time points =240;
- Spin echo single-shot echo planar imaging for DTI: TR/TE =7,200/104 ms, FOV =230×230 mm, matrix =128×128, number of excitations (NEX) =2, 49 axial slices with 2.5 mm thickness, 64 non-linear diffusion weighting gradient directions with b=1,000 s/mm2 and 1 additional image without diffusion weighting (ie, b=0 s/mm2);
- Three-dimensional high-resolution T1WI brain scans with 1 mm3 isotropic voxels: TR/TE =1,900/2.26 ms, FOV =215×230 mm, matrix =240×256, NEX =1, slice thickness =1.0 mm, and 176 sagittal slices;
- Turbo spin echo imaging sequence for conventional T2WI scans: TR/TE =5,100/117 ms, FOV =240×240 mm, matrix =416×416, NEX =3, echo train length =11, 22 axial slices with 6.5 mm thickness.
During MRI scanning, head motion was minimized by placing foam padding around the patients’ head, and noise was attenuated with earplugs.
Data processing
rs-fMRI data preprocessing
The rs-fMRI data were preprocessed using the Data Processing Assistant for Resting-State fMRI Advanced Edition (DPARSFA) V2.320 in MATLAB 2012a (The Math Works, Inc, Natick, MA, USA) platform. The first ten images from each subject were discarded during data acquisition to eliminate magnetic saturation effects, and the remaining 230 images were corrected for slice timing and realigned for intervolume head motion. Subjects were included if their head movement was less than 2 mm of translation along any axis and less than 2.0° of angular rotation along any axis during rs-fMRI scanning. The high-resolution individual T1WI images were coregistered to the mean functional image after motion correction using a linear transformation, and the images were segmented into gray matter (GM), WM, and cerebrospinal fluid (CSF) tissue maps using a priori statistical parametric mapping (SPM) tissue maps as a reference and a unified segmentation algorithm.21 The resultant GM, WM, and CSF images were further non-linearly registered in Montreal Neurological Institute space using estimates from the unified segmentation, and the images were averaged across all of the patients to create custom GM, WM, and CSF templates and for the measurement of whole-brain atrophy, amygdala atrophy, and hippocampal atrophy. Next, the coregistered T1 images were resegmented using the custom tissue templates as reference images and the unified segmentation algorithm21 to reduce the risk of inaccuracy in spatial normalization of the functional volumes due to GM atrophy. All of the functional images were then resampled to 3 mm cubic voxels and 6 mm spatial smoothing with a full-width–half-maximum Gaussian kernel, linear detrending, and temporal band-pass filtering (0.01 Hz < f <0.08 Hz) to eliminate high-frequency noise and low-frequency drift. Finally, multiple regression analysis of nuisance variables was conducted from the rs-fMRI data, which included a ventricular signal averaged from ventricular regions of interest (ROIs), a WM signal averaged from WM ROIs, a whole-brain signal averaged across the whole brain, six head realignment parameters obtained by rigid body head motion correction, and the derivatives of each of these signals.22
Seed-based rsFC for FC-CC analysis
The ROIs of the amygdala and hippocampus were defined according to the automated anatomical labeling template23 contained in the Resting-State fMRI Data Analysis Toolkit,20 which was resampled to 3×3×3 mm3. Subsequent processes were performed separately in left and right ROIs.
The seed-based rsFC was calculated in DPARSFA. For each amygdala or hippocampal ROI, a seed reference time course was obtained by averaging the time series of all voxels in the ROI. Then, voxel-wise Pearson’s correlation analysis was performed between the seed reference time course and time series from the remainder brain areas with the global signal, WM signal, CSF signal and the six head motion parameters as nuisance covariates. Finally, the resultant correlation coefficients were transformed into z scores using Fisher’s transformation to better satisfy normality.
Voxel-based FCS for connectivity quantity analysis
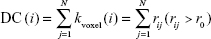
FCS calculations were also conducted in DPARSFA with voxel-based weighted degree centrality (DC) by mapping the degree of FC across the whole brain:
|
|
|
|
where rij is the correlation coefficient between voxel i and voxel j (voxel i is form the amygdala or hippocampus and voxel j belong to regions outside the amygdala or hippocampus), r0 is the correlation threshold value that is set to eliminate weak correlations – the classical reference r0 values are primarily reported in the results that were thresholded using an r0=0.25,17,24,25 and the significance threshold of the corresponding connection was set at P<0.001 in this study – and the k(i) of each voxel was divided by the individual global mean of k0 within the whole brain to normalize and reduce the effect of individual variability. The individual data were then converted using Fisher’s z transformation, and the z values of the amygdala or hippocampus were extracted for group comparisons. Notably, the FCS, as a voxel-wise connectivity strength metric, is referred to as the “DC” of weighted networks in terms of graph theory and indicates its connectivity quantity or the extent of connectivity.11
DTI data analysis
To investigate the SC of the amygdala or hippocampus, the group (Montreal Neurological Institute)-space ROIs of the amygdala and hippocampus were individually coregistered to (native) DTI space using Linear Image Registration Tool (FLIRT) methods of Functional MRI of the Brain (FMRIB).26 These ROIs are briefly described as follows:
- Using the FMRIB diffusion toolbox (FDT v2.0),27 “dtifit” was used to fit a single tensor model at each voxel of the preprocessed eddy current-corrected diffusion-weighted data.
- A spatial probability density unction across voxel was estimated using the FMRIB Software Library probabilistic tractography (bedpostx) tool, which was used to model 5,000 iterations within each voxel with a curvature threshold of 0.2, a step length of 0.5, and a maximum number of 2,000 steps.28 For each tract, single-mask, the amygdala or the hippocampus was used to calculate the fiber orientation distribution.
- The connectivity of WM tracts was set at a normalized probability value of 0.2029,30 and was visually inspected to confirm successful tracing in each individual by multiple experienced technicians.
- Features of the WM tracts (above the threshold) connecting each ROI were compared between the two groups. The features included the pathway strength, indicated by the volumes and mean tract count per WM region of the ROIs,28 and the above-threshold standard DTI parameters, including fractional anisotropy (FA) and three diffusivity measurements (average mean diffusivity, axial diffusivity, and radial diffusivity).
Comparison of structure and function
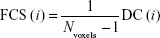
We assessed the characteristics of the SC and FC measures in three steps: 1) structural and functional connections of the amygdala and hippocampus were identified; 2) the connectivity strength of the amygdala and hippocampus was determined, and inter-group comparisons were made separately for FC and SC; and 3) the structure–function relationship of coupling was determined by partial correlation analysis (see flowchart in Figure 1).
 | Figure 1 A flowchart of the calculation of the connectivity of the amygdala and hippocampus. |
Statistical analysis
For rsFC, we used a random-effects one-sample t-test in the SPM toolkit (SPM8)31 to identify brain regions that showing significantly positive correlations with each seed region for each group with a two-tailed false-discovery rate correction at P<0.05. We only considered positive correlations in the rsFC analysis because the issue of negative correlations remains an unsettled debate.32,33 Next, a mask was generated by combining the regions exhibiting significant positive connectivity with the seed region under each condition. Finally, general linear model (GLM) analysis and two-sample t-test in SPM8 were performed to identify regions of altered voxel-based rsFC (P<0.05, Gaussian random field theory corrected, minimum z>2.3). Age, sex, and amygdala or hippocampal volumes were considered covariates in the analyses.
GLM analysis was also performed with SPM8 to investigate the group differences of FCS within the amygdala or hippocampus between RRMS patients and HCs after controlling for the effects of age, sex, and amygdala or hippocampal atrophy.
Additionally, a two-sample t-test in Statistical Product and Service Solutions (SPSS Inc, Chicago, IL, USA) was performed to compare the group differences in each cluster-based rsFC between the ROI and other brain areas with significant positive connectivity with the seed region, FCS of the amygdala or hippocampus, or SC of the amygdala or hippocampus (P<0.05, Bonferroni corrected).
Finally, partial correlation analysis was performed in the RRMS group to assess the relationship between clinical markers and SC and FC damage and the effect of this damage on clinical parameters and indices in RRMS patients, with age, sex, and amygdala or hippocampal volumes as covariates of no interest. The threshold was set at a significance level of P<0.05 and was corrected for multiple comparisons using the Bonferroni correction.
Results
Demographic and clinical data
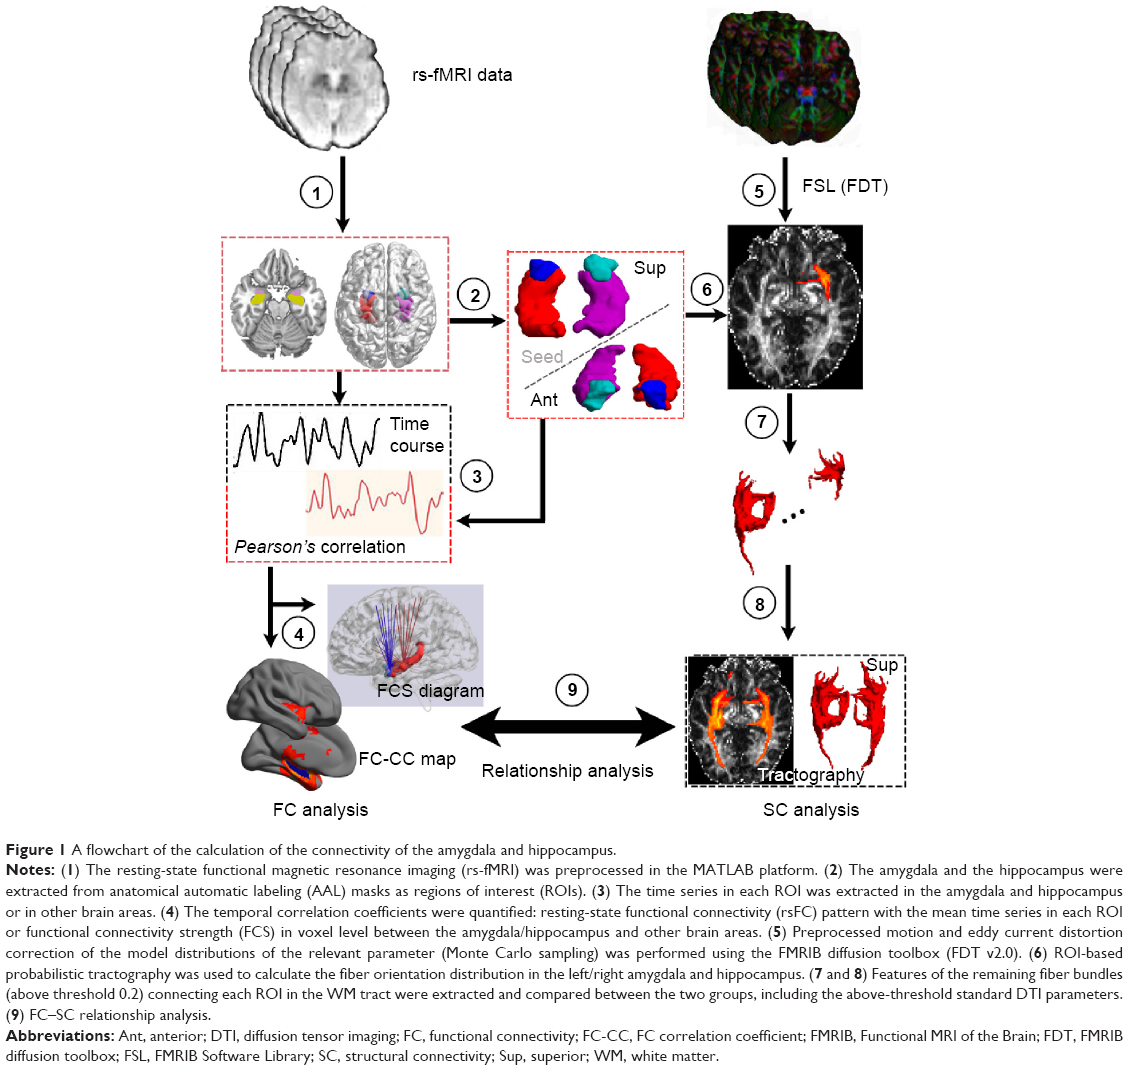
Among the 23 RRMS patients, the mean EDSS score was 1.604 corresponding to minimal disability. Significant differences were found between the RRMS and HC groups in amygdala, hippocampal and whole brain volumes, and in the paced auditory serial addition test scores. These measures revealed atrophy and slowed cognitive processing due to MS-related damage. The demographic and clinical characteristics of the 23 right-handed RRMS patients (7 males, 16 females) and well-matched HCs are summarized in Table 1.
 | Table 1 Demographics and clinical characteristics of the control subjects and RRMS patients |
FC measures of the amygdala and hippocampus
Seed-based FC was then used to measure the FC-CC between the positively correlated regions and the seed region (amygdala or hippocampus). The results of a one-sample t-test found similar FC-CC distributions of the amygdala and hippocampus in the RRMS and HC groups (false-discovery rate corrected, P<0.01) (Figure S1). In a cluster-based analysis, a significant FC-CC difference was not detected between the RRMS and HC groups (P>0.05) (Table S1, Figure 2A). However, in a voxel-based GLM analysis, compared with HCs, significantly reduced FC-CCs (including bilateral putamen, detailed results shown in Table S2 and Figure S2) were only detected in the RRMS group (P<0.05, Gaussian random field theory corrected, minimum z>2.3).
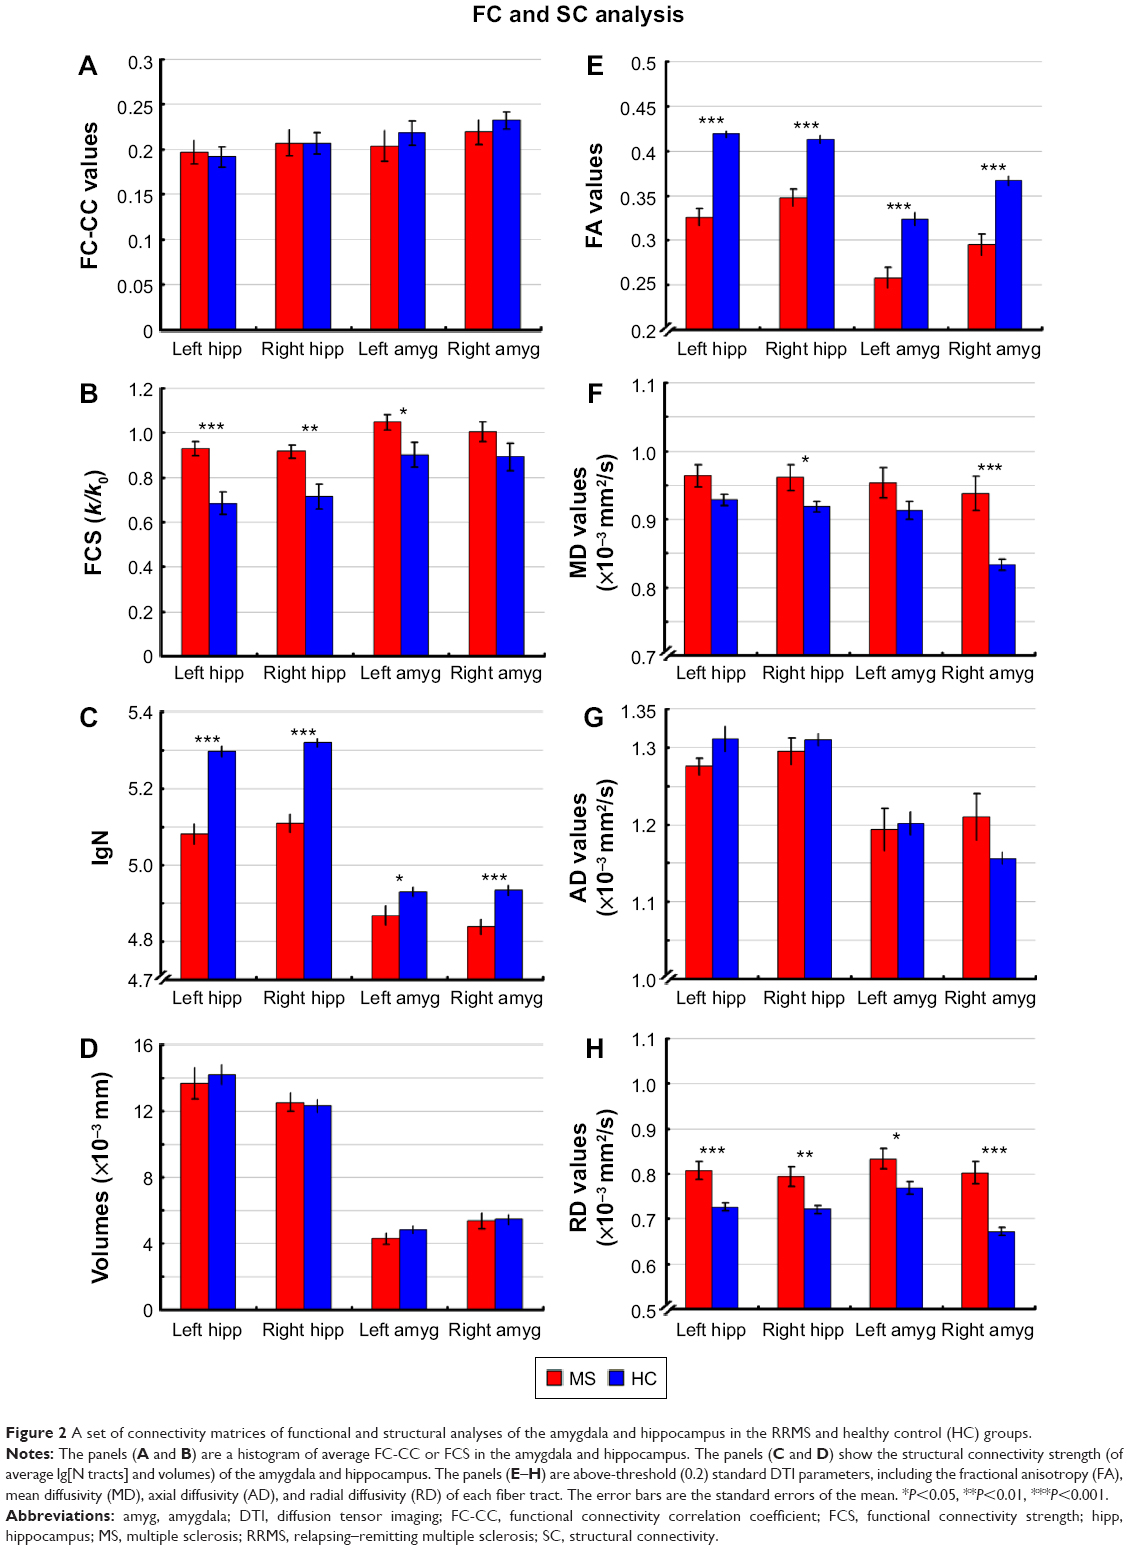 | Figure 2 A set of connectivity matrices of functional and structural analyses of the amygdala and hippocampus in the RRMS and healthy control (HC) groups. |
A voxel-wise FCS metric was used to measure the connectivity strength across the amygdala and hippocampus. The FCS of the amygdala and the hippocampus was also extracted and compared between the RRMS and HC groups (Table S1, Figure 2B). Specifically, significantly increased FCS was detected in the left amygdala (P<0.05), left hippocampus (P<0.001), and right hippocampus (P<0.01) in the RRMS group.
SC measures of the amygdala and hippocampus
SC strengths were assessed by measuring the volumes and mean tract counts along the above-threshold reconstructed tracts (Figure 2C and D, Table S1). Figure 3 shows a macroscopic view of sample WM tracts of the amygdala and hippocampus identified by probabilistic tracking, in transverse section (Figure 3A and B) and three-dimensional views (Figure 3C and D), respectively. In the RRMS patients, no difference was detected in the volume of the tract linking the amygdala or hippocampus, but lower counts (lg[N tracts]) were detected in the tracts linking the left amygdala (4.868 vs 4.930), right amygdala (4.839 vs 4.934), left hippocampus (5.081 vs 5.297), and right hippocampus (5.108 vs 5.320).
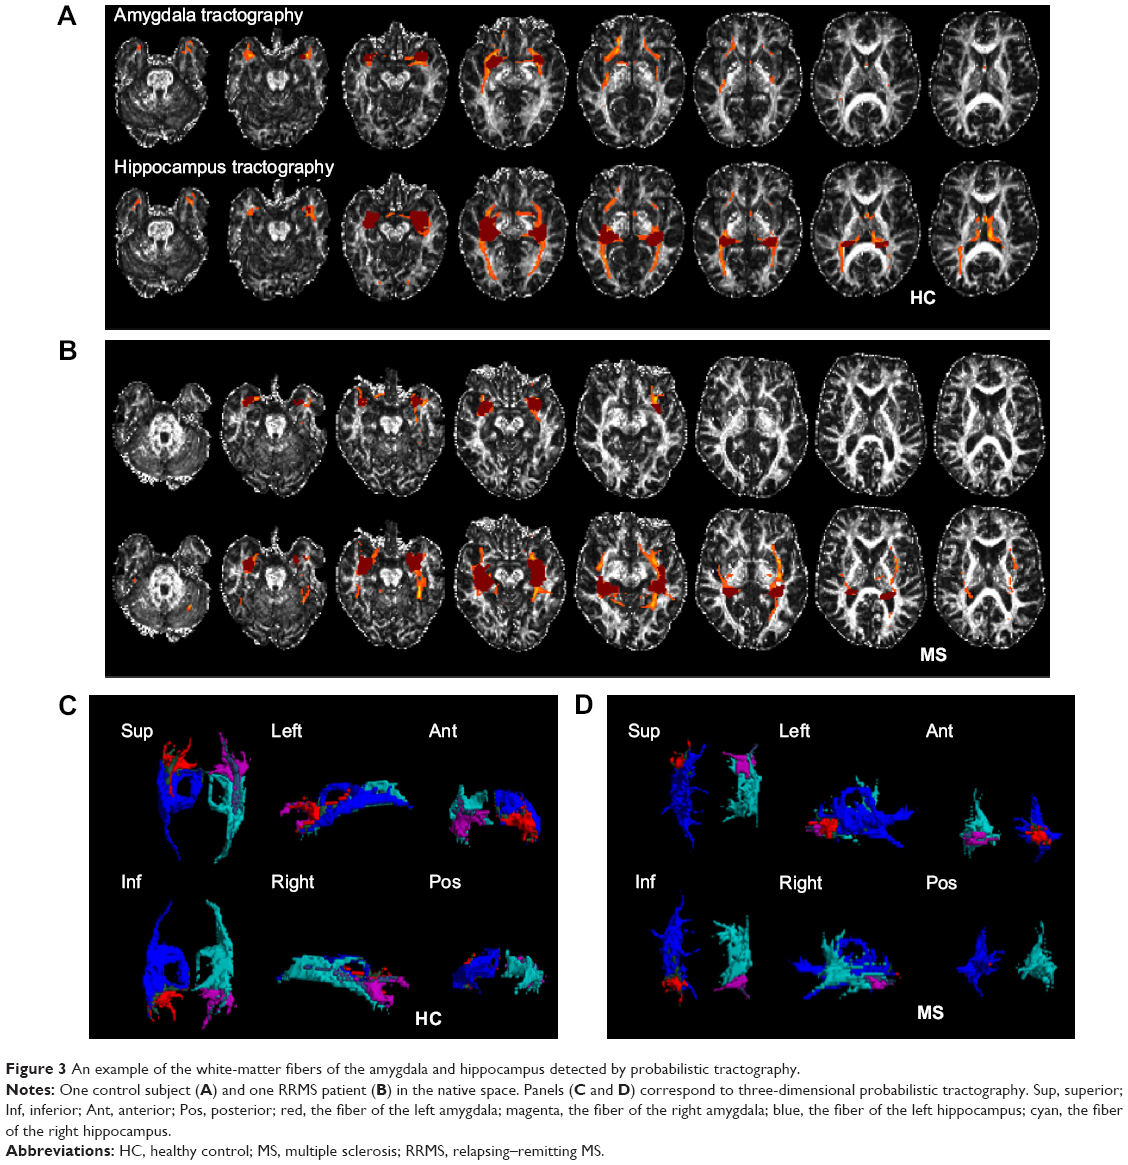 | Figure 3 An example of the white-matter fibers of the amygdala and hippocampus detected by probabilistic tractography. |
The integrity of the above-threshold reconstructed tracts was assessed by measuring the standard DTI parameters (Figure 2E–H, Table S1). In the RRMS patients, decreased FA and increased RD values were detected in all four tracts (P<0.05, Table S1) and increased mean diffusivity values were detected in the tract linking the right amygdala (0.938×10⁻³ vs 0.833×10⁻³) and right hippocampus (0.961×10⁻³ vs 0.918×10⁻³).
Relationship between structure and function measures
In the RRMS group, partial correlation analyses (Figure 4) revealed that decreased FA of the right amygdala or right hippocampus was positively correlated with slightly increased FCS (ρ=0.45, P=0.034) or decreased FC-CC (ρ=0.57, P=0.005), indicating an SC–FC coupling relationship. Figure S3 shows an example of the relationship between the FC and SC measures in other thresholds (0.05, 0.10, 0.15, 0.20, 0.25, and 0.30) of probabilistic tractography.
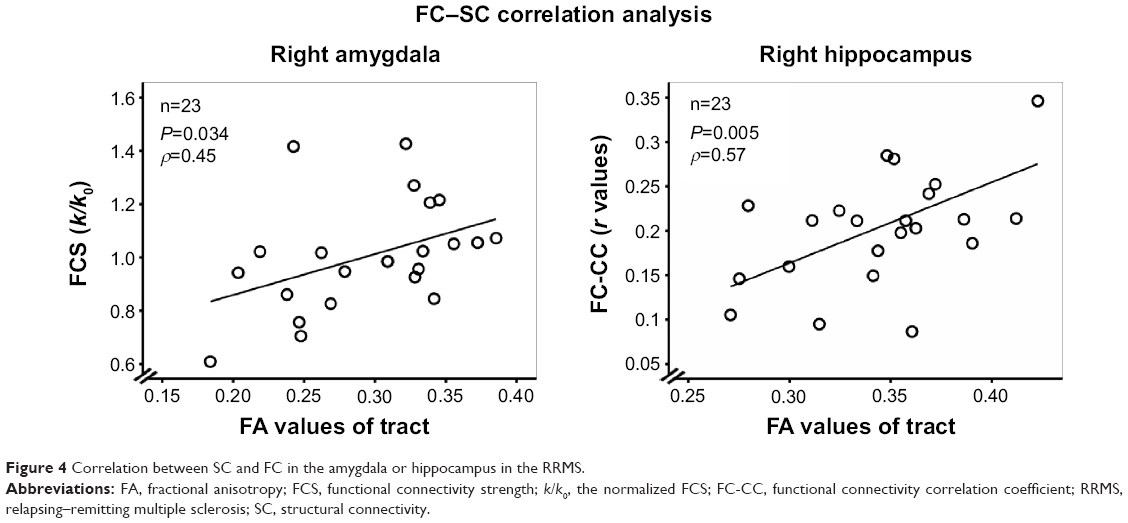 | Figure 4 Correlation between SC and FC in the amygdala or hippocampus in the RRMS. |
Relationships between abnormal connectivity indices and clinical markers of RRMS
In the RRMS group, partial correlation analyses between clinical markers and abnormal connectivity indices in the amygdala or hippocampus showing significant group differences revealed that only the total WM lesion load (TWMLL) was only negatively correlated with the FCS of the left amygdala (ρ=−0.55, P<0.05) (Figure 5A), the lg(N tracts) of the right hippocampus (ρ=−0.68, P<0.05), and the lg(N tracts) (ρ=−0.69, P<0.05) and FA values of the left hippocampus (ρ=−0.68, P<0.05). The TWMLL was positively correlated with the RD of the left hippocampus (ρ=0.45, P<0.05) (Figure 5B). The above-mentioned measures revealed the association between abnormal connectivity and the MS-related lesion load.
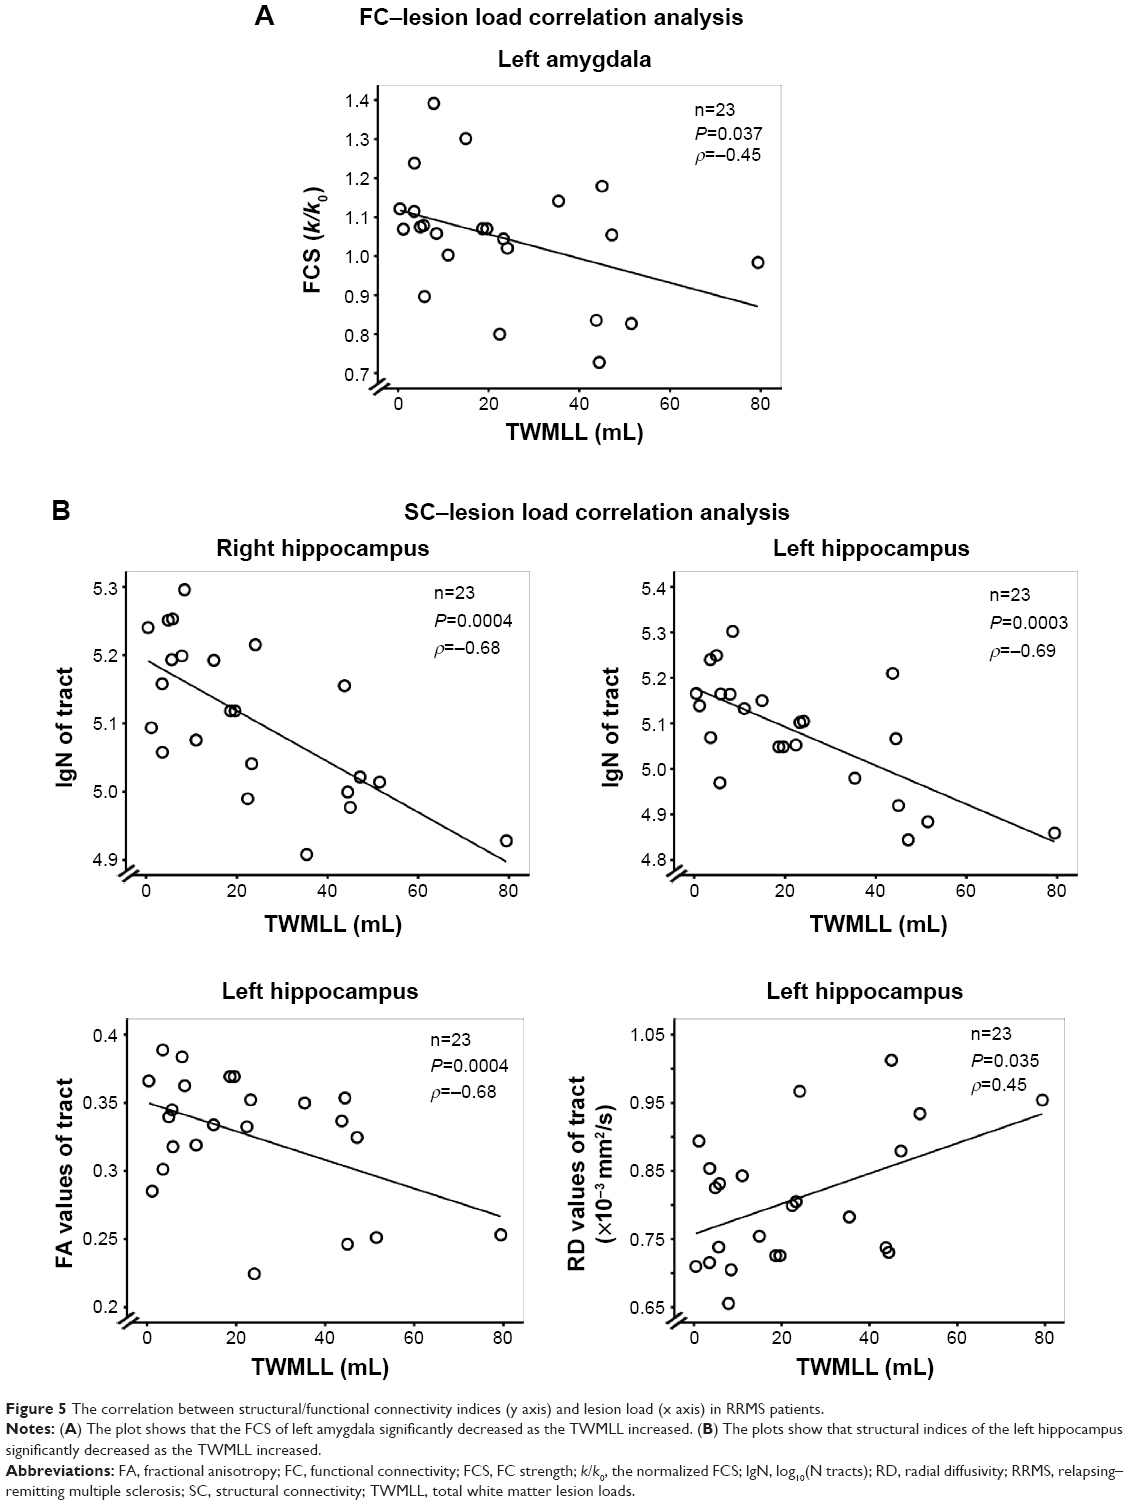 | Figure 5 The correlation between structural/functional connectivity indices (y axis) and lesion load (x axis) in RRMS patients. |
Discussion
In the present study, we showed that the SC of the hippocampus and amygdala is significantly decreased in minimally disabled RRMS patients and that increased FCS may be a cortical reorganization mechanism to maintain cluster-level rsFC. We also found two significant correlations between the FC and SC measures: slightly increased FC-CC (or increased FCS) was positively correlated with WM tract damage in the right hippocampus (or right amygdala). Additionally, some SC and FCS indices of RRMS patients were significantly correlated with the lesion load. This study, linking the decreased WM connections and compensatory cortical reorganization of the hippocampus and amygdala, provides new insights into how lesion load impacts SC and function in RRMS.
Hippocampal connectivity disturbances
Selective functional disconnection of the hippocampus
Our data show increased FCS of the right or left hippocampus in RRMS patients, which functionally compensates for selectively decreased FC-CC between the left hippocampus and left basal ganglia (lentiform nucleus), right hippocampus and right basal ganglia (putamen), or the brainstem. Extensive evidence suggests that the basal ganglia and hippocampal systems are simultaneously activated in habit learning and memory34 and that the basal ganglia are involved in both conscious and unconscious learning.35 fMRI has shown functional disruption in hippocampus-basal ganglia pathways such as reduced activation in habitual learning and memory tasks in Parkinson’s disease.36 The possibility of effective dependent learning was caused by dissociating the basal ganglia from the hippocampus, as suggested in the present study. The brainstem plays important roles in many basic functions, including breathing and sleeping, and the ascending brainstem hippocampal synchronizing pathways37 are involved in memory retrieval.38 The disconnection of brainstem regions from the hippocampus implies that memory loss is associated with a wide variety of decreased rsFC measures in RRMS patients.
Fortunately, in the current study, significantly increased connectivity strength was shown in minimally disabled RRMS patients. This increased strength was enabled by cortical reorganization in adjacent areas as a compensatory mechanism to maintain stable neural function. In the early stages of MS, patients show increased rsFC in most resting-state networks.39,40 Thus, enhanced cerebral activity in the earliest clinical stage of MS is subsequently lost as brain damage progresses; this activity might be an early but finite compensatory phenomenon in MS.41,42 Additionally, an increased lesion load was negatively correlated with FCS, further supporting the idea of finite cortical compensation.
Decreased connectivity of WM tracts of the hippocampus and their association with lesion load
We identified the WM tracts connected with the hippocampus, and we also demonstrated that loss of integrity occurred in left and right fiber tracts, mainly reflected as a reduced tract number, decreased FA values, and increased RD values. The SC disconnection in this study may reflect a variety of neuropathological processes, including demyelination, decreased dendritic density, and/or myelin loss. DTI measures (ROI analysis43,44 and tract-based spatial statistics,45 as examples) are sensitive to WM damage in MS, including interior focal lesions and normal-appearing WM: these regional DTI alterations are related to disability and cognitive deficits.46 Notably, hippocampal demyelination has been demonstrated in postmortem MS brains.6,7 Especially in the hippocampus, demyelination is a cause of synaptic alterations in MS patients, and the neuronal genes regulated by myelination reflect specific functions of neuronal subpopulations.6 In vivo, regional micro-structural damage9,10 and atrophy11 have been demonstrated in the hippocampus by MRI. The detection of WM integrity in this study is consistent with previous reports,9,11 although these reports focused on focal lesions or regional atrophy. Few published reports have investigated the integrity of hippocampal tracts in MS, but our observations are also in agreement with their findings in other major WM fiber tracts.14,15,47
The WM lesions in RRMS were associated with changes in the structural integrity of hippocampal WM tracts of the Liu et al48 demonstrated damage in whole-brain WM regions and significant correlations between the diffusion metrics and TWMLL. TWMLL is considered a clinically relevant measure of disease progression.49,50 In this study, we detected an inverse correlation between the TWMLL and the tract number loss in the right and left hippocampus and also found reduced FA and increased RD values in the left hippocampus with increasing TWMLL, suggesting that the SC of the hippocampus is susceptible to the impact of acute MS lesions.
Relationship of SC–FC coupling measures in the hippocampus
Cortical functional reorganization might be an important pathophysiological factor in controlling information processing deficiencies in minimally disabled RRMS patients. Neuronal fiber tracts are bundles with an extremely large number of axons that act as a bridge connecting the hippocampus to the rest of the brain. This is not unexpected, as reduced anisotropy is likely in the demyelinated hippocampus. However, when we analyzed the strength of connectivity as measured by the mean FA of voxels representing the reconstructed tractography pathways, we found a relationship between the FC-CC and the FA value of the tract belonging to the right hippocampus in the RRMS patients. Previously, we demonstrated a relationship between SC and FC coupling measures in long WM (backbone) tracts within default mode network subregions.14 In early-intact MS patients with memory function, decreased regional rsFC of structural integrity in the hippocampus has been observed,9 revealing a proactively changing state before the activation of the defense functions. The structure has been considered the underlying foundation of functional change.51 To the best of our knowledge, this is the first study to attempt to link the SC and FC of the hippocampus in RRMS patients.
Connectivity disturbances in the amygdala
We also attempted to identify the connectivity disturbances in the amygdala, and the changes in functional or SC of the amygdala are extremely similar in the hippocampus. As another component of the limbic system, the amygdala is composed of structurally and functionally distinct nuclei that contribute to emotion processing through interactions with other subcortical and cortical structures.52,53 In this study, we demonstrated that disruptions also occurred in the fiber bundles crossing the amygdala, mainly reflected in tract number loss and decreased FA and increased RD values in the tracts. Notably, the amygdala was disconnected from the basal ganglia in FC-CC. The increased FCS of the left amygdala also suggested limited compensatory cortical reorganization. The capacity of cortical reorganization reflected in FCS was depended on the TWMLL and was related to the anisotropy of the fiber bundles crossing the amygdala in RRMS patients. No systematic and comprehensive academic research on the amygdala in RRMS has been conducted, and few MS studies have involved the amygdala at all.2,53,54
Technical considerations and study limitations
In contrast to deterministic tractography (a single trajectory reconstruction), probabilistic tractography was performed in our study to investigate the strength of SC and the above-threshold standard DTI parameters in the WM tracts. Probabilistic tractography methods are used to propagate a large number of pathways passing through the seed point, and the pathway orientations are drawn from a distribution of possible orientations.28,30 The probabilistic tractography methods can be used to easily reconstruct the existence of direct neuroanatomical connections of the hippocampus or amygdala.15,55
Notably, ROIs of the amygdala or hippocampus were defined according to an automated anatomical labeling template, and the atrophy of the amygdala or hippocampus was considered as an influencing factor in this study. Additionally, there are a few limitations to probabilistic tractography, including the possibly highly reproducible topology of the reconstructed pathways28,29 and the lack of statistical consensus on the probabilistic tractography threshold.30 Finally, we performed a limited assessment of cognitive function.
Conclusion
In the present study, we observed increased functional connections and demyelination-related structural disconnectivity of the hippocampus and amygdala with other regions in RRMS patients. This study, linking the connectivity of WM tracts and the synchrony of intrinsic neuronal activity in other regions connected with the hippocampus and amygdala, provides a new avenue to understand the cortical reorganization of the hippocampus and amygdala in the pathophysiology of RRMS.
Acknowledgments
The authors thank their patients and volunteers for participating in this study. This study was supported by the National Science Foundation of China (Grant nos 81101041, 81260217, and 81460263), the Natural Science Foundation of Jiangxi, People’s Republic of China (Grant no 2013BAB215008), the Science and Technology Project of Jiangxi Provincial Education Department, People’s Republic of China (Grant no GJJ13136), the Science and Technology Project of Jiangxi Provincial Health and Family Planning Commission (Grant no 20143071), and also by “Gan Po” engineering excellence 555 project of Jiangxi Province.
Author contributions
Dr Zhou and Dr Zhuang contributed to study concept and design, manuscript writing, analysis and interpretation; Dr Zhang and Dr Wu contributed to data acquisition; Dr Wang, Dr Zhou, and Prof Zeng contributed to manuscript editing; Prof Gong contributed to study supervision. All authors contributed toward data analysis, drafting and revising the paper and agree to be accountable for all aspects of the work.
Disclosure
The authors report no conflicts of interest in this work.
References
Hulst HE, Schoonheim MM, Roosendaal SD, et al. Functional adaptive changes within the hippocampal memory system of patients with multiple sclerosis. Hum Brain Mapp. 2012;33(10):2268–2280. | ||
Krause M, Wendt J, Dressel A, et al. Prefrontal function associated with impaired emotion recognition in patients with multiple sclerosis. Behav Brain Res. 2009;205(1):280–285. | ||
Dineen RA, Vilisaar J, Hlinka J, et al. Disconnection as a mechanism for cognitive dysfunction in multiple sclerosis. Brain. 2008;132(1): 239–249. | ||
Caramia F, Tinelli E, Francia A, Pozzilli C. Cognitive deficits in multiple sclerosis: a review of functional MRI studies. Neurol Sci. 2010;31(Suppl 2): S239–S243. | ||
Heesen C, Schulz KH, Fiehler J, et al. Correlates of cognitive dysfunction in multiple sclerosis. Brain Behav Immun. 2010;24(7):1148–1155. | ||
Dutta R, Chang A, Doud MK, et al. Demyelination causes synaptic alterations in hippocampi from multiple sclerosis patients. Ann Neurol. 2011;69(3):445–454. | ||
Bruck W. The pathology of multiple sclerosis is the result of focal inflammatory demyelination with axonal damage. J Neurol. 2005; 252(Suppl 5):v3–v9. | ||
Geurts JJG, Barkhof F. Grey matter pathology in multiple sclerosis. Lancet Neurol. 2008;7(9):841–851. | ||
Roosendaal SD, Hulst HE, Vrenken H, et al. Structural and functional hippocampal changes in multiple sclerosis patients with intact memory function. Radiology. 2010;255(2):595–604. | ||
Canli T, Zhao Z, Brewer J, Gabrieli JD, Cahill L. Event-related activation in the human amygdala associates with later memory for individual emotional response. J Neurosci. 2000;20(19):RC99. | ||
Sicotte NL, Kern KC, Giesser BS, et al. Regional hippocampal atrophy in multiple sclerosis. Brain. 2008;131(Pt 4):1134–1141. | ||
Schoonheim MM, Popescu V, Rueda Lopes FC, et al. Subcortical atrophy and cognition: sex effects in multiple sclerosis. Neurology. 2012;79(17):1754–1761. | ||
van den Heuvel M, Mandl R, Luigjes J, Hulshoff Pol H. Microstructural organization of the cingulum tract and the level of default mode functional connectivity. J Neurosci. 2008;28(43):10844–10851. | ||
Zhou F, Zhuang Y, Gong H, et al. Altered inter-subregion connectivity of the default mode network in relapsing remitting multiple sclerosis: a functional and structural connectivity study. PLoS One. 2014;9(7):e101198. | ||
Hu B, Ye B, Yang Y, et al. Quantitative diffusion tensor deterministic and probabilistic fiber tractography in relapsing-remitting multiple sclerosis. Eur J Radiol. 2011;79(1):101–107. | ||
Shu N, Liu Y, Li K, et al. Diffusion tensor tractography reveals disrupted topological efficiency in white matter structural networks in multiple sclerosis. Cereb Cortex. 2011;21(11):2565–2577. | ||
Zuo XN, Ehmke R, Mennes M, et al. Network centrality in the human functional connectome. Cereb Cortex. 2012;22(8):1862–1875. | ||
Hurwitz BJ. The diagnosis of multiple sclerosis and the clinical subtypes. Ann Indian Acad Neurol. 2009;12(4):226–230. | ||
Kurtzke JF. Historical and clinical perspectives of the expanded disability status scale. Neuroepidemiology. 2008;31(1):1–9. | ||
Restfmri.net [homepage on the internet]. Beijing: forum of resting-state fMRI [updataed 2012 September 5; cited 2014 December 20]. Available from: http://www.restfmri.net. Accessed December 20, 2014. | ||
Ashburner J, Friston KJ. Unified segmentation. Neuroimage. 2005; 26(3):839–851. | ||
Yan CG, Cheung B, Kelly C, et al. A comprehensive assessment of regional variation in the impact of head micromovements on functional connectomics. Neuroimage. 2013;76:183–201. | ||
Tzourio-Mazoyer N, Landeau B, Papathanassiou D, et al. Automated anatomical labeling of activations in SPM using a macroscopic anatomical parcellation of the MNI MRI single-subject brain. Neuroimage. 2002;15(1):273–289. | ||
Hou JM, Zhao M, Zhang W, et al. Resting-state functional connectivity abnormalities in patients with obsessive-compulsive disorder and their healthy first-degree relatives. J Psychiatry Neurosci. 2014;39(5): 304–311. | ||
Yan CG, Craddock RC, Zuo XN, Zang YF, Milham MP. Standardizing the intrinsic brain: towards robust measurement of inter-individual variation in 1000 functional connectomes. Neuroimage. 2013;80(10): 246–262. | ||
Jenkinson M, Bannister P, Brady M, Smith S. Improved optimization for the robust and accurate linear registration and motion correction of brain images. Neuroimage. 2002;17(2):825–841. | ||
Fslwiki/FDT [homepage on the internet]. Oxford: FMRI Software Library, FMRIB’s Diffusion Toolbox [updataed 2015 March 29; cited 2015 July 2]. Available from: http://fsl.fmrib.ox.ac.uk/fsl/fslwiki/FDT. Accessed July 2, 2015. | ||
Behrens TE, Berg HJ, Jbabdi S, Rushworth MF, Woolrich MW. Probabilistic diffusion tractography with multiple fibre orientations: what can we gain? Neuroimage. 2007;34(1):144–155. | ||
Khalsa S, Mayhew SD, Chechlacz M, Bagary M, Bagshaw AP. The structural and functional connectivity of the posterior cingulate cortex: comparison between deterministic and probabilistic tractography for the investigation of structure-function relationships. Neuroimage. 2014; 102P1:118–127. | ||
Morris DM, Embleton KV, Parker GJ. Probabilistic fibre tracking: differentiation of connections from chance events. Neuroimage. 2008; 42(4):1329–1339. | ||
fil.ion.ucl.ac.uk [homepage on the internet]. London: Statistical Parametric Mapping [updataed 2015 March 6; cited 2015 July 2]. Available from: http://www.fil.ion.ucl.ac.uk/spm/. Accessed July 2, 2015. | ||
Murphy K, Birn RM, Handwerker DA, Jones TB, Bandettini PA. The impact of global signal regression on resting state correlations: are anti-correlated networks introduced? Neuroimage. 2009;44(3):893–905. | ||
Chai XJ, Castañón AN, Öngür D, Whitfield-Gabrieli S. Anticorrelations in resting state networks without global signal regression. Neuroimage. 2012;59(2):1420–1428. | ||
Packard MG, Knowlton BJ. Learning and memory functions of the basal ganglia. Ann Rev Neurosci. 2002;25:563–593. | ||
Seger CA, Dennison CS, Lopez-Paniagua D, Peterson EJ, Roark AA. Dissociating hippocampal and basal ganglia contributions to category learning using stimulus novelty and subjective judgments. Neuroimage. 2011;55(4):1739–1753. | ||
Foerde K, Shohamy D. The role of the basal ganglia in learning and memory: insight from Parkinson’s disease. Neurobiol Learn Mem. 2011;96(4):624–636. | ||
Bland BH, Oddie SD. Anatomical, electrophysiological and pharmacological studies of ascending brainstem hippocampal synchronizing pathways. Neurosci Biobehav Rev. 1998;22(2):259–273. | ||
Heckers S, Weiss AP, Alpert NM, Schacter DL. Hippocampal and brain stem activation during word retrieval after repeated and semantic encoding. Cereb Cortex. 2002;12(9):900–907. | ||
Roosendaal SD, Schoonheim MM, Hulst HE, et al. Resting state networks change in clinically isolated syndrome. Brain. 2010;133(Pt 6):1612–1621. | ||
Mainero C, Caramia F, Pozzilli C, et al. fMRI evidence of brain reorganization during attention and memory tasks in multiple sclerosis. Neuroimage. 2004;21(3):858–867. | ||
Filippi M, Agosta F, Spinelli EG, Rocca MA. Imaging resting state brain function in multiple sclerosis. J Neurol. 2013;260(7):1709–1713. | ||
Sacco R, Bonavita S, Esposito F, Tedeschi G, Gallo A. The contribution of resting state networks to the study of cortical reorganization in MS. Mult Scler Int. 2013;2013:857807. | ||
Zhou F, Shiroishi M, Gong H, Zee CS. Multiple sclerosis: hyperintense lesions in the brain on T1-weighted MR images assessed by diffusion tensor imaging. J Magn Reson Imaging. 2010;31(4):789–795. | ||
Zhou F, Zee C-S, Gong H, Shiroishi M, Li J. Differential changes in deep and cortical gray matters of patients with multiple sclerosis: a quantitative magnetic resonance imaging study. J Comput Assist Tomogr. 2010;34(3):431–416. | ||
Roosendaal S, Geurts J, Vrenken H, et al. Regional DTI differences in multiple sclerosis patients. Neuroimage. 2009;44(4):1397–1403. | ||
Sbardella E, Tona F, Petsas N, Pantano P. DTI measurements in multiple sclerosis: evaluation of brain damage and clinical implications. Mult Scler Int. 2013;2013:671730. | ||
Hasan KM, Walimuni IS, Abid H, Datta S, Wolinsky JS, Narayana PA. Human brain atlas-based multimodal MRI analysis of volumetry, diffusimetry, relaxometry and lesion distribution in multiple sclerosis patients and healthy adult controls: implications for understanding the pathogenesis of multiple sclerosis and consolidation of quantitative MRI results in MS. J Neurol Sci. 2012;313(1–2):99–109. | ||
Liu Y, Duan Y, He Y, et al. Whole brain white matter changes revealed by multiple diffusion metrics in multiple sclerosis: a TBSS study. Eur J Radiol. 2012;81(10):2826–2832. | ||
Bodini B, Battaglini M, De Stefano N, et al. T2 lesion location really matters: a 10 year follow-up study in primary progressive multiple sclerosis. J Neurol Neurosurg Psychiatry. 2011;82(1):72–77. | ||
Pelletier D, Garrison K, Henry R. Measurement of whole-brain atrophy in multiple sclerosis. J Neuroimaging. 2004;14(s3):11S–19S. | ||
Greicius MD, Supekar K, Menon V, Dougherty RF. Resting-state functional connectivity reflects structural connectivity in the default mode network. Cereb Cortex. 2009;19(1):72–78. | ||
Colnat-Coulbois S, Mok K, Klein D, Penicaud S, Tanriverdi T, Olivier A. Tractography of the amygdala and hippocampus: anatomical study and application to selective amygdalohippocampectomy. J Neurosurg. 2010;113(6):1135–1143. | ||
Passamonti L, Cerasa A, Liguori M, et al. Neurobiological mechanisms underlying emotional processing in relapsing-remitting multiple sclerosis. Brain. 2009;132(Pt 12):3380–3391. | ||
Kincses ZT, Ropele S, Jenkinson M, et al. Lesion probability mapping to explain clinical deficits and cognitive performance in multiple sclerosis. Mult Scler. 2011;17(6):681–689. | ||
Malykhin N, Concha L, Seres P, Beaulieu C, Coupland NJ. Diffusion tensor imaging tractography and reliability analysis for limbic and paralimbic white matter tracts. Psychiatry Res. 2008;164(2):132–142. |
Supplementary materials
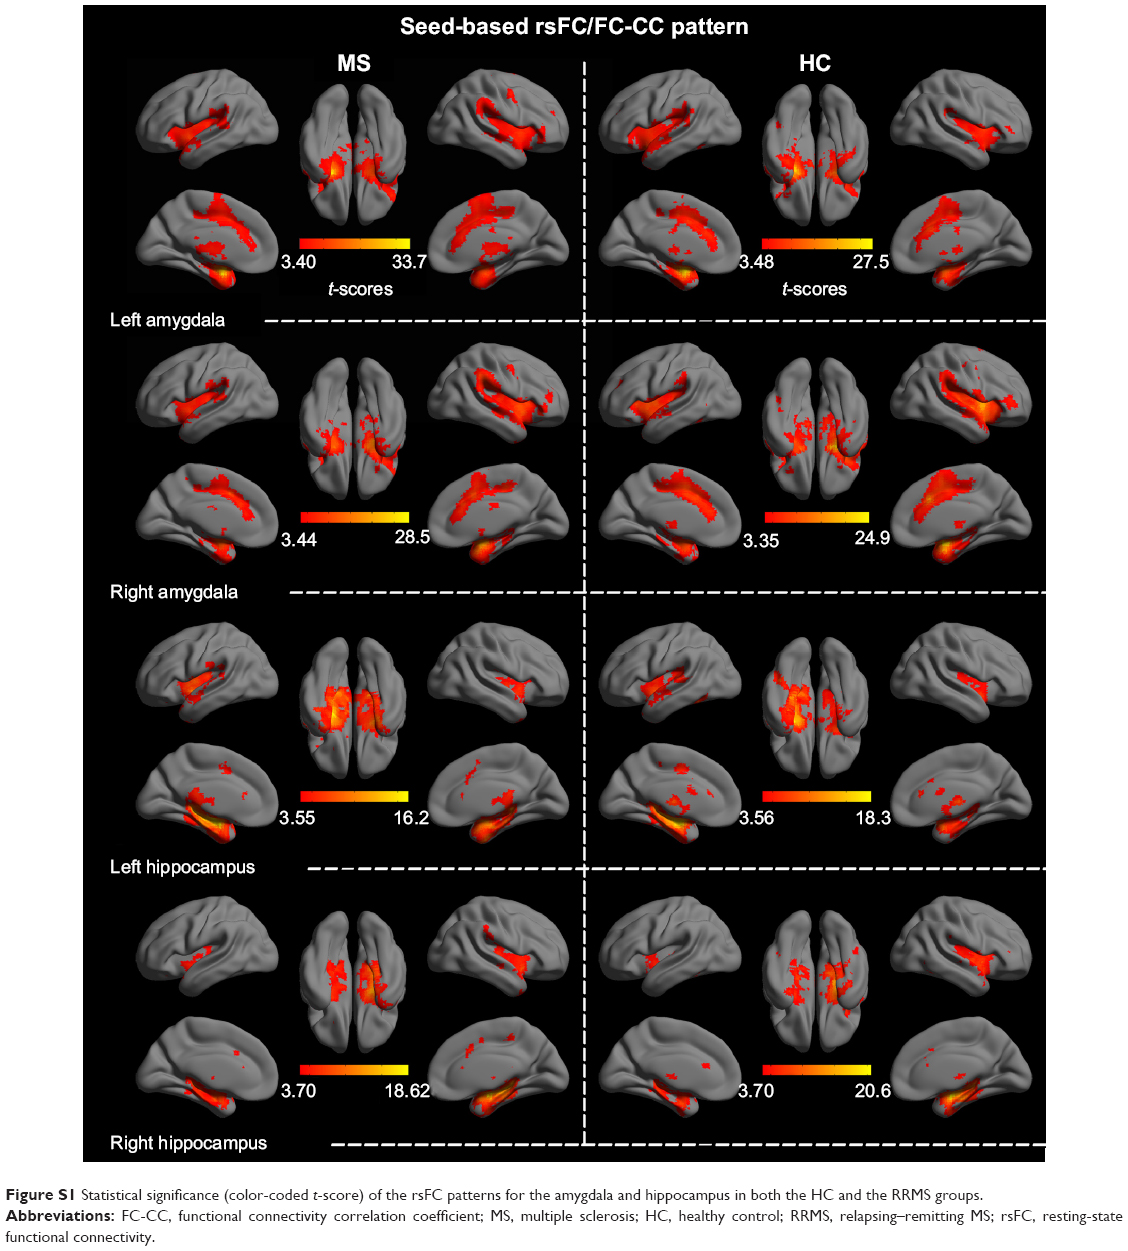 | Figure S1 Statistical significance (color-coded t-score) of the rsFC patterns for the amygdala and hippocampus in both the HC and the RRMS groups. |
 | Figure S2 Brain regions with significant differences (P<0.05, corrected) in rsFC patterns for all seed regions between the RRMS patients and the HCs. |
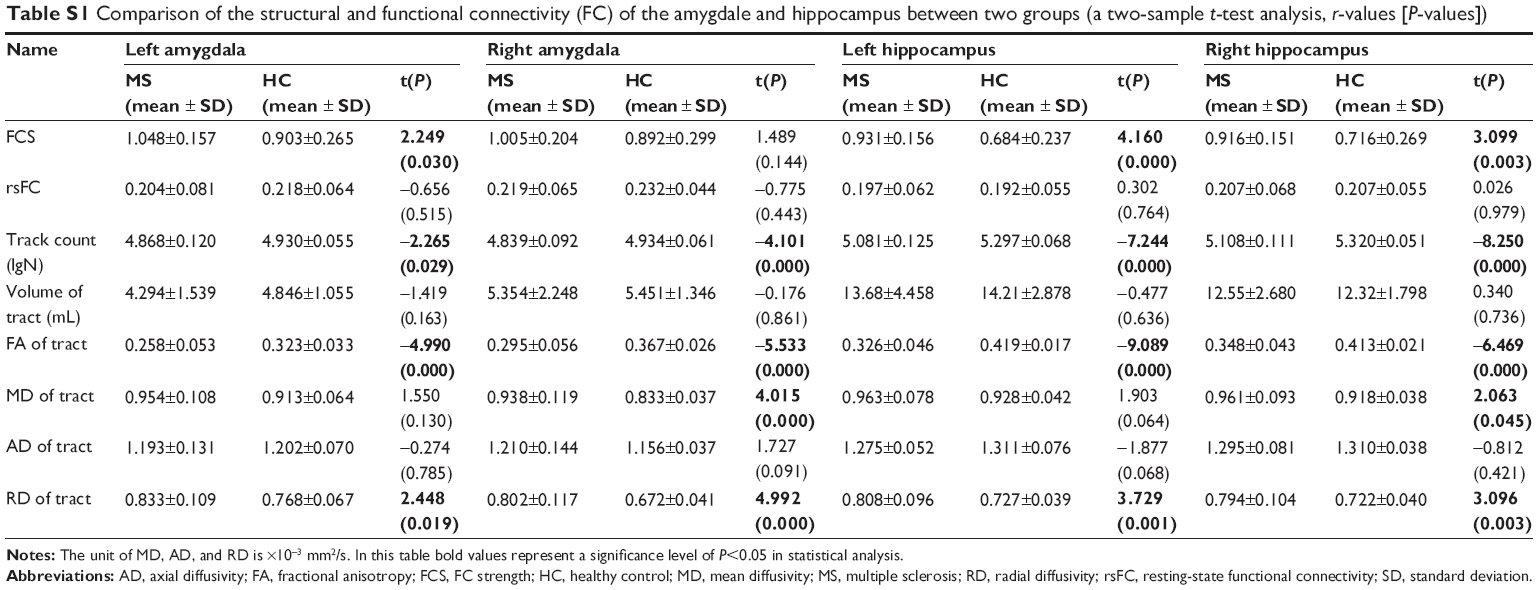 | Table S1 Comparison of the structural and functional connectivity (FC) of the amygdale and hippocampus between two groups (a two-sample t-test analysis, r-values [P-values]) |
 | Figure S3 An example of the relationship between functional connectivity strength (FCS) and structural connectivity measures in other thresholds (0.05, 0.10, 0.15, 0.20, 0.25, and 0.30) of probabilistic tractography. |
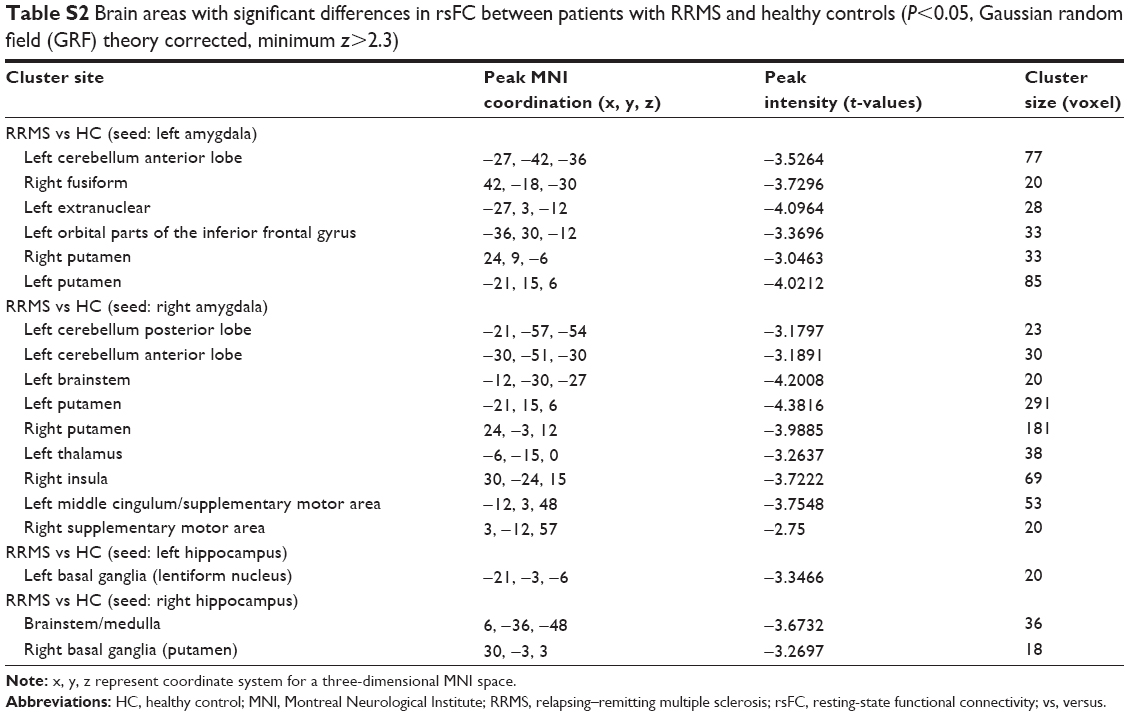 | Table S2 Brain areas with significant differences in rsFC between patients with RRMS and healthy controls (P<0.05, Gaussian random field (GRF) theory corrected, minimum z>2.3) |
 © 2015 The Author(s). This work is published and licensed by Dove Medical Press Limited. The full terms of this license are available at https://www.dovepress.com/terms.php and incorporate the Creative Commons Attribution - Non Commercial (unported, v3.0) License.
By accessing the work you hereby accept the Terms. Non-commercial uses of the work are permitted without any further permission from Dove Medical Press Limited, provided the work is properly attributed. For permission for commercial use of this work, please see paragraphs 4.2 and 5 of our Terms.
© 2015 The Author(s). This work is published and licensed by Dove Medical Press Limited. The full terms of this license are available at https://www.dovepress.com/terms.php and incorporate the Creative Commons Attribution - Non Commercial (unported, v3.0) License.
By accessing the work you hereby accept the Terms. Non-commercial uses of the work are permitted without any further permission from Dove Medical Press Limited, provided the work is properly attributed. For permission for commercial use of this work, please see paragraphs 4.2 and 5 of our Terms.