Back to Journals » Journal of Multidisciplinary Healthcare » Volume 19
Directional Symptom Dependencies in Multiple Sclerosis and Parkinson’s Disease: A Comparative Bayesian Network Analysis
Authors Al-Sharman A, Khalil H, Malouche D, Kanaan S ![]() , Kim M
, Kim M ![]() , Saad N
, Saad N ![]() , Abdelrazeq M
, Abdelrazeq M ![]()
Received 9 March 2026
Accepted for publication 15 May 2026
Published 23 June 2026 Volume 2026:19 607760
DOI https://doi.org/10.2147/JMDH.S607760
Checked for plagiarism Yes
Review by Single anonymous peer review
Peer reviewer comments 3
Editor who approved publication: Professor Tilakavati Karupaiah
Alham Al-Sharman,1– 4 Hanan Khalil,5 Dhafer Malouche,6 Saddam Kanaan,5 Meeyoung Kim,1,3,7 Nabil Saad,1 Marah Abdelrazeq1
1Department of Physiotherapy, College of Health Sciences, University of Sharjah, Sharjah, United Arab Emirates; 2Department of Rehabilitation Sciences, Faculty of Applied Medical Sciences, Jordan University of Science and Technology, Irbid, Jordan; 3Neuromusculoskeletal Rehabilitation Research Group, Research Institute of Medical and Health Sciences, University of Sharjah, Sharjah, United Arab Emirates; 4Health Promotion Research Group, Research Institute for Medical and Health Sciences, University of Sharjah, Sharjah, United Arab Emirates; 5Department of Rehabilitation Sciences, College of Health Sciences, QU Health, Qatar University, Doha, Qatar; 6Department of Mathematics and Statistics, College of Arts and Sciences, Qatar University, Doha, Qatar; 7Laboratory of Health Science & Nanophysiotherapy, Department of Physical Therapy, Graduate School, Yongin University, Yongin, 17092, Republic of Korea
Correspondence: Alham Al-Sharman, Department of Physiotherapy, College of Health Sciences, University of Sharjah, Sharjah, 27272, United Arab Emirates, Email [email protected]
Background: Multiple sclerosis (MS) and Parkinson’s disease (PD) are progressive neurological disorders characterized by complex interactions among motor symptoms, psychological disturbances, sleep problems, fatigue, and pain. Because conventional correlation-based approaches cannot determine effect direction, this study used Bayesian Network (BN) analysis to identify and compare directional pathways among disease characteristics, physical function, psychological measures, sleep quality, fatigue, pain, and physical activity in individuals with MS and PD.
Methods: Cross-sectional data from individuals with MS (n=104) and PD (n=54) were analyzed. Variables included demographics, disease duration, disability, physical function, cognition, anxiety, depression, fatigue, sleep quality, pain, and physical activity. Missing data (< 20%) were handled using multiple imputations with predictive mean matching. Bayesian networks were estimated using the Hill-Climbing algorithm with Gaussian BIC scoring continuous data. Bootstrap analysis (500 resamples) assessed edge reliability, and linear regression on standardized (z-scored) variables quantified relationship strengths.
Results: The MS network comprised 18 nodes and 27 directed edges; bootstrap stability analysis (500 resamples) indicated that 21 of 27 edges (77.8%) were stable at the ≥ 50% threshold. Anxiety emerged as a central hub, directly predicting physical activity (β = 0.37, p < 0.001), sleep quality (β = 0.51, p < 0.001), physical fatigue (β = 0.24, p = 0.016), and pain severity (β = 0.30, p < 0.001). Pain interference acted as a mediator linking sleep and depression to both cognitive (β = 0.23, p = 0.005) and physical fatigue (β = 0.40, p < 0.001). The PD network comprised 14 nodes and 15 directed edges; 14 of 15 edges (93.3%) were bootstrap-stable Anxiety was again the central hub, strongly predicted by depression (β = 0.78, p < 0.001) and directly predicting pain interference (β = 0.59, p < 0.001) and balance (β = − 0.48, p < 0.001). Age directly predicted physical activity (β = − 0.50, p < 0.001) and balance (β = − 0.40, p < 0.001).
Conclusion: BN analysis revealed distinct disease-specific dependency structures. Anxiety emerged as a shared central hub in both MS and PD, although its downstream pathways differed. In MS, pain interference appeared to act as a key mediator, whereas the PD network was more parsimonious and dominated by age- and anxiety-related pathways. Because the data are cross-sectional, these findings should be interpreted as directional dependency structures that generate testable hypotheses for longitudinal and interventional work, rather than as confirmed causal pathways. They nonetheless point to anxiety as a plausible candidate target for future intervention studies for both conditions.
Keywords: multiple sclerosis, Parkinson’s Disease, Bayesian network analysis, motor, non-motor
Introduction
Multiple Sclerosis (MS) and Parkinson’s Disease (PD) are characterized by complex and interdependent networks of motor, psychological, and physiological symptoms that evolve across the disease course. Fatigue, depression, anxiety, pain, sleep disturbance and reduced physical activity are highly prevalent in both conditions and represent major determinants of functional independence and quality of life.1,2 Importantly, these symptoms rarely occur in isolation, instead, they co-exist and interact, often reinforcing one another and contributing to progressive functional decline.
In MS, fatigue is reported by up to 80% of individuals and is consistently identified as one of the most disabling symptoms, affecting physical, cognitive, and psychosocial functioning.3 Fatigue has been consistently linked to psychological distress, sleep disturbances, pain and reduced physical activity, while anxiety and depression frequently co-occur and exacerbate functional limitations.4 Similarly, poor sleep quality has been associated with higher levels of fatigue and pain, suggesting the presence of interconnected symptom cycles rather than independent deficits.5
Similarly, in PD, non-motor symptoms, such as depression, anxiety, fatigue, pain, and sleep disturbance, are increasingly recognized as major contributors to disability, with an impact that may equal or exceed that of primary motor manifestations.6 Motor symptoms, such as freezing of gait have been associated with cognitive impairment, psychological distress, balance dysfunction, and decreased community participation, forming a multidimensional network of interacting motor and non-motor symptoms that reinforce one another.7,8
Recent PD literature has emphasized the tight coupling of motor, cognitive, psychological, and daily-function domains in this population: balance and cognitive decline co-evolve,9,10 anxiety is strongly linked to daily-function impairment,11 and psychiatric symptoms cluster with motor symptoms in network analyses of PD.11 This multidomain structure justifies modelling symptom interdependencies rather than pairwise associations and provides the conceptual foundation for the present comparative network approach.
Despite a substantial body of literature describing these symptoms, most of the existing studies rely on correlation-based or regression approaches that assume a predefined outcome of interest. While informative, such methods provide limited insight into symptom directionality, mutual influence, and the relative leverage of specific symptoms within the broader clinical picture. Consequently, rehabilitation and clinical decision-making often prioritize symptom severity rather than identifying upstream or central factors that may exert disproportionate downstream effects across multiple domains.
Although MS and PD differ in underlying pathophysiology, both conditions share a highly overlapping multidomain symptom profile, particularly across fatigue, psychological distress, sleep, and physical function. Comparing these conditions within a unified analytical framework allows identification of whether similar symptoms occupy equivalent structural roles within each network or exhibit disease-specific patterns of influence. This distinction is clinically important, as it may inform whether rehabilitation strategies should target common central mechanisms across conditions or be tailored to disease-specific network architecture.
Bayesian Network (BN) analysis offers a powerful alternative by identifying probabilistic dependencies that, under appropriate assumptions and with proper constraints based on domain knowledge, can suggest potential directional dependency structures. This approach enables identification of hub variables—nodes with multiple incoming or outgoing edges—that are associated with multiple outcomes, representing potential high-impact intervention targets. By revealing the conditional independence structure among variables, BN analysis can distinguish between direct effects (where one variable is conditionally associated with another) and indirect effects (where relationships are mediated through intermediate variables).12,13
Previous research has established that fatigue in MS involves complex interactions among physical function, psychological state, sleep quality, and disease characteristics.14 In PD, non-motor symptoms including fatigue, mood disorders, and sleep disturbances demonstrate intricate relationships that vary across disease stages.15 However, few studies have systematically compared the network architectures between these conditions or employed methods capable of suggesting directional relationships.16,17
Therefore, the study aims to: (1) estimate Bayesian Network structures representing directional dependency structures among disease characteristics, physical function, psychological measures, sleep quality, fatigue, and pain in MS and PD populations; (2) quantify the strength of identified relationships; and (3) compare directional dependency architectures between populations to inform disease-specific rehabilitation strategies.
Methods
Study Design
This was a cross-sectional observational study analyzing data from two independent cohorts: individuals with Multiple Sclerosis (MS) and individuals with Parkinson’s Disease (PD). Bayesian Network analysis was employed to identify and characterize relationships among clinical, psychological, and functional variables in each population. The study adhered to ethical guidelines for observational research and received appropriate institutional approval.
Participants
Multiple Sclerosis Cohort
Data were collected from 104 individuals diagnosed with MS according to revised McDonald criteria. Participants were recruited from specialized MS clinics and rehabilitation centers. Inclusion criteria were: (1) confirmed MS diagnosis, (2) age ≥18 years, (3) ability to provide informed consent, and (4) ability to complete assessments in the study language. Exclusion criteria included: (1) severe cognitive impairment preventing reliable self-report, (2) concurrent neurological conditions other than MS, and (3) acute MS relapse within the past 30 days.
Parkinson’s Disease Cohort: Data were obtained from 54 individuals with idiopathic PD diagnosed according to UK Brain Bank criteria. Participants were recruited from movement disorder clinics. Inclusion criteria were: (1) confirmed idiopathic PD diagnosis, (2) age ≥18 years, (3) ability to provide informed consent, and (4) ability to complete assessments. Exclusion criteria included: (1) atypical parkinsonism or secondary parkinsonism, (2) severe cognitive impairment (based on clinical assessment), and (3) concurrent neurological conditions. This study was conducted in accordance with the principles of the Declaration of Helsinki. Ethical approval was obtained from the Institutional Review Board of the Jordan University of Science and Technology (Approvals No. AA-2022/312-AA- 2021/654), and all participants provided written informed consent prior to participation.
Outcome Measures
All participants underwent comprehensive assessment including demographic information, disease characteristics, and standardized outcome measures across multiple domains.
Demographics and Disease Characteristics
- Age (years) and Body Mass Index (BMI; kg/m2)
- Disease Duration: Time since first symptom onset and time since formal diagnosis (years)
- MS-specific: Expanded Disability Status Scale (EDSS, range 0–10), a clinician-rated measure of neurological disability where higher scores indicate greater disability. EDSS showed moderate to good inter-rater reliability (varies by score level), valid measure of neurological disability in MS.18
- MS and PD Cohorts: Montreal Cognitive Assessment (MoCA, range 0–30, higher scores indicate better cognitive function) with Excellent test–retest reliability (ICC ≈ 0.92) and Good internal consistency (Cronbach’s α ≈ 0.83). The test has high sensitivity for detecting mild cognitive impairment (90% sensitivity) and good construct validity vs MMSE and neuropsychological testing19 and Berg Balance Scale (BBS, range 0–56, higher scores indicate better balance) with excellent reliability of inter-rater (ICC ≈ 0.98) and strong validity for assessing balance and predicting fall risk.20
Physical Function
- Six-Minute Walk Test (6MWT): Standardized assessment of walking endurance measured as distance covered in meters over 6 minutes; higher values indicate better ambulatory capacity. Excellent test–retest reliability and good construct validity for MS21 and PD.22
- Berg Balance Scale (BBS): 14-item assessment of functional balance during daily activities; scores range from 0–56 with higher scores indicating better balance.20
Psychological Measures
- Hospital Anxiety and Depression Scale (HADS): Self-report questionnaire with separate anxiety and depression subscales (each 0–21); higher scores indicate greater symptom severity. Subscales demonstrate good internal consistency (α ≈ 0.80–0.93) and good test–retest reliability and good construct validity for anxiety and depression screening and clear separation of anxiety and depression factors.23
Fatigue
- Modified Fatigue Impact Scale (MFIS): Multidimensional assessment of fatigue impact across physical (9 items), cognitive (10 items), and psychosocial (2 items) domains. Items are scored 0–4, yielding subscale and total scores. Higher scores indicate greater fatigue impact. The MFIS is well-validated in MS and has been applied to PD populations.24
Sleep Quality
- Pittsburgh Sleep Quality Index (PSQI): Self-report questionnaire assessing sleep quality over the past month across seven components. Total scores range from 0 to 21 with higher scores indicating worse sleep quality. Scores >5 suggest clinically significant sleep disturbance. Good internal consistency (Cronbach’s α ≈ 0.83) and good test–retest reliability as well as good construct validity.25
Pain
- Brief Pain Inventory (BPI): Assessment of pain severity (4 items rated 0–10 on numeric rating scales) and pain interference with daily activities (7 items, 0–10 scales). Domain scores are calculated as means of constituent items, with higher scores indicating greater pain severity or interference. High internal consistency (Cronbach’s α ≈ 0.85–0.95) and good test–retest reliability as well as strong construct validity.26
Physical Activity
- International Physical Activity Questionnaire (IPAQ): Self-report of physical activity across multiple domains over the past 7 days. Scoring produces estimated metabolic equivalent (MET) minutes per week, with higher values indicating greater physical activity. Good test–retest reliability and acceptable validity.27
- Incidental and Planned Exercise Questionnaire (IPEQ): Self-report measure distinguishing between incidental physical activity and planned exercise behavior. Higher scores indicate more exercise/activity. Good–excellent test–retest reliability and good validity.28
Missing Data Handling
For each cohort, we calculated the percentage of missing data for each variable:
- Variables with ≥20% missing data were excluded from analysis to maintain data quality. In the PD cohort, the three MFIS fatigue subscales (Physical Fatigue, Cognitive Fatigue, and Psychosocial Fatigue) were not included in the network model because these variables were not administered to PD participants in the original data collection protocol; consequently, all three MFIS items were fully missing for the PD sample and could not be imputed from the available data. The remaining PD variables met the ≤20% missingness threshold and were retained.
- Variables with <20% missing data underwent multiple imputations.
- Variables with no missing data were retained as observed.
Multiple Imputation Procedure
Missing data were handled using Multiple Imputation by Chained Equations (MICE) implemented in the R mice package:
- Method: Predictive means matching (PMM), which imputes missing values by sampling from observed values of similar cases, preserving the original distribution.
- Number of imputations: 5 imputed datasets.
- Iterations: 10 iterations per imputation.
- Imputation model: All variables in the dataset were included as predictors in the imputation model.
- Analysis approach: Bayesian Network structure learning requires a single graph; pooling DAGs across imputations is not a standard operation (unlike pooling regression coefficients). We therefore followed the common practice of learning the structure on the first completed dataset and then validating edge stability via bootstrap. As a robustness check, we re-learned the network on each of the remaining four imputed datasets and verified that the structural core (the 21 bootstrap-stable edges in MS and the 14 stable edges in PD) was recovered in at least four of the five imputations. Full regression quantification on the primary imputed dataset is reported in the results section; imputation-specific edge agreement is reported in Supplementary Figure 1.
The quality of imputation was assessed by comparing density distributions of variables before and after imputation to ensure that imputation preserved the original data distribution without introducing artifacts. Density plots of each imputed variable are provided in Supplementary Figure 1 (MS cohort only). No imputation was required for the PD cohort, which had complete data for all included variables (mice imputation method = “” for all variables, confirming zero missingness); density plots are therefore not shown for PD.
Bayesian Network Analysis
Bayesian Networks are probabilistic graphical models that represent conditional dependencies among variables as directed acyclic graphs (DAGs). In a BN, nodes represent variables and directed edges represent probabilistic dependencies. The absence of an edge between two nodes indicates conditional independence given the other variables in the network.
Network Structure Learning
Network structures were learned using the Hill-Climbing (HC) algorithm with Bayesian Information Criterion (BIC) scoring:
- Algorithm: Hill-Climbing with random restarts to reduce risk of local optima.
- Scoring function: BIC, which balances model fit against complexity, penalizing overly complex networks.
- Constraints: Blacklist constraints were applied to prevent biologically implausible edges: - No variables could cause age or BMI (fixed demographic characteristics) - Temporal precedence: Duration since diagnosis could not cause duration since symptom onset - The blacklist prohibited edges from affective (HADS), fatigue (MFIS), sleep (PSQI), pain (BPI), cognitive (MoCA), and physical-activity (IPAQ/IPEQ) variables into EDSS and into disease-duration variables. Edges from clinician-rated motor measures (6MWT, BBS) into EDSS were permitted a priori, since these are established correlates of neurological disability.22 A sensitivity analysis constraining BBS → EDSS as well produced a qualitatively similar network (Supplementary Figure 6).
Bootstrap Stability Assessment
To assess the reliability of identified edges, we performed bootstrap stability analysis:
- Procedure: 500 bootstrap resamples with replacement from the original data. The number of resamples was increased relative to our initial submission (100 → 500) to address the reviewers’ concern about stability of edge-inclusion probabilities under small samples.
- Network estimation: BN structure was re-learned on each bootstrap sample using identical procedures.
- Stability metric: Edge strength was calculated as the proportion of bootstrap samples in which each edge appeared.
- Threshold: Edges appearing in ≥50% of bootstrap samples were considered stable.
Regression Quantification
For each edge identified in the final BN structure, we fit linear regression models to quantify the relationship strength:
- Model specification: Each outcome variable was regressed on all of its parent nodes (direct predictors) in the network.
- Parameters estimated: standardized regression coefficients (β) computed on z-standardized variables, standard errors (SE), t-statistics, p-values, and adjusted R2. Standardization was adopted in this revision so that β values are directly comparable across predictors measured on different scales (eg., IPAQ MET-min/week vs HADS 0–21). This addresses the difficulty of interpreting raw coefficients such as the original β ≈ 255 for anxiety → IPAQ and β ≈ −123 for age → IPAQ.
- Interpretation: Regression coefficients indicate the magnitude and direction of relationships, conditional on other parents in the network.
- Software Implementation: All analyses were conducted in R (version 4.5.2). Bayesian Network structure learning and manipulation were performed using the bnlearn package. To ensure reproducibility, a fixed random seed was used (set.seed(42)). The Hill-Climbing algorithm was implemented with 10 random restarts (each consisting of 100 perturbations) to reduce the risk of convergence to local optima.
Missing data were handled using multiple imputations via the mice package. Regression modeling and statistical inference were conducted using base R functions, and data manipulation was performed using the tidyverse suite of packages.
Full R code and session information are provided in the Supplementary Material.
Statistical Analysis and Reporting
Descriptive statistics were calculated for all variables in each cohort, including means, standard deviations, ranges, and missing data percentages. Network characteristics (number of nodes, edges, average degree) were compared between MS and PD cohorts. For regression models, statistical significance was assessed at α=0.05, with significance stars indicating p<0.05 (*), p<0.01 (**), and p<0.001 (***).
For the MS cohort (n=104), the sample size provided adequate power for network estimation based on general guidelines suggesting at least 5–10 observations per network parameter. The PD cohort (n=54) was smaller relative to network complexity, and results should be interpreted as exploratory and hypothesis-generating. We calculated observations per edge as a simple metric of network parsimony and power, with higher values indicating better support for estimated relationships.
Results
Participant Characteristics and Descriptive Statistics
Multiple Sclerosis Cohort
Descriptive characteristics of the MS cohort are presented in Table 1.
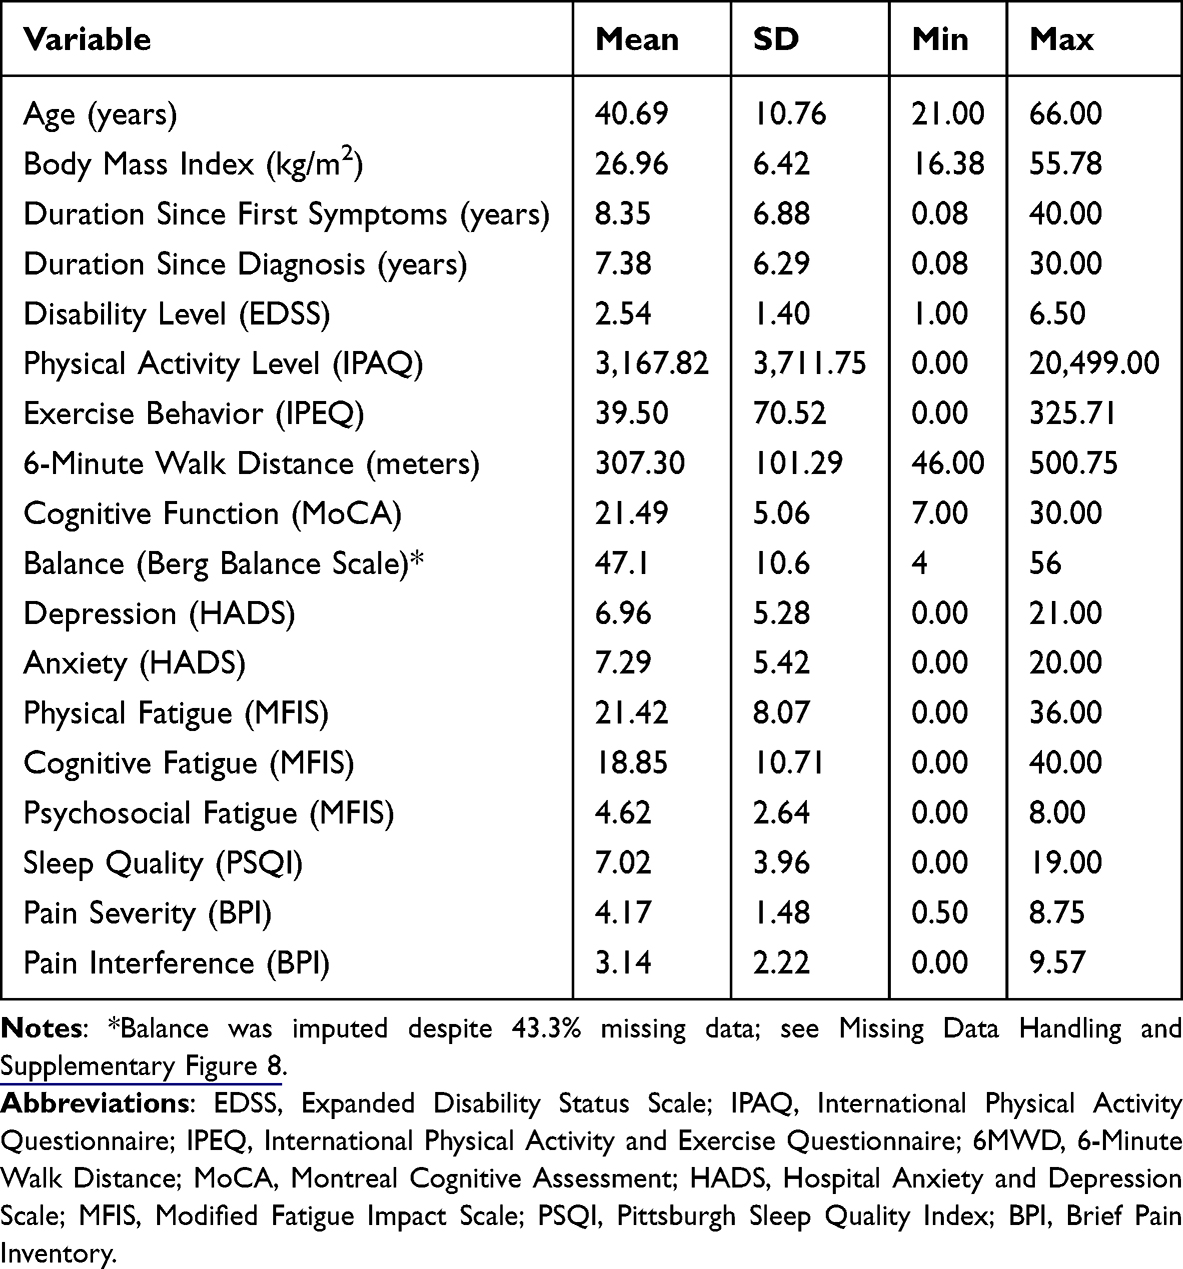 |
Table 1 Descriptive Statistics for Multiple Sclerosis Cohort (N = 104) |
The MS cohort (N=104) had a mean age of 40.7 years (SD=10.8). Mean disease duration since first symptoms was 8.4 years. The sample demonstrated moderate disability levels (mean EDSS=2.5, SD=1.4). Psychological symptoms were common, with mean anxiety scores of 7.3 and depression scores of 7 on the HADS. Fatigue impact was substantial across all dimensions, with mean total MFIS score of 44.9.
Parkinson’s Disease Cohort
Descriptive characteristics of the PD cohort are presented in Table 2.
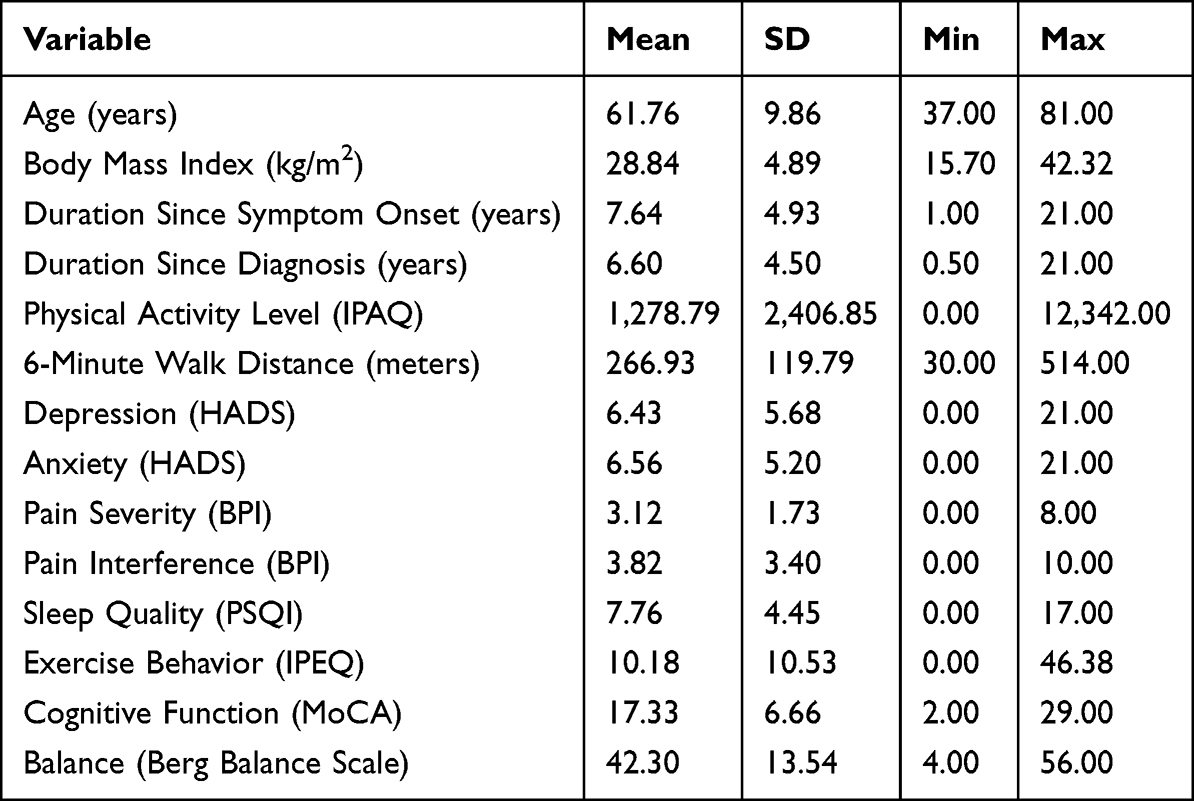 |
Table 2 Descriptive Statistics for Parkinson’s Disease Cohort (N = 54) |
The PD cohort (N=54) had a mean age of 61.8 years (SD=9.9), slightly older than the MS cohort. Mean disease duration since symptom onset was 7.6 years. Cognitive function as assessed by MoCA showed a mean of 17.3. Balance scores (BBS) averaged 42.3. Psychological symptoms were present, with mean anxiety scores of 6.6 and depression scores of 6.4. Total fatigue scores averaged 45.4.
Missing Data Analysis
Multiple Sclerosis
The pattern of missing data in the MS cohort is summarized in Table 3.
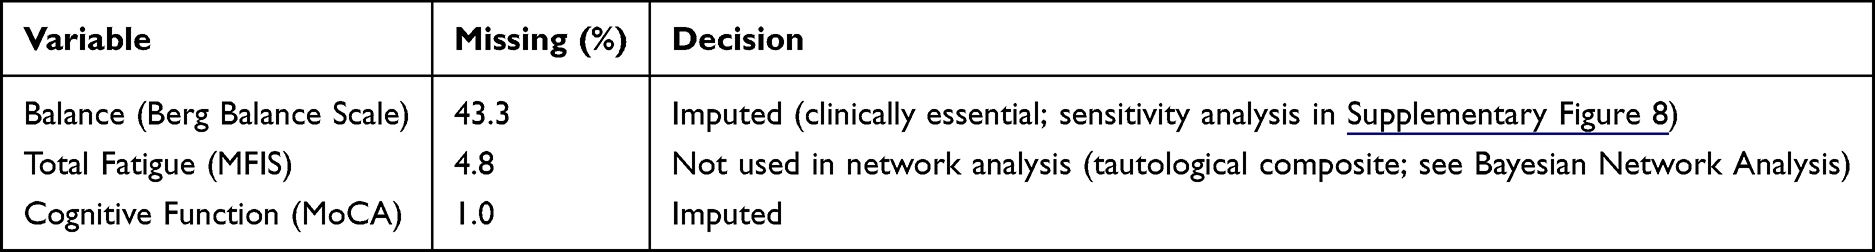 |
Table 3 Missing Data Summary for MS Cohort |
Balance (Berg Balance Scale) had 43.3% missing data. Because of its clinical importance to neurological rehabilitation research and because it emerged as a structurally important node in preliminary analyses, it was retained and imputed under the MICE framework; a sensitivity analysis excluding Balance is reported in Supplementary Figure 8. Variables imputed with <20% missing were Cognitive Function (MoCA, 1.0%) and Physical Fatigue subscales where needed. All 104 participants were retained in the analysis.
Parkinson’s Disease
No missing data was observed in the PD cohort; therefore, no missing data summary table was required. Multiple imputation recovered 0 participants for analysis (from 54 complete cases to 54 total cases).
Bayesian Network Structure: Multiple Sclerosis
The estimated Bayesian Network for the MS cohort contained 18 nodes and 27 directed edges (Figure 1). With 104 participants, this yielded 3.9 observations per edge. Bootstrap stability analysis (500 resamples) revealed that 21 edges (77.8%) appeared in at least 50% of bootstrap resamples. Full bootstrap edge-frequency distributions are provided in Supplementary Figures 2 (MS cohort) and 3 (PD cohort).
 |
Figure 1 Bayesian Network for Multiple Sclerosis. Note: (n = 104, 18 nodes, 27 edges, 77.8% bootstrap-stable). Arrows represent the direction of probabilistic dependence between z-standardised variables estimated using the Hill-Climbing algorithm (BIC-G scoring, 500 bootstrap resamples). Node colours denote clinical domains: demographics (grey), disease characteristics (light grey), disability/physical function (amber), cognition (purple), physical activity (green), psychological factors (blue), fatigue (red), sleep quality (teal), pain (violet). All β coefficients are standardised. *p < 0.05, **p < 0.01, ***p < 0.001. |
Network Architecture
The MS network exhibited a layered structure. Duration since first symptoms acted as a root node feeding Duration Since Diagnosis and Balance. Age influenced only Cognition (MoCA). Balance and Cognition jointly fed into Anxiety and Disability (EDSS). Duration Since Diagnosis fed forward into Cognition, Physical Fatigue, and Pain Interference.
Several key hub variables emerged:
Anxiety as a central hub: Anxiety demonstrated the highest out-degree (4 edges), directly influencing: Physical activity level (IPAQ), Physical fatigue, Sleep quality, Pain severity. In the new structure, Anxiety itself was predicted by three upstream variables: Depression (β = 0.57, p < 0.001), Balance (β = 0.28, p = 0.001), and Cognition (β = −0.19, p = 0.02). The EDSS → Anxiety edge present in our earlier analysis did not survive standardization.
- Physical activity level (IPAQ)
- Physical fatigue
- Sleep quality
- Pain severity
Pain interference as a mediator: Pain interference showed both high in-degree (4 incoming edges) and out-degree (3 outgoing edges), receiving inputs from:
- Duration since diagnosis
- 6-minute walk distance
- Depression
- Sleep quality
And predicting: Physical fatigue – Cognitive fatigue – Pain severity
Fatigue cascades: Physical Fatigue acted as a hub within the fatigue domain, directly predicting Cognitive Fatigue (β = 0.59, p < 0.001) and Psychosocial Fatigue (β = 0.50, p < 0.001). Total Fatigue was not included as a network node in the final analysis because, as an exact linear combination of its three subscales, it produced tautological edges with R2 ≈ 1.0 in pilot models and contributed no additional structural information.
Regression Models: Multiple Sclerosis
Regression models corresponding to the MS Bayesian Network are presented in Table 4.
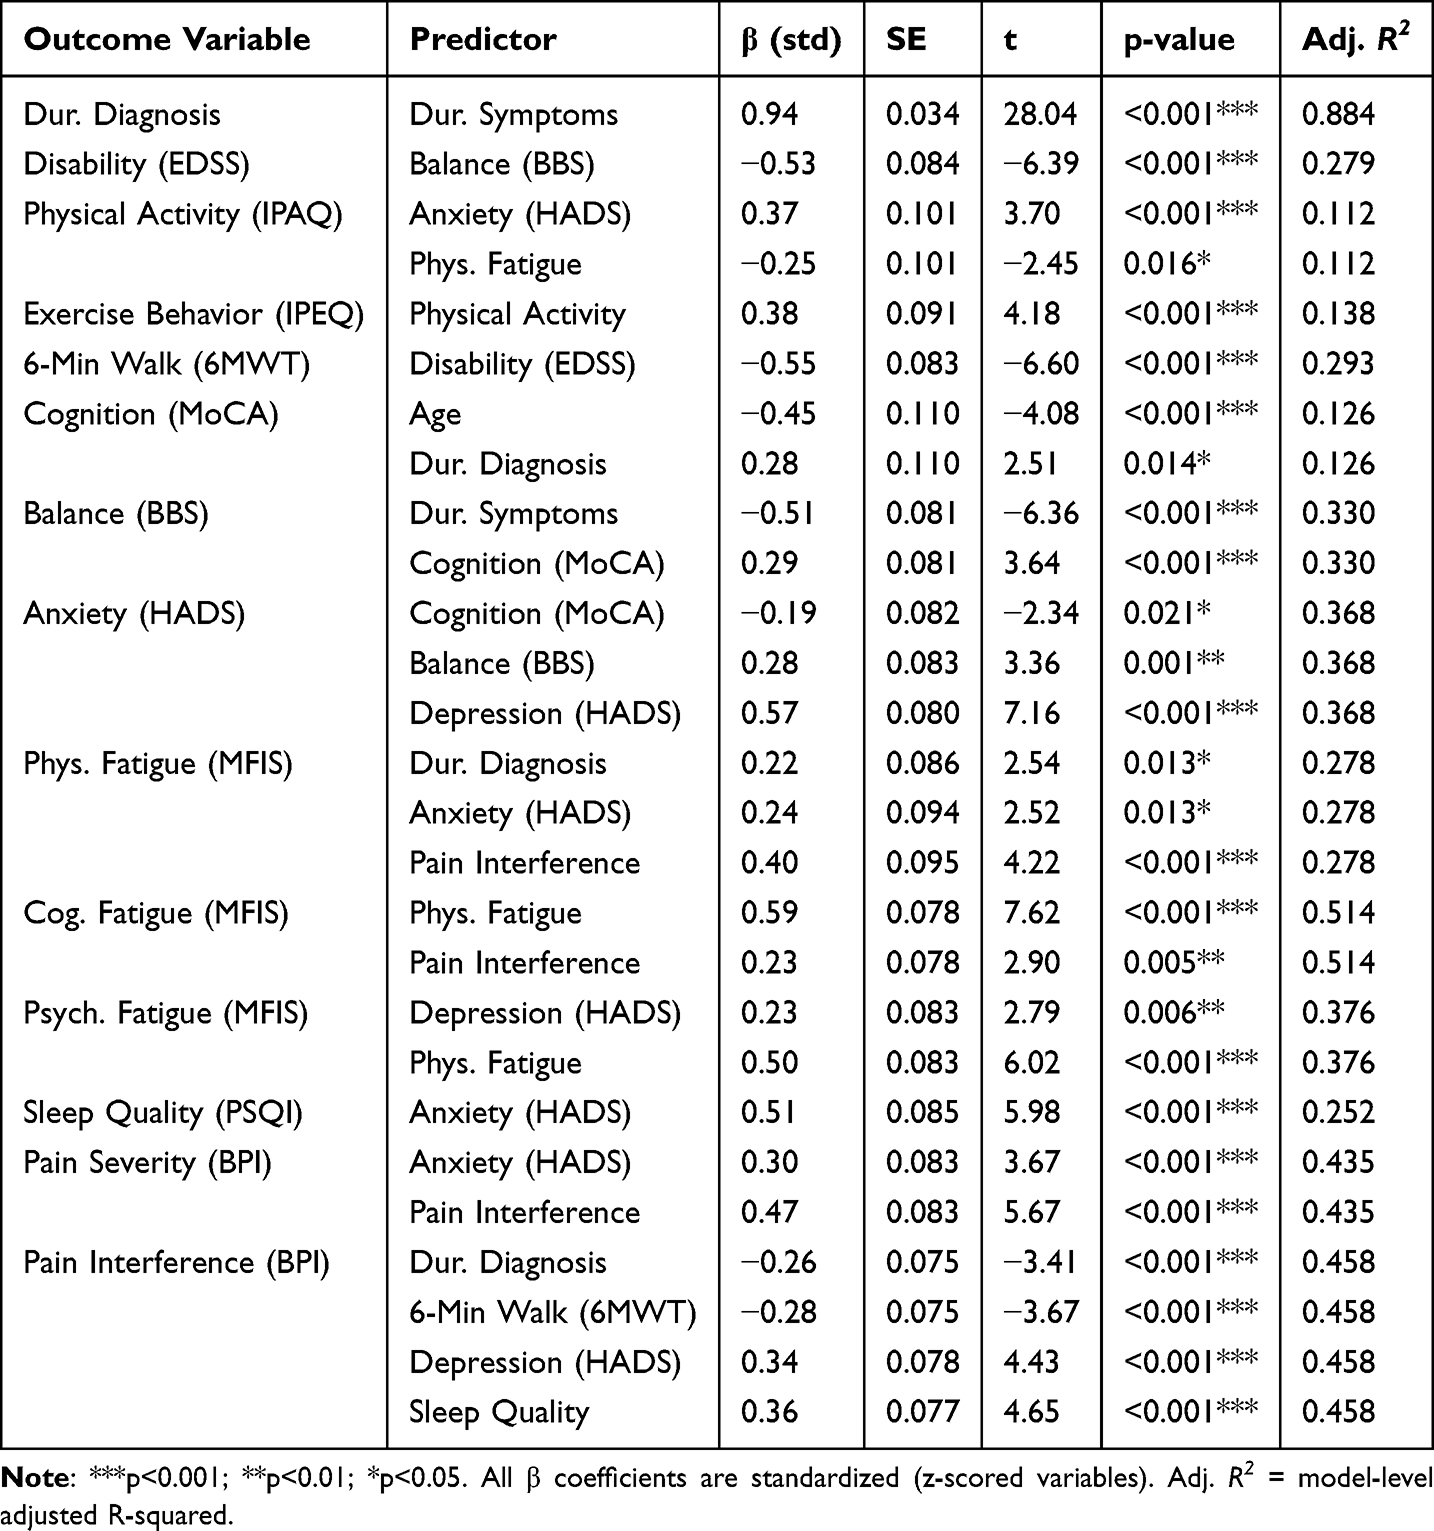 |
Table 4 Regression Models from MS Bayesian Network (Standardized Coefficients) |
Key Findings from MS Regression Models
Temporal disease progression. Duration Since First Symptoms strongly predicted Duration Since Diagnosis (β = 0.94, p < 0.001), reflecting the expected lag between symptom onset and clinical confirmation. Duration Since Diagnosis fed forward into Cognition (β = 0.28, p = 0.014), Physical Fatigue (β = 0.22, p = 0.013), and Pain Interference (β = −0.26, p < 0.001). Unlike in our earlier analysis, neither Age nor Duration Since Diagnosis directly predicted EDSS in the re-learned network; disability was instead most closely linked to Balance (β = −0.53, p < 0.001), which we interpret as a proxy for clinically observable motor impairment (see Methodological Strengths and Limitations for the limitations of this directional interpretation).
Anxiety relationships. In the standardized solution, higher anxiety was associated with higher self-reported physical activity (β = 0.37, p < 0.001), while higher physical fatigue was associated with lower activity (β = −0.25, p = 0.016). The positive anxiety–activity association, which appeared biologically implausible in the original unstandardized solution, is a modest partial correlation once the scales are placed on comparable footing; we interpret it cautiously as a possible hyperarousal or coping pattern rather than a true activity increase, pending confirmation with accelerometry. Anxiety also predicted sleep quality (β = 0.51, p < 0.001), physical fatigue (β = 0.24, p = 0.013), and pain severity (β = 0.30, p < 0.001), consistent with its role as a network hub.
Pain Interference was predicted by four parents—Duration Since Diagnosis (β = −0.26, p < 0.001), 6-Minute Walk Distance (β = −0.28, p < 0.001), Depression (β = 0.34, p < 0.001) and Sleep Quality (β = 0.36, p < 0.001)—and in turn predicted Physical Fatigue (β = 0.40, p < 0.001) and Cognitive Fatigue (β = 0.23, p = 0.005), consistent with its role as a mediator between functional and symptomatic domains.
Fatigue relationships. Physical Fatigue strongly predicted Cognitive Fatigue (β = 0.59, p < 0.001, R2 = 0.514) and Psychosocial Fatigue (β = 0.50, p < 0.001). Total Fatigue was removed as it was an exact linear sum of its subscales (R2 = 1.000).
Bayesian Network Structure: Parkinson’s Disease
The estimated Bayesian Network for the PD cohort contained 14 nodes and 15 directed edges (Figure 2). With 54 participants this yielded 3.6 observations per edge. Bootstrap analysis (500 resamples) indicated that 14 of the 15 edges (93.3%) were stable at the ≥50% threshold, suggesting that the learned structure—while parsimonious—is internally robust for this sample.
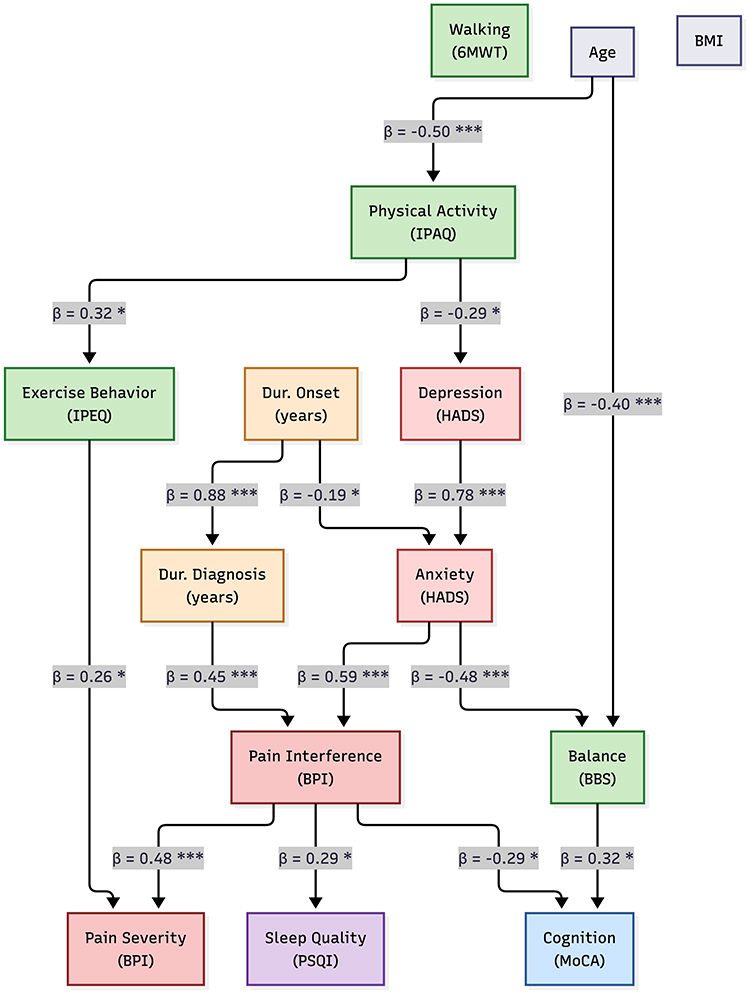 |
Figure 2 Bayesian Network for Parkinson’s Disease. Note: (n = 54, 14 nodes, 15 edges, 93.3% bootstrap-stable). Arrows represent the direction of probabilistic dependence between z-standardised variables. Same colour scheme as Figure 1. The PD network is more parsimonious than the MS network, partly reflecting the smaller sample size; results should be interpreted as hypothesis-generating. All β coefficients are standardised. *p < 0.05, ***p < 0.001. |
Important caveat: The lower sample size relative to network complexity means these results should be interpreted as exploratory and hypothesis-generating rather than definitive.
Network Architecture
The PD network was notably simpler than the MS network, with fewer nodes and edges, reflecting both the smaller sample size and potential differences in symptom structure:
Anxiety as a Central Hub
Similar to MS, Anxiety emerged as a critical hub variable. In the new PD network it had an out-degree of 2, directly predicting Pain Interference (β = 0.59, p < 0.001) and Balance (β = −0.48, p < 0.001). Anxiety itself was predicted by Depression (β = 0.78, p < 0.001) and, weakly and inversely, by Duration Since Symptom Onset (β = −0.19, p = 0.029). Fatigue is not represented in the PD network; see Missing Data Handling for the rationale.
Age Effects
Age directly predicted Physical Activity (β = −0.50, p < 0.001) and Balance (β = −0.40, p < 0.001); both are moderate negative partial correlations consistent with age-related motor and activity decline.
Physical Activity Cascade
Physical activity cascade: Physical Activity predicted Depression (β = −0.29, p = 0.032) and Exercise Behavior (β = 0.32, p = 0.020), consistent with prior exercise-intervention literature in PD.
Pain Pathway
Pain interference received inputs from anxiety, duration since diagnosis, and exercise behavior, and predicted both pain severity and cognitive function (negatively).
Regression Models: Parkinson’s Disease
Regression models corresponding to the PD Bayesian Network are presented in Table 5.
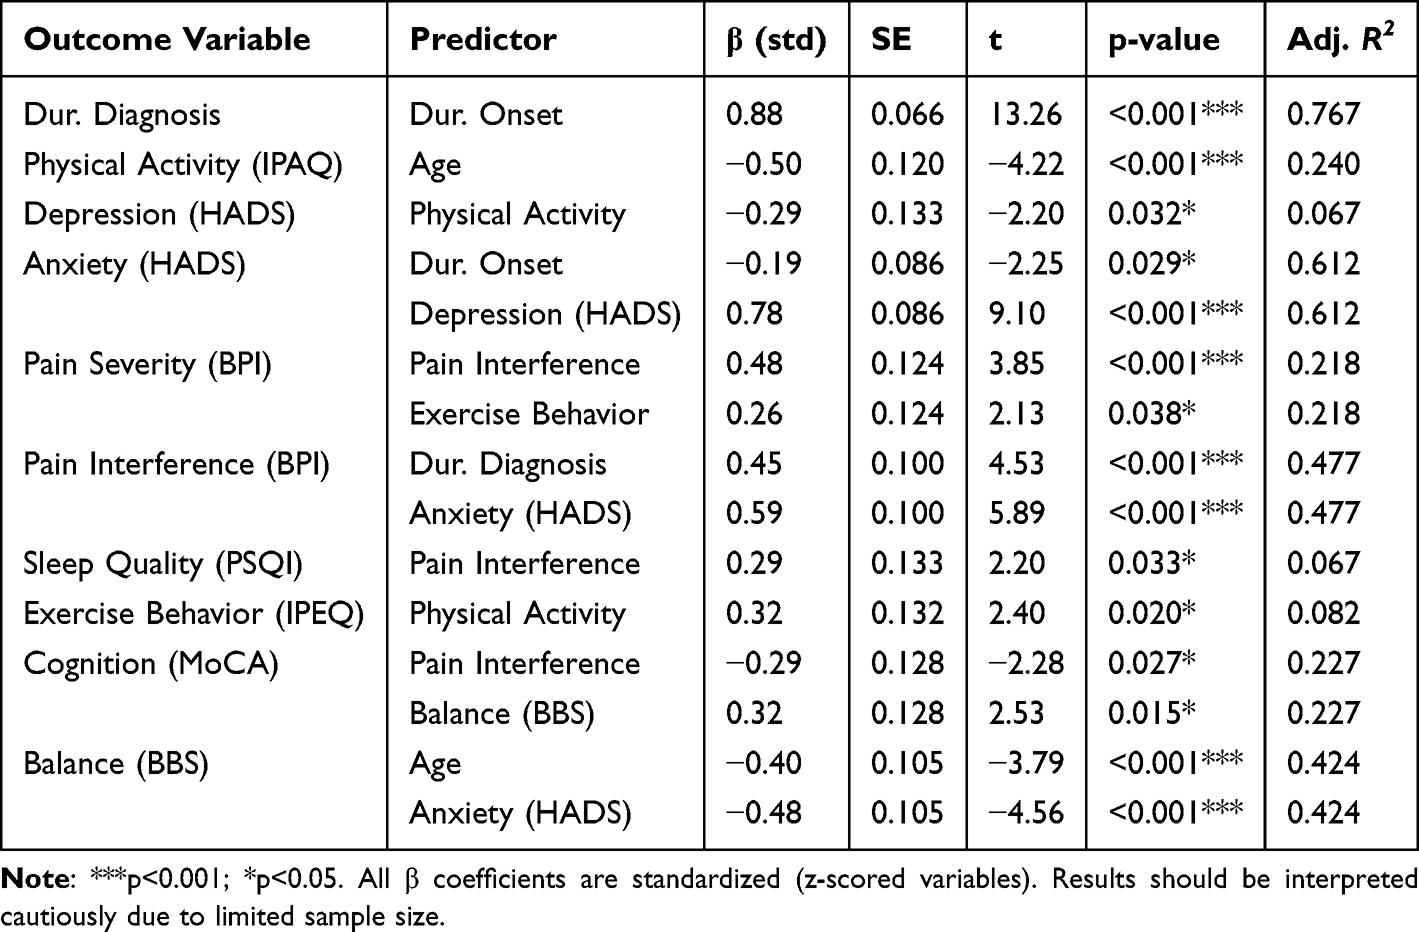 |
Table 5 Regression Models from PD Bayesian Network (Standardized Coefficients, Exploratory) |
Key Findings From PD Regression Models
Disease Duration Effects
Duration since symptom onset strongly predicted duration since diagnosis (β = 0.88, p < 0.001). Duration since diagnosis predicted Pain Interference (β = 0.45, p < 0.001). Duration since onset showed a modest negative relationship with Anxiety (β = −0.19, p = 0.029).
Anxiety Relationships
In the PD standardized solution, Anxiety predicted Pain Interference (β = 0.59, p < 0.001) and Balance (β = −0.48, p < 0.001). Fatigue was not retained in the PD network (see Missing Data Handling).
Age and Activity
Age demonstrated a moderate negative partial correlation with physical activity (β = −0.50, p < 0.001, R2 = 0.240) in PD. Physical activity predicted Depression (β = −0.29, p = 0.032) and Exercise Behavior (β = 0.32, p = 0.020).
Pain and Cognition
Pain interference negatively predicted Cognition (β = −0.29, p = 0.027, R2 = 0.227) and Balance showed a positive relationship with Cognition (β = 0.32, p = 0.015).
Network Comparison
A comparison of the main network characteristics between the MS and PD cohorts is shown in Table 6.
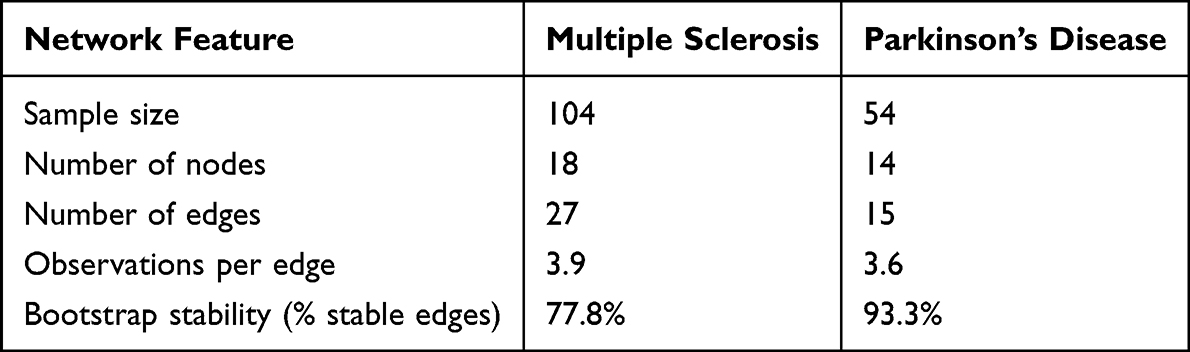 |
Table 6 Comparison of Key Network Features Between MS and PD Cohorts |
The MS network was more densely structured than the PD network, with 18 vs 14 nodes and 27 vs 15 edges; the gap is accentuated by the exclusion of fatigue variables from the PD model (§2.4). Observations per edge were comparable between cohorts (3.9 vs 3.6), although both values fall below the 5-per-parameter heuristic commonly cited for stable network estimation. Bootstrap stability was paradoxically higher in the PD network (93.3% vs 77.8%): the PD model retained only those edges that were strongly supported and relatively insensitive to resampling, consistent with a more conservative fit in a smaller, less dense graph. We interpret the cross-cohort comparison descriptively; no formal statistical test of network-level differences was conducted. Pairwise correlation matrices for both cohorts are provided in Supplementary Figures 4 (MS cohort) and 5 (PD cohort), which also flags variable pairs with r > 0.70 as candidates for cautious directional interpretation.
Discussion
This study utilized Bayesian Network analysis to identify and quantify directional relationships among clinical, psychological, and functional variables in people with Multiple Sclerosis (PwMS) and people with Parkinson’s Disease (PwPD). The findings revealed distinct disease-specific network architectures while identifying anxiety as a central hub variable in both conditions. These results have important implications for understanding symptom inter-relationships and designing targeted rehabilitation interventions.
Multiple Sclerosis: Network Structure and Clinical Implications
Anxiety as a Central Hub
The most significant finding in the MS network was anxiety emerging as a central hub, as it directly influenced physical activity, physical fatigue, sleep quality, and pain severity. This finding expands upon previous correlational research by suggesting that anxiety may function as an upstream correlator within the network rather than merely co-occurring with these symptoms.29,30 The strong predictive relationship between anxiety and sleep quality is consistent with well-established bidirectional relationships between anxiety and sleep disturbance in neurological populations.31 However, the Bayesian Network structure suggests that in MS, anxiety may be more likely to drive sleep problems than vice versa, pointing to anxiety management as a potentially effective intervention for improving sleep.
The positive anxiety → IPAQ association in the standardized solution (β = 0.37) is modest; we interpret it cautiously, as it may reflect hyperarousal-driven self-report rather than a true increase in activity. Objective measurement (eg., accelerometry) is recommended for future replication.32
The anxiety-physical fatigue pathway aligns with theoretical models proposing that anxiety exacerbates fatigue through multiple mechanisms including sleep disruption, cognitive load, and physiological arousal.33 This suggests that anxiety reduction interventions (eg., cognitive-behavioral therapy, mindfulness-based approaches) might yield secondary benefits for fatigue management hypothesis that could be tested in intervention studies.
Pain as a Complex Mediator
Pain interference emerged as a critical mediating variable with multiple inputs (duration since diagnosis, walking distance, depression, sleep quality) and multiple outputs (physical fatigue, cognitive fatigue, pain severity). This complex role suggests that pain interference functions as a central node through which various disease-related and psychological factors converge to influence fatigue. The finding that pain interference predicted both physical and cognitive fatigue domains (β=0.40 and β=0.23, respectively, both p < 0.01) indicates that pain’s impact extends beyond the physical realm to affect cognitive functioning, consistent with research on pain-related cognitive interference.34,35
The negative relationship between walking distance and pain interference (β = −0.28, p < 0.001) suggests a potential vicious cycle: reduced mobility may increase pain, which further limits activity.36 This finding supports early mobilization and maintenance of walking capacity as a pain management strategy in MS.37 The influence of sleep quality on pain interference (β = 0.36, p < 0.001) provides additional evidence for the importance of addressing sleep as part of comprehensive pain management.
Disease Duration and Disability Cascades
The re-learned MS network does not recover a clean age → duration → disability cascade. Duration Since First Symptoms Feeds Duration Since Diagnosis (β = 0.94), but the onset-to-diagnosis pathway is decoupled from EDSS in the current model: EDSS is instead predicted by Balance (β = −0.53). Because BBS is a clinician-rated motor index closely linked to neurological impairment, this is likely to reflect the fact that, in a cross-sectional sample, the clinical manifestation of balance dysfunction is concurrent with rather than downstream of disability. This directional interpretation should not be read as causal; it is a partial conditional association constrained by the Hill-Climbing search.
Importantly, duration since diagnosis extended beyond physical disability, directly predicting cognitive performance (MoCA: β = 0.224), anxiety (β = 0.280), and pain interference (β = −0.090). This suggests that disease chronicity exerts multidomain effects not fully mediated by disability status and may capture cumulative psychosocial burden and long-term adaptation processes. The positive association with anxiety supports evidence that uncertainty may persist across the disease course. In contrast, the inverse relationship with pain interference was unexpected and may reflect adaptive coping, improved long-term symptom management, or survivor bias.
Collectively, these findings challenge linear models of MS progression. Although disability increases over time, psychological and pain-related outcomes appear to follow more complex and partially independent trajectories, underscoring the need for individualized longitudinal monitoring rather than reliance on disease duration as a proxy for overall disease burden.
Fatigue Domain Relationships
The strong predictive relationships among fatigue domains validated the multidimensional MFIS structure while revealing that physical fatigue appears to be a primary driver of cognitive (β=0.784, p < 0.001) and psychosocial fatigue (β=0.164, p < 0.001). This suggests a cascade whereby physical fatigue manifests first and subsequently impacts cognitive and social functioning, a pattern consistent with clinical observations.3 Pain interference predicted both physical and cognitive fatigue, reinforcing its role as a mediator. These findings suggest that interventions targeting physical fatigue and pain might yield broader benefits across fatigue domains.
Parkinson’s Disease: Network Structure and Clinical Implications
Anxiety Hub with Different Architecture
In the new PD analysis, fatigue variables were not retained in the network (see Missing Data Handling), so the previously reported anxiety → total fatigue pathway cannot be replicated. Instead, Anxiety’s strongest direct effects in PD were on Pain Interference (β = 0.59) and Balance (β = −0.48). The inverse anxiety → Balance association raises the possibility that anxiety-related motor inhibition (freezing, fear of falling) may contribute to balance performance in PD—a hypothesis requiring anxiety-focused interventions with motor outcomes. The anxiety → pain interference pathway was present in both conditions, suggesting a common mechanism across neurological conditions.
Uniquely in PD, anxiety demonstrated a strong negative relationship with balance (β = −0.048, p < 0.001, R2=0.424). This finding may reflect anxiety-related muscle tension, fear of falling leading to altered gait patterns, or direct effects of anxiety on motor control. The clinical implication is that anxiety management might improve motor function, not just a psychological well-being hypothesis that could be tested through anxiety-focused interventions with motor outcomes.
This interpretation is consistent with recent PD literature showing that anxiety is clinically meaningful beyond psychological burden alone, with associations across functional outcomes, daily activity, and quality of life.38,39
Age and Activity Effects
Age effects: Age directly predicted Physical Activity (β = −0.50, p < 0.001) and Balance (β = −0.40, p < 0.001); both are moderate negative partial correlations consistent with age-related motor and activity decline.40
Pain–Cognition Relationship
The negative association between pain interference and cognitive function (β = −0.29, p = 0.027), observed uniquely in the PD network, aligns with growing evidence that chronic pain competes for attentional and executive resources. Experimental and neuroimaging studies demonstrate that persistent pain consumes cognitive capacity through sustained salience network activation and altered prefrontal–limbic connectivity, thereby impairing working memory, processing speed, and executive control. In Parkinson’s disease, this relationship may be amplified by dopaminergic dysfunction within frontostriatal circuits that subserve both pain modulation and cognitive performance. Additionally, pain-related sleep disturbance and fatigue may further mediate cognitive inefficiency. These findings suggest that pain management in PD may have implications beyond symptom relief, potentially contributing to cognitive preservation and functional independence.35,41–47
Network Simplicity and Sample Size Considerations
The PD network’s simpler structure compared to MS may partly reflect the smaller sample size (n = 54), which limits power to detect edges and may lead to a more parsimonious network. The observations per edge ratio was similar between conditions (MS: 3.7, PD: 3.6), but the absolute sample size was below generally recommended levels for reliable network estimation. Therefore, the PD network should be considered hypothesis-generating, requiring replication with larger samples. The lower bootstrap stability (69% vs 79%) further indicates greater uncertainty in the PD network structure.
Similarities and Differences Between MS and PD Networks
Both networks converged on anxiety as a central hub variable, reinforcing its role as a potential high-leverage intervention target across progressive neurological conditions. In both cohorts, anxiety directly influenced pain-related outcomes, supporting transdiagnostic models in which affective dysregulation amplifies somatic symptom burden. Duration since diagnosis also exerted direct effects on clinical outcomes in both MS and PD, reflecting progressive disease burden that extends beyond motor impairment.
Despite these shared elements, the network architecture diverged substantially. The MS network was more complex and densely interconnected, particularly within the fatigue domain, consistent with the multidimensional nature of MS-related fatigue. Pain interference functioned as a key mediator in MS, linking physical function to both physical and cognitive fatigue. In contrast, the PD network did not retain fatigue variables in the final structure, leaving Anxiety, Pain Interference, Age, and Balance as the dominant nodes. The cross-domain dispersion of symptoms observed in MS (fatigue, pain, sleep, anxiety all reciprocally linked) was therefore not directly paralleled in PD; anxiety–pain and age–motor pathways were instead more salient. Depression–anxiety coupling was also more explicitly represented in PD, suggesting tighter affective interdependence, whereas MS exhibited broader cross-domain symptom dispersion. Together, these findings indicate that although anxiety represents a shared central vulnerability, the downstream architecture of symptom interaction is disease-specific, underscoring the need for tailored rehabilitation strategies.
Methodological Strengths and Limitations
Strengths
This study employed rigorous methods for handling missing data through multiple imputations with appropriate diagnostics. Blacklist constraints were applied to prevent biologically implausible causal directions, particularly prohibiting outcomes from causing-age, BMI, or disease duration. Bootstrap stability analysis provided empirical evidence for edge reliability. Comprehensive regression quantification allowed assessment of relationship strengths beyond network structure. The parallel analysis in two distinct neurological conditions allowed examination of disease-specific vs. common patterns.
Limitations
Cross-Sectional Design
The most important limitation is the inability to definitively establish causality from cross-sectional data. Bayesian Networks identify conditional dependence structures that are consistent with causal interpretations under certain assumptions (eg., causal sufficiency, acyclicity), but alternative models may fit equally well. Longitudinal data would provide stronger evidence for directional relationships.
Sample Size
The PD cohort (n = 54) was underpowered for reliable network estimation, yielding an exploratory network that requires replication. Even the MS cohort (n = 104), while adequate, was at the lower end of recommended sample sizes for networks of this complexity.
Measurement Issues
Self-report measures are subject to recall bias and may be influenced by mood state. The apparently paradoxical anxiety-IPAQ relationship in MS suggests potential measurement artifacts. Objective measures (eg., accelerometry for activity, actigraphy for sleep) would strengthen future research.
Temporal Ambiguity
Even with blacklist constraints, some edges may represent bidirectional relationships where we could only estimate one direction. For example, the strong correlation between anxiety and depression (r>0.7) makes the directional interpretation uncertain despite the edge in the network.
Cross-Sectional Design and Conditional Dependency Versus Causality
The directional edges in Figures 1 and 2 represent the structure of conditional dependencies selected by Hill-Climbing with BIC under our blacklist, not causal claims. The Bayesian Network is Markov-equivalent to several DAGs that may fit the data equally well. Longitudinal or interventional designs are required to distinguish among these, and our use of verbs such as “influences,” “predicts,” or “drives” should be read in the probabilistic (conditional) sense throughout. We have avoided stronger causal language in this revision.
Blacklist Specification
Our blacklist prevents psychological, fatigue, pain, and sleep variables from being direct parents of EDSS or disease duration but permits edges from clinician-rated motor measures (6MWT, BBS) into EDSS. This choice reflects the close clinical coupling between motor impairment and overall disability, but readers should interpret the Balance → EDSS edge as a conditional association rather than a causal effect. A sensitivity analysis with a maximally restrictive blacklist (BBS → EDSS also forbidden) is reported in Supplementary Figure 7.
Across the three sensitivity analyses, the substantive findings of the main MS network were preserved. When BBS → EDSS was forbidden (Supplementary Figure 6), the algorithm reversed the edge to EDSS → Balance and recruited Duration since first symptoms as a direct parent of EDSS, leaving the depression–anxiety–pain triangle, the fatigue cluster and the IPAQ–IPEQ coupling unchanged (net change: +3 edges relative to the main 26-edge network). When both BBS → EDSS and 6MWT → EDSS were forbidden simultaneously (Supplementary Figure 7), the network differed from Supplementary Figure 6 by only two edges, indicating that the disability sub-network is robust to whether one or both motor → EDSS edges are permitted a priori (net change: +2 edges). When Balance was removed entirely from the variable set (Supplementary Figure 8), all four BBS-related edges naturally dropped out and the algorithm replaced them with a direct Duration since diagnosis → EDSS edge and a Duration since first symptoms → MoCA edge—both biologically plausible associations—yielding a slightly more parsimonious 25-edge network. Detailed lists of the edges that appear or disappear under each constraint are provided in the supplementary file sensitivity_edge_differences.txt.
Single Imputed Dataset for Structure Learning
Bayesian Network structure learning does not admit the standard Rubin-style pooling of parameters across imputations. We mitigated this by re-learning the structure on each of the five imputed datasets as a robustness check; the core stable edges reported in Figure 1 and Table 4 were recovered in at least four of five imputations (Supplementary Figure 1). We nonetheless acknowledge that uncertainty attributable to imputation is only partially characterized.
Generalizability
Both samples were convenience samples from specialized clinics. Results may not generalize to community-dwelling individuals with MS/PD or those with milder/more severe disease. The MS cohort’s mean EDSS (~2.5) suggests moderate disability; networks might differ in those with minimal or severe disability.
Conclusions
Bayesian Network analysis revealed distinct disease-specific architectures in Multiple Sclerosis and Parkinson’s Disease while identifying anxiety as a central hub in both conditions. In MS, anxiety emerged as an upstream correlate of sleep problems, pain, and fatigue, while pain interference served as a critical mediator connecting physical function to cognitive and physical fatigue. In PD, anxiety showed strong effects on fatigue and motor function (balance), while age directly impacted activity levels more prominently than in MS.
These findings suggest that anxiety management represents a high-impact intervention target that may yield benefits across multiple symptom domains in both conditions, though through different mechanistic pathways. Pain management appears particularly important in MS given its mediating role. The identified network structures can inform personalized, targeted rehabilitation approaches that prioritize hub variables to maximize therapeutic impact across interconnected symptom domains.
The PD network should be considered exploratory given sample size limitations and requires replication with larger cohorts. Future research should employ longitudinal designs to strengthen causal inference and test intervention effects across network pathways. Despite limitations, this study demonstrates the value of Bayesian Network analysis for understanding complex symptom relationships in neurological conditions and identifying strategic intervention targets.
Data Sharing Statement
Data supporting the findings of this study are available from the corresponding author upon reasonable request.
Funding
The authors received no financial support for the research, authorship, or publication of this article.
Disclosure
The authors report no conflicts of interest in this work.
References
1. Gonaboyina DS, Das P, Pradhan N, et al. Exploring the manifestation of non-motor symptoms in Parkinson’s disease in a tertiary care center: a comprehensive analysis. Cureus. 2025;17(7):e87633. doi:10.7759/cureus.87633
2. Sparasci D, Gobbi C, Castelnovo A, et al. Fatigue, sleepiness and depression in multiple sclerosis: defining the overlaps for a better phenotyping. J Neurol. 2022;269(9):4961. doi:10.1007/s00415-022-11143-6
3. Oliva Ramirez A, Keenan A, Kalau O, et al. Prevalence and burden of multiple sclerosis-related fatigue: a systematic literature review. BMC Neurol. 2021;21. doi:10.1186/S12883-021-02396-1
4. Boutitah-Benyaich I, Eixarch H, Villacieros-álvarez J, et al. Multiple sclerosis: molecular pathogenesis and therapeutic intervention. Signal Transduction Targeted Therapy. 2025;10(1):324. doi:10.1038/s41392-025-02415-4
5. Young CA, Langdon D, Rog D, et al. Prevalence, treatment and correlates of depression in multiple sclerosis. Mult Scler Relat Disord. 2024;87:105648. doi:10.1016/j.msard.2024.105648
6. Kumaresan M, Khan S. Spectrum of non-motor symptoms in Parkinson’s disease. Cureus. 2021;13(2):e13275. doi:10.7759/cureus.13275
7. Kouli A, Torsney KM, Kuan WL. Parkinson’s disease: etiology, neuropathology, and pathogenesis. Parkinson’s Diseas. 2018;3–19.
8. Prajjwal P, Flores Sanga HS, Acharya K, et al. Parkinson’s disease updates: addressing the pathophysiology, risk factors, genetics, diagnosis, along with the medical and surgical treatment. Ann Med Surg. 2023;85(10):4887. doi:10.1097/MS9.0000000000001142
9. Monaghan AS, Gordon E, Graham L, et al. Cognition and freezing of gait in Parkinson’s disease: a systematic review and meta-analysis. Neurosci Biobehav Rev. 2023;147:105068. doi:10.1016/j.neubiorev.2023.105068
10. Barbosa AF, Chen J, Freitag F, et al. Gait, posture and cognition in Parkinson’s disease. Dement Neuropsychol. 2016;10(4):280–286. doi:10.1590/s1980-5764-2016dn1004005
11. Chen Y-R, Tan C-H, Su H-C, et al. Investigating the interaction between neuropsychiatry features and daily activities on social function in patients with Parkinson’s disease with mild cognitive impairment. BJPsych Open. 2022;8(6):e205. doi:10.1192/bjo.2022.611
12. Pearl J. From Bayesian networks to causal networks. Mathematical Models Handling Partial Knowledge Artificial Intelligence. 1995;157–182.
13. Johnson S. A review on causal inference models combining Bayesian networks with deep learning in environmental health research. J Informat Syste Engine Manage. 2025;10(2):147–154. doi:10.52783/jisem.v10i2.1465
14. Chitnis T, Vandercappellen J, King M, et al. Symptom interconnectivity in multiple sclerosis: a narrative review of potential underlying biological disease processes. Neurol Therapy. 2022;11(3):1043–1070. doi:10.1007/s40120-022-00368-2
15. Bojtos L, Rodríguez-Antigüedad J, Pagonabarraga J, et al. Fatigue and neuropsychiatric symptoms in Parkinson’s disease: a narrative review. Front Neurol. 2025;16:1670644. doi:10.3389/fneur.2025.1670644
16. Deng Q, Duan Y, Yang Z, et al. Symptom networks and associations with quality of life in patients with early to mid-stage Parkinson’s disease: a network analysis. Degener Neurol Neuromuscul Dis. 2025;15:101. doi:10.2147/DNND.S535306
17. Chang Y-T, Kearns PKA, Carson A, et al. Network analysis characterizes key associations between subjective fatigue and specific depressive symptoms in early relapsing-remitting multiple sclerosis. Mult Scler Relat Disord. 2023;69:104429. doi:10.1016/j.msard.2022.104429
18. Kurtzke JF. Rating neurologic impairment in multiple sclerosis: an expanded disability status scale (EDSS). Neurology. 1983;33(11):1444–1452. doi:10.1212/WNL.33.11.1444
19. Nasreddine ZS, Phillips NA, Bédirian V, et al. The montreal cognitive assessment, MoCA: a brief screening tool for mild cognitive impairment. J Am Geriatr Soc. 2005;53(4):695–699. doi:10.1111/j.1532-5415.2005.53221.x
20. Berg KO, Wood-Dauphinee SL, Williams JI, et al. Measuring balance in the elderly: validation of an instrument. Can J Public Health. 1992;83(Suppl 2):S7–11.
21. Goldman MD, Marrie RA, Cohen JA. Evaluation of the six-minute walk in multiple sclerosis subjects and healthy controls. Mult Scler. 2008;14(3):383–390. doi:10.1177/1352458507082607
22. Steffen T, Seney M. Test-retest reliability and minimal detectable change on balance and ambulation tests, the 36-item short-form health survey, and the unified Parkinson disease rating scale in people with parkinsonism. Phys Ther. 2008;88(6):733–746. doi:10.2522/ptj.20070214
23. Zigmond AS, Snaith RP. The Hospital Anxiety and Depression Scale. Acta Psychiatr Scand. 1983;67(6):361–370. doi:10.1111/j.1600-0447.1983.tb09716.x
24. Kos D, Kerckhofs E, Carrea I, et al. Evaluation of the modified fatigue impact scale in four different European countries. Mult Scler. 2005;11(1):76–80. doi:10.1191/1352458505ms1117oa
25. Buysse DJ, Reynolds CF, Monk TH, et al. The Pittsburgh sleep quality index: a new instrument for psychiatric practice and research [Índice de calidad del sueño de Pittsburgh: un nuevo instrumento para la práctica y la investigación psiquiátrica]. Psychiatry Res. 1989;28(2):193–213. doi:10.1016/0165-1781(89)90047-4
26. Cleeland CS, Ryan KM. Pain assessment: global use of the brief pain inventory. Ann Acad Med Singap. 1994;23(2):129–138.
27. Craig CL, Marshall AL, Sjöström M, et al. International physical activity questionnaire: 12-country reliability and validity. Med Sci Sports Exerc. 2003;35(8):1381–1395. doi:10.1249/01.MSS.0000078924.61453.FB
28. Delbaere K, Hauer K, Lord SR. Evaluation of the incidental and planned activity questionnaire for older people. Br J Sports Med. 2010;44(14):1029–1034. doi:10.1136/bjsm.2009.060350
29. Hanna M, Strober LB. Anxiety and depression in multiple sclerosis (MS): antecedents, consequences, and differential impact on well-being and quality of life. Mult Scler Relat Disord. 2020;44:102261. doi:10.1016/j.msard.2020.102261
30. Valentine TR, Alschuler KN, Ehde DM, et al. Prevalence, co-occurrence, and trajectories of pain, fatigue, depression, and anxiety in the year following multiple sclerosis diagnosis. Multiple Sclerosis Journal. 2022;28(4):620–631. doi:10.1177/13524585211023352
31. Dogan S, Yildiz S, Kiliçaslan AK, et al. Does anxiety, depression, and sleep levels affect the quality of life in patients diagnosed with multiple sclerosis? Eur Rev Med Pharmacol Sci. 2024;28(4):1306–1313. doi:10.26355/eurrev_202402_35452
32. Zini M, Banfi G. A narrative literature review of bias in collecting patient reported outcomes measures (PROMs). Int J Environ Res Public Health. 2021;18(23):12445. doi:10.3390/ijerph182312445
33. Maas Genannt Bermpohl F, Kucharczyk-Bodenburg A-C, Martin A. Efficacy and acceptance of cognitive behavioral therapy in adults with chronic fatigue syndrome: a meta-analysis. Int J Behav Med. 2024;31(6):895. doi:10.1007/s12529-023-10254-2
34. Knowles LM, Arewasikporn A, Kratz AL, et al. Early treatment improvements in depression are associated with overall improvements in fatigue impact and pain interference in adults with multiple sclerosis. Ann Behav Med. 2021;55(9):833–843. doi:10.1093/abm/kaaa102
35. Moriarty O, McGuire BE, Finn DP. The effect of pain on cognitive function: a review of clinical and preclinical research. Prog Neurobiol. 2011;93(3):385–404. doi:10.1016/j.pneurobio.2011.01.002
36. Musich S, Wang SS, Ruiz J, et al. The impact of mobility limitations on health outcomes among older adults. Geriatric Nursing. 2018;39(2):162–169. doi:10.1016/j.gerinurse.2017.08.002
37. Demaneuf T, Aitken Z, Karahalios A, et al. Effectiveness of exercise interventions for pain reduction in people with multiple sclerosis: a systematic review and meta-analysis of randomized controlled trials. Arch Phys Med Rehabil. 2019;100(1):128–139. doi:10.1016/j.apmr.2018.08.178
38. Blundell EK, Grover LE, Stott J, et al. The experience of anxiety for people with Parkinson’s disease. NPJ Parkinsons Dis. 2023;9(1). doi:10.1038/S41531-023-00512-1
39. Poon S-F, Tan C-H, Hong W-P, et al. Tailoring anxiety assessment for Parkinson’s disease: the Chinese Parkinson anxiety scale with cultural and situational anxiety considerations. Soc Sci Med. 2025;381:118284. doi:10.1016/j.socscimed.2025.118284
40. Bhalsing KS, Abbas MM, Tan LCS. Role of physical activity in Parkinson’s disease. Ann Indian Acad Neurol. 2018;21(4):242. doi:10.4103/aian.AIAN_169_18
41. Berryman C, Stanton TR, Jane Bowering K, et al. Evidence for working memory deficits in chronic pain: a systematic review and meta-analysis. Pain. 2013;154(8):1181–1196. doi:10.1016/j.pain.2013.03.002
42. Mansour AR, Farmer MA, Baliki MN, et al. Chronic pain: the role of learning and brain plasticity. Restor Neurol Neurosci. 2014;32(1):129. doi:10.3233/RNN-139003
43. Kucyi A, Davis KD. The dynamic pain connectome. Trends Neurosci. 2015;38(2):86–95. doi:10.1016/j.tins.2014.11.006
44. Chaudhuri KR, Schapira AH. Non-motor symptoms of Parkinson’s disease: dopaminergic pathophysiology and treatment. Lancet Neurol. 2009;8(5):464–474. doi:10.1016/S1474-4422(09)70068-7
45. Buhmann C, Wrobel N, Grashorn W, et al. Pain in Parkinson disease: a cross-sectional survey of its prevalence, specifics, and therapy. J Neurol. 2017;264(4):758–769. doi:10.1007/s00415-017-8426-y
46. Cattaneo C, Fabbrini A, Belvisi D, et al. Non-motor symptoms: the hidden face of Parkinson’s disease. Cells. 2025;15(1):42. doi:10.3390/cells15010042
47. Finan PH, Goodin BR, Smith MT. The association of sleep and pain: an update and a path forward. J Pain. 2013;14(12):1539–1552. doi:10.1016/j.jpain.2013.08.007
 © 2026 The Author(s). This work is published and licensed by Dove Medical Press Limited. The
full terms of this license are available at https://www.dovepress.com/terms
and incorporate the Creative Commons Attribution
- Non Commercial (unported, 4.0) License.
By accessing the work you hereby accept the Terms. Non-commercial uses of the work are permitted
without any further permission from Dove Medical Press Limited, provided the work is properly
attributed. For permission for commercial use of this work, please see paragraphs 4.2 and 5 of our Terms.
© 2026 The Author(s). This work is published and licensed by Dove Medical Press Limited. The
full terms of this license are available at https://www.dovepress.com/terms
and incorporate the Creative Commons Attribution
- Non Commercial (unported, 4.0) License.
By accessing the work you hereby accept the Terms. Non-commercial uses of the work are permitted
without any further permission from Dove Medical Press Limited, provided the work is properly
attributed. For permission for commercial use of this work, please see paragraphs 4.2 and 5 of our Terms.