Back to Journals » Clinical Ophthalmology » Volume 14
Direct and Indirect Costs of Infectious Conjunctivitis in a Commercially Insured Population in the United States
Authors Pepose JS ![]() , Sarda SP, Cheng WY, McCormick N, Cheung HC, Bobbili P, Joseph C
, Sarda SP, Cheng WY, McCormick N, Cheung HC, Bobbili P, Joseph C ![]() , Duh MS
, Duh MS ![]()
Received 5 October 2019
Accepted for publication 20 December 2019
Published 11 February 2020 Volume 2020:14 Pages 377—387
DOI https://doi.org/10.2147/OPTH.S233486
Checked for plagiarism Yes
Review by Single anonymous peer review
Peer reviewer comments 2
Editor who approved publication: Dr Scott Fraser
Jay S Pepose,1,2 Sujata P Sarda,3 Wendy Y Cheng,4 Nora McCormick,4 Hoi Ching Cheung,4 Priyanka Bobbili,4 Corey Joseph,3 Mei Sheng Duh4
1Pepose Vision Institute, Chesterfield, MO, USA; 2Department of Ophthalmology and Visual Sciences, Washington University School of Medicine, St. Louis, MO, USA; 3Shire, A Takeda Company, Lexington, MA, USA; 4Analysis Group, Inc., Boston, MA, USA
Correspondence: Sujata P Sarda
Takeda Pharmaceutical Company Limited, 55 Hayden Avenue, Lexington, MA 02421, USA
Tel +1 781 266-3440
Email [email protected]
Purpose: To assess the direct and indirect costs of infectious conjunctivitis and quantify medical costs due to conjunctivitis transmission in families.
Methods: In this retrospective claims analysis from the OptumHealth Care Solutions, Inc. database (1998– 2016), beneficiaries with or without at least one diagnosis of infectious conjunctivitis were identified. Direct and indirect costs (in 2016 US$) during the 60 days post conjunctivitis diagnosis (or imputed date for controls) were compared using cost differences in linear regressions. For transmission cost analysis, the total cost of each conjunctivitis episode was the sum of the primary episode (seed patient) and the secondary episode (infected family members) costs. A generalized estimating equation model adjusted for seed patient characteristics was used to assess the impact of number and rate of transmissions on episode cost.
Results: Health care resource utilization and direct costs were significantly higher for patients with conjunctivitis (n=1,002,188) versus controls (n=4,877,210): 1.67 all-cause visits per person per month (PPPM) versus 0.79 visits PPPM, respectively; total mean direct cost of $396.04 PPPM versus $289.63 PPPM, respectively. The cost of medically related absenteeism was $105.42 (95% confidence interval [CI], $104.18–$106.75) higher for patients with conjunctivitis than for controls. Episode cost, without transmission due to seed patient, was $669.43 (95% CI, $654.67–$684.85); it increased with each additional infected family member and with increased infection transmission time between family members.
Conclusion: Conjunctivitis was associated with a notable economic burden in terms of direct medical costs and medically related absenteeism. Family health care costs increased with transmission time and with each family member infected with conjunctivitis.
Keywords: infectious conjunctivitis, costs, charges, health care resource utilization, vector transmission
Introduction
Conjunctivitis is a common condition that affects more than 6 million people in the United States annually.1,2 The majority of cases are infectious, most commonly caused by viruses and bacteria.3 Between 2006 and 2011, 4 million (28%) ocular-related emergency department (ED) visits were attributed to conjunctivitis, making it the most common ocular diagnosis presenting in the ED.4 Although most viral and bacterial cases are self-limiting, the condition can be associated with persistent signs and symptoms. For example, in a retrospective observational case series of 54 patients with adenoviral keratoconjunctivitis in a tertiary care facility, the median disease duration was 5 weeks, but the mean was 23.4 weeks, indicating a protracted clinical course among a subset of patients.5 Approximately 26% of patients exhibited symptomatic subepithelial corneal infiltrates for over 45 days after their first conjunctivitis examination.5
The direct cost of conjunctivitis has been estimated to be approximately $800 million annually in the United States.1 Indirectly, the condition can also affect family members (“caregivers”) who may miss work to care for patients, especially school-aged patients, contributing to employee absenteeism. In a study designed to estimate the direct and indirect annual costs of bacterial conjunctivitis treatment in the United States, the indirect cost of bacterial conjunctivitis alone ranged from approximately $63 million to $141 million.6 Assuming that the indirect costs of viral conjunctivitis are similar, this suggests that direct and indirect costs of viral and bacterial conjunctivitis could exceed $1 billion annually.
Infectious conjunctivitis is thought to be highly contagious, with numerous reports of conjunctivitis outbreaks in child care centers, schools, health care centers, etc.3 Transmission through direct contact is generally believed to be the most common cause, particularly among children.3 Although the available literature provides robust estimates of the direct and indirect costs of infectious conjunctivitis,1,6,7 to our knowledge, no study exists that assesses and incorporates costs associated with transmission from one family member to another, nor does any study exist that has directly calculated both health care resource utilization (HRU) and direct and indirect costs due to infectious conjunctivitis.
Recognizing that infectious conjunctivitis places a burden on the family unit, we undertook a comprehensive assessment of the direct and indirect costs of infectious conjunctivitis on affected patients and their family members in a real-world setting.
Methods
Study Design and Oversight
This was a retrospective, longitudinal, open-cohort analysis of US health care claims data conducted to evaluate direct HRU and costs incurred by patients with conjunctivitis, indirect work-loss costs incurred by patients and caregivers, and cost of conjunctivitis transmission within families. Over the study period spanning from 1998 to 2016, we compared patients with infectious conjunctivitis (“conjunctivitis cases”) to patients without conjunctivitis (“nonconjunctivitis controls”) during the 60-day period after the index date (Figure 1A). For conjunctivitis cases, the index date was the date of first conjunctivitis diagnosis during the study period; for nonconjunctivitis controls, it was an imputed date based on the distribution of time between the enrollment start date and the index date among conjunctivitis cases (Figure 1A). The index date varied across patients without conjunctivitis and was defined as a date that was X days from the enrollment start date, where X was randomly selected such that the durations of time between the enrollment start date and the index date among the final control cohort were distributed similarly to those of the conjunctivitis cohort.
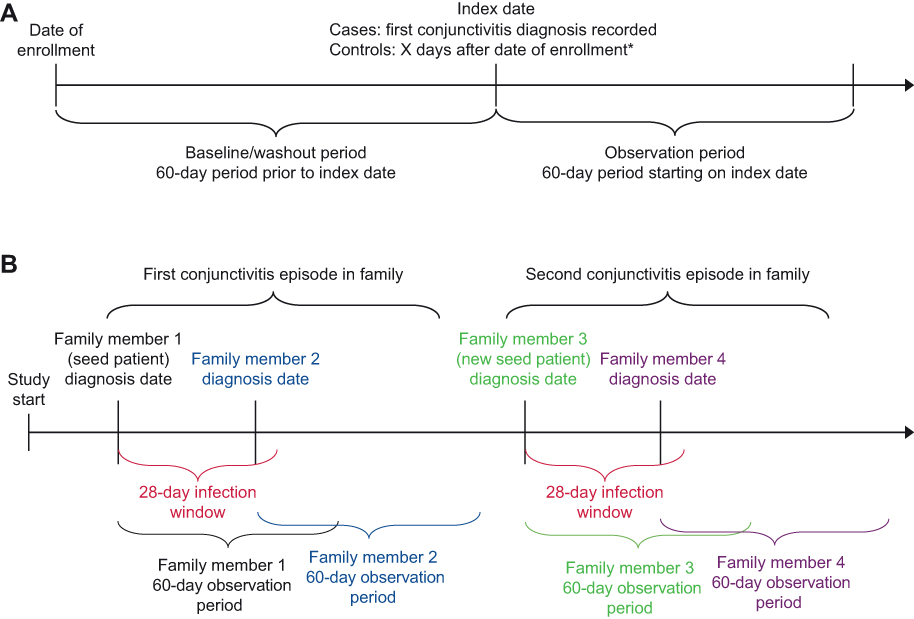 |
Figure 1 (A) Study design scheme. (B) Study design scheme used to compute the cost of transmission of conjunctivitis in families. Note: *The index date for nonconjunctivitis controls was an imputed date based on the distribution of time between the enrollment start date and the index date among patients with conjunctivitis. |
Institutional review board approval was not needed for this retrospective claims analysis that used de-identified administrative claims data and did not involve clinical intervention.
Data Source and Study Population
The patient population was derived from the OptumHealth Care Solutions, Inc. database. The database includes records of more than 19.1 million privately insured individuals covered by 84 companies that include a broad range of industries and locations in all US census areas. Patient records in the Optum database include information on demographics (eg, age, sex, and geographic region); medical claims for diagnoses, procedures performed, place and date of service, and amounts paid; pharmacy claims for prescription fills, National Drug Code, and amounts paid; and employment information, wage, and short- and long-term disability claims (available only for employees in a subset of the companies). The database includes a unique identifier of each primary beneficiary, which is shared among all patients under the same insurance policy, and can be used to group patients into family units for study.
Inclusion criteria were the following: at least one medical claim in the dataset, at least 60 days of continuous enrollment before the index date (washout period), and at least 60 days of continuous enrollment following the index date. To ensure that the first observed conjunctivitis diagnosis among cases was an incident case, we excluded patients with at least one diagnosis of infectious conjunctivitis during the washout period. We also excluded those with at least one claim for a conjunctivitis-related medication during the washout period; relevant medications were identified by national drug codes associated with the dispensing of relevant antibiotic. For those with at least one conjunctivitis diagnosis, we excluded patients with diagnoses of both acute and chronic conjunctivitis on the index date. The washout period was defined as the fixed, 60-day period prior to the index date, during which no other conjunctivitis diagnosis could be observed.
Conjunctivitis Identification
Patients were classified as “conjunctivitis cases” if they had at least one conjunctivitis diagnosis based on International Classification of Diseases, Ninth (ICD-9)/Tenth Revision (ICD-10) codes, or as “nonconjunctivitis controls” if they had none. Conjunctivitis is generally characterized by inflammation of the membrane lining the eyelids and exposed surface of the sclera. Diagnosis codes for acute, chronic, or viral conjunctivitis were included in the analysis, as were codes for “other” and “unspecified” conjunctivitis (full list of codes included in the analysis is available in Supplementary Table S1). Codes specific to allergic, atopic, and vernal conjunctivitis and codes associated with graft-versus-host disease or ocular cicatricial pemphigoid diagnoses were excluded. Inverse probability treatment weighting was used to balance the distribution of covariates and confounding variables between conjunctivitis cases and nonconjunctivitis controls. Each patient was weighted by the inverse of the probability of having conjunctivitis (for conjunctivitis cases) or the inverse of the probability of not having conjunctivitis (for nonconjunctivitis controls), as measured by a propensity score generated using logistic regression. Propensity scores were generated with the following variables: age, sex, region, insurance type, year of index date, season of diagnosis, Quan-Charlson8 comorbidity index, pruritus, eye redness or discharge, dry eyes, ocular pain, eye swelling, vision changes, health care costs, health care resource use, and use of any medication during the 60 days before the index date. After weighting, the distribution of baseline characteristics was similar across the groups of conjunctivitis cases and nonconjunctivitis controls, with relevant characteristics having standardized differences under 10%.
Patient Direct and Indirect Costs and Caregiver Costs
All-cause direct costs and caregiver costs during the 60 days following the index date were compared using cost differences in linear regressions. Costs were adjusted for inflation and reported in 2016 US$. Incidence rate ratios (IRRs) comparing HRU of conjunctivitis cases with nonconjunctivitis controls and 95% confidence intervals (CIs) were calculated using Poisson regressions. Costs incurred due to a caregiver’s missed time from work were calculated on the basis of the HRU of the patient and available wage data for the caregiver. Patients were not included in the caregiver cost analysis if the caregiver’s wage data were not available. For calculating medically related absenteeism, we considered each weekday inpatient (hospitalization) or ED visit to be equivalent to 1 day missed from work, whereas each outpatient or “other” visit was equivalent to a half-day missed from work.9
Vector Transmission Analysis
The first family member to be diagnosed with conjunctivitis was considered the seed patient. Any other family member who had a conjunctivitis diagnosis within 28 days of the seed patient’s diagnosis was considered “infected” by the seed patient. The seed patient and the infected family members were observed for 60 days after their respective conjunctivitis diagnoses (Figure 1B), and the costs of each member’s 60-day observation period were summed to measure the total cost of the conjunctivitis episode. If multiple people in a family were diagnosed with conjunctivitis on the same day, the youngest person was considered the seed patient. Older family members that were diagnosed on the same day were not considered to have been infected by the seed patient and their costs were excluded from the total cost of the episode. Families in which some members did not have at least 60 days of follow-up after their conjunctivitis diagnoses were excluded from the analysis. In addition, families in which the seed patient did not have at least 180 days to flag prior antibiotic-resistant infections were also excluded from the analysis.
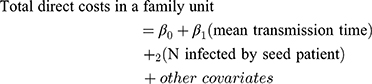
The impact of the number and rate of transmissions (time between seed patient and family member diagnoses) on episode cost was assessed using a generalized estimating equation model adjusted for seed patient characteristics. Point estimates were obtained using the PROC GENMOD procedure in the SAS 9.4 software (SAS Institute Inc., Cary, NC, USA) for generalized estimating equations assuming a normal distribution and identity link, accounting for clustering by the seed patient. P-values and 95% CIs were obtained using nonparametric block bootstraps with 499 replications. Total direct costs incurred by a family due to conjunctivitis were regressed on the mean transmission-time interval and on the total number of family members infected by the seed patient:
Results
Study Population
Data from 5,879,398 patients were included (Figure 2). Of these patients, 23.2% were younger than 18 years of age and 1.4% were 1 year of age or younger. After weighting, baseline characteristics were well balanced between all conjunctivitis cases and nonconjunctivitis controls (n=1,002,188 and n=4,877,210, respectively; Table 1), and between conjunctivitis cases and nonconjunctivitis controls with caregiver wage data (n=499,432 [49.8%] and n=1,828,359 [37.5%], respectively) with caregiver wage data. In the conjunctivitis cohort, there were more patients with index dates in summer and fall.
 |
Table 1 Baseline Characteristics |
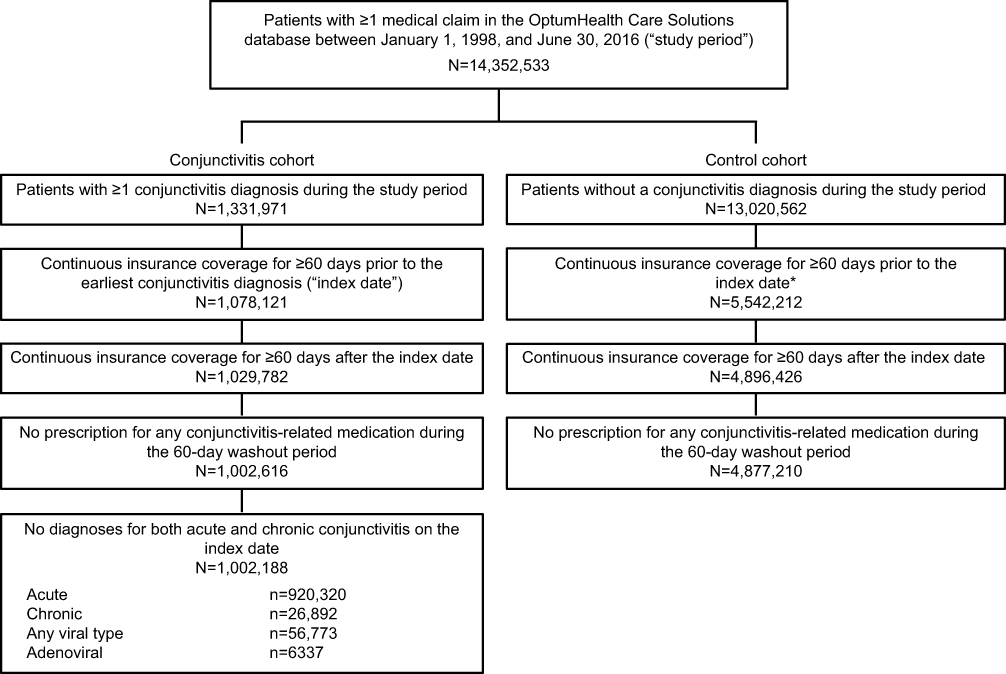 |
Figure 2 Sample selection flowchart. Note: *A 50% sample was used of the 13,020,562 patients identified without conjunctivitis. |
All-Cause HRU
HRU was approximately 1.5 to 3 times higher for patients with conjunctivitis than among the nonconjunctivitis controls. Patients with conjunctivitis had 1.67 all-cause visits per person per month (PPPM) versus 0.79 for nonconjunctivitis controls, for an IRR of 2.12 (95% CI, 2.12–2.13). Figure 3 shows mean HRU (PPPM) and IRRs by type of HRU. The highest incidence rates were for outpatient visits, at 1.38 visits PPPM for conjunctivitis cases versus 0.64 visits PPPM for nonconjunctivitis controls. The IRR of patients with conjunctivitis versus nonconjunctivitis controls was highest for ED visits at 3.10 (95% CI, 3.08–3.13), followed by outpatient visits at 2.18 (95% CI, 2.17–2.18).
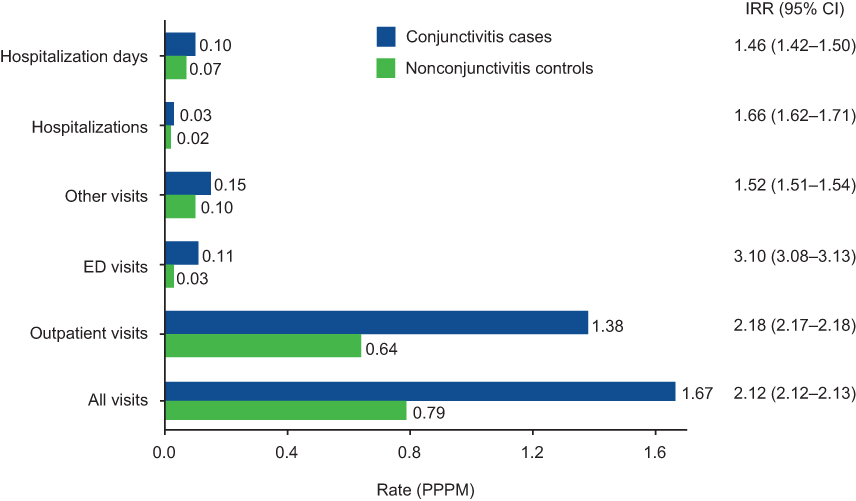 |
Figure 3 Weighted health care resource utilization for patients with conjunctivitis. Abbreviations: CI, confidence interval; ED, emergency department; IRR, incidence rate ratio; PPPM, per person per month. |
Patients with conjunctivitis incurred 0.60 conjunctivitis-related visits PPPM, with most being outpatient visits. Viral conjunctivitis was associated with the highest HRU at 0.82 visits PPPM, with adenoviral conjunctivitis–related visits accounting for 0.68 visits PPPM. Chronic and acute conjunctivitis were associated with 0.60 and 0.58 visits PPPM, respectively.
Direct Costs
Mean direct costs were approximately 1.4 times higher for patients with conjunctivitis compared with nonconjunctivitis controls (Figure 4; total costs). Total direct mean costs were $396.04 PPPM for patients with conjunctivitis and $289.63 for nonconjunctivitis controls. The difference in mean total costs between patients with conjunctivitis versus those without was $106.42 (95% CI, $104.60–$108.31) PPPM. Outpatient visits, pharmacy costs, and ED visits accounted for most of the costs associated with conjunctivitis (Figure 4). In terms of cost differences, mean outpatient costs were $63.78 (95% CI, $62.85–$64.78) PPPM higher, mean pharmacy costs were $26.32 ($25.90–$26.71) PPPM higher, and mean ED costs were $15.89 ($15.63–$16.14) PPPM higher among patients with conjunctivitis versus nonconjunctivitis controls.
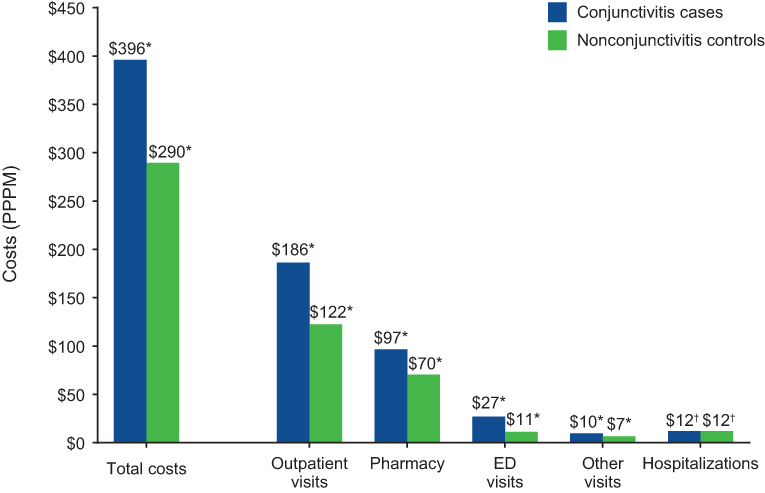 |
Figure 4 Weighted mean direct costs of conjunctivitis (in US$). Notes: Significance of difference in costs, conjunctivitis cases versus nonconjunctivitis controls: *P<0.05; †P=0.6240.Abbreviations: ED, emergency department; PPPM, per person per month. |
Conjunctivitis-related mean costs were $46.29 PPPM, with the highest costs associated with viral conjunctivitis ($48.90 PPPM), followed by acute conjunctivitis ($46.32 PPPM). Mean costs for chronic and adenoviral conjunctivitis were $43.44 and $40.35 PPPM, respectively.
Indirect Costs
Indirect costs, in terms of workdays lost, were higher for patients with conjunctivitis compared with nonconjunctivitis controls (Figure 5). Patients with conjunctivitis lost a mean ± standard deviation (SD) of 0.93±2.25 days, whereas nonconjunctivitis controls lost 0.57±2.26 days PPPM, with medically related absenteeism accounting for most of the workdays lost (Figure 5A). Patients with conjunctivitis were 2.11 times more likely to have any work loss. The mean total work-loss costs for conjunctivitis cases were 2.05 times higher than those for nonconjunctivitis controls (Figure 5B), resulting in a cost difference of $108.51 (95% CI, $106.91–$110.18) PPPM. Medically related absenteeism accounted for most of the higher costs associated with conjunctivitis, with costs higher by $105.42 (95% CI, $104.18–$106.75) PPPM among patients with conjunctivitis.
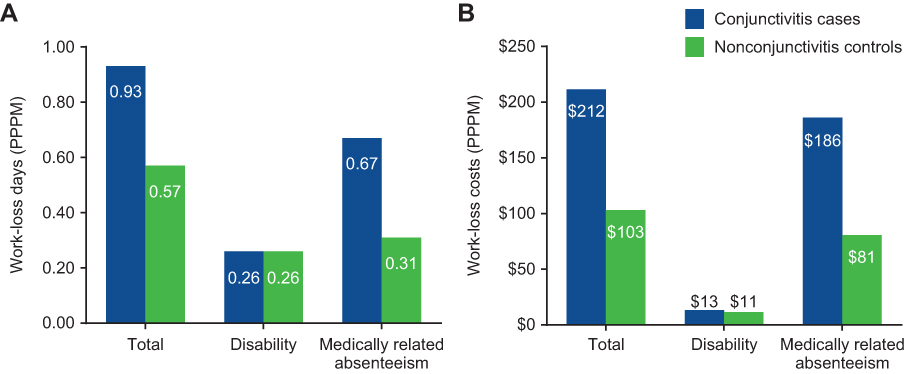 |
Figure 5 Weighted mean indirect cost of conjunctivitis, inverse probability of treatment weighted. (A) Work-loss days. (B) Work-loss costs (in US$). Abbreviations: PPPM, per person per month. |
Caregiver Costs
Caregivers of patients with conjunctivitis missed a mean±SD of 0.66±0.75 workdays PPPM versus 0.29±0.66 for nonconjunctivitis control caregivers (P<0.0001). Conjunctivitis caregivers also incurred $126.22 (95% CI, $125.25–$127.16; P<0.05) higher mean work-loss costs PPPM than nonconjunctivitis control caregivers.
Vector Transmission Costs
This study included 860,930 distinct seed patients. The baseline characteristics for the seed patients were very similar to those of the unweighted conjunctivitis cohort (Supplementary Table S2) of the full sample in the main analyses. Seed patients had a mean±SD age of 32.4±24.8 years and over one-half (56%) of them were female. In episodes where seed patients infected one or more family members (n=23,399), seed patients infected a mean±SD (median) of 1.06±0.26 (1) family members, and there were 10.5±7.48 (9) days between the seed patient’s diagnosis and infected family members’ diagnoses. Most (91.6%) seed patients had acute conjunctivitis. Of the rest, 2.8% had chronic, 5.9% had viral, and 0.6% had adenoviral conjunctivitis. Over 50% of the seed population had index dates in winter and fall.
Distinct seed patients contributed 1,075,942 primary episodes of conjunctivitis because some patients were seed patients more than once in separate episodes. After adjusting for the number of family members infected by the seed patient and the number of days between the seed patient’s diagnosis and infected family members’ diagnosis, the partially adjusted episode cost without transmissions due to the seed patient was $788.71 (95% CI, $785.22–$792.15; Table 2). After fully adjusting for seed patient age, sex, region, insurance type, season and year of diagnosis, history of antibiotic resistance or previous conjunctivitis, and seed patient’s use of conjunctivitis medications at diagnosis, the total direct costs (95% CI) increased with each additional infected family member by $466.99 ($358.46–$587.06), greater transmission time between seed patient and family member infections (1–7 days: $138.03 [$2.23–$259.14]; >7 days, $193.96 [$67.83–$313.32]), and an antibiotic resistance diagnosis in the seed patient in the preceding 180 days ($1048.26 [$817.43–$1306.90]; Table 2). A decrease in total direct costs was associated with seed patients receiving conjunctivitis medications on their diagnosis dates (fully adjusted, –$42.26 [95% CI, –$48.86, –$35.18]; Table 2).
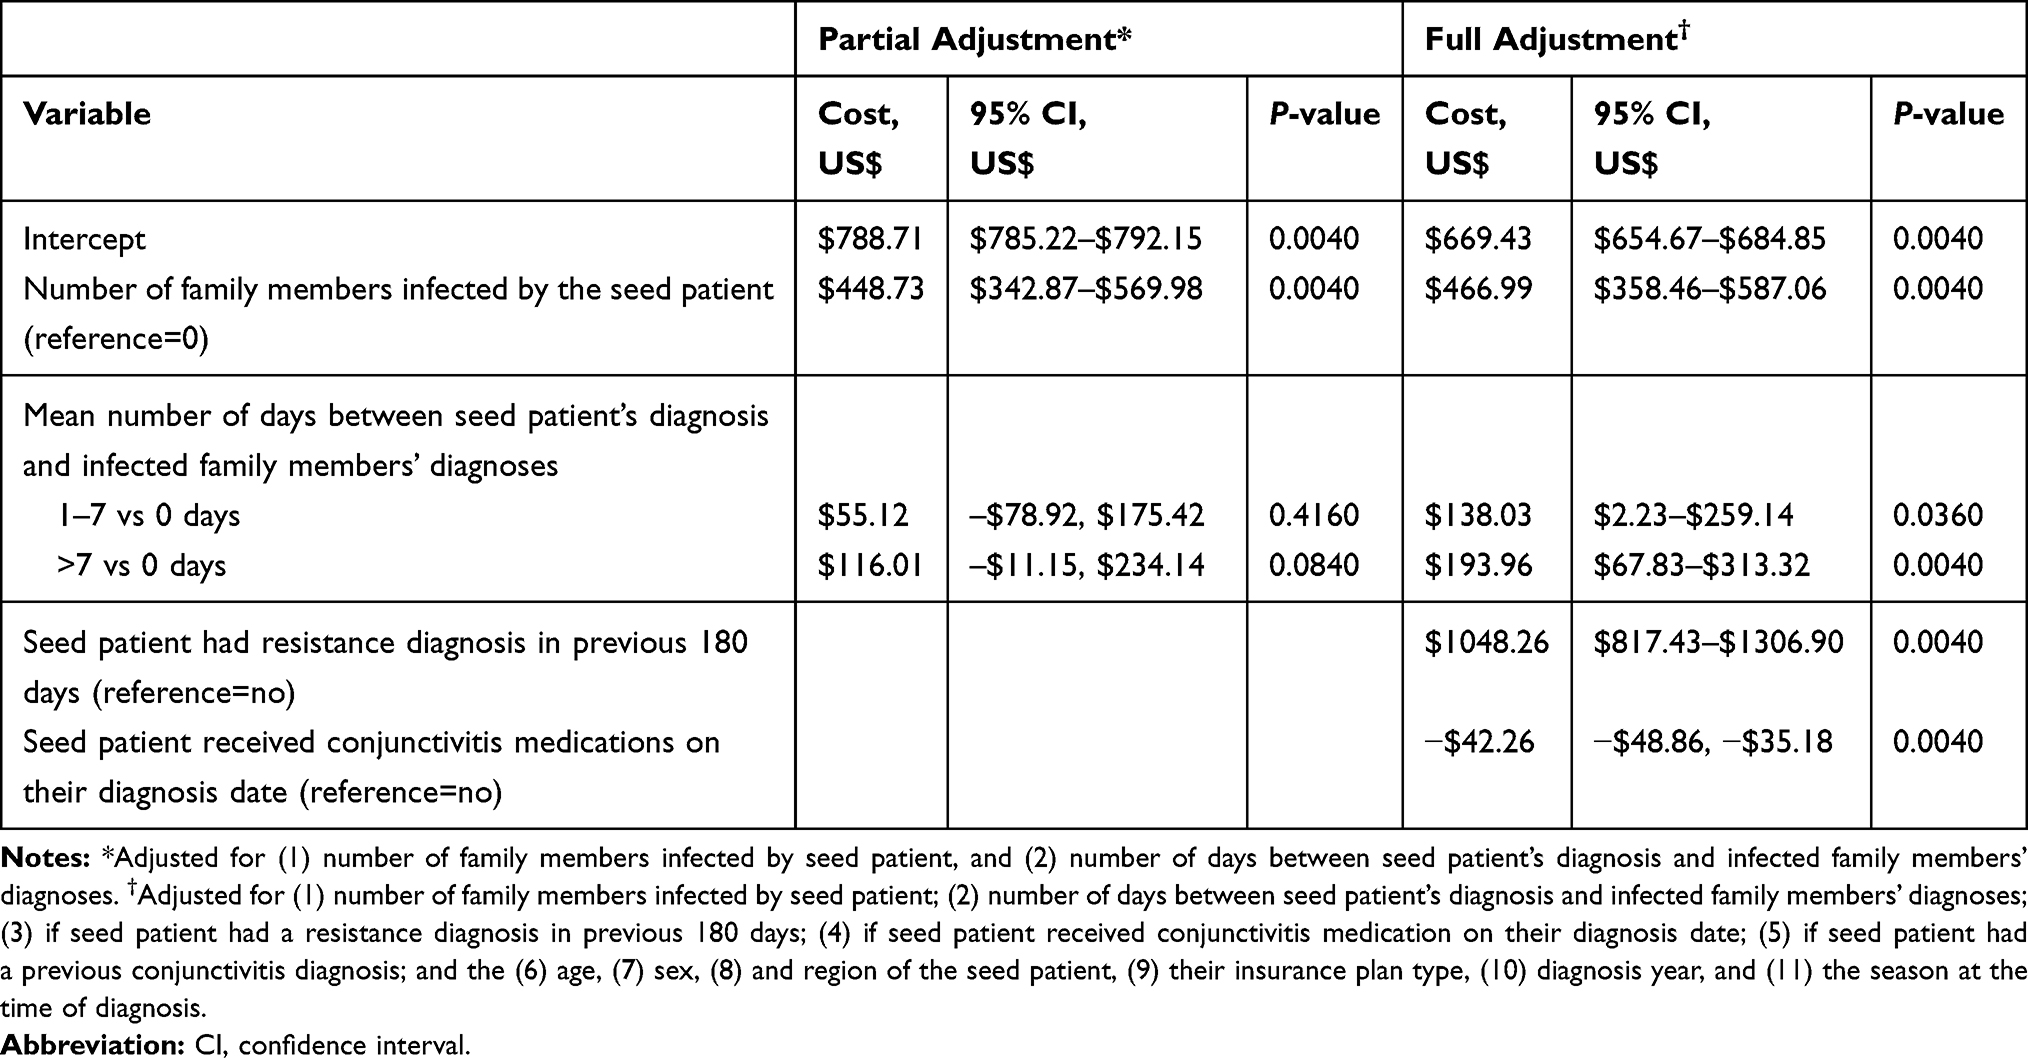 |
Table 2 Total All-Cause Direct Costs per Conjunctivitis Episode (n=1,075,942 Episodes Associated with 860,930 Distinct Patients) |
Discussion
Patients with infectious conjunctivitis experienced an increase in HRU and direct and indirect costs compared with nonconjunctivitis controls. Patients with infectious conjunctivitis incurred 2.12 times higher all-cause HRU PPPM versus nonconjunctivitis controls. Direct costs were $106.42 PPPM higher among patients with conjunctivitis. Indirect costs, in terms of total work-loss costs, were higher by $108.51 PPPM among conjunctivitis cases. Family health care costs due to conjunctivitis increased with each family member infected, increased transmission time, or a recent diagnosis of antibiotic resistance in the seed patient. The mean adjusted episode cost, without transmissions due to the seed patient, was $669.43, with direct costs increasing by $466.99 with each additional infected family member.
The higher costs for patients with conjunctivitis compared with nonconjunctivitis controls were mostly driven by the associated costs of having twice the rate of outpatient visits PPPM and twice the number of medically related absences from work for self-care or to care for a dependent with conjunctivitis.
Vector transmission analysis provided new insights into the cost impact of conjunctivitis transmission. The health care costs of conjunctivitis increased with the transmission of illness between family members and depended on the time for the primary case to infect secondary cases.
Other studies have previously estimated direct costs associated with conjunctivitis.1,6,7 Schneider et al, for example, using claims data, estimated the average direct cost of conjunctivitis to be $218 per episode for 60-day episodes between March and November 2005 and extrapolated it to $800 million annually for the entire commercially insured population of the United States.1 Smith and Waycaster, using published literature and claims data, estimated the total annual direct and indirect cost of bacterial conjunctivitis to be $377 million to $857 million in 2007 US$.6 Udeh et al, using published data, estimated the average cost of acute conjunctivitis at $111.56 per case in 2006 US$ and extrapolated it to $672 million annually for the entire US population.7 We estimate the mean costs to be $396 PPPM in 2016 US$, with conjunctivitis-related costs accounting for approximately $46 PPPM. Several different factors, including changes in costs and medical practice patterns over time, may contribute to the differences in cost estimates. For example, subjective variations in experiencing symptoms, and how these affect an individual’s care-seeking behavior, are key factors in driving variations in prevalence estimates. Depending on the population sampled, the prevalence may also be over- or underestimated in different age categories. Insofar as costs are derived from prevalence, inexact estimates can confound average costs and total costs for the population. Moreover, the accuracy of diagnosis and costs resulting from misdiagnosis should also be considered.
Published literature describes seasonal variations for various conjunctivitis etiologies; bacterial conjunctivitis peaks during December through April, viral conjunctivitis in summer, and allergic conjunctivitis in spring and summer.3 We observed a modest increase in summer and fall among the full conjunctivitis cohort and a similar modest increase in winter and spring among the vector transmission analysis cohort. However, there were no clear seasonal variations, probably because the analysis included patients diagnosed with all infectious etiologies.
A comparison with the economic burden of other eye disorders showed that the economic burden of conjunctivitis is somewhat comparable with that of some chronic eye conditions. However, as the epidemiology of infectious conjunctivitis is difficult to estimate,1,10 its economic impact is also underestimated in most studies. Rein et al reviewed the economic burden of visual disorders among those 40 years of age or older in the United States and found that direct medical costs in 2004 for conditions such as cataracts were roughly $6.8 billion; for glaucoma, $2.9 billion; and for age-related macular degeneration, $575 million.11 Wittenborn et al estimated the economic burden of vision loss and eye disorders among those 40 years of age or younger in the United States to be $27.5 billion in 2012, with disorders of the conjunctiva accounting for 12%, or approximately $3.3 billion of those costs.12 Given the large economic burden and work loss associated with infectious conjunctivitis, this common condition has a significant societal impact.
We observed a decrease in overall family medical costs associated with seed patients receiving conjunctivitis medications on their diagnosis dates. This finding may be attributable to a number of factors. Medications may hasten resolution and/or reduce complications arising from untreated conjunctivitis. These benefits could, in turn, lead to reduced transmission or contralateral spread of some forms of conjunctivitis, as well as fewer follow-up visits. From data available for this study, it was not possible to determine the exact causes of reduced costs. However, the cost differences associated with patients receiving early treatment are in line with clinical perception and practice guidelines. For example, the American Academy of Ophthalmology Preferred Practice Pattern® notes that prompt, appropriate treatment of many forms of conjunctivitis speeds time to resolution, thus minimizing the consequences of untreated conjunctivitis including “stay home” days for patients.10 In addition, general public health advice given at the time of issuing a prescription may reduce the potential for disease spread regardless of the etiology, hence reducing costs associated with additional cases of conjunctivitis.10 Speedy resolution and early return to school or work are particularly important, given the relatively high cost of absenteeism associated with conjunctivitis in this study.
We note that because the OptumHealth Care Solutions, Inc. database is a commercial insurance database of health benefit services provided by Fortune 500 company employers, the average age is skewed toward working/employed individuals, although their dependents are included in the data. This could have led to an underestimation of the transmission costs in school-aged children and their caregivers as well as the capturing of conjunctivitis episodes in neonates. Further studies are needed to examine the impact of infectious conjunctivitis using data that include uninsured individuals, as well as individuals covered through government insurance, to account for all ages and socioeconomic statuses, missed productivity, and societal costs. Our results may be biased toward patients with conjunctivitis severe enough to seek medical treatment, and hence captured in claims data. When identifying infectious conjunctivitis cases, some more general ICD codes for “other” and “unspecified” conjunctivitis were also included, which may have added a small number of noninfectious conjunctivitis cases to our study sample. Other limitations include potential billing inaccuracies and missing data (eg, miscoding of diagnoses, prescriptions, HRU).
Strengths of this study include the large demographically and geographically diverse population sampled. Moreover, this is the most recent and comprehensive analysis of economic burden associated with conjunctivitis. We report on the economic burden of conjunctivitis experienced by patients and their caregivers, as well as the cost of conjunctivitis transmission within families.
In this study, conjunctivitis was associated with a notable economic burden in terms of increased HRU and higher total direct, indirect, and caregiver costs among conjunctivitis cases compared with nonconjunctivitis controls. The majority of the burden of conjunctivitis was incurred through outpatient care. Treatments that reduce the transmission of conjunctivitis may reduce the economic burden of this common disease. Future studies on the impact of conjunctivitis at the population level are needed.
Abbreviations
CI, confidence interval; ED, emergency department; HRU, health care resource utilization; ICD-9-CM, International Classification of Diseases, Ninth Revision, Clinical Modification; ICD-10, International Classification of Diseases, Tenth Revision; IRR, incidence rate ratio; PPPM, per person per month; SD, standard deviation.
Acknowledgments
The authors thank Ira Probodh, PhD, of Excel Scientific Solutions, who provided medical writing assistance, which was funded by Shire, a Takeda company. The work presented within this manuscript was presented as a poster at the 2018 American Academy of Ophthalmology Annual Meeting, October 27–30, 2018, Chicago, IL.
Author Contributions
All authors contributed to data analysis, drafting and revising the article, gave final approval of the version to be published, and agree to be accountable for all aspects of the work.
Disclosure
Jay S Pepose is/has been a consultant for AcuFocus, Bausch & Lomb, BRIM Biotech, Johnson & Johnson, Noveome, Shire (a Takeda company), Sun, and TearLab; and is an equity owner of AcuFocus, Mimetogen, Ocunexus, Okogen, and Stuart. Sujata P Sarda is an employee of and owns stock/stock options in Takeda. Wendy Y Cheng, Nora McCormick, Hoi Ching Cheung, Priyanka Bobbili, and Mei Sheng Duh are employees of Analysis Group, Inc., which has received research funding from Shire (a Takeda company). Priyanka Bobbili reports grants from Shire (a Takeda company), during the conduct of the study. Mei Sheng Duh reports grants from Takeda during the conduct of the study. Corey Joseph is an employee of and owns stock/stock options in Takeda. The authors report no other conflicts of interest in this work.
References
1. Schneider JE, Scheibling CM, Segall D, Sambursky R, Ohsfeldt RL, Lovejoy L. Epidemiology and economic burden of conjunctivitis: a managed care perspective. J Manag Care Med. 2014;17(1):78–83.
2. Azari AA, Barney NP. Conjunctivitis: a systematic review of diagnosis and treatment. JAMA. 2013;310(16):1721–1729. doi:10.1001/jama.2013.280318
3. Høvding G. Acute bacterial conjunctivitis. Acta Ophthalmol. 2008;86(1):5–17. doi:10.1111/j.1600-0420.2007.01006.x
4. Channa R, Zafar SN, Canner JK, Haring RS, Schneider EB, Friedman DS. Epidemiology of eye-related emergency department visits. JAMA Ophthalmol. 2016;134(3):312–319. doi:10.1001/jamaophthalmol.2015.5778
5. Butt AL, Chodosh J. Adenoviral keratoconjunctivitis in a tertiary care eye clinic. Cornea. 2006;25(2):199–202. doi:10.1097/01.ico.0000170693.13326.fb
6. Smith AF, Waycaster C. Estimate of the direct and indirect annual cost of bacterial conjunctivitis in the United States. BMC Ophthalmol. 2009;9:13. doi:10.1186/1471-2415-9-13
7. Udeh BL, Schneider JE, Ohsfeldt RL. Cost effectiveness of a point-of-care test for adenoviral conjunctivitis. Am J Med Sci. 2008;336(3):254–264. doi:10.1097/MAJ.0b013e3181637417
8. Quan H, Li B, Couris CM, et al. Updating and validating the Charlson comorbidity index and score for risk adjustment in hospital discharge abstracts using data from 6 countries. Am J Epidemiol. 2011;173(6):676–682. doi:10.1093/aje/kwq433
9. Thorne JE, Skup M, Tundia N, et al. Direct and indirect resource use, healthcare costs and work force absence in patients with non-infectious intermediate, posterior or panuveitis. Acta Ophthalmol. 2016;94(5):e331–e339. doi:10.1111/aos12987
10. AAO PPP Cornea/External Disease Committee, Hoskins Center for Quality Eye Care. Conjunctivitis Preferred Practice Pattern® - 2018. https://www.aao.org/preferred-practice-pattern/conjunctivitis-ppp-2018.
11. Rein DB, Zhang P, Wirth KE, et al. The economic burden of major adult visual disorders in the United States. Arch Ophthalmol. 2006;124(12):1754–1760. doi:10.1001/archopht.124.12.1754
12. Wittenborn JS, Zhang X, Feagan CW, et al. The economic burden of vision loss and eye disorders among the United States population younger than 40 years. Ophthalmology. 2013;120(9):1728–1735. doi:10.1016/j.ophtha.2013.01.068
 © 2020 The Author(s). This work is published and licensed by Dove Medical Press Limited. The
full terms of this license are available at https://www.dovepress.com/terms
and incorporate the Creative Commons Attribution
- Non Commercial (unported, 3.0) License.
By accessing the work you hereby accept the Terms. Non-commercial uses of the work are permitted
without any further permission from Dove Medical Press Limited, provided the work is properly
attributed. For permission for commercial use of this work, please see paragraphs 4.2 and 5 of our Terms.
© 2020 The Author(s). This work is published and licensed by Dove Medical Press Limited. The
full terms of this license are available at https://www.dovepress.com/terms
and incorporate the Creative Commons Attribution
- Non Commercial (unported, 3.0) License.
By accessing the work you hereby accept the Terms. Non-commercial uses of the work are permitted
without any further permission from Dove Medical Press Limited, provided the work is properly
attributed. For permission for commercial use of this work, please see paragraphs 4.2 and 5 of our Terms.