Back to Journals » Clinical Ophthalmology » Volume 20
Differential Effects of Balanced and Imbalanced Binocular Stimulation on Visual Cortex Responses in Amblyopic Children
Authors Huang Y ![]() , Wang S, Qian Y, Kong L, Zhao P, Liu Y, Zarei SA
, Wang S, Qian Y, Kong L, Zhao P, Liu Y, Zarei SA ![]() , Zhang P, Andolina IM
, Zhang P, Andolina IM ![]() , Liu H
, Liu H
Received 19 December 2025
Accepted for publication 5 April 2026
Published 23 April 2026 Volume 2026:20 590186
DOI https://doi.org/10.2147/OPTH.S590186
Checked for plagiarism Yes
Review by Single anonymous peer review
Peer reviewer comments 3
Editor who approved publication: Dr Sotiria Palioura
Yuanyang Huang,1,* Shu Wang,1,* Yazhu Qian,2,* Linghan Kong,3 Peijun Zhao,3 Yan Liu,4 Shahab Aldin Zarei,5 Peng Zhang,2 Ian Max Andolina,5 Hong Liu1,6
1Department of Ophthalmology, Shanghai Children’s Medical Center, School of Medicine, Shanghai Jiao Tong University, Shanghai, People’s Republic of China; 2State Key Laboratory of Brain and Cognitive Science, Institute of Biophysics, Chinese Academy of Sciences, Beijing, People’s Republic of China; 3School of Biomedical Engineering, Shanghai Jiao Tong University, Shanghai, 200030, People’s Republic of China; 4Department of Ophthalmology and Visual Science, Eye and ENT Hospital, Shanghai Medical College, Fudan University, Shanghai, People’s Republic of China; 5Center for Excellence in Brain Science and Intelligence Technology, State Key Laboratory of Brain Cognition and Brain-inspired Intelligence Technology, Institute of Neuroscience, Chinese Academy of Sciences, Shanghai, People’s Republic of China; 6College of Clinical Medicine for Obstetrics and Gynecology and Pediatrics, Fujian Medical University, Fuzhou, Fujian, People’s Republic of China
*These authors contributed equally to this work
Correspondence: Hong Liu; Ian Max Andolina, Email [email protected]; [email protected]
Purpose: To investigate the changes in neural activity in V1, V2, and V3 visual cortical areas of control participants and amblyopic patients during visual stimulation under four differing visual inputs.
Patients and Methods: A total of 14 children with monocular amblyopia and 11 age-matched healthy controls were recruited for the study. A fast meridional retinotopic mapping paradigm was employed to efficiently localize regions of interest (ROIs) within the visual cortex. Four types of visual stimulation were achieved using a spatiotemporally modulating checkerboard paired with anaglyph red-blue glasses: amblyopic or non-dominant eye only (AE), fellow or dominant eye only (FE), balanced dichoptic (BE), and imbalanced-dichoptic stimulation (DE).
Results: Amblyopic patients exhibit significantly reduced neural activity across V1, V2, and V3 compared to control participants. DE resulted in the most significant reductions in cortical responses for amblyopes. In the control group, significant differences were observed between AE and BE, FE and BE, and BE and DE, while no significant differences were found between AE and DE. In the amblyopic group, significant differences were identified between AE and DE, FE and DE, AE and BE, FE and BE, as well as between BE and DE.
Conclusion: Imbalanced dichoptic stimulation produced the largest and most significant reductions in cortical responses, observed exclusively in the patient group, indicating a suppressive influence from the fellow eye. These exploratory data support the view that imbalanced dichoptic stimulation may offer greater potential for neural response recovery compared to monocular approaches. The experimental protocols and findings reported here provide a comparative framework to inform the development of more effective rehabilitation strategies for children with amblyopia.
Keywords: anisometropic amblyopia, fMRI, dichoptic, pediatric
Introduction
Amblyopia is the leading cause of significant vision loss in children and young adults, and visual deficiencies can persist well into later adulthood.1,2 Amblyopia is a central nervous system (CNS) neurodevelopmental disorder, when the development of the neural circuits that compute binocular disparity is disrupted by strabismus, anisometropia, high refractive error, or form deprivation without any organic ocular abnormalities.3 There are multiple functional deficits along the visual pathway, including the retina, lateral geniculate nucleus of the thalamus (LGN) and visual cortex.4,5 It is clinically characterized by reduced best-corrected visual acuity in one or both eyes,6 although there are many functional deficits including impaired binocular sensory fusion, stereoacuity, and reduced binocular motion sensitivity.1,7 These deficits can markedly diminish quality of life by interfering with educational attainment and professional functioning, while also increasing the risk of mental health difficulties related to visual impairment.8 Despite this significant burden, therapeutic options remain limited, especially for individuals who do not respond adequately to conventional interventions.
Aside from optical correction and the removal of the causes of ocular dysfunction, occlusion and atropine penalization therapy are the main treatments for amblyopia. These methods work by impeding the dominant eye, driving the monocular use of the amblyopic eye to promote its recovery. Functional magnetic resonance imaging (fMRI) provides important advantages for studying the pathophysiology of amblyopia and assessing treatment outcomes.9–11 Early studies suggested that the neuropathological basis of amblyopia mainly involves abnormalities in the occipital cortex, particularly in primary visual cortex (V1), the largest visual area and the first cortical site of clear binocular integration.12–14 However, later structural, resting-state, and stimulation-based MRI studies showed that abnormalities in amblyopia are not confined to early occipital cortex, but also affect downstream visual areas including V2, V3, V3a, and higher-order regions such as V7 and MT+.9,11,15–18 This broader pattern is consistent with neurophysiological recordings from extrastriate visual areas in experimental primate models of amblyopia.19–22
Functional MRI studies have shown that after monocular occlusion therapy, activity in both the striate and extra-striate regions of the brain in amblyopic patients increases.23 However, these methods are most effective primarily in children under 7 years of age, and decreases in efficacy is attributed to progressively reduced neural plasticity beyond age 7 that increasingly limits visual function improvements.4,24,25 Recent studies have found that dichoptic binocular treatment may offer a new approach to treating amblyopia, through more complex balancing of the dynamic inhibitory cross-talk between eyes.26–29 In this method, high-contrast or behaviorally attended target stimuli are presented to the amblyopic eye, while low-contrast or irrelevant distractor stimuli are presented to the fellow eye to rebalance neural cross-ocular-inhibition. Both fundamental and clinical studies comparing the efficacy of various binocular therapies against occlusion or penalization therapy are underway,30–45 and this body of work demonstrates a promising route to translate neuroscientific understanding of binocular vision into optimal clinical intervention.46 In 2024, the American clinical guidelines for amblyopia (Preferred Practise Pattern, PPP) incorporated a new home-based treatment, CureSight, suggesting that it is non-inferior to monocular occlusion therapy.47 CureSight uses anaglyph red-blue glasses—stereoscopic glasses that present different images to each eye using colored filters—while subjects view contrast-imbalanced visual content.
The comparative changes in neural activity in the visual cortex during monocular occlusion versus imbalanced-dichoptic therapeutic approaches are however poorly understood. Knowing how these different visual inputs impact neural activity is crucial for developing and refining targeted interventions that maximize recovery and visual function in amblyopic patients. We hypothesized that imbalanced-dichoptic stimulation in amblyopes should result in the largest reductions of cortical activity across cortical areas compared to monocular stimulation. Such a result would support the idea that imbalanced dichoptic stimulation provides the best avenue for neural activity recovery with training. To test this hypothesis, we first utilized a fast meridional retinotopic mapping paradigm to minimize the time it took to localize the visual cortex ROIs, given the difficulty in keeping young participants stable in the scanner for long periods of time. We then employed a spatiotemporally modulating checkerboard paired with anaglyph red-blue glasses with four ocular stimulation classes: monocular stimulation of the amblyopic eye (non-dominant eye in control participants), monocular stimulation of the fellow eye (dominant eye of control participants), normal dichoptic stimulation (both eyes at 100% contrast), and imbalanced-dichoptic stimulation (amblyopic eye at 100% contrast, fellow eye at 15% contrast). We were particularly interested in contrasting amblyopic-eye vs. imbalanced-dichoptic stimuli, as these most closely associate with classical monocular patching compared to binocular training therapies. Using 3T fMRI, we explored the changes in neural activity in V1, V2, and V3 visual cortical areas of control participants and amblyopic patients during visual stimulation under these differing visual inputs.
Materials and Methods
Participants
This was a prospective exploratory clinical intake study, approved by the Ethics Review Committee of Shanghai Children’s Medical Center, affiliated with Shanghai Jiao Tong University School of Medicine. The study was conducted in accordance with the principles of the Declaration of Helsinki. Written informed consent was obtained from all participants (or their legal guardians, if applicable) prior to enrollment. A formal a priori power analysis was not conducted. The sample size was determined pragmatically based on the availability of eligible children with monocular amblyopia presenting through clinical intake during the recruitment period. An age-matched healthy control group was recruited to provide an appropriate comparison sample. Twenty patients and sixteen controls were initially recruited; however, six patients and five controls were excluded due to non-compliance in the scanner (not maintaining focus for the whole session as measured using the attention paradigm or moving excessively). The fourteen remaining patients with anisometropic amblyopia comprised 3 males and 11 females, aged 7 to 18 years, with best-corrected visual acuity (BCVA) of the amblyopic eye worse than 0.2 LogMAR, and visual acuity of the fellow eye better than 0.1 LogMAR; the interocular visual acuity difference was 2 lines or more. All patients were right-handed, had no other ocular diseases, and met the criteria for amblyopia. Additionally, we recruited healthy controls who met the following criteria: 5 males and 6 females, aged 7 to 18 years, with consistent visual acuity in both eyes and BCVA better than 0.1 LogMAR, no ocular diseases, dominant right eyes, and right-handedness (Table S1).
Clinical Assessments
All participants underwent a comprehensive ophthalmological examination. Distance visual acuity was measured using a Standard Logarithm Visual Acuity Chart, and refraction was performed under rapid cycloplegia induced by 0.5% tropicamide eye drops (Bausch & Lomb, Inc.) to determine the best-corrected visual acuity (BCVA). Anterior segment assessment was conducted using a slit-lamp biomicroscope, followed by a routine fundus examination. Muscle balance was evaluated by examining ocular motility in the nine cardinal positions of gaze. Fusion control was assessed at near distance using the Worth 4-dot test. Sensory status and stereopsis were evaluated at near distance using the Titmus Original Stereo Fly Stereotest (Stereo Optical Co., Chicago, USA). Binocular function (BF) scores were used to extend the stereopsis scale. As previously described, BF scores were derived from the logarithmic values of the Stereotest and the Worth 4-dot test results (Table S2).7,48 Color vision was assessed using the Color Blindness Examination Chart (5th Edition; People’s Medical Publishing House, Beijing, China), confirming that all subjects had normal color vision. All functional examinations were conducted with full optical correction for each patient.
Apparatus
All visual stimuli were generated using the Opticka experiment framework49 and the Psychophysics Toolbox50 running in MATLAB R2023b (MathWorks, Natick, USA) on Ubuntu Linux V22.04. The stimuli were presented on an MR compatible LCD panel (SA-9939, Sinorad Medical; 1920×1080 px resolution, 60 Hz refresh rate) positioned at the end of the MRI bore, and viewed via a mirror mounted on the head coil. The viewing distance was 225 cm. The screen luminance was measured and stimuli calibrated using a spectrophotometer (SpectroCal II, Cambridge Research Graphics, UK). A tilted mirror placed above the participants’ eyes provided a full view of the screen. MRI-compatible glasses were used to correct each participant’s vision to their best-corrected visual acuity. Participants were introduced to the scanner equipment and what was going to happen, instructed to remain calm and avoid unnecessary movement in the MRI scanner, and were asked to maintain central fixation by focusing their attention on the central stimuli, thereby ensuring consistent convergence and accommodation throughout the trial. The subjects’ eyes were monitored using infrared cameras (MD-M100, Sinorad Medical) and observation of this video feed was used to ensure subjects were attentive and compliant during scanning. The central attention task consisted of a 0.4° visual shape (presented on top of a 0.5° gaussian smoothed mask that occluded the underlying stimulus) that changed at random between a triangle and a star every 3 to 5 seconds. Participants were instructed to respond to these changes with a keypress to maintain a good overall score.
Retinotopic Mapping
Given the limited time available for data collection with young children, we chose to use a simplified meridian mapping procedure based on the work of Greenberg et al51 45° square-wave checkerboard wedges (contrast = 1, presented on a 0.5 grey background) whose spatial frequency decreased across retinotopic extent phase reversed at 4Hz and were presented with an 18 second ON 18 seconds OFF time course repeated 16 times (8 vertical and 8 horizontal alternations, Figure 1a). The total mapping time was 324 seconds (5.4 minutes including an initial and final 18 second blank). Although we did not repeat the meridian mapping multiple times as in the original Greenberg procedure, our analysis revealed consistent and robust responses across ROIs, with high signal-to-noise ratio. We therefore believe that a single 324TRs run was sufficient for reliable estimation in our specific setup. Nevertheless, we acknowledge this limitation and suggest that future studies may benefit from including repeated runs.
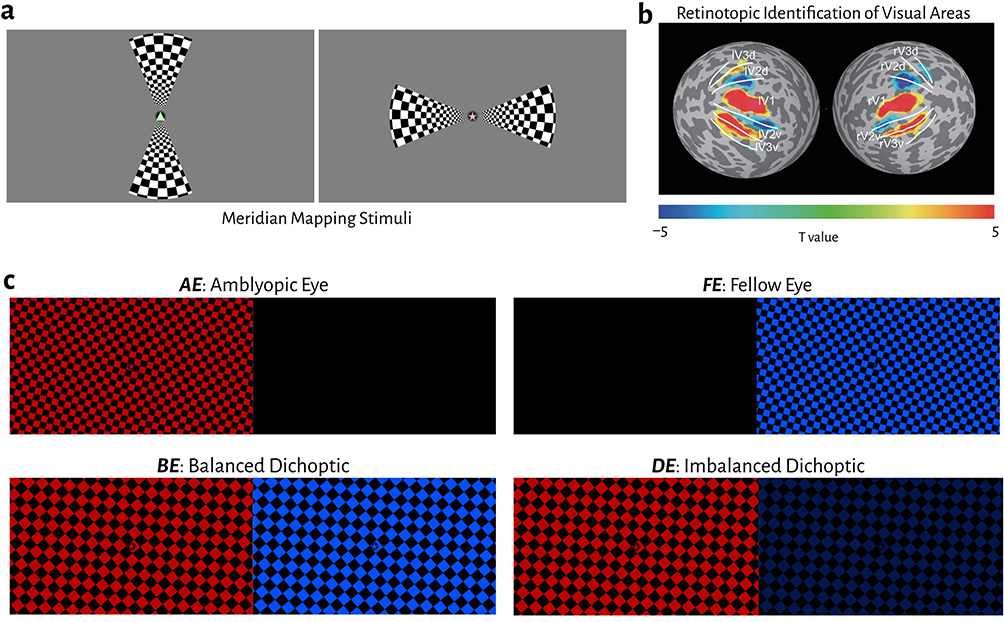 |
Figure 1 (a) Examples of the vertical and horizontal checkerboard wedges that were used to stimulate the visual meridians. At the centre of the display is a 0.4° triangle or star shape; this alternated every 3 to 5 seconds and subjects had to press a button when the changes occurred. (b) Results of the Meridian mapping in the group average, delineating dorsal and ventral domains of areas V1 to V3. (c) Dichoptic anaglyph presentation of a full-field animated checkerboard. The four conditions demonstrate sample frame inputs to the amblyopic/non-dominant and fellow/dominant eyes across AE, FE, BE and DE stimulation. The attention task was the same as in the mapping protocol. |
Visual Stimuli for Cortical Activation
To stimulate visual neurons across the early to intermediate visual areas, we used a square-wave checkerboard with both a slow oscillating change in spatial frequency (SF) alongside continual angular rotation (Figure 1b). The spatial frequency was sinusoidally modulated from 0.5 cycles/° to 1.4 cycles/° with a temporal frequency of 0.2 cycles/second. The angle was changed at a linear rate of 6 °/second. These slow changes in orientation and spatial frequency aimed to maximize stimulation of visual cortical cells while minimizing discomfort for our child subjects, as evidenced by pilot testing (subjects felt uncomfortable with either faster, more complex, or flickering stimuli).
To selectively stimulate the fellow eye (which is the dominant eye of control participants) and amblyopic eyes (which are the non-dominant eyes for control participants), participants wore anaglyph red-blue glasses. To minimize any cross-talk between the eyes (given the fact that filters do not perfectly isolate chromatic content) and balance the physical luminance output of the left and right-eye channels, we iteratively measured the display with the spectrophotometer across a range of RGB gain values. We identified the optimal left and right eye channel gains which were passed as parameters to the Psychophysics Toolbox’s anaglyph stereo–mode 8 (using the SetAnaglyphSteroParameters command). Subject maintained central fixation and performed the attention-maintenance task described above. A block design was employed in this study. The presentation sequence repeated 4 times was as follows: blank (16s) ⇨ AE (16s) ⇨ blank (16s) ⇨ FE (16s) ⇨ blank (16s) ⇨ BE (16s) ⇨ blank (16s) ⇨ DE (16s), for a total scan time of 512 seconds (8.8 minutes). MATLAB code with an operator GUI for running both the dual-axis meridian mapping and the stereoscopic visual stimulation is freely available at https://github.com/CogPlatform/binocularMRI.
MRI Sequence
Magnetic resonance imaging data were acquired on a 3 Tesla MRI scanner (Siemens Prisma) with a 64-channel receive 1-channel transmit head coil, in the Shanghai Jiao Tong University School of Medicine. High-resolution anatomical MRI was acquired with a T1w-MPRAGE sequence (1.0-mm isotropic voxels, 175 sagittal 1-mm thick slices, 256 × 256 matrix with 1.0-mm in-plane resolution, TR/TE = 2300/2.98 ms, FA = 9°, TI= 900 ms). Functional data were collected with a two-dimensional gradient-recalled echo-planar imaging (2D GE-EPI) sequence (2.0-mm isotropic voxels with 72 slices, TE = 37 ms, TR = 1 s, FOV = 104 × 104, FA = 52°, posterior -to- anterior phase encoding direction). Functional images with reversed phase encoding directions were acquired for distortion correction. In this experiment, the retinotopic mapping acquired 324 TRs, while the main experiment collected 512 TRs.
fMRI Data Analysis
Preprocessing
Magnetic resonance imaging data were preprocessed and analyzed with AFNI,52 FreeSurfer Version 6.0,53 and the mripy package developed in our lab (https://github.com/herrlich10/mripy). Preprocessing of EPI data includes slice timing correction, distortion correction (blip-up/down), rigid body motion correction, and per-run scaling as percent signal change. The anatomical volume was aligned to the mean of preprocessed EPI images (cost function: lpc). To minimize image blur, all spatial transformations were combined and applied to the functional images in one interpolation. General linear models using an HRF with short time-to-peak (Block4 in AFNI) were used to estimate BOLD signal change from baseline for each stimulus condition. Motion correction parameters were included as regressors of no interest. Cortical surface reconstruction steps were performed using FreeSurfer.
ROI Definition and Analysis
Regions of interest of cortical visual areas were defined on the cortical surface according to the meridian-mapping experiment. Regressors for vertical and horizontal meridian conditions were contrasted and resulting functional maps were thresholded (p <0.05). Borders between visual areas were then hand-drawn on the cortical surface by following the intermediate path of activation, based on peak activation levels, anteriorly from the occipital pole.
Group Comparison and Statistical Analysis
We performed all statistical analyses in JASP 0.19.1.54 The primary outcomes were the fMRI response magnitudes measured in visual cortical regions of interest (ROIs) under the four visual stimulation conditions, and the main objective was to test for effects of group (amblyopic patients vs. normal controls), stimulation condition, and their interaction. Secondary outcomes included demographic and clinical group comparisons, effect size estimation, and correlations between cortical activation measures and clinical variables.
For demographic and clinical variables, normality was assessed using the Shapiro–Wilk test and parametric tests were employed when data met normality assumptions; otherwise, non-parametric tests were applied. We used χ2 contingency table tests, two-sample t-tests or Wilcoxon signed-rank tests to compare demographic and clinical characteristics between the patient and control groups. Statistical significance was set at p <0.05 (though p values are provided unmodified to 3 decimal places or scientific notation for values <0.001), and summary values are presented as the mean ± one standard deviation (SD).
The MRI response magnitude data was visualized using raincloud plots, presenting the raw scatter plot alongside a summary box plot with mean diamond and median shown and density violin plots to better visualize group data.55 For comparisons within-group we used a repeated measures ANOVA (with post-hoc Tukey or Holm correction), and for comparisons between controls and patients a factorial ANOVA (with post-hoc Tukey or Holm corrected comparisons). Individual group normality was tested using Shapiro–Wilk, equal variances with Levene’s test and Sphericity with Mauchly’s test. If any subgroup was non-normal, we repeated the ANOVA using log-transformed data to verify the statistical values were unaffected. Statistical significance was set at p <0.05 (though p values are provided unmodified to 3 decimal places or scientific notation for values <0.001), and summary values are presented as the mean ± one standard deviation (SD) or mean ± 95% confidence/credible interval (CI) where appropriate. To identify how big the effects of our experimental manipulations were, we used Cohen’s d, rank biserial correlation and partial omega2 (ω2p). As a rule of thumb for Cohen’s d: >0.2 ≅ small, > 0.5 ≅ medium, > 0.8 ≅ large effect size. For ω2p: > 0.01 ≅ small, > 0.06 ≅ medium, and > 0.14 ≅ large effect size (though note Lakens 2013 for details).56 We use ‵, ‶ and ‷ notation in the figures to denote small, medium and large effect sizes respectively. Given the potential for type II errors with many post-hoc corrections in our repeated measures ANOVA, we additionally employed Bayes-factor analysis for cortical activation differences across stimulation paradigms between the two groups.
Statistical correlations were checked for multivariate normality (again using a Shapiro–Wilk test), and given non-normality, a Spearman’s ρ test was used to estimate monotonic relationships (p values were uncorrected).
Results
Demographic and Clinical Characteristics
We recruited 20 participants with anisometropic monocular amblyopia and 16 healthy controls. We had to exclude 6 (30%) patients and 5 (33%) controls due to either an incomplete session (could not maintain attention for the scan duration) or excessive movement in the scanner. 14 participants with anisometropic monocular amblyopia (3(21.4%) males, 11(78.6%) females; mean age: 10.71 ± 2.92) and 11 healthy controls with right-eye dominance (5(45%) males, 6(55%) females; mean age: 12.73 ± 2.72) were used in all subsequent analysis. As shown in Table 1, there were no significant differences between the patient and control groups in terms of sex (χ2(1) = 1.63, p =0.201, χ2 contingency table test) or age (t(23) = 1.76, p =0.093, independent sample t-test [Shapiro–Wilk p =0.082]). The BF scores (higher scores = worse binocular function) in the patient group (2.38 ± 0.50, ~1000 seconds of arc) were significantly higher than those in the control (1.6 ± 0.0, ~40 seconds of arc) group (t(13) = 5.87, p = 5.52 × 10⁻⁵, one sample t-test, d = 1.57); as were the logMAR values (W(13) = 105, p = 9.77 × 10⁻⁴, Wilcoxon signed-rank test [Shapiro–Wilk p =0.002], matched rank biserial effect size = 1.00).
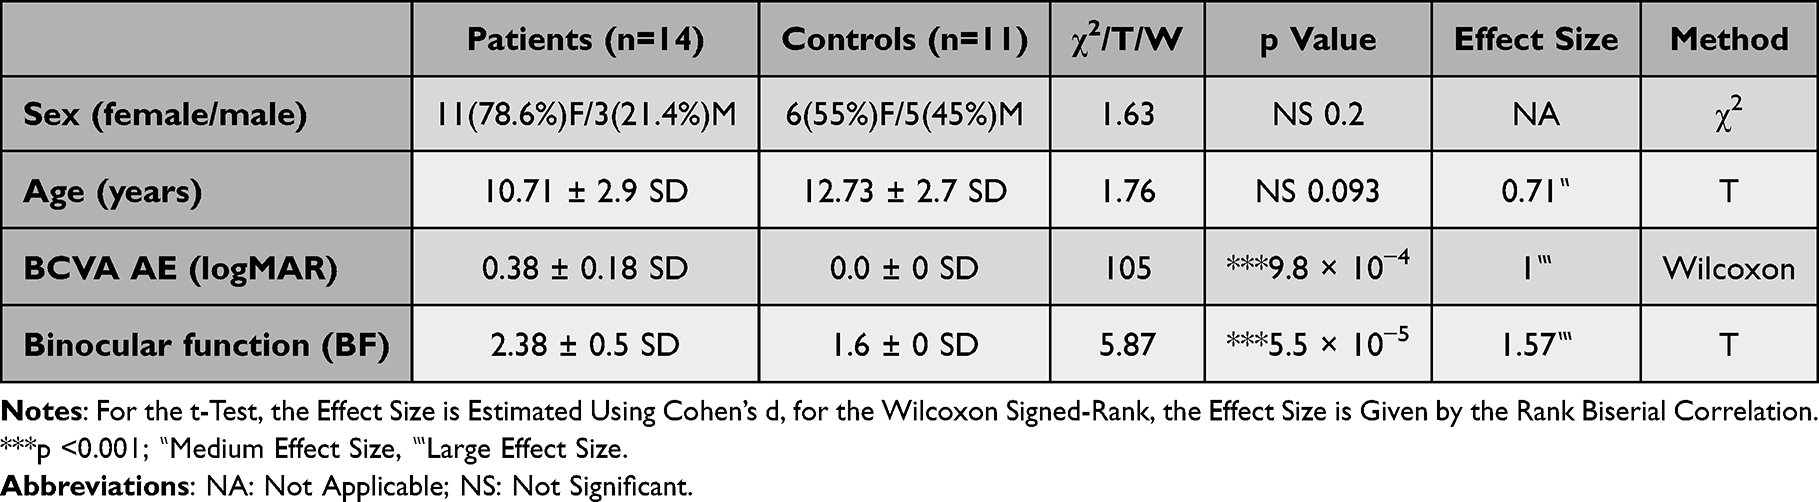 |
Table 1 Clinical Characteristics for the Patient and Control Population |
Differential fMRI Responses for Stimulus Conditions Across Visual Areas V1 to V3 in Control Participants
To delineate the dorsal and ventral sections of early visual areas V1 to V3, we first mapped visual responses using a simplified vertical + horizontal visual meridian mapping approach first used by Greenberg et al51. Given the limited attention and lower compliance to scanning with younger children, this quick mapping protocol used a double-wedge phase-reversing checkerboard (Figure 1a) to delineate only the visual meridians and thus the borders of these visual areas (Figure 1b). We used the borders to set ROIs for areas V1 to V3 for further analyses. Given the practical benefits and recent clinical utility of anaglyph dichoptic stimulation,47 we used Curesight red-blue glasses for all our central visual stimulation tasks. We first used a spectrophotometer with the red or blue filters to calibrate the RGB gains for the left and right eye anaglyph channels to equalize the physical luminance of the two eye channels and minimize any residual physical luminance signals from the non-stimulated eye. We used a full-field checkerboard that oscillated at a slow frequency across a range of spatial frequencies and rotated to provide broad spatiotemporal stimulation across the visual areas without creating too much visual fatigue (minimizing compliance issues in the scanner for our young participants). As visualized in Figure 1c we used the same visual stimulus under four different ocular stimulation conditions: AE – non-dominant eye only; FE – dominant eye only; BE – balanced dichoptic; and DE – contrast-imbalanced dichoptic stimuli.
Figure 2 plots the MRI signal strength as individual comparisons with visual area as the primary factor and the four stimulus conditions as the secondary factor in control participants. Raincloud plots combine raw scatter plots, box plots with both mean and median, and violin plots of the distribution. Visual inspection showed there were overall decreases in signal strength from V1 to V3, alongside potential differences in the response strengths between different ocular stimulation protocols. Using a repeated measures ANOVA and presenting effect sizes using ω2p (where > 0.01 ≅ small, > 0.06 ≅ medium, and > 0.14 ≅ large effect size), we found that there were indeed significant changes in the overall signal strength across stimulation classes (F(3) = 4.93, p =0.007, ω2p = 0.08), visual areas (F(2) = 45, p = 3.95 × 10⁻⁸, ω2p = 0.43) and their interaction (F(2.87) = 16.97, p = 2.00 × 10⁻⁶, ω2p = 0.03; Greenhouse-Geisser corrected). Holm corrected repeated measures ANOVA post-hoc tests with effect sizes measured using Cohen’s d (>0.2 ≅ small, > 0.5 ≅ medium, > 0.8 ≅ large effect size) for visual area showed significant differences between V1 and V2 (t(30) = 3.42, p =0.004, d = 1.29), V1 and V3 (t(30) = 4.93, p = 8.20 × 10⁻⁵, d = 1.85), but no significant difference between V2 and V3 (t(30) = 1.51, p =0.142). Post-hoc tests for ocular stimulation classes showed that that there were no significant differences between non-dominant (AE) and dominant (FE) eyes in controls (t(30) = 1.73, p =0.190), or between dominant (FE) and imbalanced-dichoptic (DE) eyes (t(30) = 0.17, p =0.870) or non-dominant (AE) and imbalanced-dichoptic (DE) eyes (t(30) = 2.15, p =0.118). But there were significant differences between AE and BE (t(30) = −4, p =0.002, d = −0.53), FE and BE (t(30) = −4.25, p = 9.7 × 10⁻⁴, d = −0.74) and between BE and DE (t(30) = 4.75, p = 2.84 × 10⁻⁴, d = 0.76). In summary, there were no significant differences between the dominant and non-dominant eye nor the monocular conditions with imbalanced-dichoptic stimulation, demonstrating that there is no significant cross-ocular suppression in control participants. The Cohen’s d effects sizes demonstrated that the biggest magnitude difference occurred between balanced (BE) and imbalanced-dichoptic (DE) stimulation (medium effect size d = 0.76).
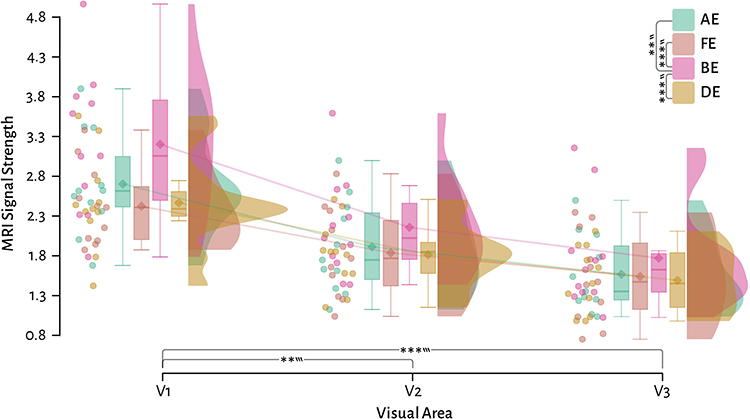 |
Figure 2 Control participant raincloud plots of the signal strength comparing the four stimulation classes across three visual areas. Solid lines link the group means across visual areas. ** = p <0.01, *** = p <0.001, Tukey post-hoc corrected repeated measures ANOVA. ‶ = medium effect size, ‷ = large effect size. |
Functional Abnormalities in the Visual Cortex of Amblyopic Patients
Next, we wished to evaluate the overall reductions in the visual response for amblyopic patients in comparison to control participants. Figure 3 shows the significant (p <0.05) group averaged BOLD signal change in both controls (left), and patients (right). Visual inspection of the response magnitudes suggests that there are differences across stimulus types and visual areas (with BE balanced dichoptic stimulation showing the most extensive activations). Notably, the extent and magnitude of the significant response voxels for patients appear attenuated compared to controls.
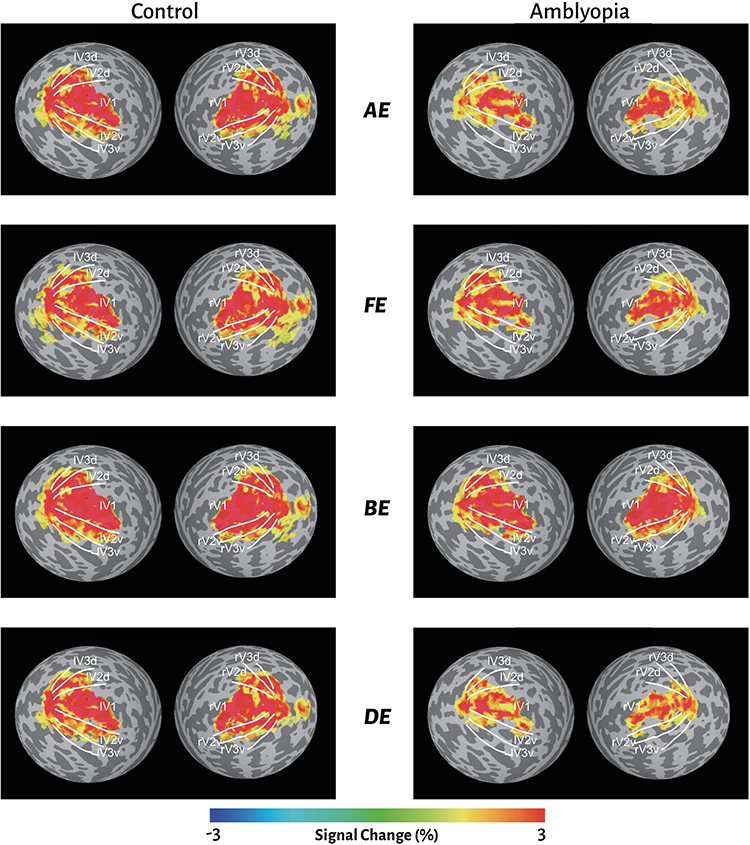 |
Figure 3 Overall fMRI signal change for control and amblyopic subjects across the four different stimulus conditions: AE – amblyopic-eye only; FE – fellow-eye only; BE – balanced dichoptic; DE – contrast-balanced dichoptic stimuli. |
To quantify these potential differences, we generated plots of the MRI signal strength responses with stimulus class as the primary factor and subject and visual area as the secondary factors (Figure 4a). We could observe that the decrease in MRI signal strength from V1 to V3 was also observed in patients, and the overall magnitude of this decrease was consistent with the control differences. For each visual area, it was also clear that the fMRI signal strengths were always lower in the patients compared to the control participants, as indicated by the 95% confidence intervals around the mean. We used a factorial ANOVA to quantify these differences, presenting effect sizes using ω2p (where > 0.01 ≅ small, > 0.06 ≅ medium, and > 0.14 ≅ large effect size). Overall, there were highly significant differences with medium to large effect size when comparing controls vs. patients (F(1) = 52.65, p = 4.05 × 10⁻¹², ω2p = 0.15), visual areas (F(2) = 66.39, p = 2.88 × 10⁻²⁴, ω2p = 0.3), and stimulus type (F(3) = 13.73, p = 2.27 × 10⁻⁸, ω2p = 0.11). There were no significant interactions between subject, visual area or stimulus type. Tukey post-hoc corrected tests demonstrated highly significant overall differences across stimulus conditions for patient compared to controls in V1 (t(276) = 4.85, p = 3.06 × 10⁻⁵, d = 0.98), V2 (t(276) = 3.71, p =0.003, d = 0.75) and V3 (t(276) = 4.01, p =0.001, d = 0.81).
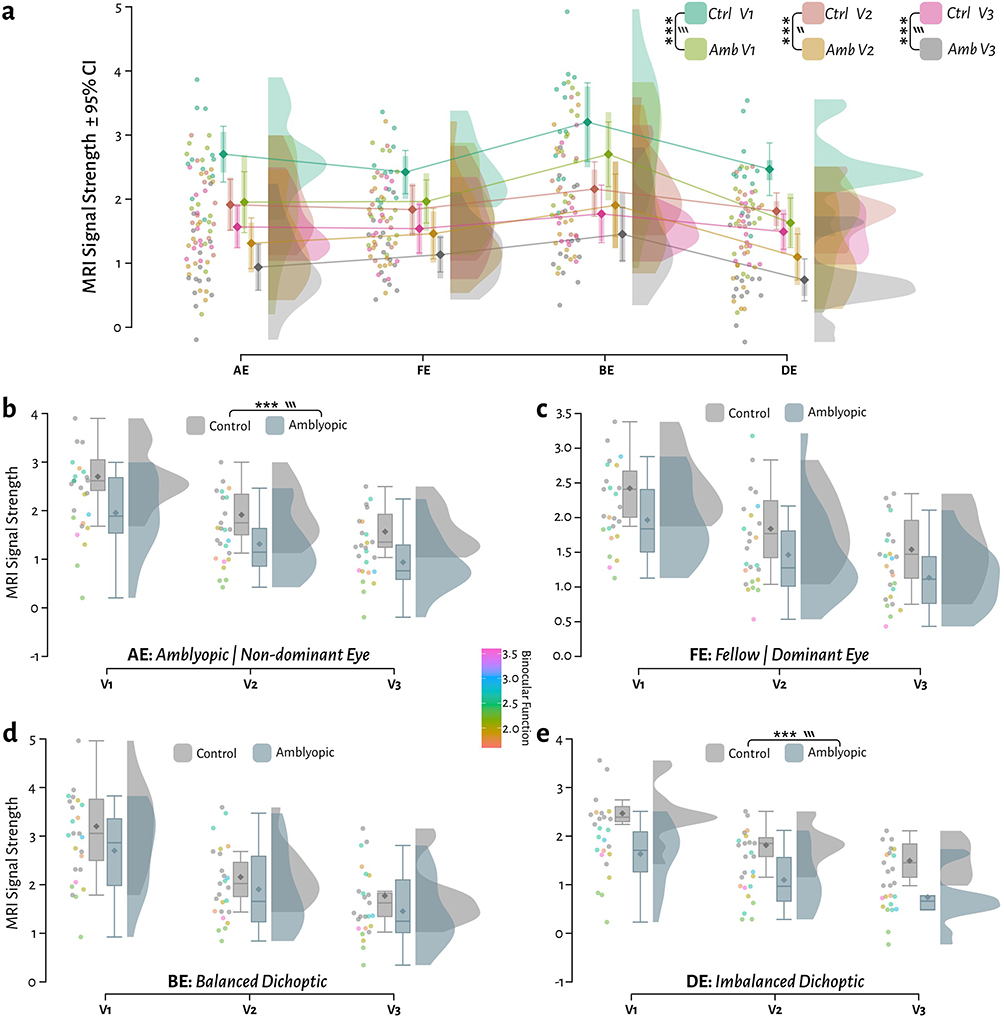 |
Figure 4 Comparison of the MRI signal strength between patients and controls across four stimulation protocols and three visual areas. (a) Raincloud plots with 95% confidence intervals around the mean with stimulus as the primary factor and area+subject as the secondary factor. (b) Same data replotted separating stimulus class with visual area as the primary factor and Binocular Function (BF) for patients as a covariate: AE stimulation of amblyopic eye only (in controls: the non-dominant eye). (c) FE: stimulation of fellow eye only (in controls: dominant eye). (d) BE: balanced dichoptic stimulation of both eyes. (e) DE: imbalanced-dichoptic stimulation. The binocular function scores (BF) are plotted as a covariate on the scatter points for patients only. *** = p <0.001, ‶ = medium effect, ‷ = large effect. |
Given the number of potential grouping factors, to better visualize the direct comparisons between control and amblyopic participants, we replotted these comparisons split by stimulus class (Figure 4b–e, showing separate raincloud plots for AE, FE, BE and DE respectively), and given that each patient’s binocular function may have an influence on potential MRI signal differences, we also plotted the BF for each subject as a covariate (individual point colour). Post-hoc Tukey corrected ANOVA tests comparing patients and controls demonstrated there were significant differences in AE responses (t(276) = 4.36, p = 4.93 × 10⁻⁴, d = 1.01), and DE responses (t(276) = 5.07, p = 2.00 × 10⁻⁵, d = 1.18), but not for FE (t(276) = 2.73, p =0.120) or BE (t(276) = 2.36, p =0.270). There were however no observable trends for the magnitude of individual points with binocular function (see correlation results below for further analysis).
Within the patient data, there was an overall main effect of visual area in patients (F = 52.77, p = 1.21 × 10⁻²¹, ω2p = 0.18, repeated measures ANOVA). Post-hoc Holm corrected comparisons within the patient data across stimulation types, indicated no significant differences between amblyopic (AE) and fellow (FE) eyes (t(39) = −1.45, p =0.154). There were however significant differences between AE and DE (DE lower; t(39) = 4.03, p = 5.00 × 10⁻⁴, d = 0.36), FE and DE (DE lower; t(39) = 4.44, p = 2.18 × 10⁻⁴, d = 0.53), AE and BE (AE lower; t(39) = −11.67, p = 1.35 ×10⁻¹³, d = −0.9), FE and BE (FE lower; t(39) = −6.49, p = 4.4 × 10⁻⁷, d = −0.72), and between BE and DE (DE lower; t(39) = 13.34, p = 2.45 × 10⁻¹⁵, d = 1.25).
To summarise, unlike in control participants, imbalanced-dichoptic stimulation significantly reduced cortical responses compared to either the amblyopic eye or fellow eye alone. Effect sizes again demonstrated that the biggest difference occurred between balanced and imbalanced-dichoptic stimulation (an effect size that was 1.65 times higher in amblyopic participants than in controls: 1.25 vs. 0.76).
To better probe the bidirectional importance of the effect size differences between patients and controls, we took advantage of a Bayes factor analysis57 that gives the probability of evidence from the effect size that supports OR rejects the null (H0) vs. alternate hypothesis (H1). We used BF10 in which a value > 1 provides anecdotal evidence there is a difference; > 3 provides moderate evidence; > 10 provides strong evidence etc. (and likewise < 1 provides anecdotal evidence for the H0, < ⅓ provides moderate evidence for the H0 etc).
Figure 5a–d plots the posterior distribution alongside the 95% credible intervals (CI) and evidential robustness of the Bayes factor for AE, FE, BE and DE respectively. We found very strong evidence for a difference between subjects and patients for the amblyopic eye stimulation (AE; BF10 = 51.16, median = 0.76 ± 0.3 ⇔ 1.2 CI), moderate evidence for a difference for fellow eye stimulation (FE; BF10 = 5.21, median = 0.6 ± 0.11 ⇔ 1.01 CI), and extremely strong evidence for a difference for imbalanced-dichoptic stimulation (DE; BF10 = 2760, median = 1.1 ± 0.57 ⇔ 1.56 CI). There was anecdotal evidence to support the null hypothesis for balanced dichoptic stimulation (BE; BF10 = 0.7, median = 0.32 ± −0.1 ⇔ 0.77 CI).
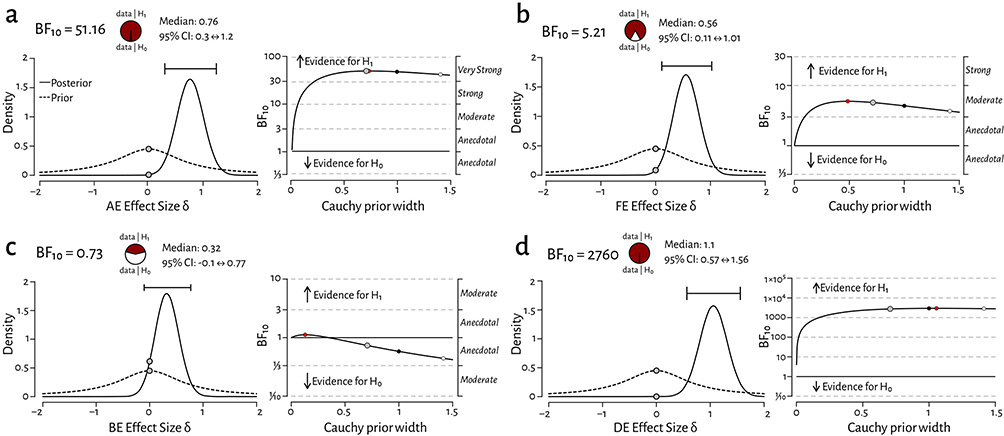 |
Figure 5 Bayes factor analysis plots comparing estimates with 95% credible intervals for control vs. patient responses for (a) amblyopic vs. non-dominant eye stimulation (AE BF10 = 51.16 [very strong]), (b) fellow vs. dominant eye stimulation (FE BF10 = 5.21 [moderate]), (c) balanced dichoptic stimulation (BE BF10 = 0.73 [anecdotal for H0]) and (d) imbalanced-dichoptic stimulation (DE BF10 = 2760 [extremely strong]). The left-side plots density estimates and 95% credible intervals of the effect size and the right-side plots evidence robustness across a range of priors (grey = standard prior, red = max prior, black = wide prior, white = ultra-wide prior). Grey dotted lines indicate the differing levels of evidence that either support or reject the hypothesis that control and patient medians differ. |
Correlation Analysis
We hypothesized that, given the significant differences in MRI signal strength across the ocular stimulation protocols we used (Figure 4), there may be a reduction in the correlation coefficients between stimuli comparing control participants with patients. We separated the responses for each stimulus type, and performed Spearman’s ρ correlation on the fMRI responses. Figure 6a and b plots the correlation heat–maps for control participants and patients respectively, showing that all stimulation pairs exhibit large correlations. Contrary to our hypothesis given that there were larger effect-size differences in the response strengths across the conditions in patients (Figures 4 and 5), we nevertheless found large correlations between all the stimulation condition pairs in our patients (Figure 6b).
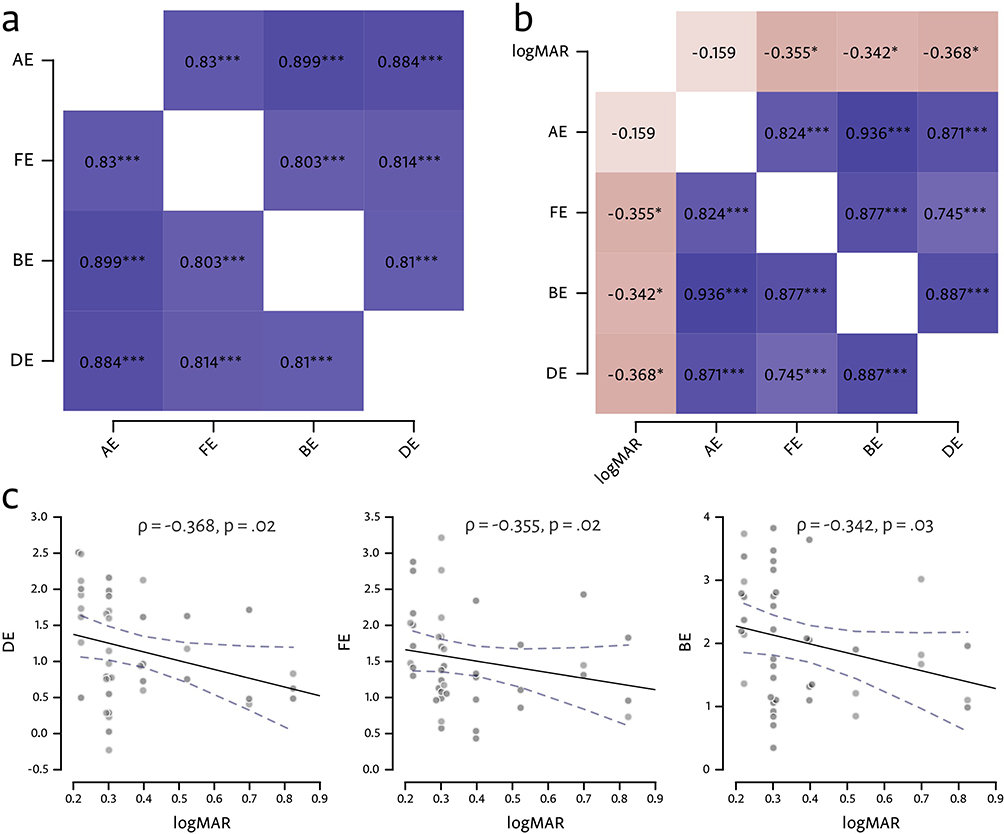 |
Figure 6 Spearman’s ρ correlation results. (a) Correlation heat–map for MRI signal strength between the four stimulation conditions in control participants. *** = p <0.001 (uncorrected). (b) Correlation heat–map of MRI signal strength between the four stimulation conditions in patients. In addition, correlations are shown between the patients’ logMAR acuity measurements and signal strength for each condition. * = p <0.05; *** = p <0.001 (uncorrected). (c) Correlation plots for the largest correlations between logMAR and DE, FE and BE, respectively; dotted line = 95% regression confidence interval. |
In addition, we also wished to better understand the covariation of MRI signal strength with binocular function (c.f. Figure 4 where BF scores show weak relationships to the fMRI signal strength). We therefore checked whether there was any relationship between the patient’s acuity deficits measured using logMAR and the signal strength in the four stimulus classes as part of the Spearman’s ρ correlation matrix. Figure 6b shows that there were weak correlations for FE, BE and DE conditions. The correlation plots for the largest correlations are shown in Figure 6c. Although BF scores in the amblyopic group were significantly higher than those in the control group, only very weak correlation were found between logMAR scores and fMRI signal strengths.
Discussion
This study utilized a streamlined fMRI protocol to evaluate cortical responses in children with anisometropic amblyopia across monocular and dichoptic conditions. These findings confirmed that amblyopic patients exhibited attenuated responses in visual areas V1, V2, and V3 compared to controls under all stimulus conditions. In amblyopic patients, the largest effect size was observed between balanced and imbalanced-dichoptic stimuli (d = 1.25), suggesting that amblyopic patients have more difficulty processing imbalanced-dichoptic stimulation compared to controls.
The therapeutic principle of monocular occlusion therapy is to cover the dominant eye, thereby increasing visual stimulation to the amblyopic eye.58,59 The principle of binocular treatment however involves both eyes simultaneously viewing, with high-contrast or more salient stimuli presented to the amblyopic eye and low-contrast or distractor stimuli to the dominant eye, forcing information from both eyes to better cooperate in completing visual tasks.28 In this study, we used monocular stimulation of the amblyopic eye to simulate monocular occlusion therapy and imbalanced-dichoptic stimulation to simulate binocular treatment. By analyzing changes in neural activity in the V1, V2, and V3 regions under both stimulation methods, we aimed to explore how these two treatments have different effects on the visual cortex in the same subjects. The results showed that in control participants, there was no significant difference in V1, V2, and V3 activation levels between amblyopic eye stimulation and fellow eye stimulation, which is consistent with previous findings.60,61 However, unlike previous studies, which found that in patients with anisometropic amblyopia, the activation of the visual cortex in the amblyopic eye was significantly lower than that of the fellow eye when presented with a 30% contrast black-and-white checkerboard stimulus, or with a 22% contrast sinusoidal grating stimulus,14 our study showed no significant difference between patients and controls. This discrepancy may be linked to the fact that we used 100% contrast visual stimuli (as this is what is used in clinical interventions), potentially saturating the neurons in the visual cortex (though note Hess and colleagues62 argue that high-contrast stimuli are predominantly affected in both strabismic and anisometropic amblyopes).
A common method for measuring binocular function is to assess changes in signal intensity when visual stimuli are presented to both eyes rather than just one. When using low-contrast grating stimuli, it was found that compared to monocular stimulation, binocular stimulation in normal observers increased activation by approximately 1.4 to 1.8 times, which is consistent with our findings.63,64 Furthermore, our study demonstrated that although interocular suppression in the amblyopic eye of patients with anisometropic amblyopia may hinder binocular interaction, leading to binocular dysfunction, binocular interaction is not entirely absent.65,66 Visual cortical activation during binocular stimulation was still significantly higher with medium to large effect sizes than both monocular as well as imbalanced-dichoptic stimulation.
Although there were greater disparities in the overall fMRI signals for patients compared to controls, correlation analysis showed that different ocular responses remained strong. Furthermore, while amblyopic patients had significantly lower BF scores compared to control participants, there was little evidence that BF scores covaried with fMRI signal strength (Figure 4b). This result overlaps with the results of Li and colleagues15 who found no strong correlation between fMRI deficits and psychophysical contrast sensitivity. Understanding the underlying reasons that cause this discrepancy will require further study. Previous research has mainly compared brain activation between amblyopic and control groups during monocular and binocular stimulation.67,68
This study has several limitations. First, we only examined early visual areas V1, V2, and V3. There are interesting anisotropies in the maturation of neuronal tuning in early areas like V1, compared to overall visual function, and it seems likely that population activity across higher visual areas better correlates to perceptual function.4 Therefore, other extrastriate areas must remain an active target of future work. For example, imaging studies have shown that other regions like V3a and V7 play important roles in stereoscopic function.69,70 In patients with impaired stereoscopic vision, activation in the V3a and V7 regions is significantly reduced, and in those whose stereoscopic function improves after treatment, V3a activation increases.71 Given the important role of the visual thalamic LGN in overall visual function and known binocular interactions,72–74 alongside evidence of deficits in amblyopes,75–77 this also remains an important future target. Targeting the LGN requires the use of higher-field strength scanners to better isolate and identify the laminar profile of this deeper brain structure.75,77 More precise retinotopic mapping significantly increase scanning time,78 so this will need to be carefully balanced against younger patient’s compliance. A second challenge is the technical limitation of delivering binocular stimuli in the MRI scanner. We used anaglyph (spectral multiplexing) stereo for two reasons: (1) given its simplicity and low cost it remains a popular tool for clinical interventions like Curesight (as patients can more easily use binocular stimulation at home), and (2) direct MRI compatibility. However, anaglyph stereo suffers substantial crosstalk (when images from one eye are partially visible to the other eye, causing significant perceptual degradation), ranging from 3% for dedicated research displays79 to 14 to 30% for standard LCD panels,80,81 and mitigation requires careful design of both display and filters. Anaglyph presentation also substantially reduces the overall luminance79 Most critically, given evidence supporting the greater impact of Amblyopia on the parvocellular system,79 anaglyph presentation not only effectively removes most chromatic information, it distributes colour contrast unnaturally across eye channels, greatly interfering with the opponent coding channels that serve as the foundation for parvocellular form vision.82–85 Stereoscopes can be used in the scanner with some limitations,86 and recent improvements in dichoptic head-mounted displays (HMDs) offer a promising alternative. In our binocular dichoptic stimulation model, given limited time to test children, the contrast for the fellow eye of all amblyopic patients was fixed at 15%, without adjusting based on the participants’ personal thresholds. Individualized measurements based on the subject’s contrast threshold could improve inter-subject variance during measurement and the potential efficacy of treatment. Finally, the current investigation was restricted to children with anisometropic amblyopia and utilized a modest sample size, warranting caution when extrapolating these results to more diverse patient populations.
In summary, our findings demonstrated that there are significant differences in the effects of monocular and binocular stimulation on neural activity in the visual cortex, primarily reflected in the activation levels of visual areas. We also demonstrated that the magnitude of significantly impaired functional activation is maximal for imbalanced-dichoptic inputs. This study affords insight into comparative neural population activity and serves as a preliminary reference for future research investigating the mechanisms of different therapeutic interventions.
Ethics Statement
This study was approved by the Ethics Committee of the Shanghai Children’s Medical Center, affiliated with the Shanghai Jiao Tong University School of Medicine (Approval No: SCMCIRB-K2023103-l, Registration number: ChiCTR2300077880).
Author Contributions
All authors made a significant contribution to the work reported, whether that is in the conception, study design, execution, acquisition of data, analysis and interpretation, or in all these areas; took part in drafting, revising or critically reviewing the article; gave final approval of the version to be published; have agreed on the journal to which the article has been submitted; and agree to be accountable for all aspects of the work.
Funding
This work was supported by the National Natural Science Foundation of China (grant 81770957, grants 32070992, 32150410370 and grant 32100859), Pudong New Area Municipal Health Bureau (grant PW2020E-3), and the Program of the Shanghai Natural Science Foundation (grant 23ZR1459200).
Disclosure
Yuanyang Huang, Shu Wang, and Yazhu Qian are co-first authors for this study. The authors report no conflicts of interest in this work.
References
1. Dowling J. Amblyopia: Challenges and Opportunities, International Retinal Research Foundation. 2017.
2. US Preventive Services Task Force, Grossman DC, Curry SJ, Owens DK, et al. Vision Screening in Children Aged 6 Months to 5 Years: US Preventive Services Task Force Recommendation Statement. JAMA. 2017;318(9):836–16. doi:10.1001/jama.2017.11260.
3. Maurer D, McKEE SP. Classification and diversity of amblyopia. Vis Neurosci. 2018;35:E012. doi:10.1017/S0952523817000190
4. Kiorpes L. The Puzzle of Visual Development: behavior and Neural Limits. J Neurosci. 2016;36(45):11384–11393. doi:10.1523/JNEUROSCI.2937-16.2016
5. Levi DM. Visual processing in amblyopia: human studies. Strabismus. 2006;14(1):11–19. doi:10.1080/09273970500536243
6. McKee SP, Levi DM, Movshon JA. The pattern of visual deficits in amblyopia. J Vis. 2003;3(5):380–405. doi:10.1167/3.5.5
7. Webber AL, Wood JM, Thompson B, Birch EE. From suppression to stereoacuity: a composite binocular function score for clinical research. Ophthalmic Physiol Opt. 2019;39(1):53–62. doi:10.1111/opo.12599
8. Bui Quoc E, Kulp MT, Burns JG, Thompson B. Amblyopia: a review of unmet needs, current treatment options, and emerging therapies. Survey Ophthalmol. 2023;68(3):507–525. doi:10.1016/j.survophthal.2023.01.001
9. Brown HDH, Woodall RL, Kitching RE, Baseler HA, Morland AB. Using magnetic resonance imaging to assess visual deficits: a review. Ophthalmic Physiol Opt. 2016;36(3):240–265. doi:10.1111/opo.12293
10. Wang Y, Wu Y, Luo L, Li F. Structural and functional alterations in the brains of patients with anisometropic and strabismic amblyopia: a systematic review of magnetic resonance imaging studies. Neural Regen Res. 2023;18(11):2348–2356. doi:10.4103/1673-5374.371349
11. Wang G, Liu L. Amblyopia: progress and promise of functional magnetic resonance imaging. Graefes Arch Clin Exp Ophthalmol. 2023;261(5):1229–1246. doi:10.1007/s00417-022-05826-z
12. Algaze A, Roberts C, Leguire L, Schmalbrock P, Rogers G. Functional magnetic resonance imaging as a tool for investigating amblyopia in the human visual cortex: a pilot study. J AAPOS. 2002;6(5):300–308. doi:10.1067/mpa.2002.124902
13. Barnes GR, Hess RF, Dumoulin SO, Achtman RL, Pike GB. The cortical deficit in humans with strabismic amblyopia. J Physiol. 2001;533(1):281–297. doi:10.1111/j.1469-7793.2001.0281b.x
14. Goodyear BG, Nicolle DA, Humphrey GK, Menon RS. BOLD fMRI response of early visual areas to perceived contrast in human amblyopia. J Neurophysiol. 2000;84(4):1907–1913. doi:10.1152/jn.2000.84.4.1907
15. Li X, Dumoulin SO, Mansouri B, Hess RF. Cortical deficits in human amblyopia: their regional distribution and their relationship to the contrast detection deficit. Invest Ophthalmol Vis Sci. 2007;48(4):1575–1591. doi:10.1167/iovs.06-1021
16. Shao Y, Li Q-H, Li B, et al. Altered brain activity in patients with strabismus and amblyopia detected by analysis of regional homogeneity: a resting‑state functional magnetic resonance imaging study. Mol Med Rep. 2019;19(6):4832–4840. doi:10.3892/mmr.2019.10147
17. Thompson B, Villeneuve MY, Casanova C, Hess RF. Abnormal cortical processing of pattern motion in amblyopia: evidence from fMRI. Neuroimage. 2012;60(2):1307–1315. doi:10.1016/j.neuroimage.2012.01.078
18. Wu K-R, Yu Y-J, Tang L-Y, et al. Altered Brain Network Centrality in Patients with Adult Strabismus with Amblyopia: a Resting-State Functional Magnetic Resonance Imaging (fMRI) Study. Med Sci Monit. 2020;26:e925856. doi:10.12659/MSM.925856
19. El-Shamayleh Y, Kiorpes L, Kohn A, Movshon JA. Visual motion processing by neurons in area MT of macaque monkeys with experimental amblyopia. J Neurosci. 2010;30(36):12198–12209. doi:10.1523/JNEUROSCI.3055-10.2010
20. Shooner C, Hallum LE, Kumbhani RD, et al. Population representation of visual information in areas V1 and V2 of amblyopic macaques. Vision Res. 2015;114:56–67. doi:10.1016/j.visres.2015.01.012
21. Tao X, Zhang B, Shen G, et al. Early monocular defocus disrupts the normal development of receptive-field structure in V2 neurons of macaque monkeys. J Neurosci. 2014;34(41):13840–13854. doi:10.1523/JNEUROSCI.1992-14.2014
22. Wang Y, Zhang B, Tao X, Wensveen JM, Smith EL, Chino YM. Noisy Spiking in Visual Area V2 of Amblyopic Monkeys. J Neurosci. 2017;37(4):922–935. doi:10.1523/JNEUROSCI.3178-16.2016
23. Gupta S, Kumaran SS, Saxena R, Gudwani S, Menon V, Sharma P. BOLD fMRI and DTI in strabismic amblyopes following occlusion therapy. Int Ophthalmol. 2016;36(4):557–568. doi:10.1007/s10792-015-0159-2
24. Hensch TK, Quinlan EM. Critical periods in amblyopia. Vis Neurosci. 2018;35:E014. doi:10.1017/S0952523817000219
25. Holmes JM, Levi DM. Treatment of amblyopia as a function of age. Vis Neurosci. 2018;35:E015. doi:10.1017/S0952523817000220
26. Birch EE, Duffy KR. Leveraging neural plasticity for the treatment of amblyopia. Surv Ophthalmol. 2024;69(5):818–832. doi:10.1016/j.survophthal.2024.04.006
27. Hess RF, Mansouri B, Thompson B. A binocular approach to treating amblyopia: antisuppression therapy. Optom Vis Sci. 2010;87(9):697–704. doi:10.1097/OPX.0b013e3181ea18e9
28. Hess RF, Thompson B. Amblyopia and the binocular approach to its therapy. Vision Res. 2015;114:4–16. doi:10.1016/j.visres.2015.02.009
29. Thompson B, Concetta Morrone M, Bex P, Lozama A, Sabel BA. Harnessing brain plasticity to improve binocular vision in amblyopia: an evidence-based update. Eur J Ophthalmol. 2023;2023:11206721231187426. doi:10.1177/11206721231187426
30. Birch EE, Morale SE, Jost RM, Cheng-Patel CS, Kelly KR. Binocular amblyopia treatment improves manual dexterity. J AAPOS. 2023;27(1):18. doi:10.1016/j.jaapos.2022.10.006
31. Bossi M, Tailor VK, Anderson EJ, et al. Binocular Therapy for Childhood Amblyopia Improves Vision Without Breaking Interocular Suppression. Invest Ophthalmol Vis Sci. 2017;58(7):3031–3043. doi:10.1167/iovs.16-20913
32. Dahlmann-Noor AH, Greenwood JA, Skilton A, et al. Phase 2a randomised controlled feasibility trial of a new “balanced binocular viewing” treatment for unilateral amblyopia in children age 3–8 years: trial protocol. BMJ Open. 2022;12(5):e051423. doi:10.1136/bmjopen-2021-051423
33. Guo CX, Babu RJ, Black JM, et al. Binocular treatment of amblyopia using videogames (BRAVO): study protocol for a randomised controlled trial. Trials. 2016;17(1):504. doi:10.1186/s13063-016-1635-3
34. Hou C, Nicholas SC. Perceptual learning with dichoptic attention tasks improves attentional modulation in V1 and IPS and reduces interocular suppression in human amblyopia. Sci Rep. 2022;12(1):9660. doi:10.1038/s41598-022-13747-4
35. Jin L, Fang Y, Jin C. Binocular treatment for individual with amblyopia: a systematic review and meta-analysis. Medicine. 2022;101(27):e28975. doi:10.1097/MD.0000000000028975
36. Jost RM, Birch EE, Wang YZ, et al. Patch-free streaming contrast-rebalanced dichoptic cartoons versus patching for treatment of amblyopia in children aged 3 to 5 years: a pilot, randomized clinical trial. J AAPOS. 2024;28(5):103991. doi:10.1016/j.jaapos.2024.103991
37. Kelly KR, Jost RM, Dao L, Beauchamp CL, Leffler JN, Birch EE. Binocular iPad Game vs Patching for Treatment of Amblyopia in Children: a Randomized Clinical Trial. JAMA Ophthalmol. 2016;134(12):1402–1408. doi:10.1001/jamaophthalmol.2016.4224
38. Li SL, Reynaud A, Hess RF, et al. Dichoptic movie viewing treats childhood amblyopia. J AAPOS. 2015;19(5):401–405. doi:10.1016/j.jaapos.2015.08.003
39. Pediatric Eye Disease Investigator Group. Holmes JM, Manny RE, Lazar EL, et al. A Randomized Trial of Binocular Dig Rush Game Treatment for Amblyopia in Children Aged 7 to 12 Years. Ophthalmology. 2019;126(3):456–466. doi:10.1016/j.ophtha.2018.10.032.
40. Rajavi Z, Soltani A, Vakili A, et al. Virtual Reality Game Playing in Amblyopia Therapy: a Randomized Clinical Trial. J Pediatr Ophthalmol Strabismus. 2021;58(3):154–160. doi:10.3928/01913913-20210108-02
41. Roda M, Pellegrini M, Di Geronimo N, Vagge A, Fresina M, Schiavi C. Binocular treatment for amblyopia: a meta-analysis of randomized clinical trials. PLoS One. 2021;16(10):e0257999. doi:10.1371/journal.pone.0257999
42. Tailor V, Ludden S, Bossi M, Bunce C, Greenwood JA, Dahlmann-Noor A. Binocular versus standard occlusion or blurring treatment for unilateral amblyopia in children aged three to eight years. Cochrane Database Syst Rev. 2022;2(2):CD011347. doi:10.1002/14651858.CD011347.pub3
43. CureSight Pivotal Trial Group. Wygnanski-Jaffe T, Kushner BJ, Moshkovitz A, Belkin M, Yehezkel O. High-Adherence Dichoptic Treatment Versus Patching in Anisometropic and Small Angle Strabismus Amblyopia: a Randomized Controlled Trial. Am J Ophthalmol. 2025;269:293–302. doi:10.1016/j.ajo.2024.08.011.
44. Xiao S, Gaier ED, Mazow ML, et al. Improved adherence and treatment outcomes with an engaging, personalized digital therapeutic in amblyopia. Sci Rep. 2020;10(1):8328. doi:10.1038/s41598-020-65234-3
45. Zhu W, Tian T, Yehezkel O, et al. A Prospective Trial to Assess the Efficacy of Eye-Tracking-Based Binocular Treatment versus Patching for Children’s Amblyopia: a Pilot Study. Semin Ophthalmol. 2023;38(8):761–767. doi:10.1080/08820538.2023.2223275
46. Hess RF. Towards a principled and efficacious approach to the treatment of amblyopia. A review. Vision Res. 2025;226:108503. doi:10.1016/j.visres.2024.108503
47. CureSight Pivotal Trial Group. Wygnanski-Jaffe T, Kushner BJ, Moshkovitz A, Belkin M, Yehezkel O. An Eye-Tracking-Based Dichoptic Home Treatment for Amblyopia: a Multicenter Randomized Clinical Trial. Ophthalmology. 2023;130(3):274–285. doi:10.1016/j.ophtha.2022.10.020
48. Xi S, Yao J, Zhang S, et al. Disrupted neural signals in patients with concomitant exotropia. Ophthalmic Physiol Opt. 2020;40(5):650–659. doi:10.1111/opo.12715
49. Andolina IM Opticka: Behavioural Research Software. Zenodo. 2023 doi:10.5281/zenodo.592253.
50. Kleiner M, Brainard DH, Pelli D, et al. What’s new in psychtoolbox-3. Perception. 2007;36:1.
51. Greenberg AS, Verstynen T, Chiu YC, Yantis S, Schneider W, Behrmann M. Visuotopic cortical connectivity underlying attention revealed with white-matter tractography. J Neurosci. 2012;32(8):2773–2782. doi:10.1523/JNEUROSCI.5419-11.2012
52. Cox RW. AFNI: software for analysis and visualization of functional magnetic resonance neuroimages. Comput Biomed Res. 1996;29(3):162–173. doi:10.1006/cbmr.1996.0014
53. Fischl B. FreeSurfer. Neuroimage. 2012;62(2):774–781. doi:10.1016/j.neuroimage.2012.01.021
54. JASP Team. JASP open source statistical software (version 0.19.1). 2024. Available from: https://jasp-stats.org.
55. Allen M, Poggiali D, Whitaker K, Marshall TR, van Langen J, Kievit RA. Raincloud plots: a multi-platform tool for robust data visualization. Wellcome Open Res. 2019;4:63. doi:10.12688/wellcomeopenres.15191.2
56. Lakens D. Calculating and reporting effect sizes to facilitate cumulative science: a practical primer for t-tests and ANOVAs. Front Psychol. 2013;4:863. doi:10.3389/fpsyg.2013.00863
57. Johnson VE, Pramanik S, Shudde R. Bayes factor functions for reporting outcomes of hypothesis tests. Proc Natl Acad Sci U S A. 2023;120(8):e2217331120. doi:10.1073/pnas.2217331120
58. Papageorgiou E, Asproudis I, Maconachie G, Tsironi EE, Gottlob I. The treatment of amblyopia: current practice and emerging trends. Graefes Arch Clin Exp Ophthalmol. 2019;257(6):1061–1078. doi:10.1007/s00417-019-04254-w
59. Maconachie GDE, Gottlob I. The challenges of amblyopia treatment. Biomed J. 2015;38(6):510–516. doi:10.1016/j.bj.2015.06.001
60. Li C, Cheng L, Yu Q, Xie B, Wang J. Relationship of visual cortex function and visual acuity in anisometropic amblyopic children. Int J Med Sci. 2012;9(1):115–120. doi:10.7150/ijms.9.115
61. Huang Y, Feng L, Zhou Y. Reduced response cluster size in early visual areas explains the acuity deficit in amblyopia. Neuroreport. 2017;28(7):397–403. doi:10.1097/WNR.0000000000000767
62. Hess RF, Li X, Lu G, Thompson B, Hansen BC. The contrast dependence of the cortical fMRI deficit in amblyopia; a selective loss at higher contrasts. Hum Brain Mapp. 2010;31(8):1233–1248. doi:10.1002/hbm.20931
63. Campbell FW, Green DG. Monocular versus binocular visual acuity. Nature. 1965;208(5006):191–192. doi:10.1038/208191a0
64. Meese TS, Georgeson MA, Baker DH. Binocular contrast vision at and above threshold. J Vis. 2006;6(11):1224–1243. doi:10.1167/6.11.7
65. Birch EE. Amblyopia and binocular vision. Prog Retin Eye Res. 2013;33:67–84. doi:10.1016/j.preteyeres.2012.11.001
66. Baker DH, Meese TS, Mansouri B, Hess RF. Binocular summation of contrast remains intact in strabismic amblyopia. Invest Ophthalmol Vis Sci. 2007;48(11):5332–5338. doi:10.1167/iovs.07-0194
67. Joly O, Frankó E. Neuroimaging of amblyopia and binocular vision: a review. Front Integr Neurosci. 2014;8:62. doi:10.3389/fnint.2014.00062
68. Choi MY, Lee KM, Hwang JM, et al. Comparison between anisometropic and strabismic amblyopia using functional magnetic resonance imaging. Br J Ophthalmol. 2001;85(9):1052–1056. doi:10.1136/bjo.85.9.1052
69. Preston TJ, Li S, Kourtzi Z, Welchman AE. Multivoxel pattern selectivity for perceptually relevant binocular disparities in the human brain. J Neurosci. 2008;28(44):11315–11327. doi:10.1523/JNEUROSCI.2728-08.2008
70. Tsao DY, Vanduffel W, Sasaki Y, et al. Stereopsis activates V3A and caudal intraparietal areas in macaques and humans. Neuron. 2003;39(3):555–568. doi:10.1016/s0896-6273(03)00459-8
71. Xi S, Zhou Y, Yao J, et al. Cortical Deficits are Correlated with Impaired Stereopsis in Patients with Strabismus. Neurosci Bull. 2023;39(7):1039–1049. doi:10.1007/s12264-022-00987-7
72. D K, Mc S, M A. Binocular response modulation in the lateral geniculate nucleus. J Comparative Neurol. 2019;527(3). doi:10.1002/cne.24417
73. Stacy AK, Van Hooser SD. Development of Functional Properties in the Early Visual System: new Appreciations of the Roles of Lateral Geniculate Nucleus. Curr Top Behav Neurosci. 2022;53:3–35. doi:10.1007/7854_2021_297
74. Weyand TG. The multifunctional lateral geniculate nucleus. Rev Neurosci. 2016;27(2):135–157. doi:10.1515/revneuro-2015-0018
75. Hess RF, Thompson B, Gole GA, Mullen KT. The amblyopic deficit and its relationship to geniculo-cortical processing streams. J Neurophysiol. 2010;104(1):475–483. doi:10.1152/jn.01060.2009
76. Barnes GR, Li X, Thompson B, Singh KD, Dumoulin SO, Hess RF. Decreased gray matter concentration in the lateral geniculate nuclei in human amblyopes. Invest Ophthalmol Vis Sci. 2010;51(3):1432–1438. doi:10.1167/iovs.09-3931
77. Wen W, Wang Y, Zhou J, et al. Loss and enhancement of layer-selective signals in geniculostriate and corticotectal pathways of adult human amblyopia. Cell Rep. 2021;37(11):110117. doi:10.1016/j.celrep.2021.110117
78. Benson NC, Jamison KW, Arcaro MJ, et al. The Human Connectome Project 7 Tesla retinotopy dataset: description and population receptive field analysis. J Vis. 2018;18(13):23. doi:10.1167/18.13.23
79. Baker DH, Kaestner M, Gouws AD. Measurement of crosstalk in stereoscopic display systems used for vision research. J Vis. 2016;16(15):14. doi:10.1167/16.15.14
80. Woods AJ, Harris CR. Comparing Levels of Crosstalk with Red/Cyan, Blue/Yellow, and Green/Magenta Anaglyph 3D Glasses. In: Woods AJ, Holliman NS, Dodgson NA, editors. Comparing Levels of Crosstalk with Red/Cyan, Blue/Yellow, and Green/Magenta Anaglyph 3D Glasses, SPIE. 26. 2010.
81. Woods AJ. Crosstalk in stereoscopic displays: a review. J Electron Imaging. 2012;21:040902.
82. Conway BR. Color vision, cones, and color-coding in the cortex. Neuroscientist. 2009;15(3):274–290. doi:10.1177/1073858408331369
83. Horwitz GD. Signals Related to Color in the Early Visual Cortex. Annu Rev Vis Sci. 2020;6:287–311. doi:10.1146/annurev-vision-121219-081801
84. Liu Y, Li M, Zhang X, et al. Hierarchical Representation for Chromatic Processing across Macaque V1, V2, and V4. Neuron. 2020;108(3):538–550.e5. doi:10.1016/j.neuron.2020.07.037
85. Sincich LC, Horton JC. The circuitry of V1 and V2: integration of color, form, and motion. Annu Rev Neurosci. 2005;28:303–326. doi:10.1146/annurev.neuro.28.061604.135731
86. Ip IB, Alvarez I, Tacon M, Parker AJ, Bridge H. MRI Stereoscope: a Miniature Stereoscope for Human Neuroimaging. eNeuro. 2022;9(1):0382. doi:10.1523/ENEURO.0382-21.2021
 © 2026 The Author(s). This work is published and licensed by Dove Medical Press Limited. The
full terms of this license are available at https://www.dovepress.com/terms
and incorporate the Creative Commons Attribution
- Non Commercial (unported, 4.0) License.
By accessing the work you hereby accept the Terms. Non-commercial uses of the work are permitted
without any further permission from Dove Medical Press Limited, provided the work is properly
attributed. For permission for commercial use of this work, please see paragraphs 4.2 and 5 of our Terms.
© 2026 The Author(s). This work is published and licensed by Dove Medical Press Limited. The
full terms of this license are available at https://www.dovepress.com/terms
and incorporate the Creative Commons Attribution
- Non Commercial (unported, 4.0) License.
By accessing the work you hereby accept the Terms. Non-commercial uses of the work are permitted
without any further permission from Dove Medical Press Limited, provided the work is properly
attributed. For permission for commercial use of this work, please see paragraphs 4.2 and 5 of our Terms.