Back to Journals » International Journal of Nanomedicine » Volume 18
Differential Detection of Amyloid Aggregates in Old Animals Using Gold Nanorods by Computerized Tomography: A Pharmacokinetic and Bioaccumulation Study
Authors Jara-Guajardo P, Morales-Zavala F, Bolaños K, Giralt E, Araya E, Acosta GA, Albericio F, Alvarez AR, Kogan MJ ![]()
Received 12 September 2023
Accepted for publication 18 December 2023
Published 29 December 2023 Volume 2023:18 Pages 8169—8185
DOI https://doi.org/10.2147/IJN.S435472
Checked for plagiarism Yes
Review by Single anonymous peer review
Peer reviewer comments 2
Editor who approved publication: Prof. Dr. Dongwoo Khang
Pedro Jara-Guajardo,1,2 Francisco Morales-Zavala,1,2 Karen Bolaños,1– 3 Ernest Giralt,4,5 Eyleen Araya,2,6 Gerardo A Acosta,7,8 Fernando Albericio,5,7,9 Alejandra R Alvarez,10 Marcelo J Kogan1,2
1Departamento de Quimica Farmacologica y Toxicologica, Facultad de Ciencias Quimicas y Farmaceuticas, Universidad de Chile, Santiago, Chile; 2Advanced Center for Chronic Diseases (ACCDiS), Independencia, Santiago, Chile; 3Center for Studies on Exercise, Metabolism and Cancer (CEMC), Laboratory of Cellular Communication, Program of Cell and Molecular Biology, Faculty of Medicine, Institute of Biomedical Sciences (ICBM), University of Chile, Santiago, Chile; 4Institute for Research in Biomedicine (IRB Barcelona), Barcelona Institute of Science and Technology (BIST), Barcelona, Spain; 5Department of Inorganic and Organic Chemistry, University of Barcelona, Barcelona, Spain; 6Departamento de Ciencias Quimicas, Facultad de Ciencias Exactas, Universidad Andres Bello, Santiago, Chile; 7CIBER-BBN, Networking Centre on Bioengineering, Biomaterials and Nanomedicine & Department of Organic Chemistry, University of Barcelona, Barcelona, Spain; 8Institute for Advanced Chemistry of Catalonia (IQAC-CSIC), Barcelona, 08034, Spain; 9School of Chemistry & Physics, University of KwaZulu-Natal, Durban, South Africa; 10Cell Signaling Laboratory, Department of Cellular and Molecular Biology, Biological Sciences Faculty, Millennium Institute on Immunology and Immunotherapy, Pontificia Universidad Católica de Chile, Santiago, Chile
Correspondence: Alejandra R Alvarez; Marcelo J Kogan, Email [email protected]; [email protected]
Introduction: The development of new materials and tools for radiology is key to the implementation of this diagnostic technique in clinics. In this work, we evaluated the differential accumulation of peptide-functionalized GNRs in a transgenic animal model (APPswe/PSENd1E9) of Alzheimer’s disease (AD) by computed tomography (CT) and measured the pharmacokinetic parameters and bioaccumulation of the nanosystem.
Methods: The GNRs were functionalized with two peptides, Ang2 and D1, which conferred on them the properties of crossing the blood-brain barrier and binding to amyloid aggregates, respectively, thus making them a diagnostic tool with great potential for AD. The nanosystem was administered intravenously in APPswe/PSEN1dE9 model mice of 4-, 8- and 18-months of age, and the accumulation of gold nanoparticles was observed by computed tomography (CT). The gold accumulation and biodistribution were determined by atomic absorption.
Results: Our findings indicated that 18-month-old animals treated with our nanosystem (GNR-D1/Ang2) displayed noticeable differences in CT signals compared to those treated with a control nanosystem (GNR-Ang2). However, no such distinctions were observed in younger animals. This suggests that our nanosystem holds the potential to effectively detect AD pathology.
Discussion: These results support the future development of gold nanoparticle-based technology as a more effective and accessible alternative for the diagnosis of AD and represent a significant advance in the development of gold nanoparticle applications in disease diagnosis.
Keywords: computed tomography, gold nanorods, amyloid-beta, Aβ, Alzheimer’s disease, diagnostic
Graphical Abstract:

Introduction
Radiology stands as a crucial field in medicine, harnessing the power of imaging technologies to enhance diagnosis and patient care.1 Several radiology techniques have been developed, such as computed tomography (CT), single-photon emission computed tomography (SPECT), and positron emission tomography (PET), among others. Diagnostic agents, such as contrast agents and radiotracers, have been pivotal for the advancement of the use of these techniques. Thus, the general use of iodine-based contrast agents for CT has progressed to radiotracers for specific diseases, such as PIB (Pittsburgh compound B), which is used to detect beta-amyloid in Alzheimer’s disease (AD).2,3
An equally transformative force in this realm has been nanotechnology, which offers a wealth of possibilities for innovation. At the nanoscale, materials exhibit interesting properties, like a large surface area, high chemical reactivity, small size, and unique optical characteristics. Therefore, nanomaterials have become interesting systems for developing medical applications such as diagnostic agents, drug delivery, and photothermal therapies.4–6
Gold nanoparticles (GNPs) have outstanding properties for the diagnostic area due to their high biocompatibility and easy surface modification. These characteristics allow different molecules to be attached to their surfaces to actively target specific body tissues or organs.7,8 Additionally, GNPs are composed of gold, a material with a high x-ray attenuation coefficient (5.16 cm2 g−1 at 100 keV),1 which makes them ideal for use as a contrast agent for CT diagnosis.9 In this sense, preclinical studies have used GNPs as a CT diagnostic agent for diseases such as cancer and cardiovascular diseases.1,10–13
Central nervous system diseases such as AD have emerged as an innovative field for diagnosis using GNPs. AD is the most common type of dementia in older adults, and its clinical diagnosis is still based on cognitive tests,3,14 with the definitive diagnosis of the disease confirmed only post-mortem through the evaluation of the amyloid burden present in the brains of affected patients.2,3 The few radiology diagnostic developments available today are expensive and have limited access for patients. Therefore, our research group is focused on developing different strategies to use GNPs in diagnosing and treating AD. As a result, we have developed a theranostic nanosystem that is capable of both treating and diagnosing the disease in a single system.15–20
This nanosystem is based on using gold nanorods (GNRs) stabilized with two types of polyethylene glycols (PEGs), and then modified on their surface with two peptides. The first peptide, D1 (H-qshyrhispaqv-OH), is composed of only D-amino acids and recognizes and disaggregates amyloid aggregates.19–22 The second peptide, Angiopep 2 (Ang2, H-TFFYGGSRGKRNNFKTEEY-OH), enhances the transport of the nanosystem across the blood-brain barrier (BBB).23 Thus, combining both peptides on the same nanostructure improves their delivery to the brain, induces disaggregation of Aβ aggregates, and reduces their toxicity in vivo, as we previously showed using the nematode Caenorhabditis elegans (strain CL2120) as an in vivo AD model.17,24 Furthermore, these results were confirmed by an in vivo approach using a transgenic mouse model (APPswe/PSEN1dE9) that expresses characteristics of AD pathology. Thus, we found that our GNR-D1/Ang2 nanosystem crosses the BBB and colocalizes with Aβ aggregates. In this work, we evaluated whether directing this GNR-D1/Ang2 nanosystem to the brains of mice with AD allowed its detection by CT, which would enable us to explore the brain and determine if there is any preferential accumulation in a certain area. Thus, we could promote the development and use of this type of nanosystem as new diagnostic agents for AD.24
We first evaluated the pharmacokinetics and bioaccumulation of the GNR-D1/Ang2 nanosystem in a wild-type murine model and determined the maximum target organ arrival time, half-life, and clearance, which are key parameters for the development of any diagnostic and therapeutic agent used in humans. The potential to detect this nanosystem by CT was then evaluated in the APPswe/PSEN1dE9 model at different ages (Figure 1). This work represents a pioneering approach in the exploration of the temporal evolution of AD, where for the first time, a nanosystem targeting amyloid plaques was used as a diagnostic agent for CT, which is a radiology technique that is easily accessible in different parts of the world. Therefore, this exploration could open new doors for the diagnosis of complex diseases using a technique available in many health centers at a low cost.
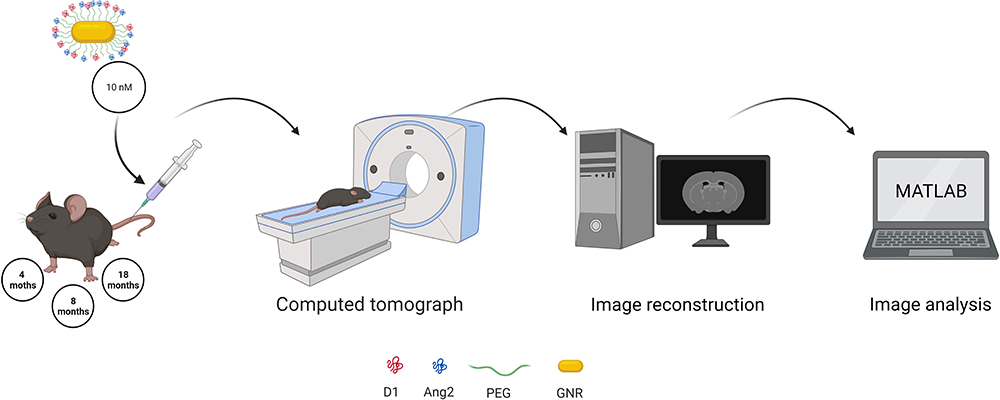 |
Figure 1 Summary of the procedure used for GNR-D1/Ang2 detection via computed tomography (CT) in APPswe/PSEN1dE9 transgenic animals. Firstly, GNRs were administered to animals of different ages (4, 8, and 18 months), which were subsequently scanned via CT. Then, the images were reconstructed to obtain a 3D model and analyzed with MATLAB, which allows the detection and quantification of regions of different densities present in the brain, which were named “objects”. Parameters such as the number of detected objects in each brain area were obtained and evaluated using different statistical tests. (Created with BioRender.com). |
Materials and Methods
GNRs Synthesis
GNRs were synthesized using the seed-mediated growth approach.25,26 In the first step, a seed solution was prepared to reduce 250 µL of HAuCl4 (Sigma Chemical Co., St. Louis, Mo, USA) in 9.75 mL of cetyltrimethylammonium bromide 0.1 M (CTAB) and cold-prepared sodium borohydride (600 µL, 0.01 M) (Sigma Chemical Co., St. Louis, Mo, USA). Seeds were kept at 27 °C for two hours before use. Then, 55 µL of ascorbic acid 0.1 M (Sigma Chemical Co., St. Louis, MO, USA) were added to a growth solution containing 75 µL of AgNO3 0.01 M (Sigma Chemical Co., St. Louis, MO, USA), 9.5 mL of CTAB 0.1 M, and 500 µL of HAuCl4 0.01 M. Next, 250 µL of HCl 0.1 M and finally, 12 µL of the previously prepared seed solution were added. The solution was incubated for 10 minutes at 27 °C before centrifugation at 5900 g for 15 min. The supernatant was then removed, and the pellet was resuspended in Milli-Q water. Vis-NIR absorption spectra were recorded at room temperature using a Perkin Elmer Lambda 25 spectrophotometer. GNRs obtained from synthesis (GNR-CTAB) were observed using a scanning electron microscope with an electronic transmission module (STEM) FEI Inspect F50. The specimens for electron microscopy observation were prepared by dropping GNRs on Formvar carbon-coated copper microgrids (Ted Pella, Inc. Redding, CA, USA), and letting them dry.
GNRs PEGylation and Peptide Conjugation
The PEGylation and functionalization with the peptides (D1 and Ang2) were performed as described in Huang et al, 2010 and Morales-Zavala et al, 2017,17,27 where the GNRs were conjugated in three steps: (1) 50 µL of HS-PEG-OMe 1 mM (MW 5K, JenKem Technology, TX, USA) were added to 10 mL of GNRs 1 nM, and the mixture solution was stirred for 10 min. PEGylated GNRs (GNRs-PEG) were centrifuged at 20,800 g for 10 min and resuspended in 10 mL of Milli-Q water. (2) 300 µL of HS-PEG-COOH 1 mM (MW 5K, JenKem Technology, Texas, USA) were added, and the solution was stirred for 1 hour. The solution was centrifuged twice at 20,800 g for 10 min and resuspended in 100 µL of MES buffer pH 5.5. (3) 0.2 mg EDC (1-ethyl-3-(3-dimethylaminopropyl)carbodiimide) and 0.5 mg sulfo-NHS (Sulfo-NHydroxysuccinimide) (Sigma Chemical Co., St. Louis, MO, USA) were incubated with the functionalized GNRs for 15 min to activate the carboxyl groups on the GNRs. Excess EDC/sulfo-NHS was removed by centrifugation at 20,800 g for 10 min, and the activated GNRs-PEG were mixed with the D1 and Ang2 peptide ligands in PBS buffer (pH 7.4) using a 1:1000 NR:ligand molar ratio. The solution was gently shaken for 2 hours at room temperature (RT) and then stored at 4 °C. Before use, the GNRs-D1/Ang2 were washed by centrifugation to eliminate the free reactants. The Ang2 and D1 peptides were synthesized and characterized as previously described in our work by Velasco-Aguirre et al15 and Jara-Guajardo et al.18 We used HS-PEG-OMe MW 5000 because it allowed us to efficiently stabilize nanoparticles, avoiding their aggregation.28 Reducing the interaction with serum significantly decreased the absorption with serum proteins and the interaction with macrophages, which led to prolonged blood circulation time, as previously demonstrated.16,29,30
Quantification of Peptide Molecules per GNR-D1/Ang2
The number of peptide molecules per GNR-D1/Ang2 was estimated by amino acid analysis and neutron activation analysis. For that, the GNRs-peptides solution was lyophilized and hydrolyzed for 72 hours in 6 N HCl, with a known quantity of aminobutyric acid as an internal standard. Afterwards, the solution was evaporated under reduced pressure and amino acid derivatized for HPLC analysis.17 The number of peptide molecules per GNR was determined as the ratio: number of peptide molecules per mL of solution/number of particles per mL of solution, which was calculated in triplicate from three independent analyses. The results of these data were previously published by Morales-Zavala et al, 2021.
Physicochemical Characterization of NVO-PEG-D1/Ang2
Determination of GNR Plasmonic Bands by Molecular Absorption Spectrophotometry
The GNRs were characterized throughout their stages by molecular absorption spectrophotometry, detecting two characteristic plasmon absorption bands of the GNRs that depend on their aspect ratio: the transverse band at approximately 520 nm and the longitudinal band that ranges from 700 to 1000 nm. A Perkin Elmer Lambda 25 spectrophotometer was used to obtain spectrums at room temperature.
Determination of GNR Hydrodynamic Diameter (Dh) and Zeta Potential (pZ)
Measurement of the hydrodynamic diameters (Dh) and zeta potential (pZ) was performed using the Malvern Instruments Zeta sizer Nano ZS, UK. These measurements were performed in water in triplicate using a disposable folded capillary cell (DTS1070). The Smolochowski approximation was used to calculate the zeta potential from the nanoparticle’s electrokinetic mobility in solution.
Transmission Electron Microscopy (TEM)
In each stage, the GNRs were observed by electron microscopy using a scanning electron microscope with an electron transmission module (STEM) FEI Inspect F50. The samples were prepared by depositing a drop of GNR suspension on copper grids treated with Formvar carbon, which was allowed to dry. This technique determined the size and the major aspect ratio (length/width) of the GNRs population. 100 particles were measured using the Image J software, and the data were represented as frequency histograms vs aspect ratio.
Pharmacokinetic Determination of GNR-D1/Ang2 in the C57BL/6 Model
For pharmacokinetic studies, we used groups of 12-week-old C57BL/6 male mice with an average weight of 20 g. Each group received a single intravenous dose of 100 µL of GNR-D1/Ang2 at 10 nM, or the equivalent of 2.2 mg gold per Kg of mouse (mg/Kg) and was housed separately according to the scheduled blood collection time: 0.25; 0.5; 1; 2; 4; 6, and 24 hours (3 mice per group were used). At the end of each collection time, the mice were anesthetized with ketamine/xylazine (40 mg/Kg and 15 mg/Kg, respectively), and a complete blood sample was obtained by intracardiac puncture. The blood was collected in tubes prepared with 3% sodium citrate anticoagulant and kept refrigerated at 4 °C.
Determination of GNR-D1/Ang2 Bioaccumulation in the C57BL/6 Model
For this study, we used seven groups of 12-week-old C57BL/6 mice with an average weight of 20 g, with three male mice assigned to each group. Each group received a single intravenous dose of 100 µL of GNR-D1/Ang2 10 nM or the equivalent of 2.2 mg gold per Kg of mouse (mg/Kg) and was housed in separate cages according to the scheduled organ extraction time: 0; 0.5; 1; 2; 3; 6; and 24 hours. After the established time had elapsed, the animals were anesthetized with a mixture of ketamine/xylazine (40 mg/Kg and 15 mg/Kg, respectively), and an intracardiac perfusion with saline solution was performed to remove blood from the organs that were then extracted: liver, spleen, kidney, and brain. These organs were then fixed in a 4% PFA solution for 24 hours, dried, and lyophilized.
Atomic Absorption Spectrometry for Gold Quantification in Liquid and Solid Samples
Gold content was quantified by atomic absorption spectrometry (AAS) using the graphite furnace technique with ContrAA 800G Analytic Jena equipment. A calibration curve from a commercially available 1000 mg/L of Au single-element standard (Merck, Darmstadt, Germany), appropriately diluted with 0.5% HCl (analytical grade, Merck) was prepared, ranging from 300 pg to 3750 pg of gold. Blood and lyophilized organ samples were weighed using a microbalance, not exceeding 1 mg, and then introduced into the furnace, pyrolyzed under an argon flame, and their absorption was detected at 242.8 nm. The operation conditions for Au determination by GFAAS are detailed in the supporting information section (Table S1).
Detection of GNR-D1/Ang2 for CT in the APPswe/PSEN1dE9 Model with Mice of Different Ages
APPswe/PSEN1dE9 mice were used to evaluate the utility of GNR-D1/Ang2 as a contrast agent for CT. Three groups of female mice, each with animals of 4, 8 and 18 months of age were injected intravenously with 100 µL of 10 nM GNR-D1/Ang2 or the equivalent of 2.2 mg of gold per mouse mass (mg/Kg). After 15 minutes, the mice were placed under inhalatory anesthesia with isoflurane (4% induction and 2% maintenance) and scanned using a micro-CT scanner (Bruker, Skyscan model 1278) with a nominal resolution of 51 μm, without aluminum filter, and with 39 kV tube voltage. The complete scanning time lasted approximately 1 hour, allowing enough time for the nanosystem to distribute and reach its estimated maximum concentration in the mouse brain.
Analysis of CT Scans and Image Reconstruction
The initial reconstruction was done using the SkyScanNRecon software with ring artifact reduction, Gaussian smoothing (2%), and beam hardening correction (23%). The resulting images were then cropped to isolate the area of the animal’s skull using the Bruker DataViewer program, ensuring that no information was lost during the cropping process. The skull images were processed using Matlab 2022 due to its high image analysis capabilities and ability to work with the TIFF format, without loss of information.
Ex vivo Evaluation of GNR-D1/Ang2 Accumulation in the Brain of APPswe/PSEN1dE9 Mice Using CT Analysis
To determine nanosystem accumulation in the brain of the animals treated for CT analysis, brain samples were collected after the CT analysis from the different animal groups, fixed in 4% PFA for 24 hours, and then processed for paraffin embedding. Coronal sections of 5 μm were cut from each paraffin block, followed by drying, deparaffinization, and rehydration in distilled water. Gold enhancement was performed using the Nanoprobes GoldEnhance TM LM kit, according to the manufacturer’s instructions. The same sections were then stained for amyloid deposits with Congo Red staining. Images of the stained slides were obtained with an ICC50W camera on a Leica DM500 microscope. A red staining of the amyloid plaques and black staining of the nanoparticles were observed under the microscope.
Statistical Analyses
The pharmacokinetics and bioaccumulation data were analyzed by T-test to compare two variables, while the Sidak and Tukey’s tests were used for multiple comparisons, using the GraphPad Prism 8 analysis software.
Results and Discussion
Characterization of GNRs-D1/Ang2
The GNRs were synthesized and fully characterized as described in Material and Methods. The GNR-D1/Ang2 nanosystem (Figure 2) showed two maximum absorption peaks obtained by UV-VIS-NIR spectroscopy at 520 nm and 760 nm, corresponding to its transverse and longitudinal plasmons, respectively. The Dh determined by DLS corresponded to a transverse diameter of 4 nm and a longitudinal diameter of 76 nm. The pZ was −6 mV, and the TEM confirmed the morphology of the nanoparticle, with a length-to-width aspect ratio of approximately 4. The number of peptides on the surface of the nanosystem corresponded to a total of 423 ± 23 D1 molecules and 173 ± 36 Ang2 molecules,24 as previously published by Morales-Zavala et al, 2021. All these parameters were consistent with values already reported by our research group in previous publications.16–18,24
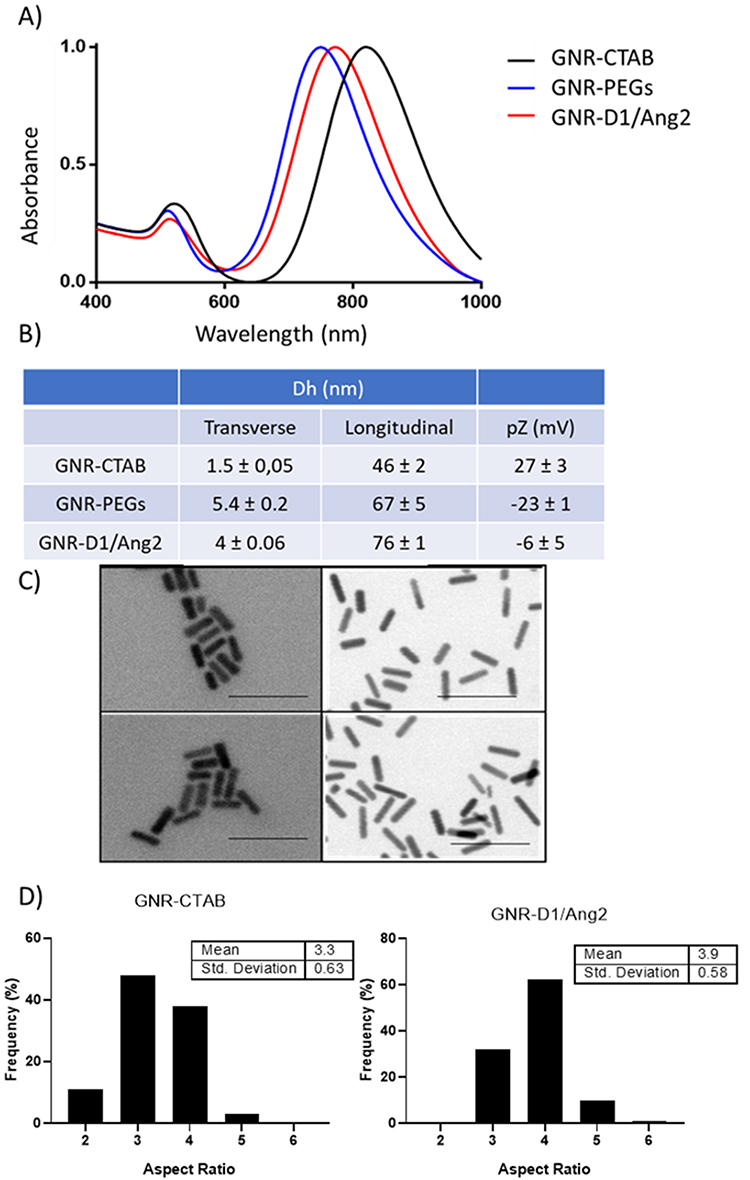 |
Figure 2 Characterization of the different functionalization phases of the gold nanorods (GNRs) used in this study, including GNR-CTAB, GNR-PEGs, and GNR-D1/Ang2. (A) Graph summarizing the changes in the plasmon nanosystem visualized through UV-visible spectroscopy (n=3). (B) Table summarizing the data obtained for hydrodynamic diameter and Z-potential (n=3). (C) TEM microscopy images to visualize changes in nanosystem morphology (representative image). (D) Histograms evaluating changes in the population distribution of the long-to-short aspect ratio of the nanosystem (a total of 500 GNR for condition were counted). |
Pharmacokinetics of GNR-D1/Ang2 in the C57BL/6 Murine Model
The pharmacokinetics of GNR-D1/Ang2 (Figure 3) showed two peaks of gold concentration in blood: at 0.25 h and 1 h post-administration. This increased level of gold in blood at the first hour post-administration may be due to the redistribution of gold nanoparticles in organs, a process in which xenobiotics can return to the bloodstream once accumulated in an organ. This redistribution process has been reported for some drugs, such as diazepam, and also for nanoparticles, as shown in the study by Naz et al 2016,31 and could have been favored in our nanosystem due to the presence of the Ang2 peptide on the surface of the GNR, which recognizes LRP1, promoting cellular internalization and exocytosis.32
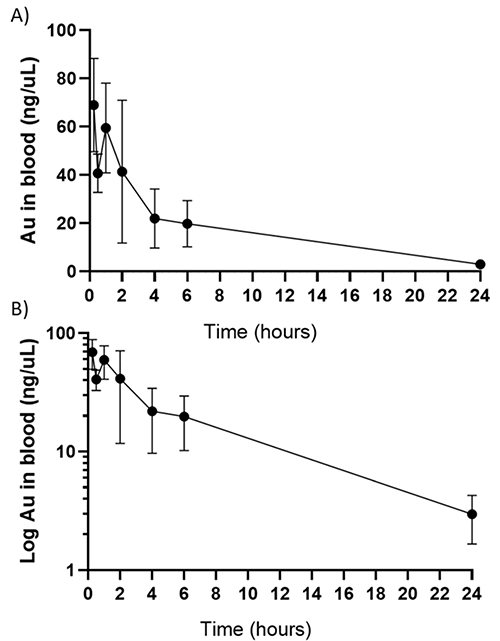 |
Figure 3 Graphs summarizing the pharmacokinetic data obtained for GNR-D1/Ang2. (A) Graph showing the quantification of gold in blood over a 24-hour period. (B) Graph presenting the same data on a semilogarithmic scale. |
The estimation of the pharmacokinetic parameters requires evaluating which pharmacokinetic model corresponds to the data obtained. For this, two study models were used: the 1-compartment model and the non-compartmental model (trapezoid method), and both were analyzed using the Excel macro pksolver33 (the fitted models are shown in the Supplementary Material section, Figures S1 and S2).
As shown in Table 1, both models exhibited similar values, such as an elimination constant of 0.12 vs 0.10 1/h, a half-life of 5.6 vs 6.8 hours, a distribution volume of 0.92 vs 0.95 mL, and a clearance of 0.11 vs 0.10 µL/h (1-compartment model and non-compartmental model, respectively). These results revealed similar behavior in both analyses, allowing us to estimate its clearance from the body in a window of 39–48 hours after its administration. This implies a longer half-life compared to other iodine-based contrast media, which are found within 24 hours after elimination.34 This half-life depends on the excretion route since this type of nanoparticle is eliminated mainly through the liver, and other contrast media do so through the kidneys.
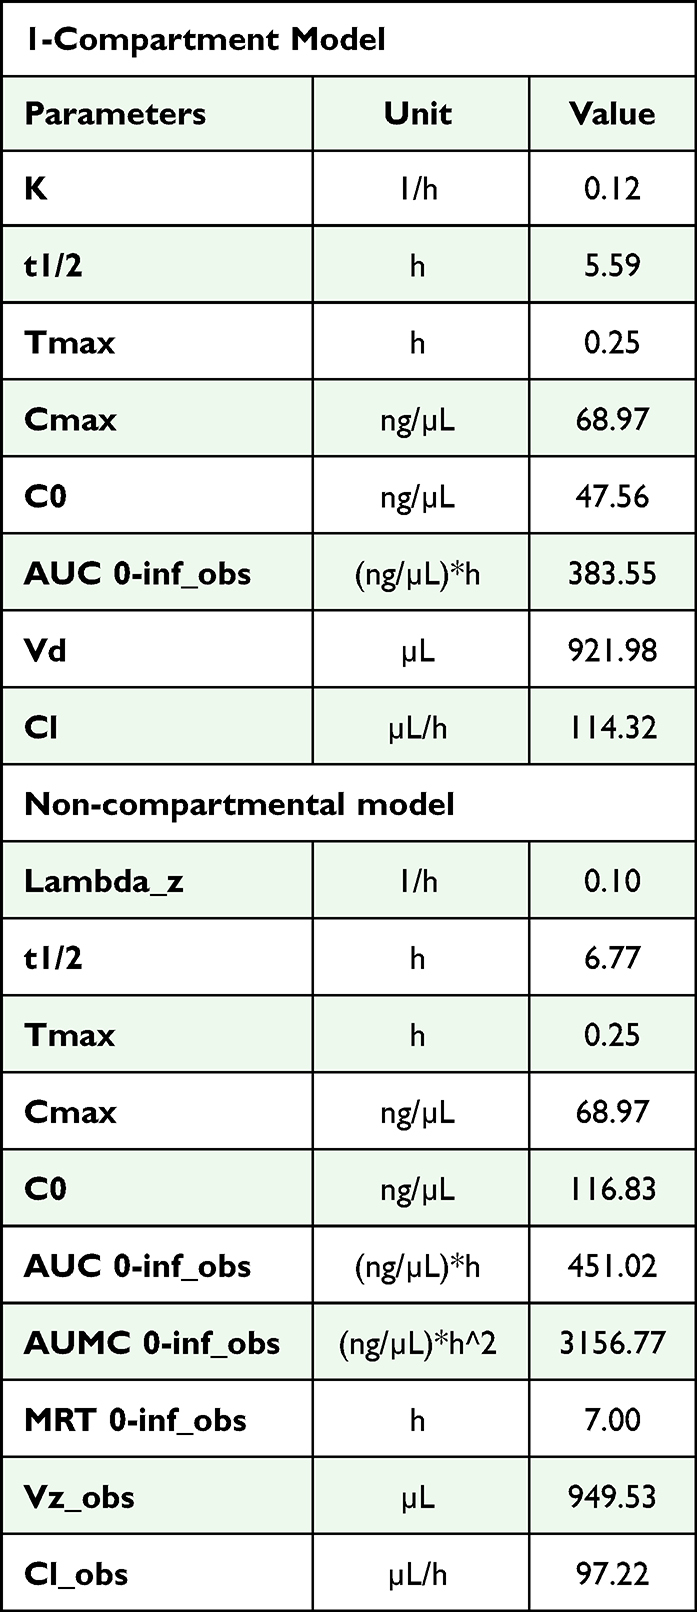 |
Table 1 Data Obtained for the Pharmacokinetic Analysis of GNR-D1/Ang2 Using the 1-Compartment Model (Upper Table) and the Non-Compartmental Model (Lower Table) |
Due to these similarities, none of the models used could be ruled out, so a more detailed study was necessary to demonstrate which model fit the kinetics of this nanosystem. In addition, when comparing this new data with our previous work by Velasco-Aguirre,35 the main difference was the use of a different animal model: Sprague Dawley rats that were treated with the same GNR-D1/Ang2 nanosystem. We now used our nanosystem in a mouse model, which presents a faster bile flow36 than the rat model, thus making it difficult to compare both models.
Determination of Organ Residence Time or Bioaccumulation of GNR-D1/Ang2 in the C57Bl/6 Murine Model
A better estimation of the CT scanning time requires knowing the maximum accumulation time of GNRs in the organs so that the procedure can be performed within the optimal time window, ie, when the amount of GNRs in the organ of interest is highest. Gold quantification in the liver, spleen, kidney, and brain after injecting C57BL/6 mice with 100 µL of GNR-D1/Ang2 10 nM or the equivalent of 2.2 mg gold per mouse mass (mg/Kg) is shown in Figure 4. There was a rapid accumulation of the nanosystem in the liver (0.5 hours), but subsequently, the amount of gold decreased and then increased again at 3 hours post-administration. This decrease coincided with the increase in gold detected in the blood within the same period of time; therefore, it could be due to a redistribution process.31 In the case of the spleen, there was a gradual increase in the concentration of gold, and this could be due to the presence of macrophages in this organ, which capture the nanosystem. There was no difference in gold concentration in the kidney over time. In the case of the brain, no difference was observed throughout the time considered, although there was a trend of gold accumulation with a maximum at 2 hours. The significant differences observed are described in Table S2.
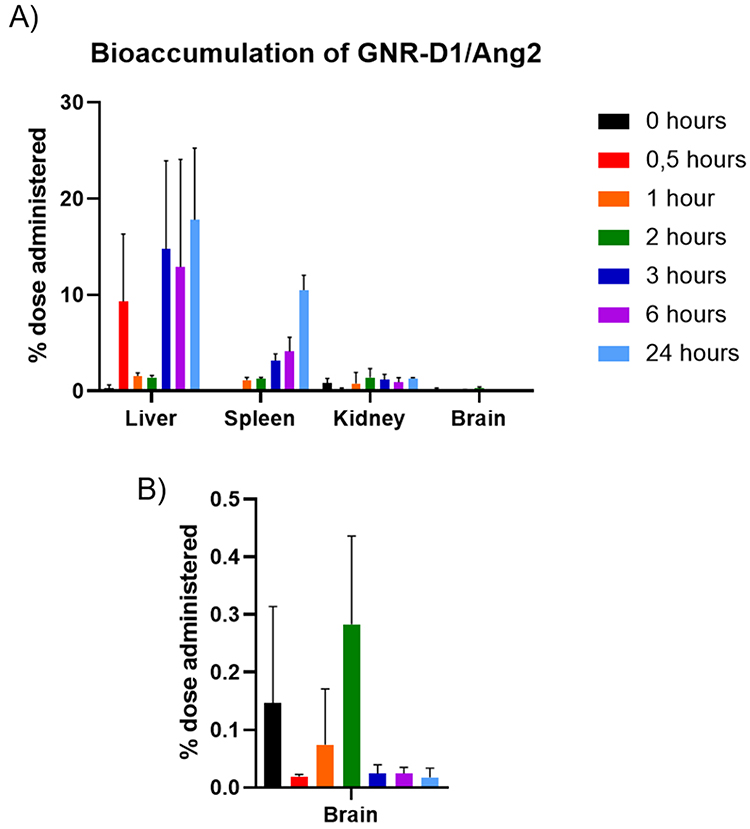 |
Figure 4 Bioaccumulation of the GNR-D1/Ang2 nanosystem in the C57Bl/6 mouse model in (A) different organs (liver, spleen, kidney, and brain) in a period of up to 24 hours and (B) the brain in the same period. |
Although a significant gold accumulation was not reached in the brain, the observed trend may be key when considering residence times. This, together with previous studies published by Morales-Zavala in 2021,24 who detected gold in the brain of AD mice at 15 minutes, allowed us to create a temporal range to optimize the scanning time. Of note, this nanosystem was designed to improve how long it stayed in the presence of amyloid aggregates, which had not been previously reported in this murine model, where the clearance process could take longer. On the other hand, the AD animals used in the CT study have a more permeable BBB. Considering the pharmacokinetic behavior of the nanosystem for detection, the CT scans must be carried out between 15 minutes and 2 hours post-administration.37–40 However, a study of the biodistribution of GNR-D1/Ang2 in APPswe/PSEN1dE9 mice of different ages should be performed in the future to determine the residence times of the nanoparticles in the brain. These residence times of the nanoparticles will be dependent of the state and permeability of the BBB and also to the presence of amyloids.
Detection of GNR-D1/Ang2 by CT in AD Mice of Different Ages
To evaluate the usefulness of GNR-D1/Ang2 and computed tomography to reveal the presence of amyloid aggregates in AD mice, a test was first performed in WT animals to observe if there was a GNR signal in their brains. As seen in supporting information (Figure S3), these WT animals did not generate any type of signal when using our nanosystem, so the next step was to test it in APPswe/PSEN1dE9 mice of 3 different ages: 4-, 8-, and 18-month-old. The mice were treated with 100 µL of GNR-D1/Ang2 10 nM or GNR-Ang2 10 nM or the equivalent of 2.2 mg of gold (of each nanosystem) per mouse mass (mg/Kg). The GNRs-Ang2 nanosystem was used as a control because we expected that in the absence of the D1 peptide, it would not recognize the Aβ aggregates, giving a non-specific CT signal pattern.24 The scanning time was set for 1 hour 15 minutes after the injection so that the scanning would cover the complete time window during which the nanosystem remained in the brain.
Figure 5 shows the reconstructions of the GNR-D1/Ang2 and GNRs-Ag2 signals in the brain after processing with Matlab. The objects were present in APPswe/PSEN1dE9 mice in both the experimental and control groups of all ages. Since the nanosystem had the Ang2 peptide but not the D1 peptide, it was expected to cross the BBB but not accumulate. Therefore, the observed objects could correspond to clusters of nanoparticles moving through the bloodstream or being distributed throughout the brain before being cleared from this organ. When comparing the images of control and experimental animals, there was no visual difference in the presence of objects. Using a mouse brain atlas such as the one available in the Allen Institute database, which consists of NMR images, and using MATLAB to generate a 3D system of this atlas, we generated a system that compared different brain areas of the animal with the images acquired by CT. The regions of interest (ROIs) selected for the analysis are shown in Figure 6. These areas were selected due to their participation in the progression of AD; the beginning of the accumulation of amyloid aggregates has been previously observed in these young models (entorhinal area) and in adult models (olfactory area, isocortex, hippocampus, and cerebellum).41 A Matlab analysis system was also used to obtain the number of objects present in each brain and study its relationship with the volumes in terms of the number of voxels present per object and the volume occupied in the brain (Figure 7), and specifically for each brain area, the number of objects and the number of voxels in each object (Figure 8).
 |
Figure 5 Reconstruction of the brains of transgenic animals (without the skull) of different ages (4, 8, and 18 months) treated with GNR-Ang2 or GNR-D1/Ang2, according to the results obtained by CT. The reconstructed brain is shown in the upper panel with 100% density and in the lower images with 50% attenuation, which allowed us to observe the content of objects detected within the brains of the animals (red-marked areas are referred to as “objects”). |
 |
Figure 6 Segmentation of brain areas for Matlab analysis using regions of interest (ROIs). (A) Image that shows the entire region that encompasses the brain. B to F correspond to areas of the brain segmented for individual analysis by ROIs. (B) Cerebellum. (C) Isocortex. (D) Olfactory zone. (E) Hippocampus. (F) Entorhinal area. This 3D reconstruction of the mouse brain was made using the atlas available on the Allen Institute page and then processing the images with Matlab. |
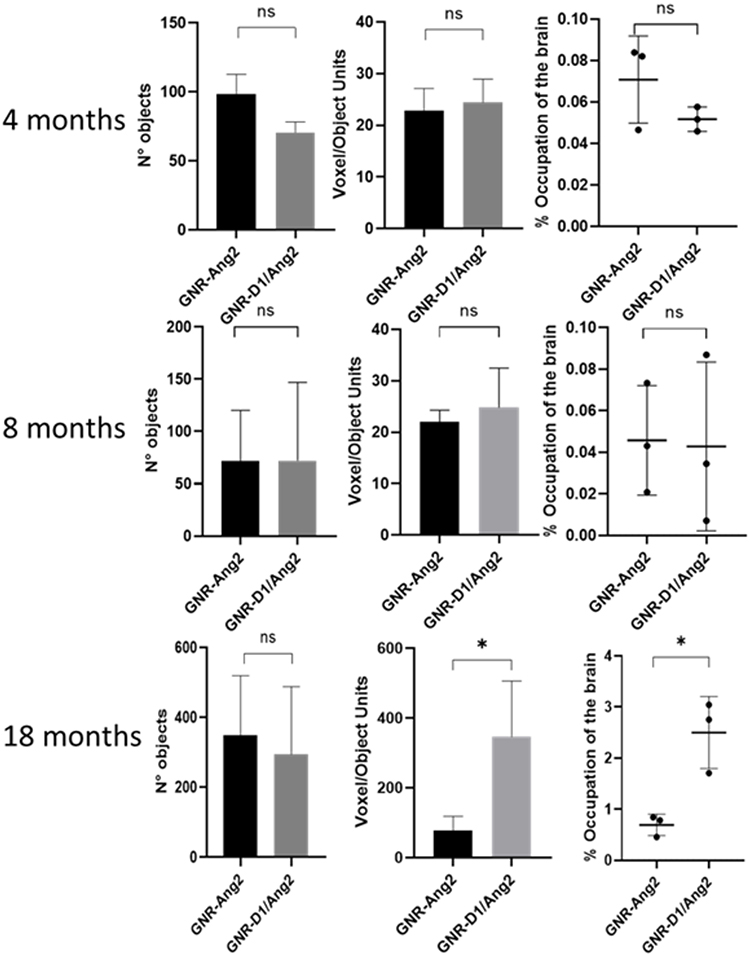 |
Figure 7 Data obtained through the Matlab analysis of total brain areas to determine the number of objects, the number of voxels per object, and the volume of occupation of the objects with respect to the total volume of the brain. This analysis was used for the three age groups of transgenic animals (4, 8, and 18 months of age). The student’s test was used for statistical analysis. *=p ≤ 0.05, n=3 for each group and ns means no significative. |
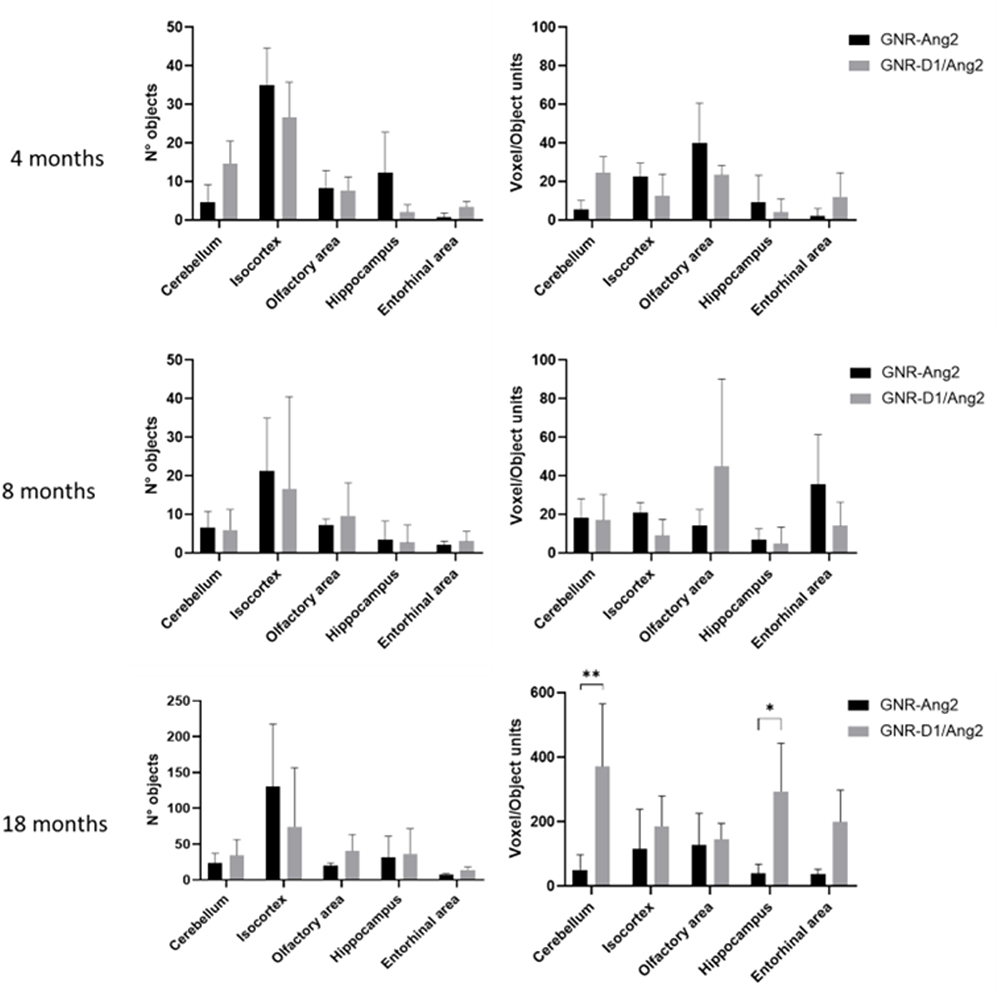 |
Figure 8 Data obtained by Matlab analysis for specific areas of the brain (cerebellum, isocortex, olfactory area, hippocampus, and entorhinal area) to determine the number of objects and the number of voxels per object present in these areas. This analysis was used for the three age groups of transgenic animals (4, 8, and 18 months of age). The statistical analysis was performed with the Sidak multiple comparison test. *=p ≤ 0.05 and **=p ≤ 0.01, n=3 for each group. |
After analyzing the number of objects and the number of voxels that made up the objects, we found that 18-month-old animals showed differences between the nanosystems used (Figure 7). There were approximately 3.8 times more voxels per object in the GNR-D1/Ang2 system, and despite having the same number of objects in both groups, their size was much greater in the D1 nanosystem, which may be due to its greater arrival to the areas with plates, thus increasing volume. However, young animals (4- and 8-month-old) showed a similar value in the size of the objects, with around 20 voxels per object, independently of the nanosystem used. The voxel value allowed us to calculate the brain area occupied by these objects; the objects of the group treated with GNR-D1/Ang2 in 18-month-old animals reached a value of 2.5% occupancy, compared to the total volume of the brain, while the other age groups presented a lower percentage, which is consistent with the data shown in Figure 7. On the other hand, since we determined the number of objects in each animal at different ages, we were not able to determine a difference between control animals and those treated with the D1 peptide nanosystem, which could indicate that the parameters that allow to differentiate the accumulation of GNR-D1/Ang2 in the brain are the voxel/object and the % of occupation in the brain.
Along with the ROIs shown in Figure 6, we conducted a more detailed analysis by determining the number of objects and voxels present in different brain areas (Figure 8). Regarding the data obtained in the analysis of the number of objects, a similar behavior to the general analysis was observed, indicating that all brain areas had the same number of objects, regardless of the nanosystem used. However, when analyzing the number of voxels present in these objects, a similar pattern was observed again in young animals (4- and 8-month-old), in which the values did not show significant differences. On the other hand, and like the overall analysis, older animals treated with GNR-D1/Ang2 had higher voxel values. Specifically, larger objects were detected in the cerebellum and hippocampus. Previous studies in the APPswe/PSEN1dE9 model, in particular female mice older than 15 months of age, have reported the accumulation of amyloid plaques in both the cerebellum and the cortex, so we expected to obtain a greater signal in this area in older animals, compared to young animals.41 On the other hand, finding an increase in the signal from the hippocampal area is essential since it is responsible for memory, which is mainly affected by the accumulation of amyloid plaques.41
Verification of GNR Accumulation in the Brain of APPswe/PSEN1dE9 Mice
To verify the accumulation of GNRs in the animals observed by CT, histological sections were prepared to evaluate the distribution of the nanosystems in the brain tissue. The GOLD ENHANCEMENT reagent was used for this purpose, which increases the size of the gold nanoparticles through a chemical process, making them visible under the optical microscope. In addition, Congo red dye was used to label amyloid plaques, allowing their visualization in the brain tissue, as shown in Figure 9.
 |
Figure 9 Images obtained by brain histology of animals of different ages (4, 8, and 18 months) used in CT, treated with GNR-Ang2 or GNR-D1/Ang2. Brain slices from the cortex area are shown, where the presence of the GNPs can be seen in different areas marked with ellipses and blue arrows, which were visible by using the GOLD ENHANCEMENT reagent, and red shows the presence of the amyloid plaques stained with Congo red. |
Differences in the distribution of the nanoparticles were observed depending on the age of the animals. Once again, a similar pattern could be observed in young animals (4- and 8-month-old), where the nanoparticles were found close to blood vessels, suggesting a transcytosis process. In contrast, 18-month-old animals treated with GNR-D1/Ang2 exhibited more nanoparticles in areas near the amyloid plaques (Figure 9) (Supplementary Material section, Figures S4 and S5 and supplementary methods 1). This increased accumulation of the D1 nanosystem in this age group may be attributed to the state of the BBB, which shows higher permeability in adult mice.37–40 Moreover, the D1 peptide allows for longer residence time in the tissue, leading to accumulation in areas with amyloid plaques, as observed in this age group. In contrast, younger animals have a more intact BBB.37–40
Furthermore, this model also presents cerebral amyloid angiopathy,42 a second pathology associated with the accumulation of amyloid plaques, which causes the buildup of plaques around blood vessels in older animals. This produces greater instability of the BBB and, consequently, increased permeability.
Conclusions
In this study, we successfully determined the presence of accumulated GNR-D1/Ang2 in the brains of transgenic AD animal models using CT, which could mark a significant advancement and development for the use of nanoparticles as highly versatile diagnostic systems. In an 18-month-old transgenic model of AD, we were able to identify the preferential accumulation of the GNR-D1/Ang2 system in brain areas with amyloid plaque accumulation, such as the hippocampus and cerebellum. On the other hand, no differences were observed between the control nanosystem (GNR-Ang2) and the one containing the D1 peptide (GNR-D1/Ang2) in younger animals. However, we are designing new surface modification strategies to study the accumulation of the nanosystem in earlier stages of AD, with the aim of being able to diagnose this disease earlier. In addition, we also identified the maximum arrival time to the brain, which was found to be within 2 hours, although this may be influenced by the integrity of the BBB at different ages of the mice. Finally, histology confirmed the presence of nanoparticles in amyloid plaques in 18-month-old animals, further supporting the data obtained in our CT study.
In summary, the combination of our nanosystem with CT has proven to be a promising tool for detecting and visualizing nanoparticle accumulation in the brain of AD animal models. Our approach offers several potential benefits, including higher efficiency, lower toxicity, and the ability to customize the surface of the nanosystem. These results support the future development of technology based on gold nanoparticles as a more effective and accessible alternative for diagnosing of AD, and represent a significant advance in the development of gold nanoparticle applications in disease diagnosis. Unlike the PIB reference probe, our nanosystem has important advantages, such as a longer half-life and lower cost. In addition, the iodinated contrast media used in CT has limitations regarding its specific accumulation in target organs and its potential for nephrotoxicity. On the contrary, gold nanoparticles offer the possibility of selective accumulation in specific organs, expanding their potential use in different groups of patients due to their high capacity for surface modification.
Ethics Approval
Animal experimental procedures of this study were approved by the Animal Ethics Committee at the University of Chile (CBE2020-11) and at the Pontificia Universidad Católica de Chile (160825024). The Laboratory Animal Guidelines for Ethical Review of Animal Welfare (https://uchile.cl/u152120) was followed to ensure the welfare of the laboratory animals.
Acknowledgments
We thank Plataforma Experimental Bio-CT, Faculty of Dentistry from Universidad de Chile (FONDEQUIP EQM150010) for performing the Micro-CT analysis. We thank Dr. Javier Morales Montecinos for the assessment of the pharmacokinetic studies. Peptide synthesis was performed at the NANBIOSIS–CIBER BBN Peptide Synthesis Unit (U3).This study was funded by the following projects: FONDECYT 1211482 (MK), FONDEQUIP EQM170111, FONDAP 15130011 (MK), Anillo ACT 210068, Beca Doctorado 21180739 (PJ), FONDECYT 3190547 (FM), FONDECYT 3220587 (KB), FONDECYT 1201668 (AA), FONDEF ID21I10347 (AA), and Program ICM-ANID-ICN2021 045 (AA).
Disclosure
Dr Pedro Jara-Guajardo, Dr Francisco Morales-Zavala, Dr Alejandra Álvarez and Dr Marcelo Kogan report the patent WO/2023/205910. The authors report no other conflicts of interest in this work.
References
1. Han X, Xu K, Taratula O, Farsad K. Applications of nanoparticles in biomedical imaging. Nanoscale. 2019;11(3):799–819. doi:10.1039/C8NR07769J
2. Pietrzak K, Czarnecka K, Mikiciuk-Olasik E, Szymanski P. New perspectives of Alzheimer disease diagnosis–The most popular and future methods. Med Chem. 2018;14:34–43. doi:10.2174/1573406413666171002120847
3. Ballard C, Gauthier S, Corbett A, Brayne C, Aarsland D, Jones E. Alzheimer’s disease. Lancet. 2011;377(9770):1019–1031. doi:10.1016/S0140-6736(10)61349-9
4. Sharma H, Mishra PK, Talegaonkar S, Vaidya B. Metal nanoparticles: a theranostic nanotool against cancer. Drug Discov Today. 2015;20(9):1143–1151. doi:10.1016/j.drudis.2015.05.009
5. Betzer O, Perets N, Angel A, et al. In Vivo Neuroimaging of Exosomes Using Gold Nanoparticles. ACS Nano. 2017;11(11):10883–10893. doi:10.1021/acsnano.7b04495
6. Perets N, Betzer O, Shapira R, et al. Golden Exosomes Selectively Target Brain Pathologies in Neurodegenerative and Neurodevelopmental Disorders. Nano Lett. 2019;19(6):3422–3431. doi:10.1021/acs.nanolett.8b04148
7. Ghosh P, Han G, De M, Kim CK, Rotello VM. Gold nanoparticles in delivery applications☆. Adv Drug Deliv Rev. 2008;60(11):1307–1315. doi:10.1016/j.addr.2008.03.016
8. Cobley CM, Chen J, Cho EC, Wang LV, Xia Y. Gold nanostructures: a class of multifunctional materials for biomedical applications. Chem Soc Rev. 2011;40(1):44–56. doi:10.1039/B821763G
9. Murata S, Udono H, Tanahashi N. Immunoproteasome assembly and antigen presentation in mice lacking both PA28α and PA28β. The EMBO J. 2001;20(21):5898.
10. Cormode DP, Roessl E, Thran A, et al. Atherosclerotic Plaque Composition: analysis with Multicolor CT and Targeted Gold Nanoparticles. Radiology. 2010;256(3):774–782. doi:10.1148/radiol.10092473
11. Ghaghada KB, Badea CT, Karumbaiah L, et al. Evaluation of Tumor Microenvironment in an Animal Model using a Nanoparticle Contrast Agent in Computed Tomography Imaging. Acad Radiol. 2011;18(1):20–30. doi:10.1016/j.acra.2010.09.003
12. Betzer O, Shwartz A, Motiei M, et al. Nanoparticle-Based CT Imaging Technique for Longitudinal and Quantitative Stem Cell Tracking within the Brain: application in Neuropsychiatric Disorders. ACS Nano. 2014;8(9):9274–9285. doi:10.1021/nn503131h
13. Bhavane R, Badea C, Ghaghada KB, et al. Dual-energy computed tomography imaging of atherosclerotic plaques in a mouse model using a liposomal-iodine nanoparticle contrast agent. Circ Cardiovasc Imaging. 2013;6:285–294. doi:10.1161/CIRCIMAGING.112.000119
14. McKhann GM, Knopman DS, Chertkow H, et al. The diagnosis of dementia due to Alzheimer’s disease: Recommendations from the National Institute on Aging-Alzheimer’s Association workgroups on diagnostic guidelines for Alzheimer’s disease. Alzheimers Dement. 2011;7:263–269. doi:10.1016/j.jalz.2011.03.005
15. Velasco-Aguirre C, Morales F, Gallardo-Toledo E, et al. Peptides and proteins used to enhance gold nanoparticle delivery to the brain: preclinical approaches. Int J Nanomed. 2015;10:4919–4936. doi:10.2147/IJN.S82310
16. Velasco-Aguirre C, Morales-Zavala F. Improving gold nanorod delivery to the central nervous system by conjugation to the shuttle Angiopep-2. Nanomedicine, 2017, 12, 2503–2517
17. Morales-Zavala F, Arriagada H, Hassan N, et al. Peptide multifunctionalized gold nanorods decrease toxicity of β-amyloid peptide in a Caenorhabditis elegans model of Alzheimer’s disease. Nanomedicine: Nanotechnology, Biology and Medicine. Nanomedicine. 2017;13:2341–2350. doi:10.1016/j.nano.2017.06.013
18. Jara-Guajardo P, Cabrera P, Celis F, et al. Gold Nanoparticles Mediate Improved Detection of β-amyloid Aggregates by Fluorescence. Nanomaterials. 2020;10(4):690. doi:10.3390/nano10040690
19. van Groen T, Kadish I, Wiesehan K, Funke SA, Willbold D. In vitro and in vivo Staining Characteristics of Small, Fluorescent, Aβ42-Binding D -Enantiomeric Peptides in Transgenic AD Mouse Models. ChemMedChem. 2009;4(2):276–282. doi:10.1002/cmdc.200800289
20. Funke SA, Bartnik D, Glück JM, et al. Development of a Small D-Enantiomeric Alzheimer’s Amyloid-β Binding Peptide Ligand for Future In Vivo Imaging Applications. PLoS One. 2012;7(7):e41457. doi:10.1371/journal.pone.0041457
21. Wiesehan K, Buder K, Linke RP, et al. Selection of D -Amino-Acid Peptides That Bind to Alzheimer’s Disease Amyloid Peptide Aβ 1–42 by Mirror Image Phage Display. Chembiochem. 2003;4(8):748–753. doi:10.1002/cbic.200300631
22. Xue D, Zhao M, Wang YJ, et al. A multifunctional peptide rescues memory deficits in Alzheimer’s disease transgenic mice by inhibiting Aβ42-induced cytotoxicity and increasing microglial phagocytosis. Neurobiol Dis. 2012;46:701–709. doi:10.1016/j.nbd.2012.03.013
23. Demeule M, Currie JC, Bertrand Y, et al. Involvement of the low-density lipoprotein receptor-related protein in the transcytosis of the brain delivery vector Angiopep-2. J Neurochem. 2008;106(4):1534–1544. doi:10.1111/j.1471-4159.2008.05492.x
24. Morales-Zavala F, Jara-Guajardo P, Chamorro D, et al. In vivo micro computed tomography detection and decrease in amyloid load by using multifunctionalized gold nanorods: a neurotheranostic platform for Alzheimer’s disease. Biomaterials Sci. 2021;4178.
25. Adura C, Guerrero S, Salas E, et al. Stable Conjugates of Peptides with Gold Nanorods for Biomedical Applications with Reduced Effects on Cell Viability. ACS Appl. Mater. Interfaces. 2013;5(10):4076–4085. doi:10.1021/am3028537
26. Nikoobakht B, El-Sayed MA. Preparation and Growth Mechanism of Gold Nanorods (NRs) Using Seed-Mediated Growth Method. Chem. Mater. 2003;15(10):1957–1962. doi:10.1021/cm020732l
27. Huang X, Peng X, Wang Y, et al. A Reexamination of Active and Passive Tumor Targeting by Using Rod-Shaped Gold Nanocrystals and Covalently Conjugated Peptide Ligands. ACS Nano. 2010;4(10):5887–5896. doi:10.1021/nn102055s
28. Tapia-Arellano A, Gallardo-Toledo E, Ortiz C, et al. Functionalization with PEG/Angiopep-2 peptide to improve the delivery of gold nanoprisms to central nervous system: in vitro and in vivo studies. Mater Sci Eng C. 2021;121:111785. doi:10.1016/j.msec.2020.111785
29. Wang J-L, Du X-J, Yang J-X, et al. The effect of surface poly(ethylene glycol) length on in vivo drug delivery behaviors of polymeric nanoparticles. Biomaterials. 2018;182:104–113. doi:10.1016/j.biomaterials.2018.08.022
30. Lankveld DPK, Rayavarapu RG, Krystek P, et al. Blood clearance and tissue distribution of PEGylated and non-PEGylated gold nanorods after intravenous administration in rats. Nanomedicine. 2011;6(2):339–349. doi:10.2217/nnm.10.122
31. Naz F, Koul V, Srivastava A, Gupta YK, Dinda AK. Biokinetics of ultrafine gold nanoparticles (AuNPs) relating to redistribution and urinary excretion: a long-term in vivo study. J Drug Targeting. 2016;24(8):720–729. doi:10.3109/1061186X.2016.1144758
32. Pieper-Fürst U, Lammert F, Emes RD, Mitchison HM. Bioinformatic perspectives in the neuronal ceroid lipofuscinoses. BBA. 2013;1832(11):1831. doi:10.1016/j.bbadis.2012.12.010
33. Zhang JZ. Biomedical Applications of Shape-Controlled Plasmonic Nanostructures: a Case Study of Hollow Gold Nanospheres for Photothermal Ablation Therapy of Cancer. J Phys Chem Lett. 2010;1(4):686–695. doi:10.1021/jz900366c
34. Pérez A, Rodríguez A, Sanchez-Carpintero M, Liberato C, García C. Cyclooxygenase‐2‐positive macrophages infiltrate the Alzheimer’s disease brain and damage the blood–brain barrier. European journal of clinical investigation. Seram. 1994.
35. Velasco Aguirre C, Disponible en; 2017. Available from:https://repositorio.uchile.cl/handle/2250/169790.
36. Floerl S, Kuehne A, Hagos Y. Functional characterization and comparison of human and mouse organic anion transporter 1 as drugs and pesticides uptake carrier. Int J Mol Sci. 2022;175:106217
37. Fiala M, Liu J, Qn F, et al. Cyclooxygenase‐2‐positive macrophages infiltrate the Alzheimer’s disease brain and damage the blood–brain barrier. Eur J Clin Invest 2002:360.
38. Hultman K, Strickland EH, S Fau N, Norris EH. Metabolic syndrome in New Zealand Obese mice promotes microglial-vascular interactions and reduces microglial plasticity. J Cereb Blood Flow and Metab. 2013;2023.
39. Montagne A, Barnes SR, Sweeney MD, et al. Blood-brain barrier breakdown in the aging human hippocampus. Neuron. 2015;85:296.
40. Sengillo JD, Winkler CT, Ea F, et al. Deficiency in Mural Vascular Cells Coincides with Blood–Brain Barrier Disruption in A lzheimer’s Disease. Brain Pathol. 2013:23(3);303.
41. Ordonez-Gutierrez L, Fernandez-Perez I, Herrera JL, Anton M, Benito-Cuesta I, Wandosell F. AβPP/PS1 Transgenic Mice Show Sex Differences in the Cerebellum Associated with Aging. J Alzheimers Dis. 2016;54(2):645–656. doi:10.3233/JAD-160572
42. Garcia-Alloza M, Em R, Zhang-Nunes SX, et al. Characterization of amyloid deposition in the APPswe/PS1dE9 mouse model of Alzheimer disease. B J Bacskai and M P Frosch. 2006;516.
 © 2023 The Author(s). This work is published and licensed by Dove Medical Press Limited. The
full terms of this license are available at https://www.dovepress.com/terms
and incorporate the Creative Commons Attribution
- Non Commercial (unported, 3.0) License.
By accessing the work you hereby accept the Terms. Non-commercial uses of the work are permitted
without any further permission from Dove Medical Press Limited, provided the work is properly
attributed. For permission for commercial use of this work, please see paragraphs 4.2 and 5 of our Terms.
© 2023 The Author(s). This work is published and licensed by Dove Medical Press Limited. The
full terms of this license are available at https://www.dovepress.com/terms
and incorporate the Creative Commons Attribution
- Non Commercial (unported, 3.0) License.
By accessing the work you hereby accept the Terms. Non-commercial uses of the work are permitted
without any further permission from Dove Medical Press Limited, provided the work is properly
attributed. For permission for commercial use of this work, please see paragraphs 4.2 and 5 of our Terms.