Back to Journals » Clinical Epidemiology » Volume 14
Differences in Classification Standards For the Prevalence of Overweight and Obesity in Children. A Systematic Review and Meta-Analysis
Authors Llorca-Colomer F, Murillo-Llorente MT ![]() , Legidos-García ME, Palau-Ferré A, Pérez-Bermejo M
, Legidos-García ME, Palau-Ferré A, Pérez-Bermejo M ![]()
Received 26 May 2022
Accepted for publication 17 August 2022
Published 1 September 2022 Volume 2022:14 Pages 1031—1052
DOI https://doi.org/10.2147/CLEP.S375981
Checked for plagiarism Yes
Review by Single anonymous peer review
Peer reviewer comments 2
Editor who approved publication: Professor Vera Ehrenstein
Francisco Llorca-Colomer,1,2 María Teresa Murillo-Llorente,1 María Ester Legidos-García,1 Alma Palau-Ferré,1 Marcelino Pérez-Bermejo1
1SONEV Research Group, School of Medicine and Health Sciences, Catholic University of Valencia, Valencia, Spain; 2Doctoral School, Health Program. Catholic University of Valencia, Valencia, Spain
Correspondence: Marcelino Pérez-Bermejo, SONEV Research Group, School of Medicine and Health Sciences, Catholic University of Valencia, C/Quevedo N° 2, Valencia, 46001, Spain, Tel/Fax +34 620984639, Email [email protected]
Abstract: The prevalence of childhood obesity has increased dramatically all over the world in recent years. While obesity in adults can be easily measured using the BMI calculation, determining overweight and obesity in children is more controversial. The aim was to compare the three most used international classification systems (WHO 2007, CDC 2000 and Cole-IOTF) to determine overweight and obesity in infant and adolescent populations. We performed a systematic review in accordance with the PRISMA 2020 guidelines of articles comparing any of the three classification systems. The main findings were that the WHO 2007 criteria show the highest prevalence of overweight and obesity in the child and youth population. The prevalence of childhood overweight and obesity was determined to be higher in boys than in girls in most studies, when analysing the classifications of the WHO 2007, CDC 2000 and Cole-IOTF together. However, there was a higher prevalence of overweight and obesity in girls than in boys when only the CDC 2000 and Cole-IOTF criteria were considered. Both the results of the review and the great heterogeneity found in the meta-analysis show that it is necessary to unify the criteria for the classification of childhood overweight and obesity. International standards are insufficient for working with the current population. A working group should be created to address this issue and agree on the unification of a gold standard, taking into account the geographical region, the ethnic groups and the age groups of the child and youth population and above all, the secular growth.
Keywords: BMI, WHO 2007, CDC 2000, IOTF, growth curve
Introduction
Overweight and obesity are defined as an abnormal or excessive accumulation of fat that can harm health.1 Obesity has a multifactorial origin that involves both genetic and environmental factors.2 Several studies showed that excess body fat increased the risk of multiple comorbidities, such as high blood pressure, coronary heart disease, type 2 diabetes, insulin resistance, and cancer.3–5
Globally, the prevalence of obesity and overweight tripled in the child and youth populations from the mid-1970s (about 4%) to 2016 (greater than 18%). In 2016, more than 330 million children and adolescents were affected by overweight or obesity globally. It is estimated that by 2030 nearly 30% of all children will be affected by overweight or obesity.6 For this reason, childhood obesity is a major public health problem worldwide.7
Height and weight are the anthropometric variables that have traditionally been used to evaluate growth, other indicators such as Body Mass Index (BMI) have also been used.8–10 BMI is a measure of weight relative to height (weight in kilograms divided by the square of height in meters).11 Since BMI is easy to determine and correlates with body fatty tissue, it is the most frequently used parameter to assess excess body fat in children and adolescents.12–14 In addition, BMI has been routinely used to analyse overweight and obesity in children and adults worldwide, as in addition to being practical and easy to calculate it is universally applicable.15–18
Currently, there are three classification systems most frequently used to evaluate overweight and childhood obesity. These are: the criteria of the World Health Organization (WHO) published in 2007 (WHO 2007),19 the tables of the Centers for Disease Control and Prevention (CDC) 2000 (CDC 2000)20 and the International Obesity Task Force (IOTF or Cole-IOTF) standards.18
The WHO curves published in 2007 show a population of 5 to 19 years and constitute a reconstruction of the previously recommended reference of growth (NCHS/WHO 1977). They include original data from the National Center for Health Statistics (NCHS), complemented by growth pattern data for children up to 5 years of age, based on a multicentre study (MGRS) conducted in six countries (Brazil, Ghana, India, Norway, Oman, and the United States).18–21
WHO classifies overweight as the weight for height greater than 1 standard deviation above the median of the WHO reference growth standard. Obesity is defined as the weight for height greater than 2 standard deviations above the median of the WHO growth reference standard.18–21
The CDC 2000 references are based on the growth curves developed by the National Center for Health Statistics (NCHS) in 1977, associating data from 5 cross-sectional studies (National Health and Nutrition Examination Surveys - NHES II, III and NHANES I, II, III) conducted between 1963 and 1994, in the American paediatric population. Their cut-off points define overweight for BMI equal to or greater than the 85th percentile and less than the 95th percentile, and obesity for BMI greater than the 95th percentile, according to age and sex.18,20,21
Authors such as Cole et al22 published BMI curves elaborated by extrapolation of the cut-off points defined for adults to classify overweight as (25–30 kg/m2) and obesity as (>30 kg/m2) according to age group and sex. These curves were constructed from population studies carried out in 6 countries (Brazil, Great Britain, Hong Kong, the Netherlands, Singapore and the United States) between 1963 and 1993 and apply to children and adolescents of both sexes, between 2 and 18 years of age. Due to their international scope, these references were recommended by the IOTF.18,20–22
Therefore, determining the choice of reference is critical, since various studies indicate that these classifications can provide disparate results and produce a significant bias in the diagnosis of individuals and infant-juvenile populations.23–28
Since there is currently no consensus on which reference to use, we performed this systematic review and meta-analysis with the main aim of comparing the three most commonly used international classification systems (WHO 2007, CDC 2000 and Cole-IOTF) and the level of agreement between them.
Materials and Methods
When applicable to literature and data, we performed the review in accordance with the PRISMA 2020 guidelines.29 Registration no CRD42022323402 on PROSPERO: International prospective register of systematic reviews (https://www.crd.york.ac.uk/prospero/).
Inclusion Criteria
The works eligible for inclusion in this review were articles from the last 10 years, between the years 2010 to 2021 in which the sample was composed of individuals under 19 years of age. Articles comparing at least two of the international BMI ratings such as WHO 2007, CDC 2000 or Cole-IOTF for underweight, healthy weight, overweight and obesity were considered, regardless of whether they matched their own regional or national references.
Studies were excluded during the title and abstract selection stage if they were research articles whose language was other than English or Spanish and/or if the full text article could not be obtained. During the full text review, we excluded studies with a different age range (over 19 years) than specified above. We also excluded studies that did not study the prevalence of overweight and childhood obesity. In addition, we discarded articles where such prevalence was not compared with any of the three main international classification systems proposed.18–20
Sources of Information and Search Strategy
The search was carried out for relevant articles in the Medline and Web of Science databases in the period between April and May 2022. The search strategy used the Medical Subject Headings (MeSH) terms: “Body Mass Index”, “Overweight”, “Obesity”, “Children” and “Reference standards”, combined using the Boolean operators “AND”, “OR” and “NOT”. The search strategies used can be found in the Supplementary Material.
Selection Process
All items retrieved from searches were imported into EndNote and duplicates were removed. Each of the authors independently reviewed the remaining articles by title and summary for inclusion and then performed a full text review for methodological reasons of exclusion, based on inclusion criteria.
Data Extraction and Quality Assessment
For each article, one author independently among authors extracted the specific condition, its prevalence or incidence, the classification method or methods used, the age ranges involved and the regions or countries where the study was carried out.
The Joanna Briggs Institute (JBI) checklist30 for analytical cross-sectional studies was used to assess study quality as the percentage achieved on the checklist.
Synthesis Methods
The synthesis process began by analysing all the main findings and conclusions. Once the synthesis was completed, we classified the prevalence of overweight, obesity or excess weight by age, comparing them with the different international classification systems used. Figure 1 shows the flowchart we followed for the systematic literature review process and Table 1 shows the main results from the selected articles.
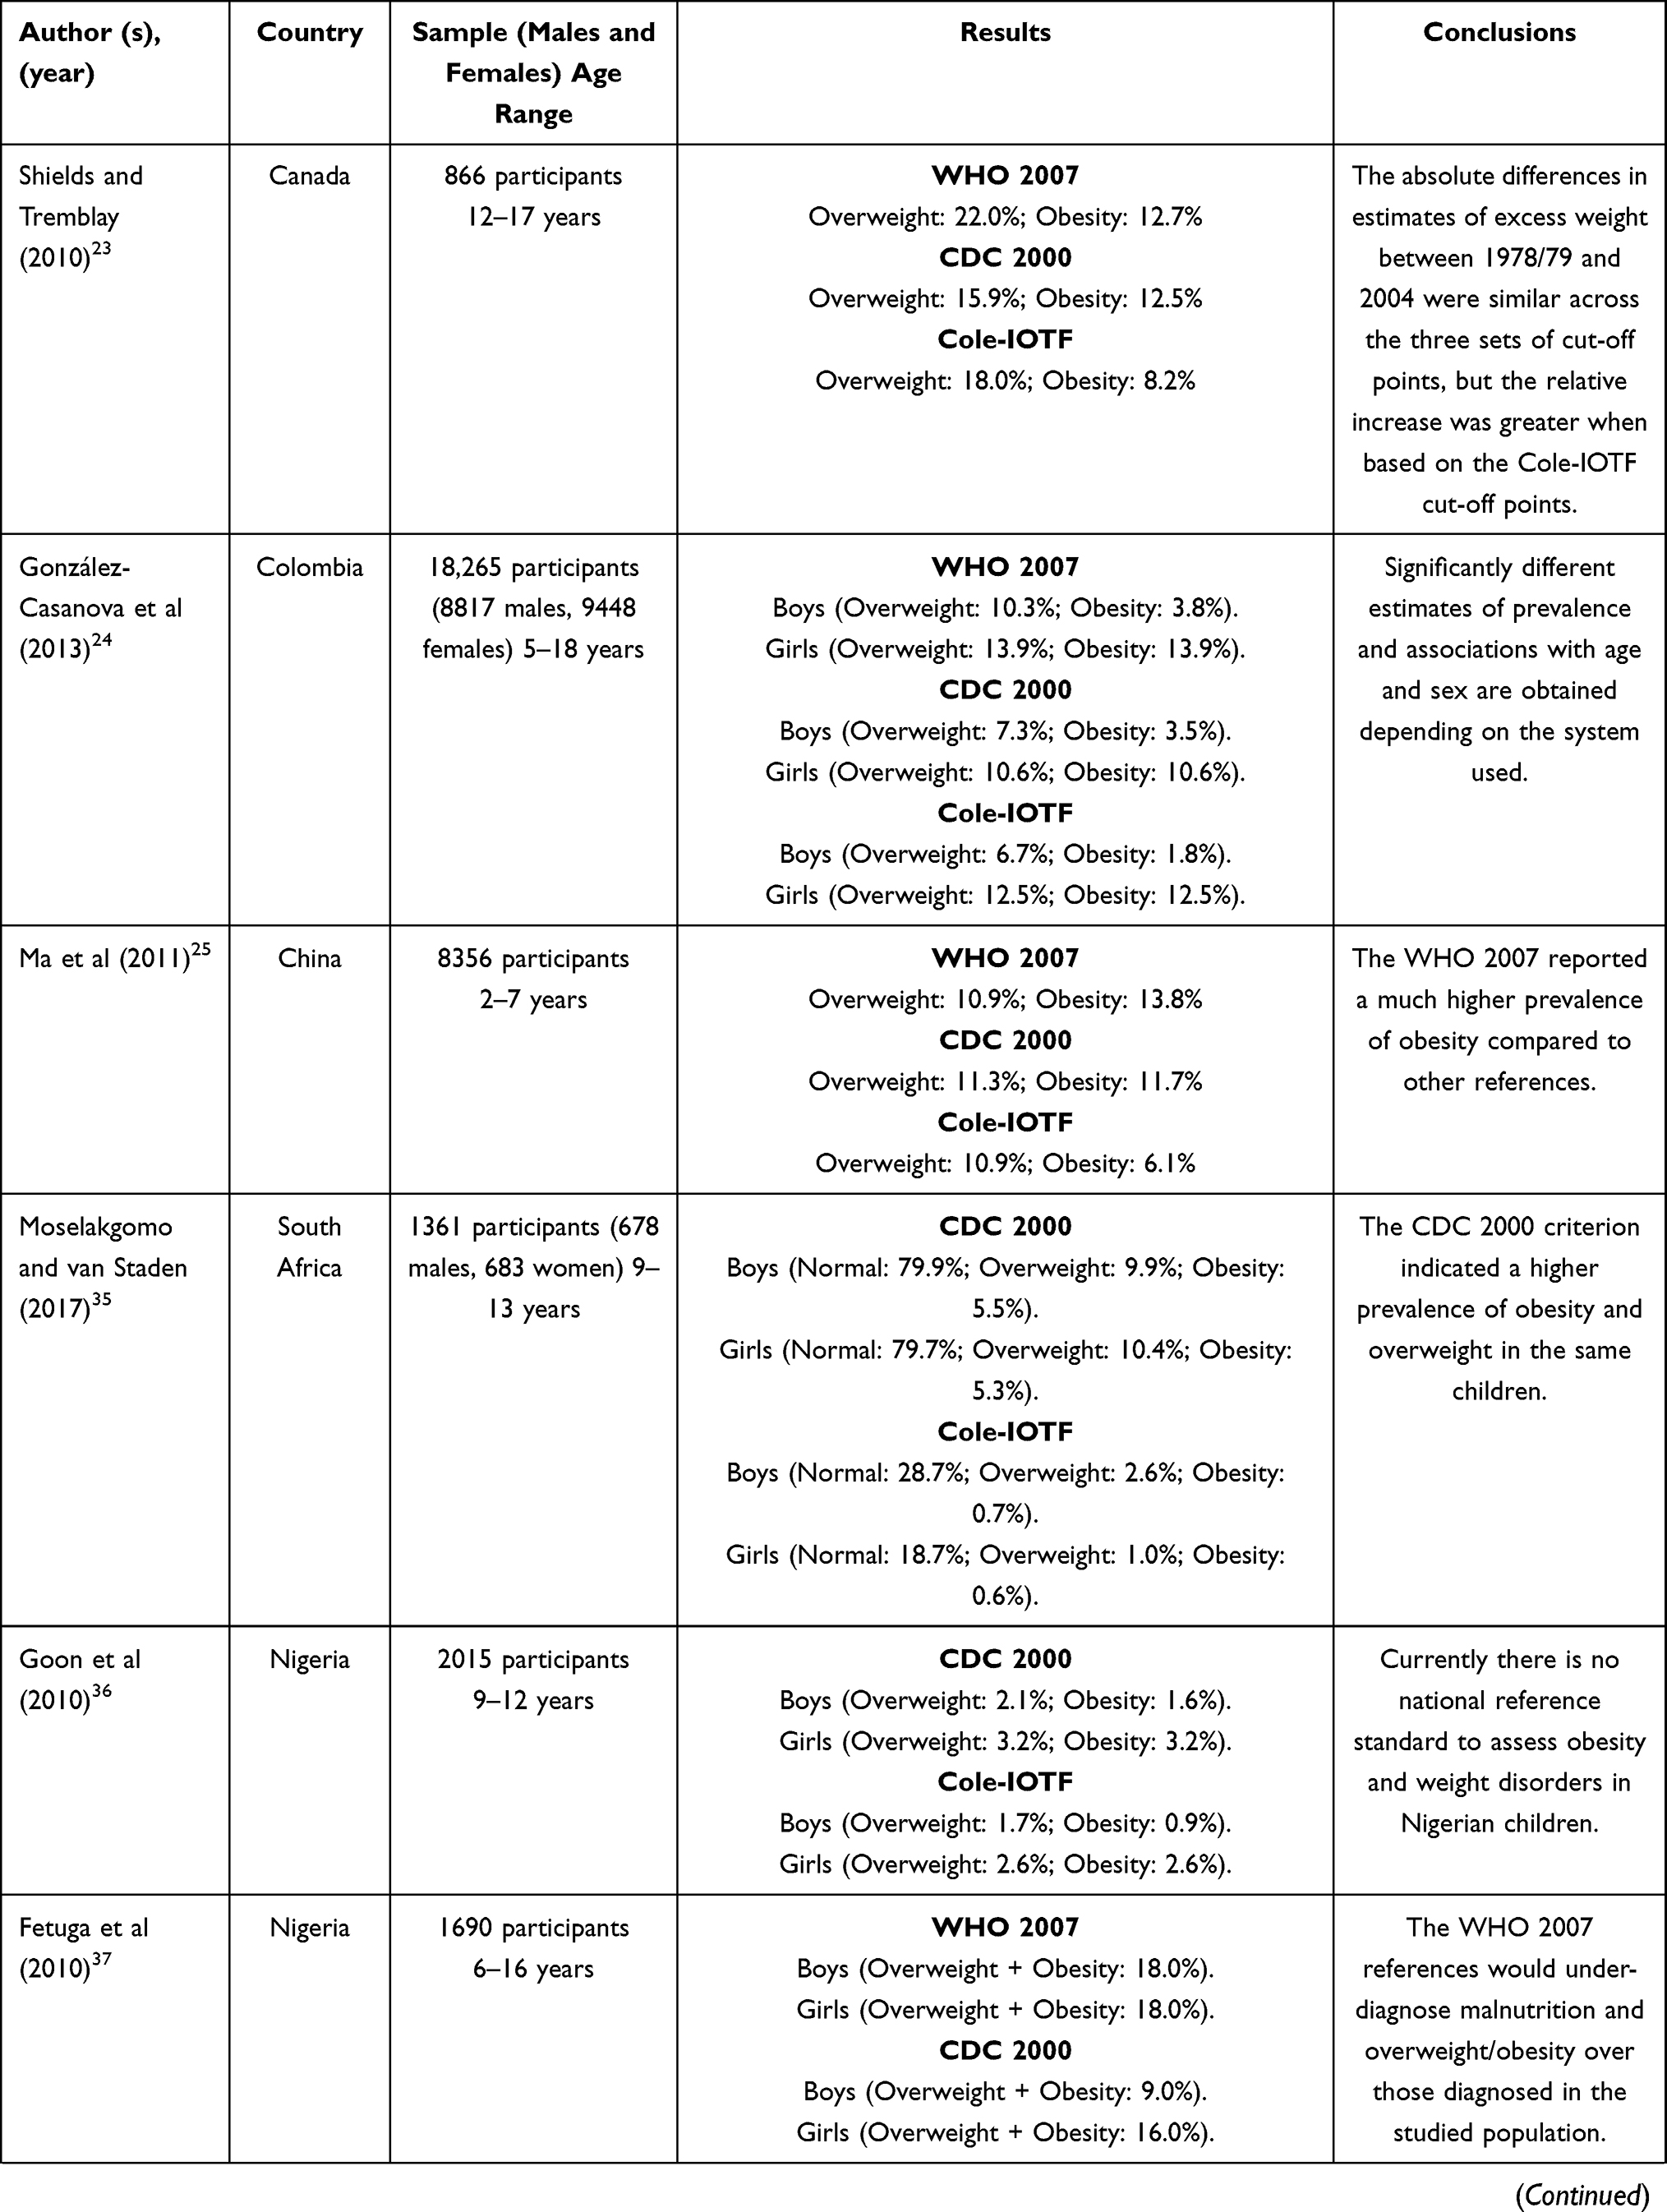 |  |  | 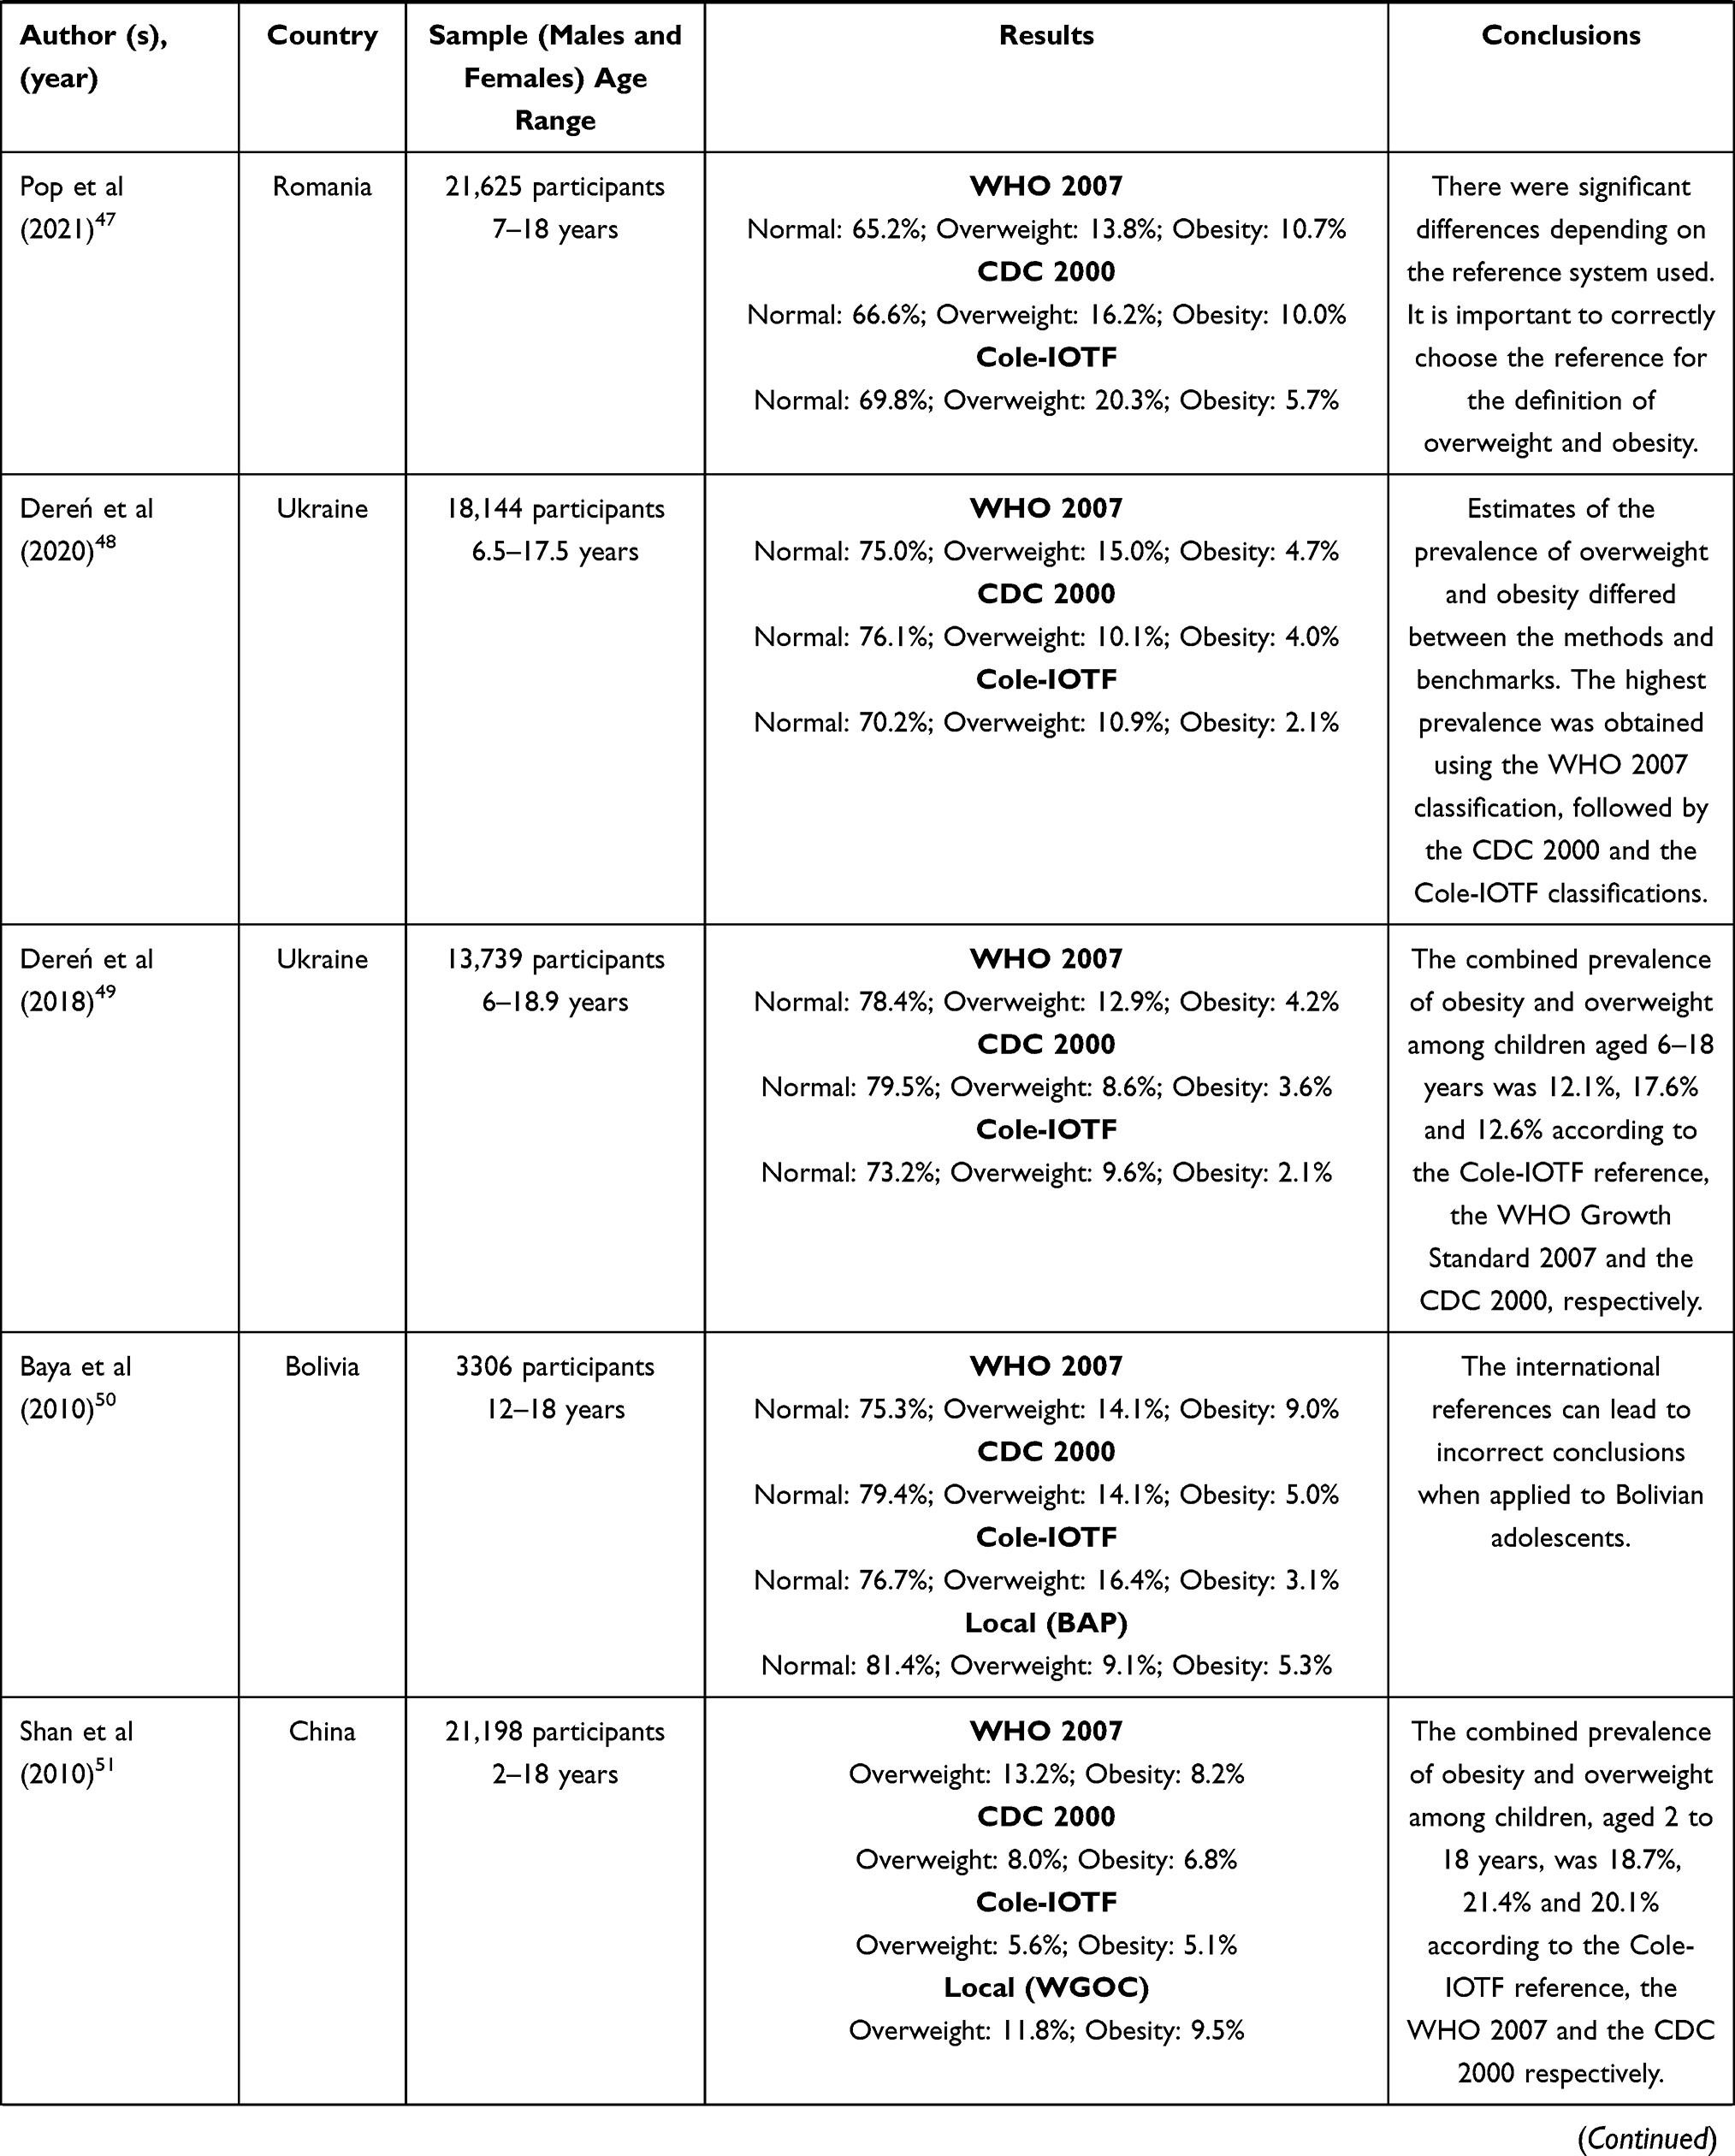 | 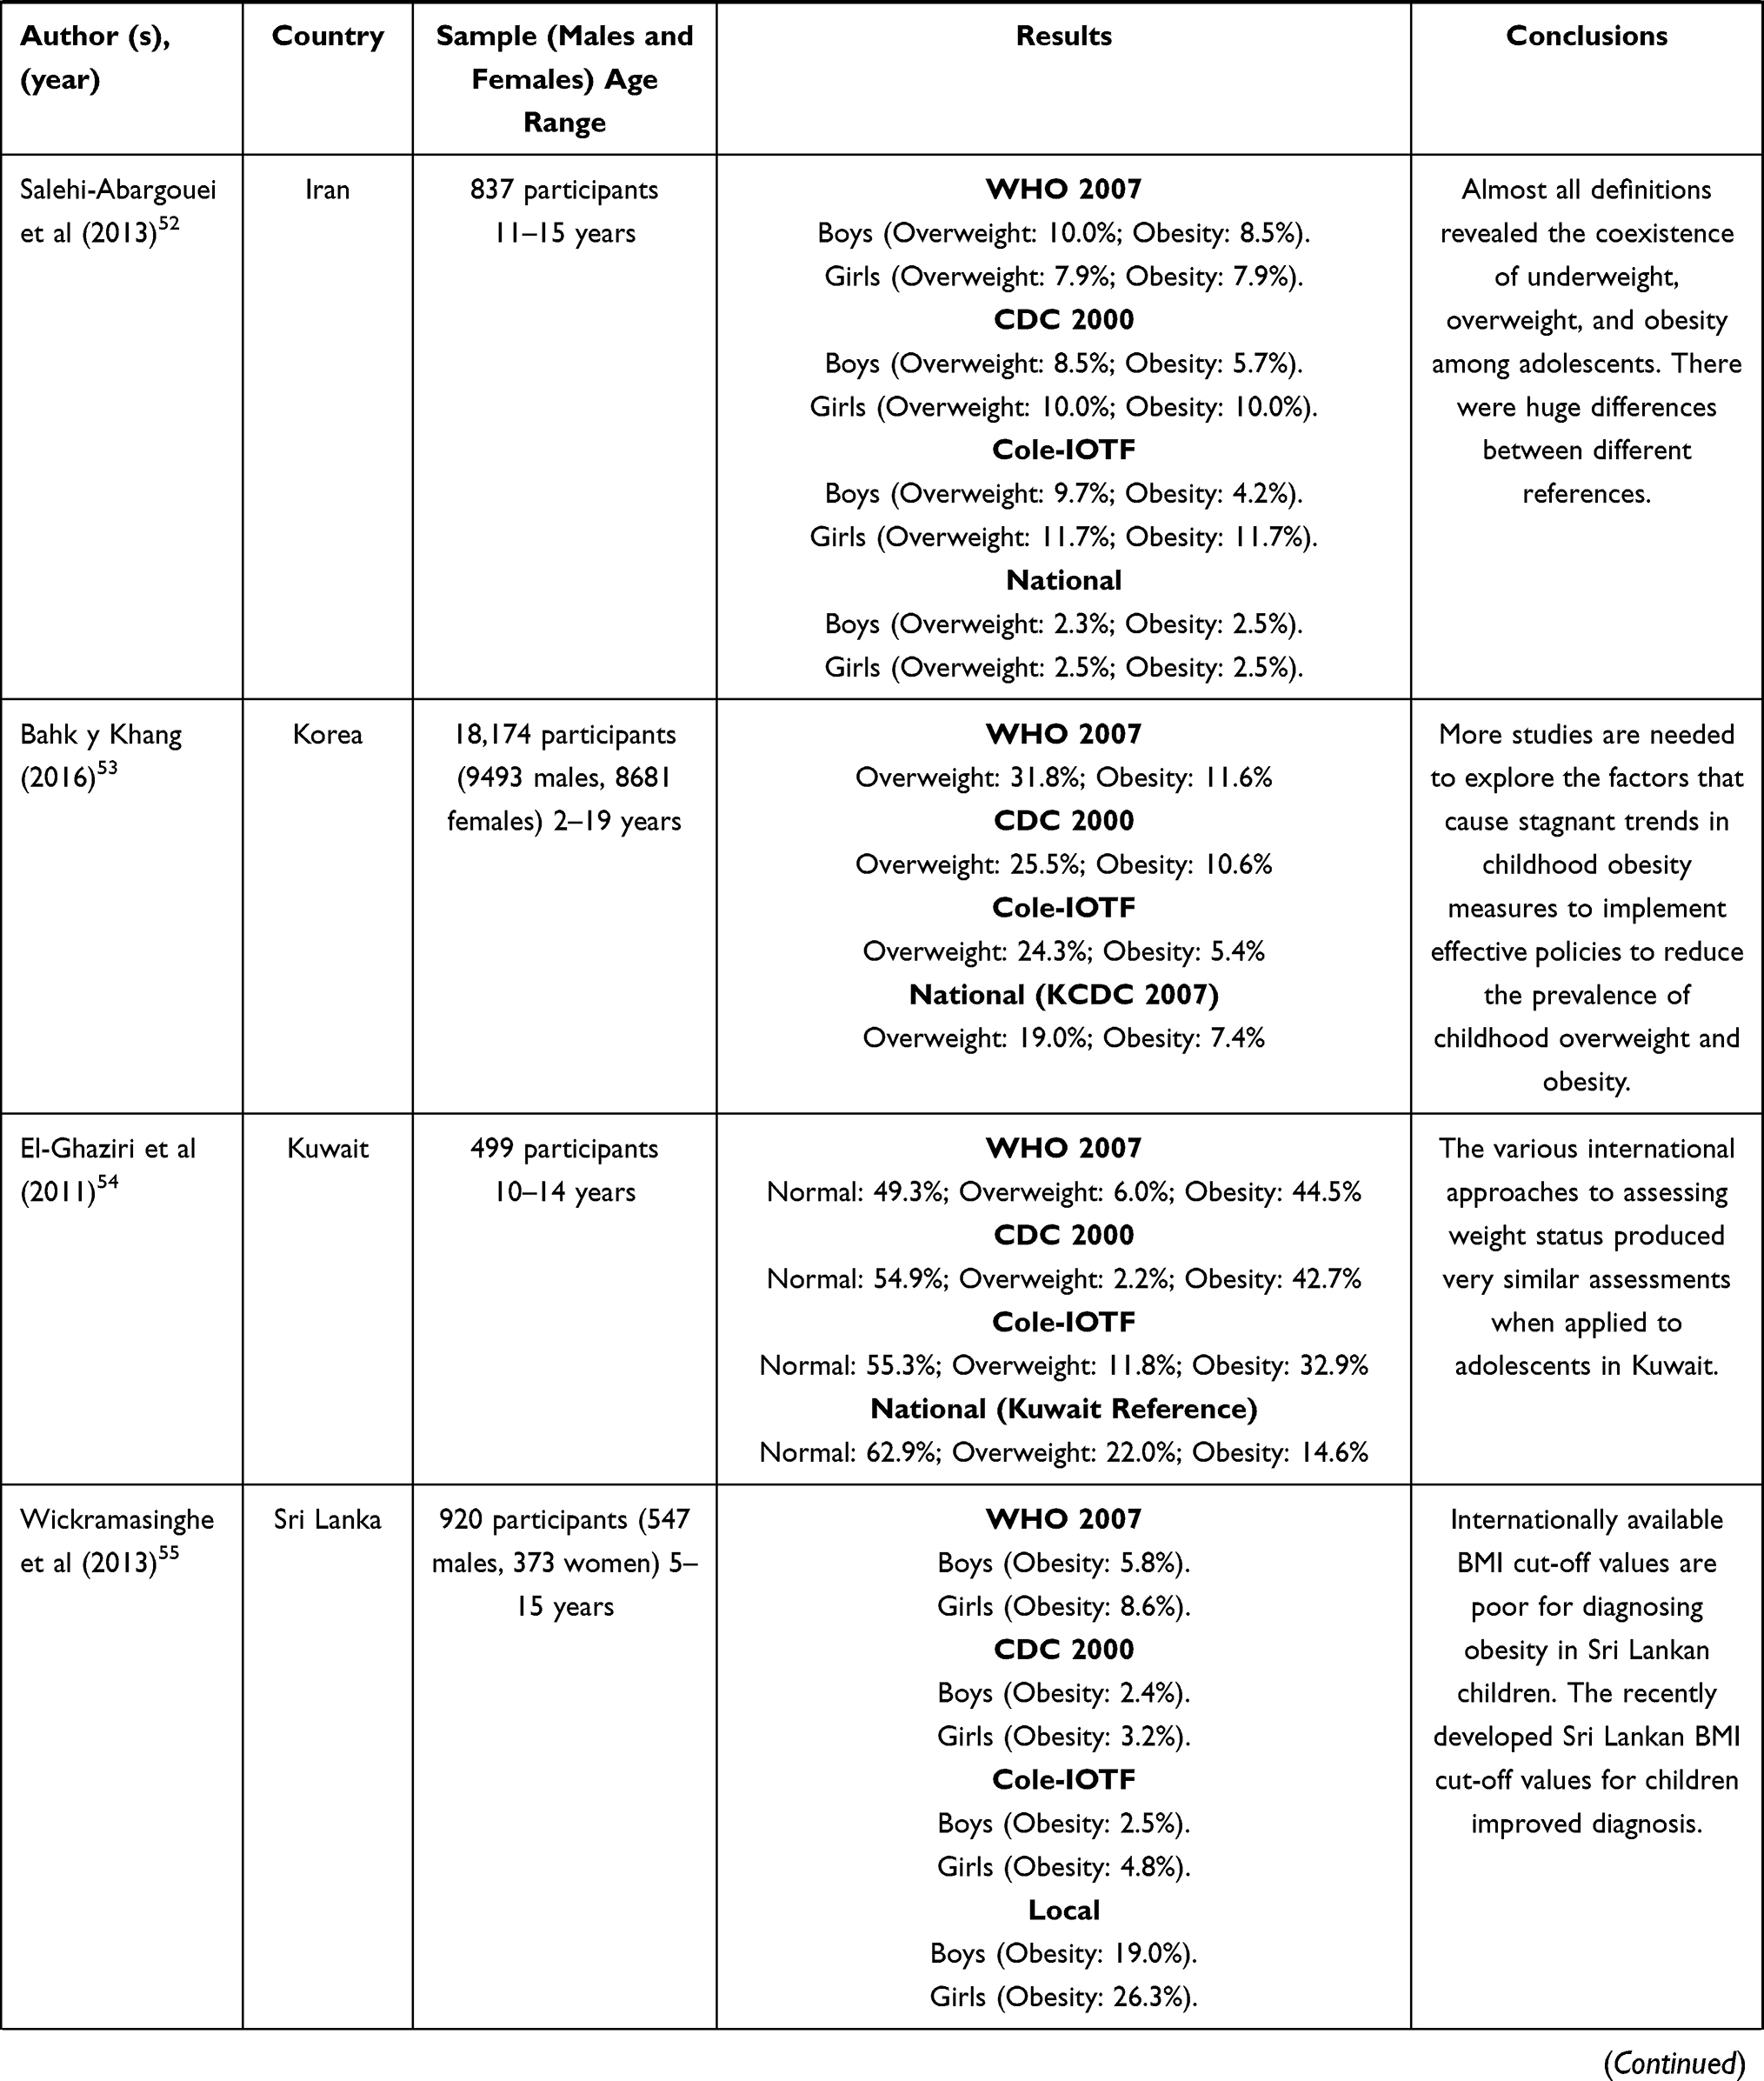 | 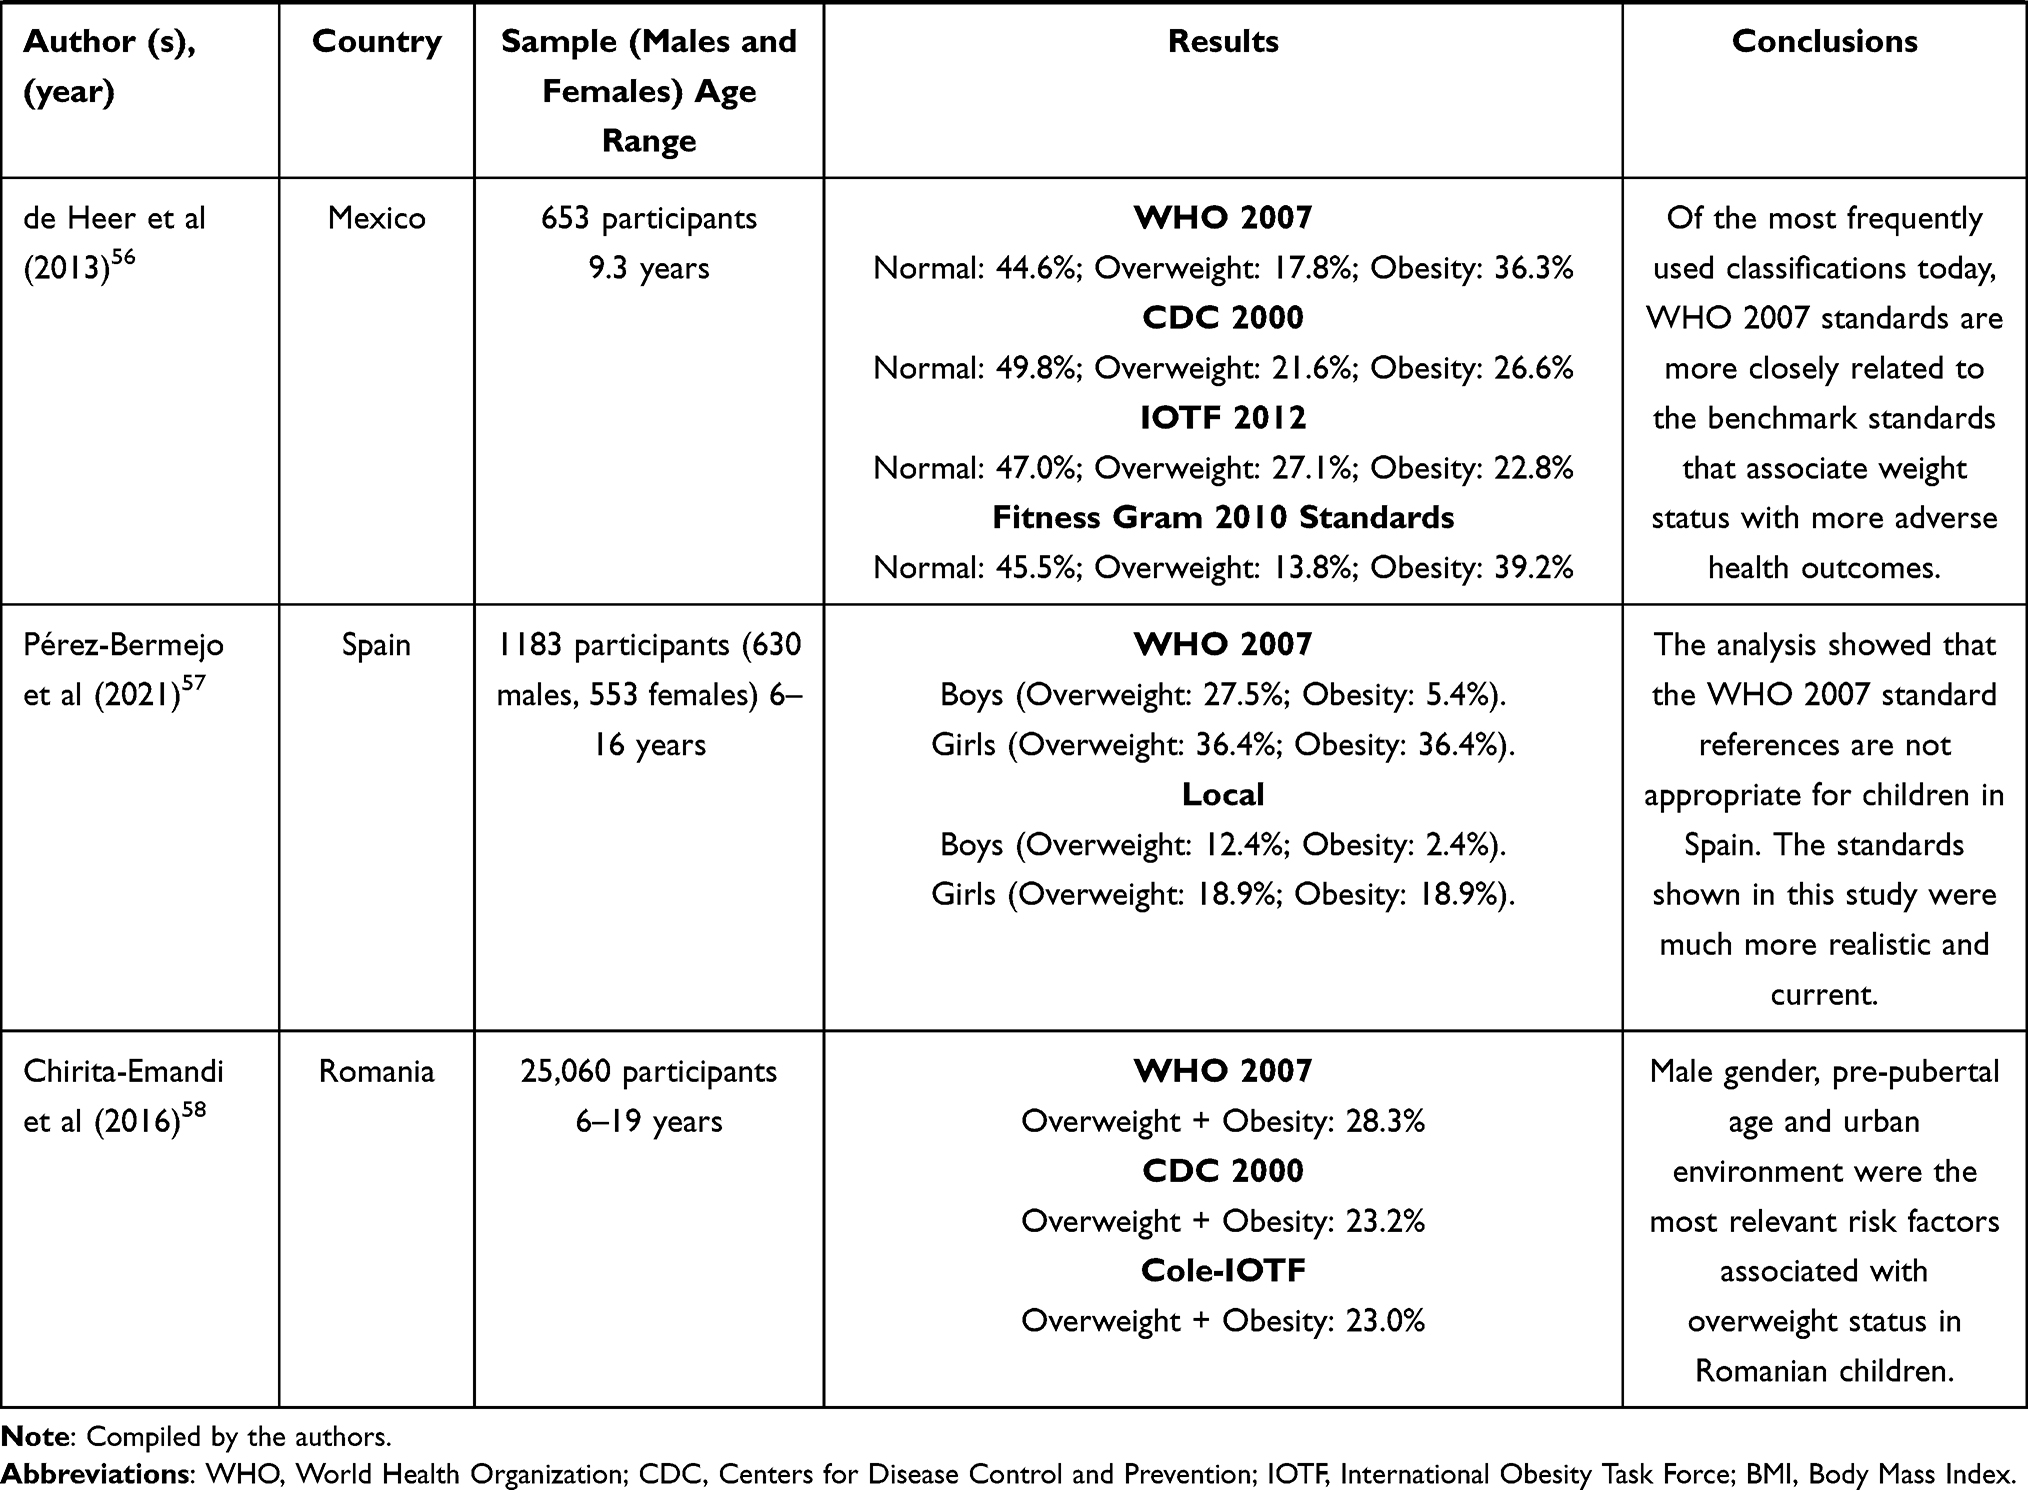 |
Table 1 Summary of Articles included |
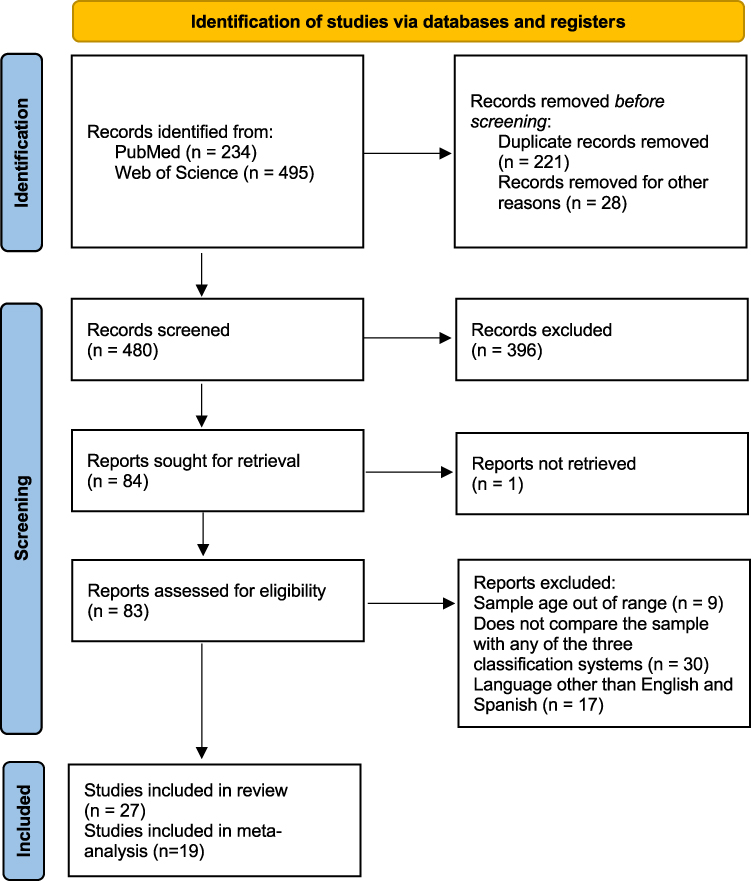 |
Figure 1 Prisma flow diagram (2020). |
Statistical Analysis
We conducted an overall pooled prevalence of childhood overweight and obesity meta-analysis, as well as a subgroup meta-analysis. We assessed heterogeneity between studies using Cochran’s Q test and I2 index. In Cochran’s Q test, we interpret significant heterogeneity when p < 0.05. For the I2 index, high degree of heterogeneity was considered in values higher than 50%.31 As the result of the test for heterogeneity was very high, we decided to use a random-effects meta-analysis to calculate the combined global prevalence of overweight and obesity with 95% CI.32 To examine the individual influence of each study, we applied a leave-1-out sensitivity analysis.33 Publication bias was assessed qualitatively by visual inspection of funnel plot and quantitatively by Egger’s linear regression test.34 Only the 19 studies that analysed the prevalence of overweight and obesity with the three international standards were included in the meta-analysis.
Results
Figure 1 shows that the literature search identified 729 results. After removing duplicates and performing the screening process for the remaining articles, we selected 84 articles for full-text review, of which 27 studies met the inclusion criteria.23–25,35–58 Table 1 summarises the results obtained from the search of the selected studies. Table 2 shows the quality assessment of the studies.
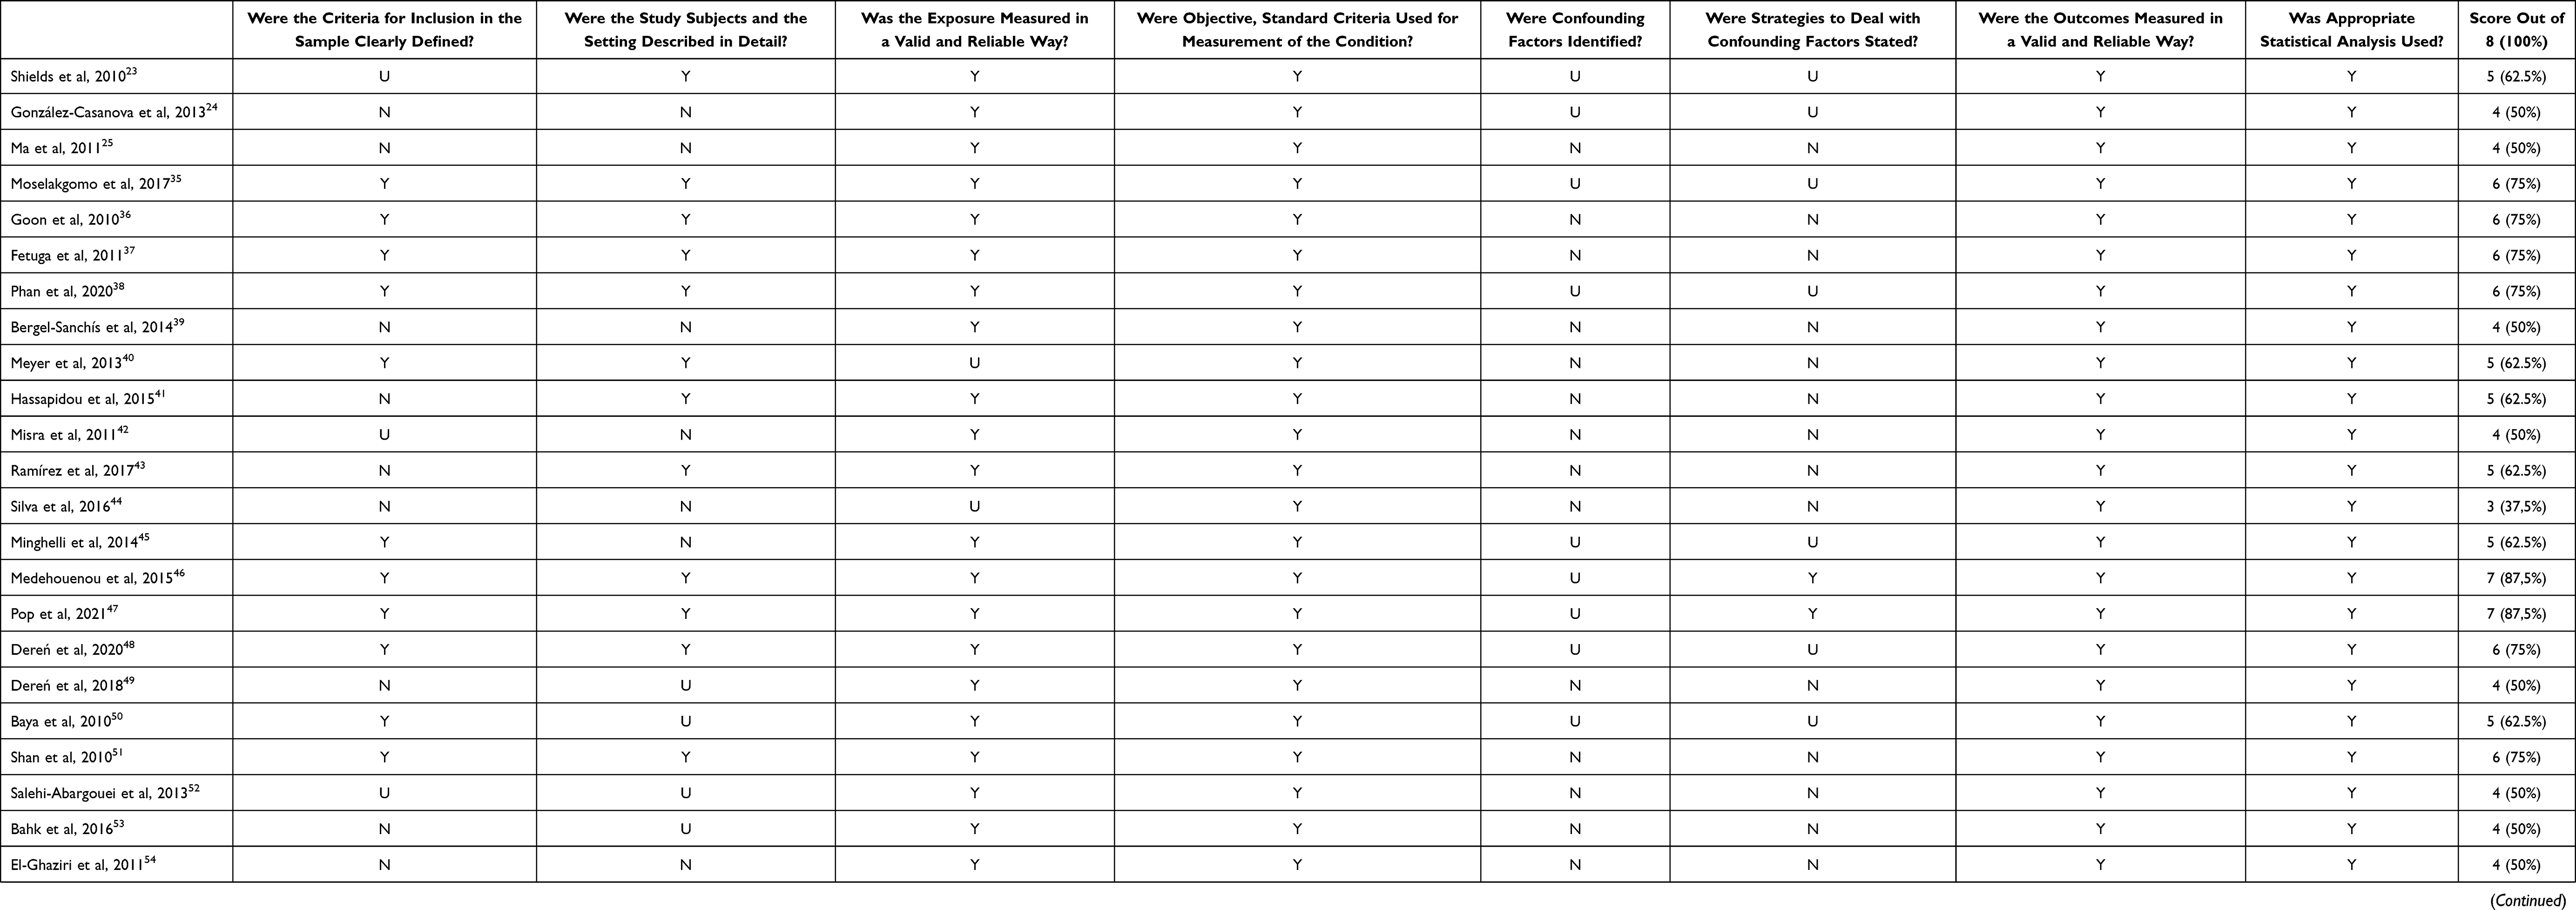 |
Table 2 Studies Appraised Using the Joanna Briggs institute Critical Appraisal Checklist For Analytical Cross-Sectional Studies |
CDC 2000 Vs Cole-IOTF Classification
The study by Mosellekgomo and van Staden35 conducted in South Africa found that the CDC classification indicated a very higher prevalence of overweight and obesity in both males and females compared to the IOTF classification. The same occurred in the work of Goon et al36 in Nigeria, where the prevalence found using the CDC was significantly higher than that found using the IOTF classification.
WHO 2007 Vs CDC 2000 Classifications
The study by Fetuga et al37 in Nigeria, males had a significantly lower mean weight compared to females and a lower BMI compared to females. The prevalence of overweight + obesity was lower in both sexes when determined with CDC standards compared to WHO standards among individuals aged 6 to 16 years.
WHO 2007 Vs Cole-IOTF Classifications
In the study by Phan et al38 in Vietnam, they identified that the height, weight and BMI for age of the male participants were slightly higher than the indices of the female participants. However, in this study population, they found that the percentage of body fat was significantly higher in girls compared to boys. The proportion of children affected by overweight, or obesity was higher in the age range of 11 to 12 years. In the category of obesity in children, the prevalence based on the WHO Z-score was approximately 10–15% higher than the prevalence based on the IOTF and the CDC. Also, the study carried out by Bergel Sanchís et al39 in the countries of Mexico, Venezuela and Spain found that the WHO references overestimated the prevalence of underweight, overweight and obesity in relation to the cut-off points proposed by the IOTF.
WHO 2007 Vs CDC 2000 Vs Cole-IOTF Classifications
The study by Meyer et al40 carried out in Argentina, when analysing the prevalence of obesity calculated with the different references, observed that the WHO reference gave the highest rates (29.3% compared to the CDC of 17.6% and the IOTF of 10.1%). For obesity, the differences between references were significant in all comparisons, except between the IOTF and the CDC in both sexes and age groups.
The study by Shields and Tremblay23 carried out in Canada, where it was found that in children aged 8 to 13 years, in terms of the prevalence of obesity, the cut-off points of the IOTF were uniformly higher than the cut-off points of the WHO. In addition, for children aged 10 and 11, the IOTF’s obesity cut-off points were about 3 BMI units higher than those of WHO.
At all ages, WHO cut-off points assigned higher percentages of boys and girls affected by overweight/obesity than the IOTF and CDC cut-off points.23 In the study by González-Casanova et al24 carried out in Colombia, it was found that the WHO system generally yielded the highest prevalence estimates, while the IOTF system yields the lowest.
In the study by Hassapidou et al41 conducted in Greece, it was generally observed that BMI was significantly higher in boys than in girls. Regarding overweight, the rates according to the IOTF criteria were significantly lower compared to those of the WHO and CDC, respectively. However, the CDC references showed a significantly higher prevalence of obesity compared to the IOTF and WHO, respectively. Also, in the study of Misra et al42 conducted in India, the IOTF cut-off points showed high agreement with those of the CDC and WHO, respectively.
In the study by Ramírez et al43 in Mexico, in general, the highest rates of prevalence of overweight and obesity in children were assessed with the WHO reference in both ethnic groups in all regions.
In the study by Ma et al25 in China, boys were slightly taller and heavier than girls. According to the IOTF reference, 17.1% of all children were affected by overweight or obesity. According to CDC criteria, it was 22.9% of all children and according to WHO criteria, it was 24.8% of the total. In this study, the WHO and CDC demonstrated a high level of agreement. However, the level of agreement between the WHO and IOTF and CDC was low.
In the study by Silva et al44 in Portugal, according to the IOTF, an overall prevalence of overweight was estimated at 18.7% and obesity at 13.5%. The overall prevalence of obesity and overweight was also found to be 14.9% and 20.6% using the WHO curves and 7.2% and 20.2% using the IOTF estimates. In another study carried out in Portugal by Minghelli et al45 it was found that the WHO criteria followed by the IOTF estimated the higher prevalence values of overweight and obesity compared to CDC.
In the study by Medehouenou et al46 in Canada, the prevalence of obesity was similar among boys and girls according to the CDC and WHO criteria. Also, in the study by Pop et al47 in Romania, the prevalence of overweight and obesity was higher in boys for WHO, CDC and IOTF than in girls. Obesity had a higher prevalence with the WHO than with the CDC criteria, with the lowest prevalence being when the IOTF cut-off points were used.
In the study by Dereń et al48 in Ukraine it was observed that overweight and obesity occurred more frequently among boys than girls. The IOTF and CDC classifications resulted in a lower incidence of overweight compared to the WHO criteria. In another study carried out in Ukraine by Dereń et al,49 significantly more girls were affected by underweight compared to boys. Therefore, boys were more likely to be affected by overweight than girls.
WHO 2007 Vs CDC 2000 Vs Cole-IOTF Vs National Classifications
In the study by Baya et al50 carried out in Bolivia both the CDC and WHO results indicated a higher prevalence of overweight than the BAP (national reference). In general, it was suggested that the references of the CDC, the IOTF and the WHO overestimated the prevalence of overweight in adolescents aged 13 to 18 years and the IOTF in children aged 12 to 14 years. Also, in the study by Shan et al51 conducted in China, the combined prevalence of overweight and obesity according to the WHO reference was the highest among the four criteria (WHO, CDC, IOTF and Local-WGOC).
Another study that also included a national reference was that of Salehi-Abargouei et al52 in Iran, where the use of the IOTF criteria revealed overweight among 10.8% of Iranian adolescents, without significant differences between the two sexes (9.7% of boys versus 11.7% of girls). The highest prevalence of obesity was obtained using the WHO criteria.
In the study by Bahk and Khang53 in Korea among the four sets of criteria (WHO, CDC, IOTF and the Korean national reference KCDC), the WHO criteria showed the highest prevalence of overweight and obesity in all age groups. The IOTF criteria produced the lowest prevalence of obesity in all age categories. Also, El-Ghaziri et al54 in Kuwait found no significant differences in the prevalence of healthy weight status and the combined prevalence of overweight and obesity among the WHO, CDC, and IOTF. All international approaches showed almost perfect agreement, the highest being between the CDC and WHO. The IOTF criteria showed high agreement with the WHO and CDC. In the study by Wickramasinghe et al55 in Sri Lanka, the proportions of children affected by obesity classified by the WHO criteria were slightly higher than the proportion detected by IOTF cut-off values.
WHO 2007 Vs CDC 2000 Vs Cole-IOTF Vs Other Classifications
In the study by Heer et al56 conducted in Mexico, the WHO standards showed the highest agreement with local standards. Both WHO and CDC showed better agreement with local scores than with IOTF values.
WHO 2007 Vs CDC 2000 Vs National Classifications
Finally, in the study carried out by Pérez-Bermejo et al57 in Spain, significant differences were found in BMI values according to age between the two sexes at some ages, for this reason, the authors argued that, if the WHO reference were used, the rate of overweight and obesity would be double that of national references.
Meta-Analysis Results
Table 3 shows the main results of the meta-analysis. There were 19 studies that reported the prevalence of overweight (Figure 2) and obesity (Figure 3) analysed with the three standards under study. There was significant (Q = 1617.37) and substantial heterogeneity between studies (I2 > 99% in all cases). Figure 4 shows the subgroup analysis. The difference between these subgroups was statistically significant. For overweight, Q = 6.27, p = 0.044 and for obesity, Q = 23.27, p = 0.000. In both cases, the values calculated with the WHO 2007 standard are significantly higher with a lower weight in the overall combined effect. Table 4 shows the leave-1-out sensitivity analysis of the influence of single study on the pooled prevalence of overweight and obesity in children. Therefore, no study has been excluded from the meta-analysis. Egger’s test of bias was not significant, indicating that smaller studies not reported larger estimates of the prevalence of overweight and obesity (t = 1.17; p = 0.247). A funnel plot (Figure 5) was used to assess possible publication bias, which showed no substantive asymmetry.
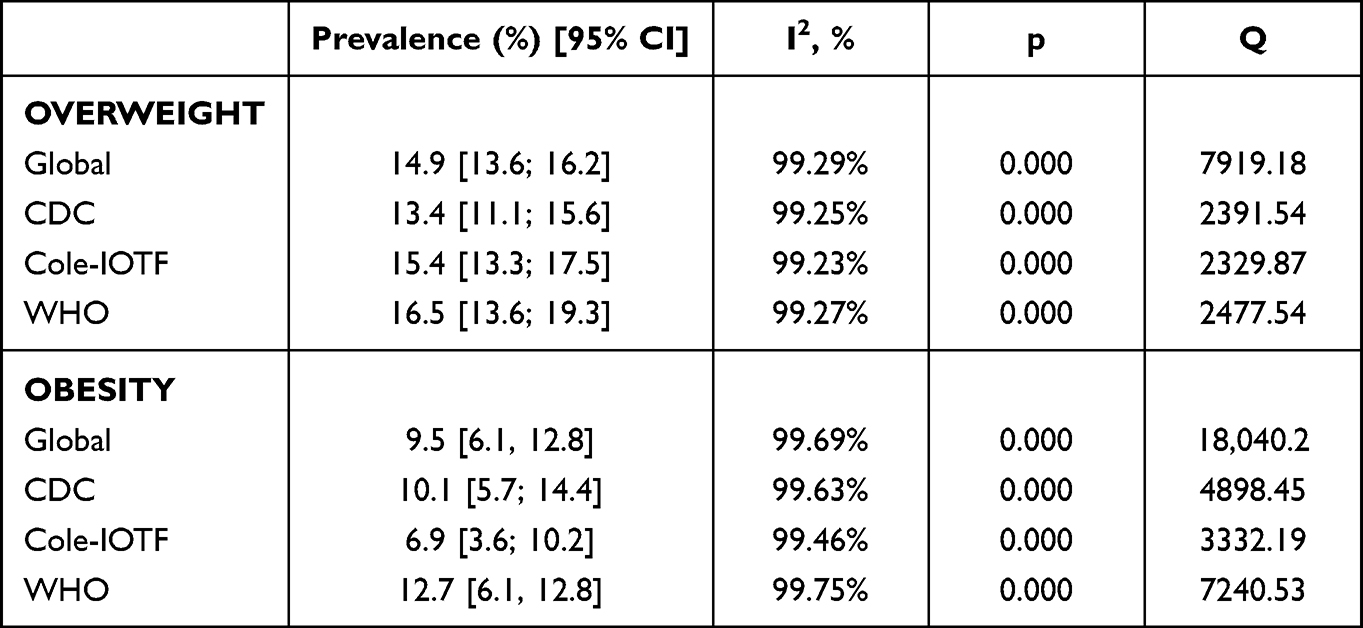 |
Table 3 Global Prevalence of Childhood Overweight and Obesity Using Random-Effects Meta-Analysis and Subgroup Meta-Analysis |
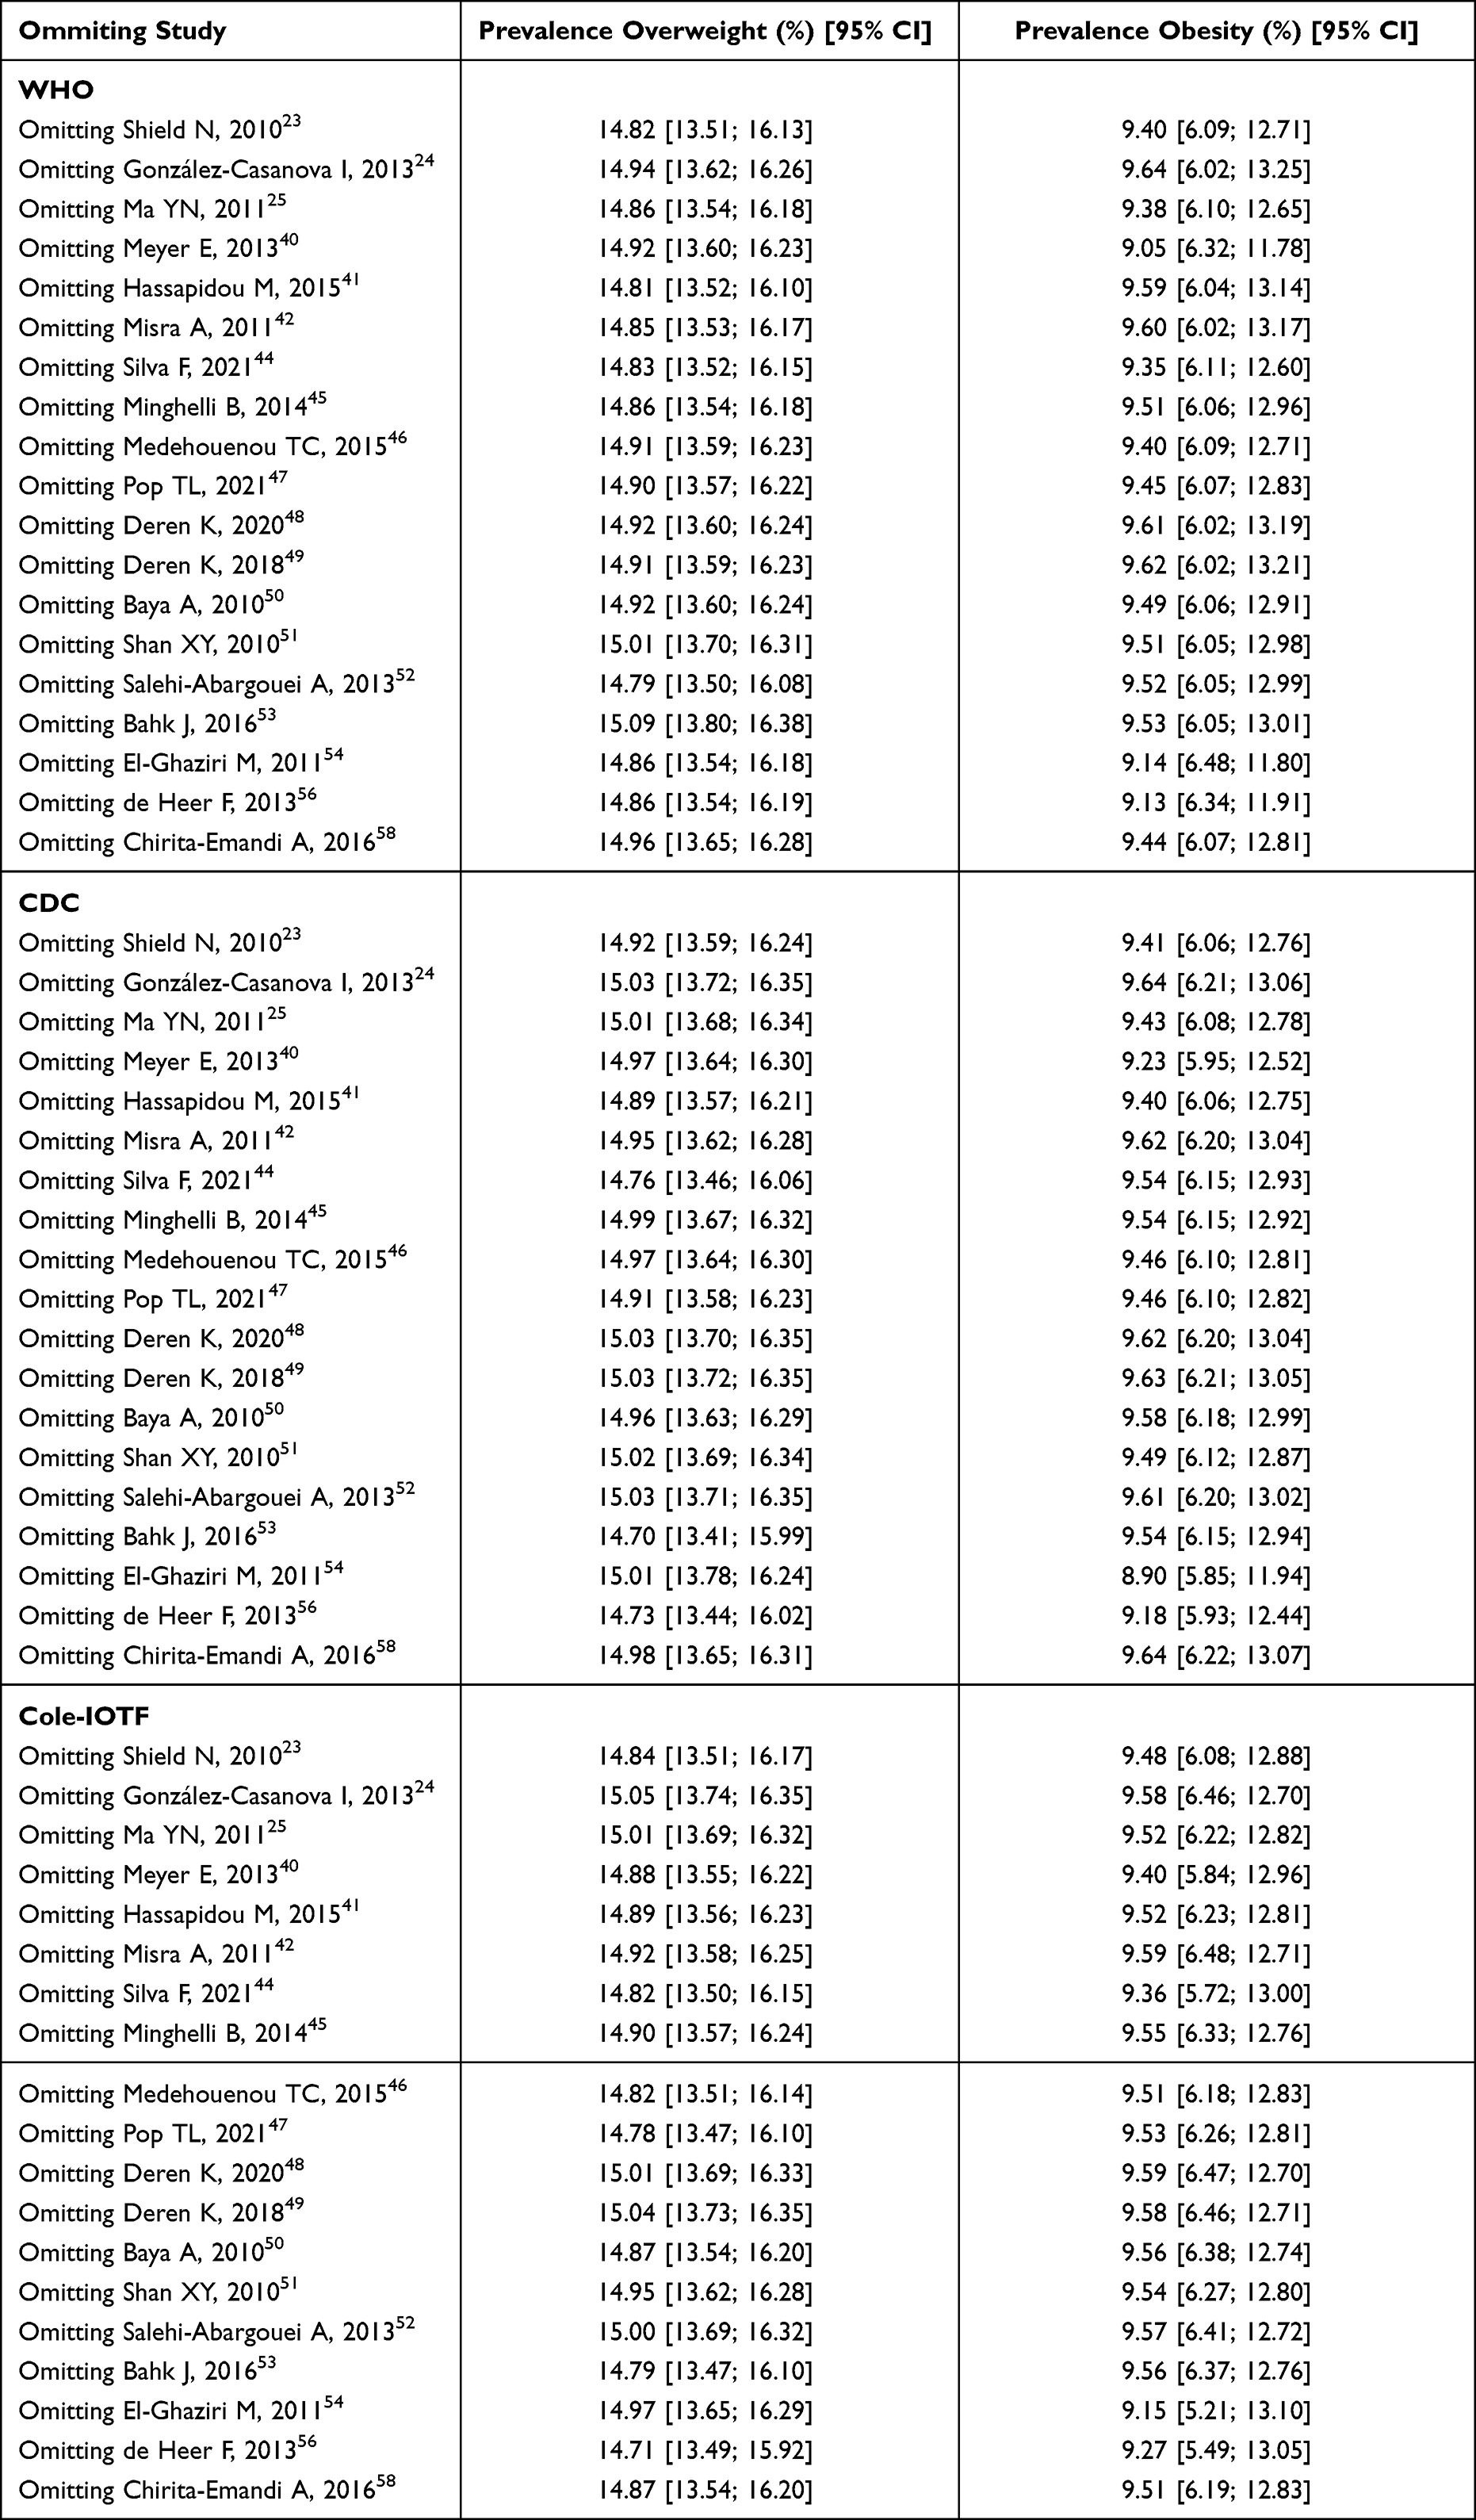 |
Table 4 Leave-1-Out Sensitivity Analysis of the influence of Single Study On the Pooled Prevalence of Overweight and Obesity in Children |
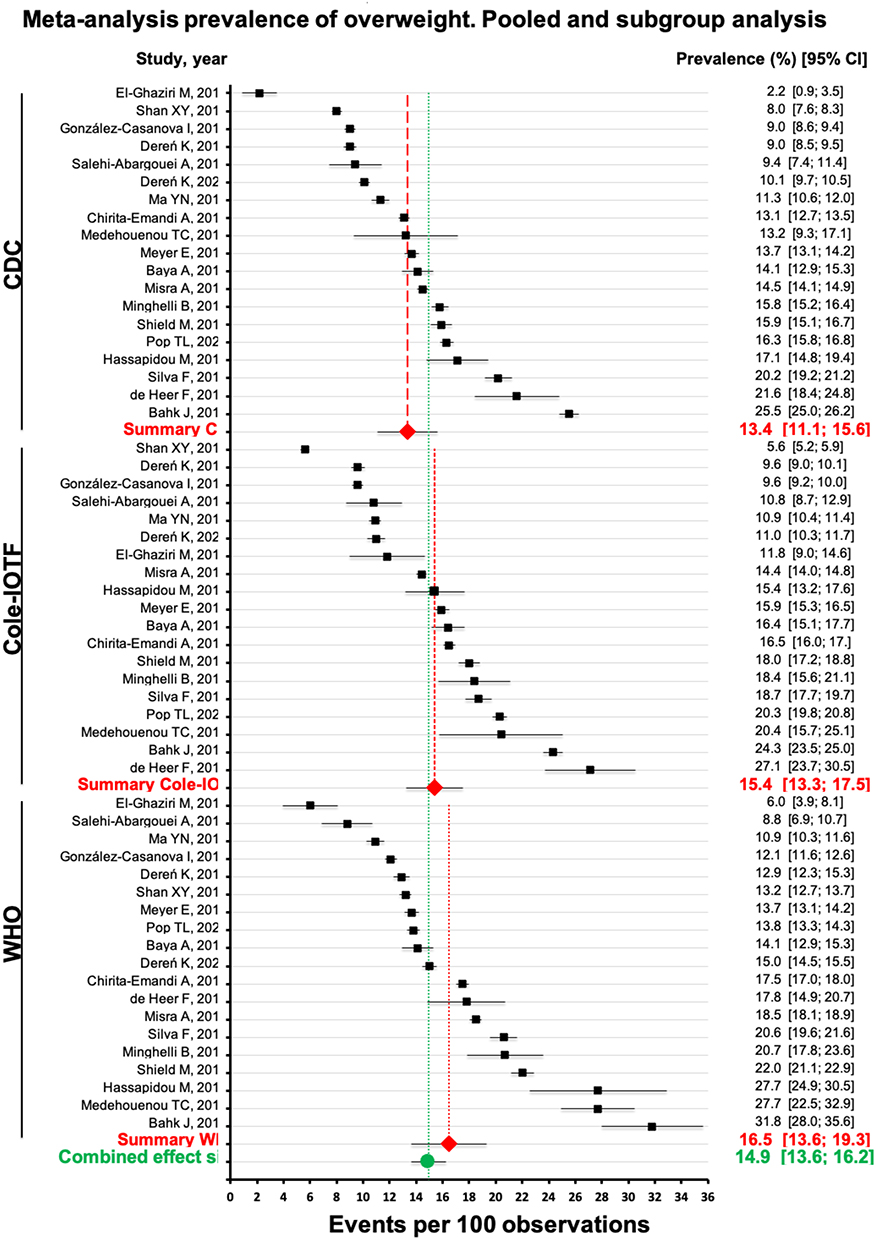 |
Figure 2 Overall and subgroup prevalence of overweight. Forest plot of the studies documenting prevalence of overweight with the three standards under study. The analysis included 19 studies with a total of 211,739 cases. |
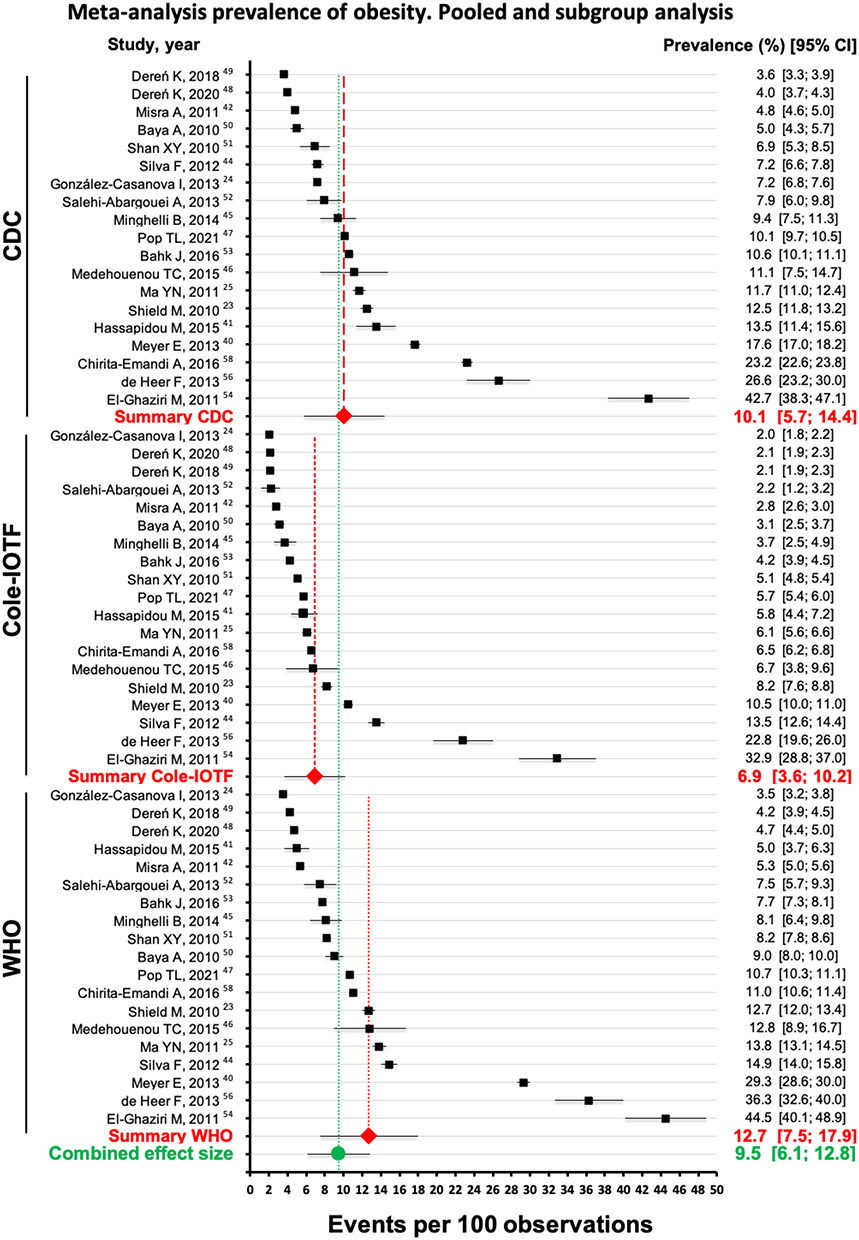 |
Figure 3 Overall and subgroup prevalence of obesity. Forest plot of the studies documenting prevalence of overweight with the three standards under study. The analysis included 19 studies with a total of 211,739 cases. |
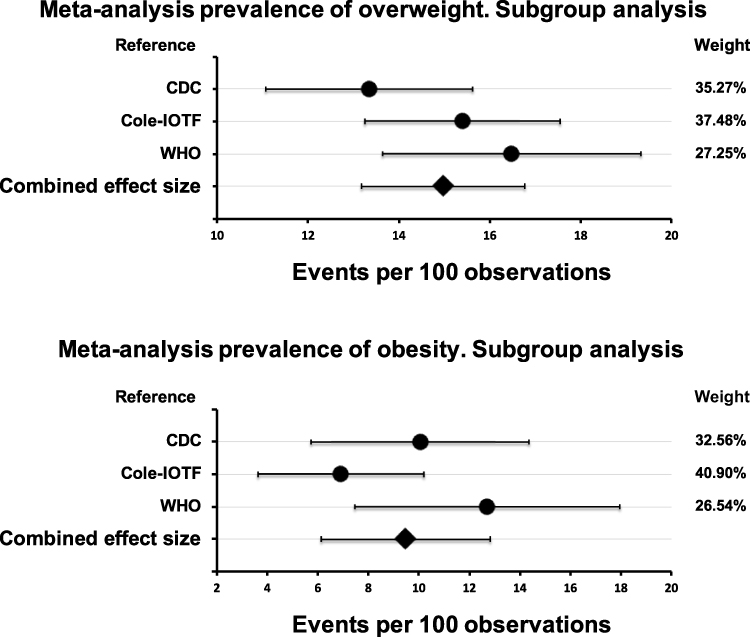 |
Figure 4 Meta-analysis of the prevalence of overweight and obesity by subgroups according to the three standards under study. |
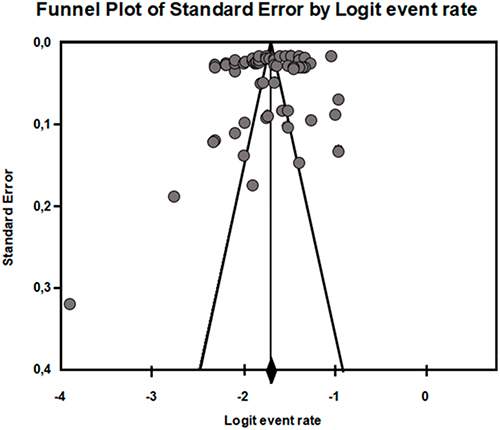 |
Figure 5 Funnel plot of standard error by logit event rate. The analysis included 19 studies with the three standards under study (57 points). |
Discussion
The results of this literature review suggest that the choice of a BMI reference may significantly influence the decision to provide clinical advice or treatment, as well as estimates of the healthcare resources needed to counteract overweight and obesity. The percentage of children, young people and adolescents affected by overweight varies considerably depending on the BMI cut-off points across classifications and may also vary by age group and ethnicity.40,59
The prevalence of childhood obesity has increased dramatically all over the world in recent years. It is associated with cardiovascular disease, hypertension, diabetes, osteoarthritis, and cancer. Children affected by obesity also have an increased risk that obesity will persist into adulthood. In addition, childhood obesity has also been associated with mental health problems in young people. While obesity in adults can be easily measured using the BMI calculation, determining overweight and obesity in children is more controversial.59
When comparing the three most commonly used international classification systems, WHO 2007, CDC 2000 and Cole-IOTF, and the agreement between them, we observed that each selected study compares and analyses these systems differently.35,36 The comparison between the WHO 2007 classification and CDC 2000 found that the prevalence of overweight and obesity was lower in both sexes when determined with CDC standards compared to WHO standards.37
The WHO 2007 against Cole-IOTF classification was exclusively investigated in only two studies analysed. For obesity in children, prevalence based on WHO was approximately higher than prevalence based on IOTF.38 WHO references were found to overestimate the prevalence of underweight, overweight, and obesity relative to the IOTF for the diagnosis of malnutrition.39 The comparative studies between the three international classifications of WHO 2007, CDC 2000 and Cole-IOTF found that, when analysing the prevalence of obesity, those obtained with the WHO reference were higher compared to CDC and IOTF.40
The differences were generally greater between WHO and IOTF references than between WHO and CDC references. Overall, WHO cut-offs yielded the highest prevalence estimates and IOTF cut-offs the lowest.23,40–46,48–50,59 Also BMI classification patterns by age tended to be similar between IOTF cut-offs and CDC in contrast to the WHO cut-offs, for all ages and sexes.38
On the other hand, the authors argue that all international references tend to underestimate underweight, while they overestimate overweight.51 The highest prevalence of obesity was obtained using the WHO criteria compared to CDC, IOTF and the national criterion in Iran.52 Also, among the four sets of WHO, CDC, IOTF and National-KCDC criteria in Korea, the WHO criteria showed the highest prevalence of overweight and obesity in all age groups.53 Studies analysing the WHO 2007 classification versus the national classifications determined that, if the WHO reference was used, the rate of overweight and obesity would double compared to the national reference.57
Therefore, statistically significant differences in terms of the comparison of the different international references were found in the studies by González-Casanova et al,24 Mosellekgomo and van Staden,35 Goon et al,36 Fetuga et al,37 Meyer et al,40 Hassapidou et al,41 Pop et al,47 Dereń et al,48 Salehi-Abargouei et al,52 Pérez-Bermejo et al57 and López-Sánchez et al.59 Furthermore, in the Southern European,59 significant differences between obesity and overweight values were demonstrated between the Cole-IOTF classification with 32.3% and WHO 2007 with 37.3%, respectively. The divergences between the three international classification systems are due to the fact that they use different selection criteria, samples and data collection in different time periods, as in the case of the IOTF published in 2000, where the BMI cut-off points are set at ≥25 kg/m2 and <30 kg/m2 for overweight and BMI ≥30 kg/m2 for obesity.22 In contrast, the WHO 2007 reference was composed of a sample collected in the 1970s and analysed between 1997 and 2003 where the diagnosis of overweight was set at BMI >+1 SD and ≤+2 SD and obesity at BMI >+2 SD.15 Finally, the CDC 2000 classification was elaborated by the National Center for Health Statistics (NCHS) in the US paediatric population between 1963 and 1994 establishing overweight as BMI ≥P85 and <P95 and obesity as BMI >P95.20
BMI is the accepted tool for evaluating overweight and obesity in children. However, it should be used with caution as BMI is not a measure of fat mass or the distribution of adipose tissue in the body.59 There are several current trends as to which parameters should be considered more when diagnosing childhood overweight and obesity. Some authors study following the recommendations of the European Childhood Obesity Surveillance Initiative (COSI) of the WHO.60 However, other authors prefer to use other anthropometric references or the estimation of compartments and body composition by electrical bioimpedance.
Among the limitations of this study, we consider the different results that can be obtained by using different strategies to determine overweight and obesity, and the uniqueness of each and every child, youth and adolescent when these strategies are applied. We observed differences by age group and ethnicity when evaluating and comparing the application of the various classifications, so this may be a cause of bias in the comparison of the results obtained in each study analysed.
Due to this disparity between the prevalence of childhood overweight and obesity according to the classification used, we must highlight the recent publication by Cole and Lobstein61 where they developed an algorithm to harmonise the cut-off points according to BMI for age and sex of the WHO, CDC and IOTF and make them comparable. This tool allows the researcher to choose any of these three classifications and compare them with the others, making the results more comparable. This makes it a very interesting tool for minimising the possible biases of comparison between different populations and resolving hypotheses in future lines of research.
Conclusion
The prevalence of childhood overweight and obesity according to BMI was determined to be higher in boys than in girls in most studies, this was considered when analysing the classifications of the WHO 2007, CDC 2000 and Cole-IOTF together. However, there was a higher prevalence of overweight and obesity in girls than in boys when only the CDC 2000 and Cole-IOTF criteria were considered.
The WHO 2007 criteria were those with the highest prevalence of overweight in the child and youth populations compared to CDC 2000, Cole-IOTF and national or local criteria.
Both the results of the review and the great heterogeneity found in the meta-analysis show that it is necessary to unify the criteria for the classification of childhood overweight and obesity. International standards are insufficient for working with the current population. Further studies similar to that described above by Cole and Lobstein61 comparing or constructing national or local references using BMI as a primary measure are needed or a working group should be created to address this issue and agree on the unification of a gold standard to address the current epidemic of childhood overweight and obesity, taking into account the geographical region, the ethnic groups and the age groups of the child and youth population and above all, the secular growth to stop working with a standard that has been very useful in the absence of others, but that should be updated.
Acknowledgments
The authors thank the Catholic University of Valencia for their contribution and help in the payment of the Open Access publication under grant number 2022-275-002. Likewise, they appreciate the impulse and guidance from their Vice-Rector for Research.
Author Contributions
All authors made a significant contribution to the work reported, whether that is in the conception, study design, execution, acquisition of data, analysis, and interpretation, or in all these areas; took part in drafting, revising or critically reviewing the article; gave final approval of the version to be published; have agreed on the journal to which the article has been submitted; and agree to be accountable for all aspects of the work.
Disclosure
The authors report no conflicts of interest in this work.
References
1. World Health Organization consultation. Obesity: preventing and managing the global epidemic. World Health Organ Tech Rep Ser. 2000;894:1–253. PMID: 11234459.
2. Lobstein T, Jackson-Leach R, Moodie ML, et al. Child and adolescent obesity: part of a bigger picture. Lancet. 2015;385(9986):2510–2520. doi:10.1016/S0140-6736(14)61746-3
3. Gurnani M, Birken C, Hamilton J. Childhood obesity: causes, consequences, and management. Pediatr Clin North Am. 2015;62(4):821–840. doi:10.1016/j.pcl.2015.04.001
4. Nehus E, Mitsnefes M. Childhood obesity and the metabolic syndrome. Pediatr Clin North Am. 2019;66(1):31–43. doi:10.1016/j.pcl.2018.08.004
5. Weihrauch-Blüher S, Wiegand S. Risk factors and implications of childhood obesity. Curr Obes Rep. 2018;7(4):254–259. doi:10.1007/s13679-018-0320-0
6. World Health Organization. Obesity and overweight; 2021. Available from: https://www.who.int/news-room/fact-sheets/detail/obesity-and-overweight.
7. NCD Risk Factor Collaboration (NCD-RisC). Worldwide trends in body-mass index, underweight, overweight, and obesity from 1975 to 2016: a pooled analysis of 2416 population-based measurement studies in 128·9 million children, adolescents, and adults. Lancet. 2017;390(10113):2627–2642. 10.1016/S0140-6736(17)32129-3.
8. Boone-Heinonen J, Tillotson CJ, O’Malley JP, et al. Not so implausible: impact of longitudinal assessment of implausible anthropometric measures on obesity prevalence and weight change in children and adolescents. Ann Epidemiol. 2019;31:
9. Asif M, Aslam M, Altaf S. Evaluation of anthropometric parameters of central obesity in Pakistani children aged 5-12 years, using receiver operating characteristic (ROC) analysis. J Pediatr Endocrinol Metab. 2018;31(9):971–977. doi:10.1515/jpem-2018-0193
10. Bichteler A, Gershoff ET. Identification of children’s BMI trajectories and prediction from weight gain in infancy. Obesity. 2018;26(6):1050–1056. doi:10.1002/oby.22177
11. Abbott RA, Ball EJ, O’Connor J, et al. The use of body mass index to predict body composition in children. Ann Hum Biol. 2002;29(6):619–626. doi:10.1080/03014460210143128
12. Alves Junior CA, Mocellin MC, Gonçalves ECA, Silva DA, Trindade EB. Anthropometric indicators as body fat discriminators in children and adolescents: a systematic review and meta-analysis. Adv Nutr. 2017;8(5):718–727. doi:10.3945/an.117.015446
13. Llewellyn A, Simmonds M, Owen CG, Woolacott N. Childhood obesity as a predictor of morbidity in adulthood: a systematic review and meta-analysis. Obes Rev. 2016;17(1):56–67. doi:10.1111/obr.12316
14. Silveira EA, Pagotto V, Barbosa LS, Oliveira C, Pena GDG, Velasquez-Melendez G. Accuracy of BMI and waist circumference cut-off points to predict obesity in older adults. Cien Saude Colet. 2020;25(3):1073–1082. doi:10.1590/1413-81232020253.13762018
15. de Onis M, Onyango AW, Borghi E, Siyam A, Nishida C, Siekmann J. Development of a WHO growth reference for school-aged children and adolescents. Bull World Health Organ. 2007;85(9):660–667. doi:10.2471/blt.07.043497
16. Reilly JJ, Kelly J, Wilson DC. Accuracy of simple clinical and epidemiological definitions of childhood obesity: systematic review and evidence appraisal. Obes Rev. 2010;11(9):645–655. doi:10.1111/j.1467-789X.2009.00709.x
17. Hermanussen M, Stec K, Aßmann C, Meigen C, Van Buuren S. Synthetic growth reference charts. Am J Hum Biol. 2016;28(1):98–111. doi:10.1002/ajhb.22759
18. Cole TJ, Lobstein T. Extended international (IOTF) body mass index cut-offs for thinness, overweight and obesity. Pediatr Obes. 2012;7(4):284–294. doi:10.1111/j.2047-6310.2012.00064.x
19. de Onis M, Garza C, Onyango AW, Rolland-Cachera MF; le Comité de nutrition de la Société française de pédiatrie. Les standards de croissance de l’Organisation mondiale de la santé pour les nourrissons et les jeunes enfants [WHO growth standards for infants and young children]. Arch Pediatr. 2009;16(1):47–53. French. doi:10.1016/j.arcped.2008.10.010
20. Ogden CL, Kuczmarski RJ, Flegal KM, et al. Centers for disease control and prevention 2000 growth charts for the United States: improvements to the 1977 National Center for Health Statistics version. Pediatrics. 2002;109(1):45–60. doi:10.1542/peds.109.1.45
21. WHO Multicentre Growth Reference Study Group. WHO Child Growth Standards based on length/height, weight and age. Acta Paediatr Suppl. 2006;450:76–85. doi:10.1111/j.1651-2227.2006.tb02378.x
22. Cole TJ, Bellizzi MC, Flegal KM, Dietz WH. Establishing a standard definition for child overweight and obesity worldwide: international survey. BMJ. 2000;320(7244):1240–1243. doi:10.1136/bmj.320.7244.1240
23. Shields M, Tremblay MS. Canadian childhood obesity estimates based on WHO, IOTF and CDC cut-points. Int J Pediatr Obes. 2010;5(3):265–273. doi:10.3109/17477160903268282
24. Gonzalez-Casanova I, Sarmiento OL, Gazmararian JA, et al. Comparing three body mass index classification systems to assess overweight and obesity in children and adolescents. Rev Panam Salud Publica. 2013;33(5):349–355. doi:10.1590/s1020-49892013000500006
25. Ma YN, Chen T, Wang D, Liu MM, He QC, Dong GH. Prevalence of overweight and obesity among preschool children from six cities of northeast China. Arch Med Res. 2011;42(7):633–640. doi:10.1016/j.arcmed.2011.10.011
26. Khasnutdinova SL, Grjibovski AM. Prevalence of stunting, underweight, overweight and obesity in adolescents in Velsk district, north-west Russia: a cross-sectional study using both international and Russian growth references. Public Health. 2010;124(7):392–397. doi:10.1016/j.puhe.2010.03.017
27. Kêkê LM, Samouda H, Jacobs J, et al. Body mass index and childhood obesity classification systems: a comparison of the French, International Obesity Task Force (IOTF) and World Health Organization (WHO) references. Rev Epidemiol Sante Publique. 2015;63(3):173–182. doi:10.1016/j.respe.2014.11.003
28. Twells LK, Newhook LA. Obesity prevalence estimates in a Canadian regional population of preschool children using variant growth references. BMC Pediatr. 2011;11:21. doi:10.1186/1471-2431-11-21
29. Page MJ, McKenzie JE, Bossuyt PM, et al. The PRISMA 2020 statement: an updated guideline for reporting systematic reviews. BMJ. 2021;372:n71. doi:10.1136/bmj.n71
30. Joanna Briggs Institute. Critical appraisal tools; 2017. Available from: https://jbi.global/critical-appraisal-tools.
31. Higgins JP, Thompson SG. Quantifying heterogeneity in a meta-analysis. Stat Med. 2002;21(11):1539–1558. doi:10.1002/sim.1186
32. Barendregt JJ, Doi SA, Lee YY, Norman RE, Vos T. Meta-analysis of prevalence. J Epidemiol Community Health. 2013;67(11):974–978. doi:10.1136/jech-2013-203104
33. Wallace BC, Schmid CH, Lau J, Trikalinos TA. Meta-Analyst: software for meta-analysis of binary, continuous and diagnostic data. BMC Med Res Methodol. 2009;9(1):80. doi:10.1186/1471-2288-9-80
34. Egger M, Davey Smith G, Schneider M, Minder C. Bias in meta-analysis detected by a simple, graphical test. BMJ. 1997;315(7109):629–634. doi:10.1136/bmj.315.7109
35. Moselakgomo KV, Van Staden M. Diagnostic comparison of centers for disease control and prevention and international obesity task force criteria for obesity classification in South African children. Afr J Prim Health Care Fam Med. 2017;9(1):e1–e7. doi:10.4102/phcfm.v9i1.1383
36. Goon DT, Toriola AL, Shaw BS. Screening for body-weight disorders in Nigerian children using contrasting definitions. Obes Rev. 2010;11(7):508–515. doi:10.1111/j.1467-789X.2009.00682.x
37. Fetuga MB, Ogunlesi TA, Adekanmbi AF, Alabi AD. Growth pattern of schoolchildren in Sagamu, Nigeria using the CDC standards and 2007 WHO standards. Indian Pediatr. 2011;48(7):523–528. doi:10.1007/s13312-011-0094-x
38. Phan HD, Nguyen TNP, Bui PL, et al. Overweight and obesity among Vietnamese school-aged children: national prevalence estimates based on the World Health Organization and international obesity task force definition. PLoS One. 2020;15(10):e0240459. doi:10.1371/journal.pone.0240459
39. Bergel Sanchís ML, Cesani Rossi MF, Cordero ML, Navazo B, Olmedo S. Nutritional assessment of schoolchildren in three Iberoamerican countries: comparative analysis of the references proposed by the International Obesity Task Force (IOTF) and the World Health Organization. Spanish Society of Dietetics and Food Sciences. Nutrición Clínica y Dietética Hospitalaria. 2014;1:8–15.
40. Meyer E, Carrillo R, Román EM, Bejarano IF, Dipierri JE. Prevalence of overweight and obesity in students from different altitudinal zones of Jujuy according to three international references (IOTF, CDC and WHO). Arch Argent Pediatr. 2013;111(6):516–522. English, Spanish. doi:10.5546/aap.2013.516
41. Hassapidou M, Daskalou E, Tsofliou F, et al. Prevalence of overweight and obesity in preschool children in Thessaloniki, Greece. Hormones. 2015;14(4):615–622. doi:10.14310/horm.2002.1601
42. Misra A, Shah P, Goel K, et al. The high burden of obesity and abdominal obesity in urban Indian schoolchildren: a multicentric study of 38,296 children. Ann Nutr Metab. 2011;58(3):203–211. doi:10.1159/000329431
43. Ramírez E, Ramos Salas JE, Bustillos MB, et al. WHO body mass index for age charts overestimate thinness and overweight compared to international and US charts applied to indigenous and non-indigenous Mexican children. Arch Latinoam Nutr. 2017;67(3):159–168.
44. Silva F, Ferreira E, Gonçalves R, Cavaco A. Obesidade Pediátrica: a Realidade de Uma Consulta [Pediatric obesity: the reality of one consultation]. Acta Med Port. 2012;25(2):91–96. Portuguese. PMID: 22985919.
45. Minghelli B, Nunes C, Oliveira R. Body mass index and waist circumference to define thinness, overweight and obesity in Portuguese adolescents: comparison between CDC, IOTF, WHO references. Pediatr Endocrinol Rev. 2014;12(1):35–41. PMID: 25345083.
46. Medehouenou TC, Ayotte P, St-Jean A, et al. Overweight and obesity prevalence among school-aged nunavik inuit children according to three body mass index classification systems. J Adolesc Health. 2015;57(1):31–36. doi:10.1016/j.jadohealth.2015.03.022
47. Pop TL, Maniu D, Rajka D, et al. Prevalence of underweight, overweight and obesity in school-aged children in the Urban Area of the Northwestern Part of Romania. Int J Environ Res Public Health. 2021;18(10):5176. doi:10.3390/ijerph18105176
48. Dereń K, Wyszyńska J, Nyankovskyy S, et al. Assessment of body mass index in a pediatric population aged 7-17 from Ukraine according to various international criteria-A cross-sectional study. PLoS One. 2020;15(12):e0244300. doi:10.1371/journal.pone.0244300
49. Dereń K, Nyankovskyy S, Nyankovska O, et al. The prevalence of underweight, overweight and obesity in children and adolescents from Ukraine. Sci Rep. 2018;8(1):3625. doi:10.1038/s41598-018-21773-4
50. Baya Botti A, Pérez-Cueto FJ, Vasquez Monllor PA, Kolsteren PW. International BMI-for-age references underestimate thinness and overestimate overweight and obesity in Bolivian adolescents. Nutr Hosp. 2010;25(3):428–436. PMID: 20593126.
51. Shan XY, Xi B, Cheng H, Hou DQ, Wang Y, Mi J. Prevalence and behavioral risk factors of overweight and obesity among children aged 2-18 in Beijing, China. Int J Pediatr Obes. 2010;5:383–389. doi:10.3109/17477160903572001
52. Salehi-Abargouei A, Abdollahzad H, Bameri Z, Esmaillzadeh A. Underweight, overweight and obesity among zaboli adolescents: a comparison between international and Iranians’ national criteria. Int J Prev Med. 2013;4(5):523–530. PMID: 23930162.
53. Bahk J, Khang YH. Trends in measures of childhood obesity in Korea From 1998 to 2012. J Epidemiol. 2016;26(4):199–207. doi:10.2188/jea.JE20140270
54. El-Ghaziri M, Boodai S, Young D, Reilly JJ. Impact of using national v. international definitions of underweight, overweight and obesity: an example from Kuwait. Public Health Nutr. 2011;14(11):2074–2078. doi:10.1017/S1368980011001285
55. Wickramasinghe VP, Arambepola C, Bandara DM, et al. Validity of newly-developed BMI and waist cut-off values for Sri Lankan children. Ann Hum Biol. 2013;40(3):280–285. doi:10.3109/03014460.2013.769629
56. de Heer F, Morera O, Warren M, Chaudhari L, de Heer HD. At risk or not: comparing normative and criterion-referenced body mass index standards among Mexican American children. Arch Latinoam Nutr. 2013;63(2):126–133. PMID: 24934068.
57. Pérez-Bermejo M, Alcalá-Dávalos L, Pérez-Murillo J, Legidos-García ME, Murillo-Llorente MT. Are the Growth Standards of the World Health Organization Valid for Spanish Children? The SONEV Study. Front Pediatr. 2021;9:700748. doi:10.3389/fped.2021.700748
58. Chirita-Emandi A, Barbu CG, Cinteza EE, et al. Overweight and underweight prevalence trends in children from Romania - pooled analysis of cross-sectional studies between 2006 and 2015. Obes Facts. 2016;9(3):206–220. doi:10.1159/000444173
59. López-Sánchez GF, Sgroi M, D’Ottavio S, et al. Body composition in children and adolescents residing in Southern Europe: prevalence of overweight and obesity according to different international references. Front Physiol. 2019;10:130. doi:10.3389/fphys.2019.00130
60. World Health Organization. WHO European childhood obesity surveillance initiative: overweight and obesity among 6–9-year-old children. World Health Organization Regional Office for Europe; 2018. Available from: http://www.euro.who.int/__data/assets/pdf_file/0006/372426/WH14_COSI_factsheets_v2.pdf.
61. Cole TJ, Lobstein T. Exploring an algorithm to harmonize international obesity task force and World Health Organization child overweight and obesity prevalence rates. Pediatr Obes. 2022;17(7):e12905. doi:10.1111/ijpo.12905
 © 2022 The Author(s). This work is published and licensed by Dove Medical Press Limited. The
full terms of this license are available at https://www.dovepress.com/terms
and incorporate the Creative Commons Attribution
- Non Commercial (unported, 3.0) License.
By accessing the work you hereby accept the Terms. Non-commercial uses of the work are permitted
without any further permission from Dove Medical Press Limited, provided the work is properly
attributed. For permission for commercial use of this work, please see paragraphs 4.2 and 5 of our Terms.
© 2022 The Author(s). This work is published and licensed by Dove Medical Press Limited. The
full terms of this license are available at https://www.dovepress.com/terms
and incorporate the Creative Commons Attribution
- Non Commercial (unported, 3.0) License.
By accessing the work you hereby accept the Terms. Non-commercial uses of the work are permitted
without any further permission from Dove Medical Press Limited, provided the work is properly
attributed. For permission for commercial use of this work, please see paragraphs 4.2 and 5 of our Terms.