")
Back to Journals » OncoTargets and Therapy » Volume 12
Dichloroacetic acid upregulates apoptosis of ovarian cancer cells by regulating mitochondrial function
Authors Zhou L , Liu LL, Chai W, Zhao T, Jin X, Guo XX, Han LY, Yuan CL
Received 12 November 2018
Accepted for publication 30 January 2019
Published 28 February 2019 Volume 2019:12 Pages 1729—1739
DOI https://doi.org/10.2147/OTT.S194329
Checked for plagiarism Yes
Review by Single anonymous peer review
Peer reviewer comments 2
Editor who approved publication: Dr Federico Perche
Li Zhou,1 Lianlian Liu,2 Wei Chai,1 Ting Zhao,1 Xin Jin,3 Xinxin Guo,1 Liying Han,2 Chunli Yuan1
1Department of Obstetrics and Gynecology, The First Hospital of Jilin University, Changchun 130021, China; 2Department of Obstetrics and Gynecology, The Second Hospital of Jilin University, Changchun 130041, China; 3Department of Obstetrics and Gynecology, Dalian Municipal Women and Children’s Medical Center, Dalian 130041, China
Background: Metabolic reprogramming is a characteristic of tumor cells and is considered a potential therapeutic target. Even under aerobic conditions, tumor cells use glycolysis to produce energy, a phenomenon called the “Warburg effect”. Pyruvate dehydrogenase kinase 1 (PDK1) is a key factor linking glycolysis and the tricarboxylic acid cycle. Dichloroacetic acid (DCA) reverses the Warburg effect by inhibition of PDK1 to switch cytoplasmic glucose metabolism to mitochondrial oxidative phosphorylation (OXPHOS).
Methods: Cell viability was examined using a standard MTT assay. Glucose consumption and L-lactate production were measured using commercial colorimetric kits, and intracellular lactate dehydrogenase (LDH) activity was evaluated using cell lysates and an LDH Quantification Kit. Real-time PCR was used to detect the expression of related genes. The production of total ROS was evaluated by staining with dichlorofluorescin diacetate.
Results: Comparison of various aspects of glucose metabolism, such as expression of key enzymes in glycolysis, lactate production, glucose consumption, mitochondrial oxygen consumption rate, and citric acid production, revealed that A2780/DDP cells were primarily dependent on glycolysis whereas A2780 cells were primarily dependent on mitochondrial OXPHOS. Mitochondrial uncoupling protein 2 (UCP2) protects against mitochondrial ROS while allowing energy metabolism to switch to glycolysis. Treatment of A2780 cells with various concentrations of DCA resulted in decreased expression of UCP2, a metabolic switch from glycolysis to mitochondrial OXPHOS, and an increase in oxidative stress induced by ROS. These effects were not observed in A2780/DDP cells with higher UCP2 expression suggesting that UCP2 might induce changes in mitochondrial functions that result in different sensitivities to DCA.
Conclusion: Our results show that a drug targeting tumor metabolic changes affects almost the entire process of glucose metabolism. Thus, it is necessary to comprehensively determine tumor metabolic functions to facilitate individualized antitumor therapy.
Keywords: DCA, glycolysis, mitochondrial function, glucose, metabolism
Introduction
Various tumor cell types, including ovarian cancer cells, have aerobic glycolysis properties and rely on glycolysis to produce ATP even under aerobic conditions. Furthermore, these cells showed decreased mitochondrial oxidative phosphorylation (OXPHOS) functions. This metabolic remodeling of tumor cells is called the “Warburg effect”.1,2 Studies suggest that glucose metabolism remodeling in tumor cells is characterized by enhanced glucose uptake and lactate production and that high rates of glycolysis are associated with drug resistance.3 However, some studies showed that tumor cells with complete mitochondrial function also exhibit the Warburg effect.4,5 Therefore, when glucose metabolism in tumor cells is considered as a therapeutic target, changes in mitochondrial metabolism-related molecules should be considered in addition to tumor-cell-specific aerobic glycolysis.
Pyruvate dehydrogenase kinase (PDK) 1 is a key factor in the connection between glycolysis and mitochondrial OXPHOS and is highly expressed in most tumor cells.5,6 Tumor cells with high expression of PDK1 have anti-apoptotic activity.7,8 PDK1 phosphorylates pyruvate dehydrogenase (PDH) to inhibit its activity, thus reducing available pyruvate for mitochondrial metabolism.9 Dichloroacetic acid (DCA) is a small-molecule inhibitor of PDK that shifts cell metabolism from glycolysis to mitochondrial glucose oxidation by inhibition of PDK, resulting in increased phosphorylation byproducts such as ROS and cytotoxic effects. Some studies showed that DCA could be a potent drug for cancer treatment. DCA activates apoptosis via the mitochondrial pathway.7,10,11 However, there are differences in the sensitivities of tumor cells to DCA. When considering the effects of DCA, although PDK1 is the main target, as an inhibitor of the Warburg effect it reverses the metabolic phenotype of tumor cells, which is related to activation of mitochondrial functions. Ruggieri et al reported that DCA has no significant cytotoxic effect on PE15 cells with more efficient mitochondrial OXPHOS,7 whereas Chaudhary et al showed that DCA does not restore apoptosis via the mitochondrial pathway in PCa cells with stronger mitochondrial dysfunctions.12 Investigating the relationship between the effect of DCA on mitochondrial OXPHOS and the sensitivity of tumor cells may further improve therapeutic strategies for tumors using glucose metabolism as a target.
Mitochondrial uncoupling protein 2 (UCP2) is a mitochondrial membrane protein that is highly expressed in a variety of tumor cell types and is capable of uncoupling mitochondrial respiration and protecting against ROS by reducing mitochondrial respiration.13,14 Recent studies have shown that activation of UCP2 mediates the switch in energy metabolism from mitochondrial OXPHOS to glycolysis.15 Citrate serves as a substrate and intermediate for the tricarboxylic acid (TCA) cycle and plays an important role in regulating cell metabolism. It suppresses glycolysis by inhibiting phosphofructokinase and can be a key mediator to balance glycolysis and OXPHOS.16 Tumor cells with defective mitochondrial respiration have a low level of citric acid, which is conducive to maintaining the Warburg effect, thus citric acid is a marker of mitochondrial respiration loss.17 Therefore, the effect of PDK1 inhibition on mitochondrial UCP2 may explain the relationship between glucose metabolism and traditional oxidative stress.
In this study, we analyzed differences in the glucose metabolism phenotypes of cisplatin-sensitive human ovarian cancer cells A2780 and their cisplatin-resistant clones A2780/DDP, and determined the relationship between the metabolic phenotype and drug sensitivity. DCA was also used to interfere with the glucose metabolism of tumor cells, followed by detection of oxidative stress induced by mitochondrial ROS. This study aimed to clarify the mechanism by which DCA increases cellular sensitivity to drugs and provide insights into individualized clinical treatment.
Materials and methods
Cell culture
Cisplatin-sensitive human ovarian cancer cell lines A2780 and their cisplatin-resistant clones A280/DDP were obtained from the Cell Bank of the Institute of Biochemistry and Cell Biology (Shanghai, China). Cells were cultured in RPMI-1640 (Thermo Fisher Scientific, Carlsbad, CA, USA), supplemented with 10% FBS (HyClone, Logan, UT, USA) in a 5% CO2 humidified circumstance at 37°C.
Reagents and antibodies
MTT was purchased from Sigma-Aldrich (St Louis, MO, USA). Anti-caspase-3 (1:1,000), anti-poly (ADP)-ribose polymerase (PARP) (1:2,000), anti-Bcl-2 (1:1,000), and anti-Bax (1:1,000) antibodies were from Santa Cruz Biotechnology (Santa Cruz, CA, USA); anti-PDK1, anti-PDH (1:1,000), anti-p-PDH (1:500), and anti-UCP2 (1:1,000) antibodies were from Abcam Biotechnology (Cambridge, MA, USA). Mouse monoclonal anti-β-actin (1:2,000) and horseradish peroxidase-conjugated secondary antibodies (1:5,000) were from Proteintech (Chicago, IL, USA). MitoSOX Red mitochondrial superoxide indicator was purchased from Invitrogen (Carlsbad, CA, USA). Radioimmunoprecipitation assay (RIPA) lysis buffer was from Beyotime (Shanghai, China). Annexin V Apoptosis Detection Kit II (San Diego, CA, USA) was purchased from BD Biosciences. JC-1 was purchased from Beyotime Biotechnology (Shanghai, China). LDH Quantification Kit was purchased from JianchengBio (Nanjing, China). The glucose assay kit was from RsBio (Shanghai, China) and the L-lactate kit was from Jiancheng Bio (Nanjing, China).
Glycolysis inhibitors
Sodium oxamate and DCA were purchased from Sigma-Aldrich and dissolved in water and PBS, respectively.
Cell viability assay
In vitro, cell viability was examined using a standard MTT assay. Cells were seeded in 96-well plates at 8,000 cells/well in 100 μL medium, incubated overnight, and then treated with different concentrations of DCA for 24 hours. At the end of treatment, 10 μL of 10 mg/mL MTT reagent in PBS was added for 4 hours and the resultant formazan crystals were dissolved in 150 μL dimethyl sulfoxide. After shaking for 5 minutes, the OD at 570 nm was recorded by a plate reader. Each sample was tested in triplicate. Then, we calculated the IC50 of DCA in A2780 cells and chose the concentration of IC50 and a lower concentration to treat A2780 and A2780/DDP cells for experiment.
Analysis of glycolysis
After cell attachment, the medium was replaced with fresh medium with or without 40 or 80 mM DCA, and the cells were allowed to grow for 24 hours. Glucose consumption and L-lactate production were measured using commercial colorimetric kits according to the manufacturer’s protocol. Metabolite consumption and production values were normalized to the corresponding total amount of protein in each sample as determined by the Bio-Rad protein assay (Bio-Rad, Hercules, CA, USA).
Analysis of lactate dehydrogenase (LDH)
Intracellular LDH activity was evaluated using cell lysates and an LDH Quantification Kit, according to the manufacturer’s instructions.
RNA extraction, cDNA synthesis, and real-time PCR
Total RNA was extracted using TRIzol reagent protocol (Life Technologies), and RNA was quantitated by spectrophotometry at 260 nm using a NanoDrop ND-1000 (NanoDrop Technologies, Wilmington, DE, USA). Then cDNA synthesis was performed using the SuperScript First-Strand Synthesis System for real-time PCR (Thermo Fisher Scientific, Waltham, MA, USA), according to the manufacturer’s protocol. Quantitative PCR analyses for LDHA and HK2 were performed using Assay-on-Demand primers and TaqMan Universal PCR Master Mix reagent (TransGen Biotech, China). Samples were analyzed using an FX96™ Real-Time PCR Detection System (Bio-Rad). The ΔΔCT method was used to quantify relative changes in gene expression as described previously. Expression levels of β-actin were used to normalize the relative expression levels. Each sample was tested at least three times. Primers used for PCR were as follows:
LDHA, Forward: 5′-TTCCAGTGTGCCTGTATGGA-3′,
Reverse: 5′-ACCACCTGCTTGTGAACCTC-3′;
HK2, Forward: 5′-GAGCCACCACTCACCCTACT-3′,
Reverse: 5′-CCAGGCATTCGGCAATGTG-3′.
The protocol of real-time PCR were as follows: 1) 94°C for10 minutes, 2) 94°C for 1 minute, 3) 60°C for 30 seconds, 4) 72°C for 1 minute, 5) repeat the steps 1–4, 6) 72°C for 10 minutes, and 7) 4°C forever.
Citric acid assay
Citric acid was measured using a Citric Acid Quantification Kit (Jiancheng Bio) according to the manufacturer’s protocol.
Immunoblotting
After drug treatment for 24 hours, cells were harvested, washed with cold PBS, and incubated in RIPA lysis buffer for 40 minutes at 4°C to isolate total proteins. Proteins in each sample were quantitated with the Bio-Rad protein assay. The separated proteins were transferred to a polyvinylidene fluoride membrane (Roche, Basel, Switzerland), which was incubated with a primary antibody at 4°C overnight and then with secondary antibody at room temperature for 2 hours. Protein bands were visualized using Pierce ECL Western Blot Substrate (Thermo Fisher Scientific).
Flow cytometry
Cells were exposed to 40 or 80 mM DCA for 24 hours, trypsinized, and stained with annexin V–FITC and propidium iodide (PI, Annexin V Apoptosis Detection Kit; BestBio, Shanghai, China) to measure cellular apoptosis. MitoSOX™ Red Mitochondrial Superoxide Indicator was used to detect mitochondrial ROS levels. Analysis was performed using a BD Accuri C6 flow cytometer (Becton Dickinson, Franklin Lakes, NJ, USA).
Oxygen consumption rate analysis
Cells (8×10⁴ cells/well) were seeded in 96-well plates and incubated overnight to allow adhesion. The following day, various concentrations of DCA were added to the cells. Each treatment was performed in triplicate. The oxygen consumption rate (OCR) was measured using the oxygen-sensitive fluorescent probe Mito-Xpress (Luxcel Bioscience, Cork, Ireland).
Fluorescence staining
The production of total ROS was evaluated by staining with dichlorofluorescin diacetate. Cells were incubated with 10 mM dichlorofluorescin diacetate for 30 minutes at 37°C. After washing with PBS, the samples were observed under an IX71 fluorescence microscope (Olympus, Japan).
Short hairpin RNA targeting PDK1
Short hairpins that targeted PDK1 (shPDK1) were obtained from Validated SuperSilencing shRNA of GenePharma Company. Cells were selected in puromycin (2 mg/mL) for 3 days and then expanded for 1–2 weeks before analysis. Hairpin TRC clone ID was TRCN0000006261 and the target sequence for shPDK was GCTCTGTCAACAGACTCAATA.
Statistical analysis
Data are expressed as the mean ± SD. Statistical significance between two groups was calculated using Student’s t-test and among different groups was assessed using one-way ANOVA with Least Significant Difference post hoc test in SPSS 16.0 software. A value of P<0.05 was considered to be significant. All experiments were repeated at least three times.
Results
DCA decreases cell viability and induces cell death of cisplatin-sensitive A2780 cells compared with cisplatin-resistant A2780/DDP cells
We first investigated whether DCA suppressed the viability of ovarian cancer cells and induced apoptosis. In our previous experiment, we chose different concentration of DCA to treat cisplatin-sensitive A2780 cells and cisplatin-resistant A2780/DDP cells for 24 hours. Two cells showed different drug sensitivities. IC50 of DCA in A2780 cells is 81.03 mM (Figure 1A). According to the MTT result, we used 40 mM and 80 mM DCA for subsequent experiments. The cells were treated with 80 mM DCA for 24 hours and then subjected to annexin V/PI staining. Apoptosis was induced in A2780 cells, but no significant cytotoxicity was observed in A2780/DDP cells (Figure 1B and C). To further investigate the mechanism of cell death induced by DCA, levels of caspase-3, PARP, Bcl-2, and Bax were analyzed. A2780 cells showed significant increases in cleaved caspase-3, Bax, and cleaved PARP, and decreased Bcl-2 after DCA treatment compared with A2780/DDP cells (Figure 1D).
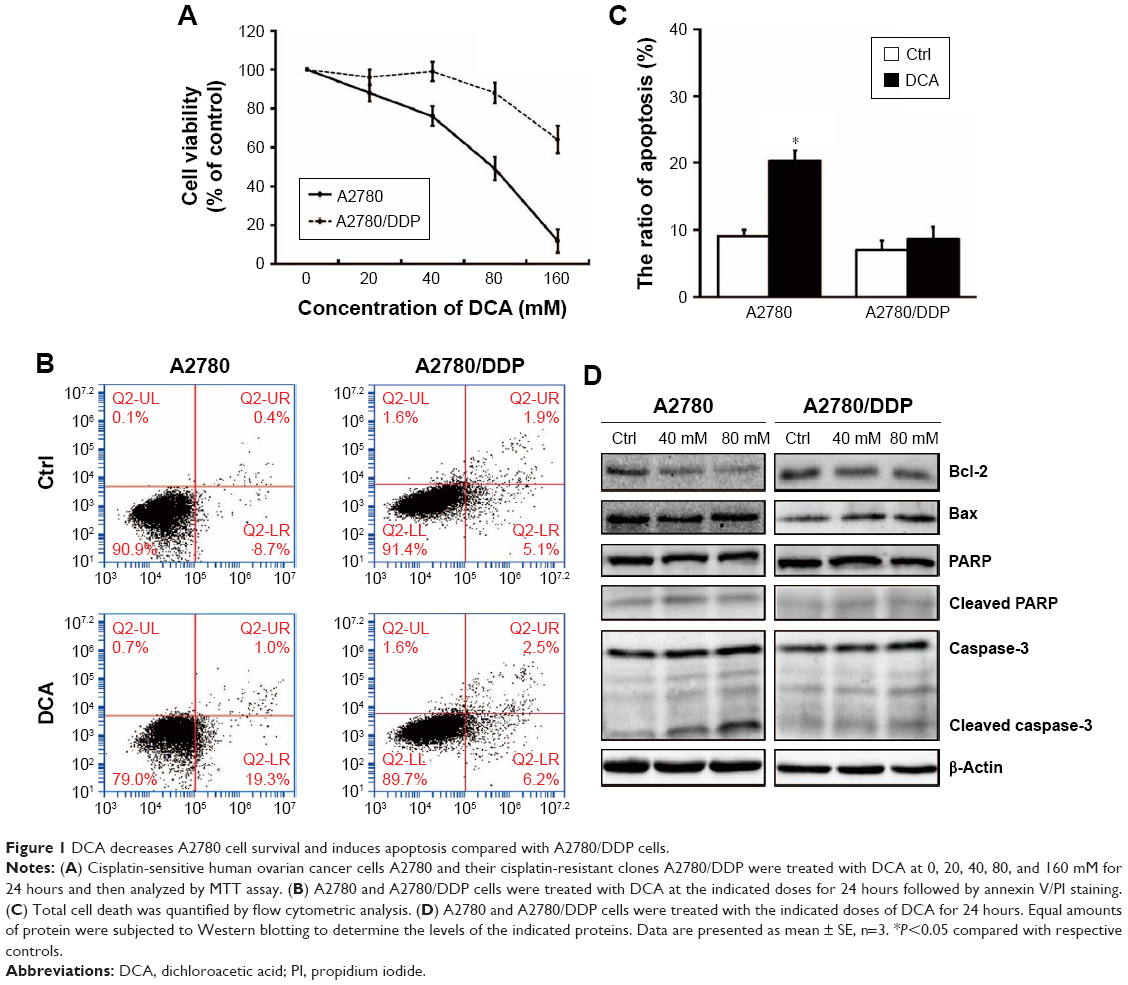 | Figure 1 DCA decreases A2780 cell survival and induces apoptosis compared with A2780/DDP cells. |
A2780/DDP cells have higher levels of glycolysis and lower mitochondrial functions compared with A2780 cells
We next investigated glucose consumption (Figure 2A), lactate production (Figure 2B), and LDH activity (Figure 2C) of the two ovarian cancer cell lines. The results showed that A2780/DDP cells had a higher level of glucose consumption, lactate production, and LDH activity compared with A2780 cells. Next, we examined the expression levels of genes encoding glycolysis-related enzymes. Expression of LDHA (lactate dehydrogenase A) and hexokinase 2 (HK2) was higher in A2780/DDP cells than A2780 cells (Figure 2E and F). The protein expression of glucose transporter type 4 (GLUT4), HK2, PDK1, p-PDH/PDH, and UCP2 was also higher in A2780/DDP cells (Figure 2D). To evaluate differences in mitochondrial functions between the two ovarian cancer cell lines, we examined the OCR, citrate production, and mitochondrial ROS (Figure 2G–I). The OCR represents the OXPHOS level. Compared with A2780 cells, A2780/DDP cells had lower OCR, mitochondrial ROS, and citrate production, suggesting that A2780/DDP cells were more dependent on glycolysis whereas A2780 cells used both glycolysis and mitochondrial OXPHOS. In addition, we detected the mitochondrial potential of A2780 cells and A2780/DDP cells. The results showed that the mitochondrial potential of A2780/DDP cells was higher than A2780 cells (Figure 2J).
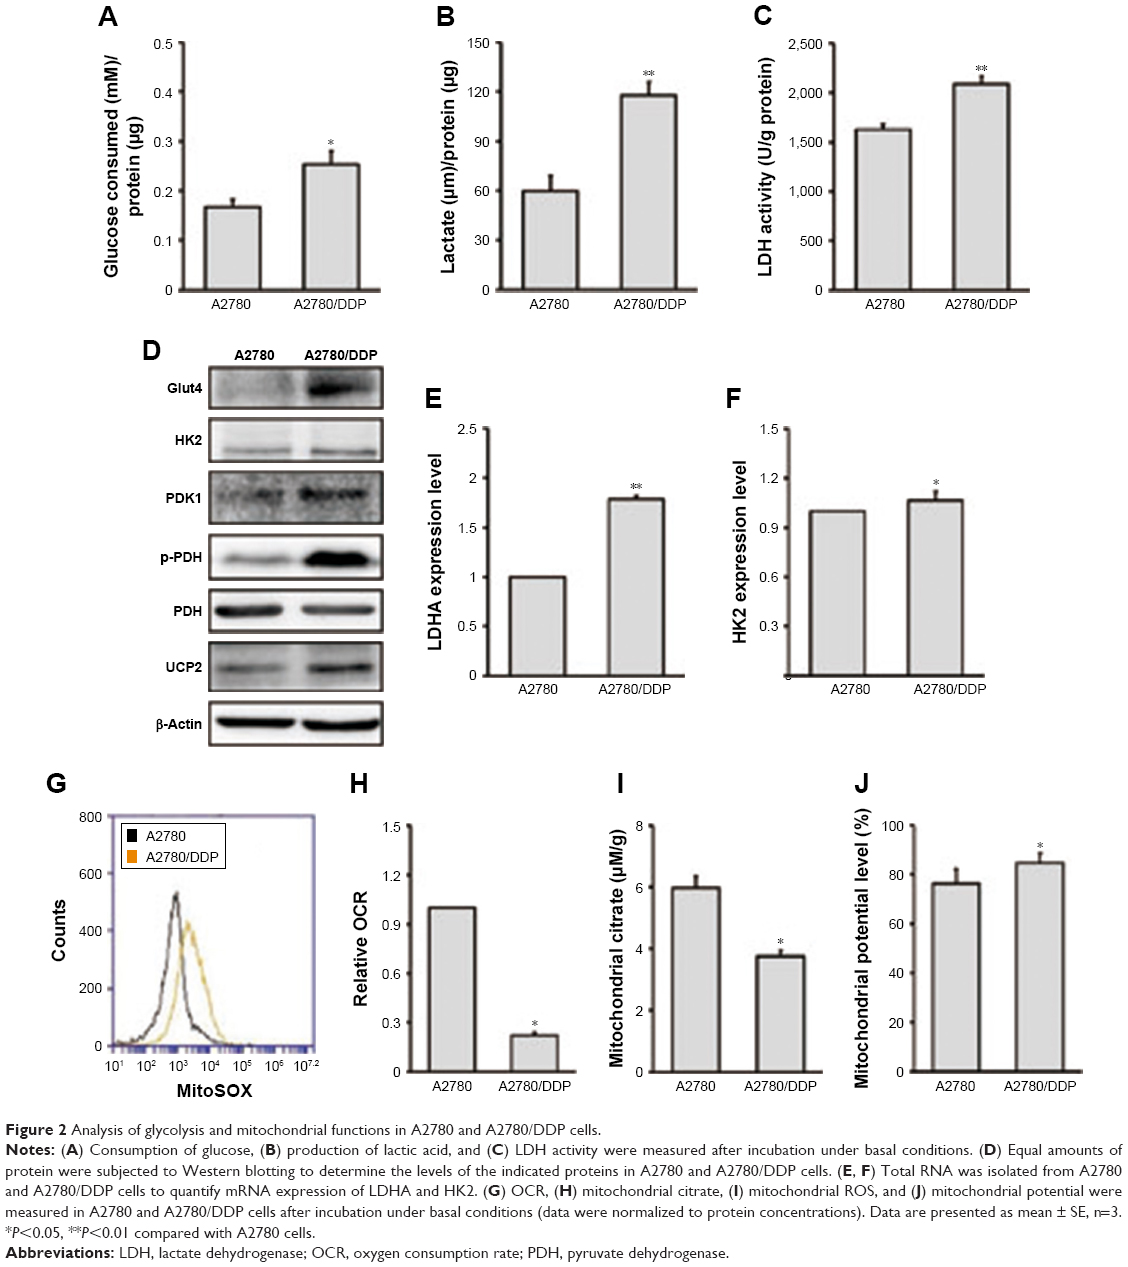 | Figure 2 Analysis of glycolysis and mitochondrial functions in A2780 and A2780/DDP cells. |
DCA inhibits glycolysis in A2780 cells compared with A2780/DDP cells
To understand the modulating effect of DCA on glycolysis, we examined glucose consumption and lactate production after treatment with 40 mM DCA. Both A2780 and A2780/DDP cells had decreased lactate production (Figure 3A and B) but only A2780 cells had decreased glucose consumption; DCA did not affect glucose consumption in A2780/DDP cells. The activity of the glycolysis-related enzyme LDH was also reduced in A2780 and A2780/DDP cells (Figure 3C). Western blot analysis further demonstrated decreased expression of p-PDH/PDH proteins in both A2780 and A2780/DDP cells but to a greater extent in A2780 cells (Figure 3D).
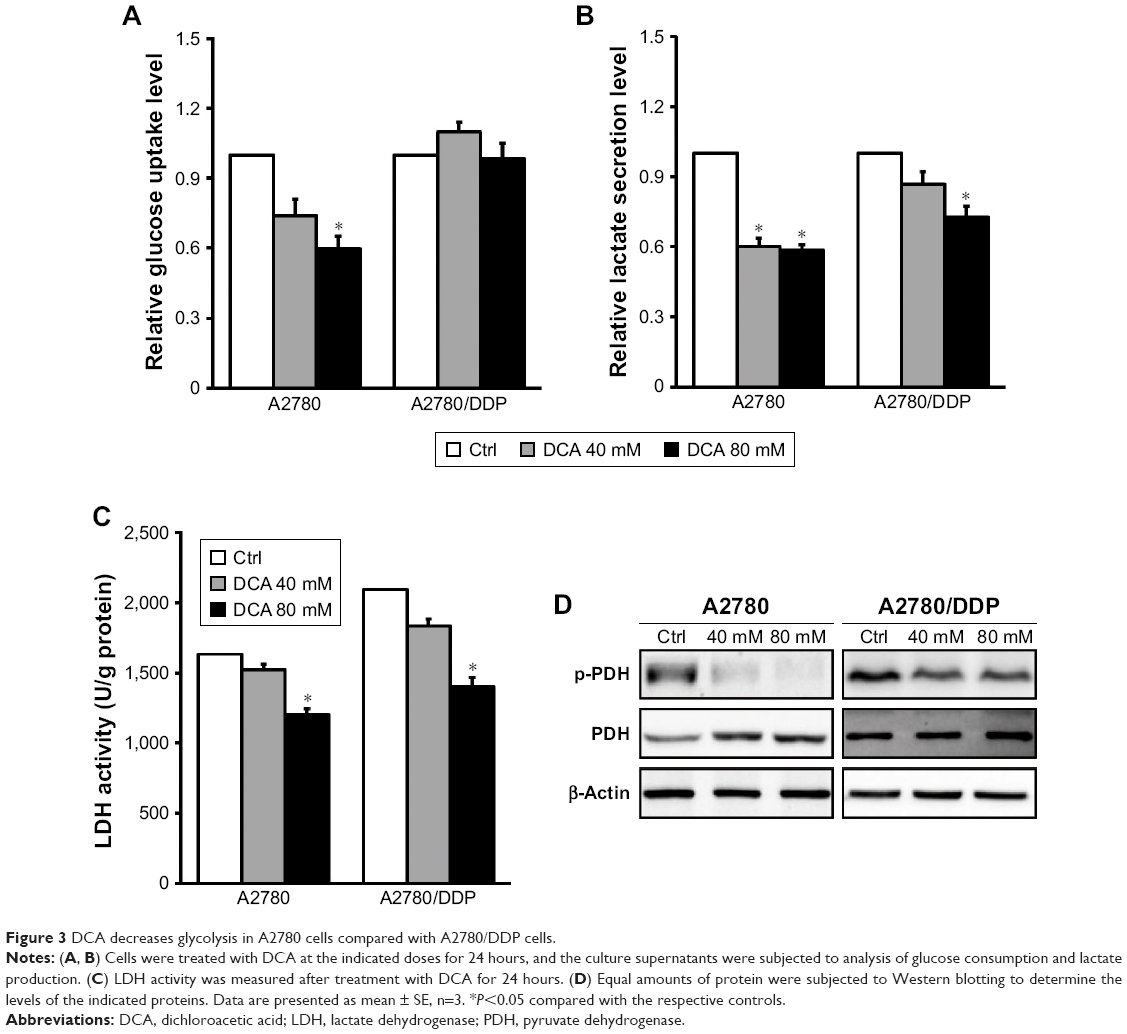 | Figure 3 DCA decreases glycolysis in A2780 cells compared with A2780/DDP cells. |
DCA restores mitochondrial functions in A2780 cells compared with A2780/DDP cells
DCA has the ability to restore OXPHOS, which induces ROS production and activates mitochondrial caspase functions. To assess changes in mitochondrial functions in response to DCA, we first examined changes in mitochondrial citrate and OCR after treatment with DCA (Figure 4A and B). Next, we examined the levels of mitochondrial ROS and overall ROS. DCA increased ROS production in A2780 cells, but there were no remarkable changes in A2780/DDP cells (Figure 4C and E). To analyze the mechanism of increased ROS production, we measured the expression of UCP2 and found that DCA inhibited UCP2 expression in A2780 cells compared with A2780/DDP cells (Figure 4D). This result suggested that the increased ROS levels might be due to decreased expression of UCP2 induced by DCA treatment.
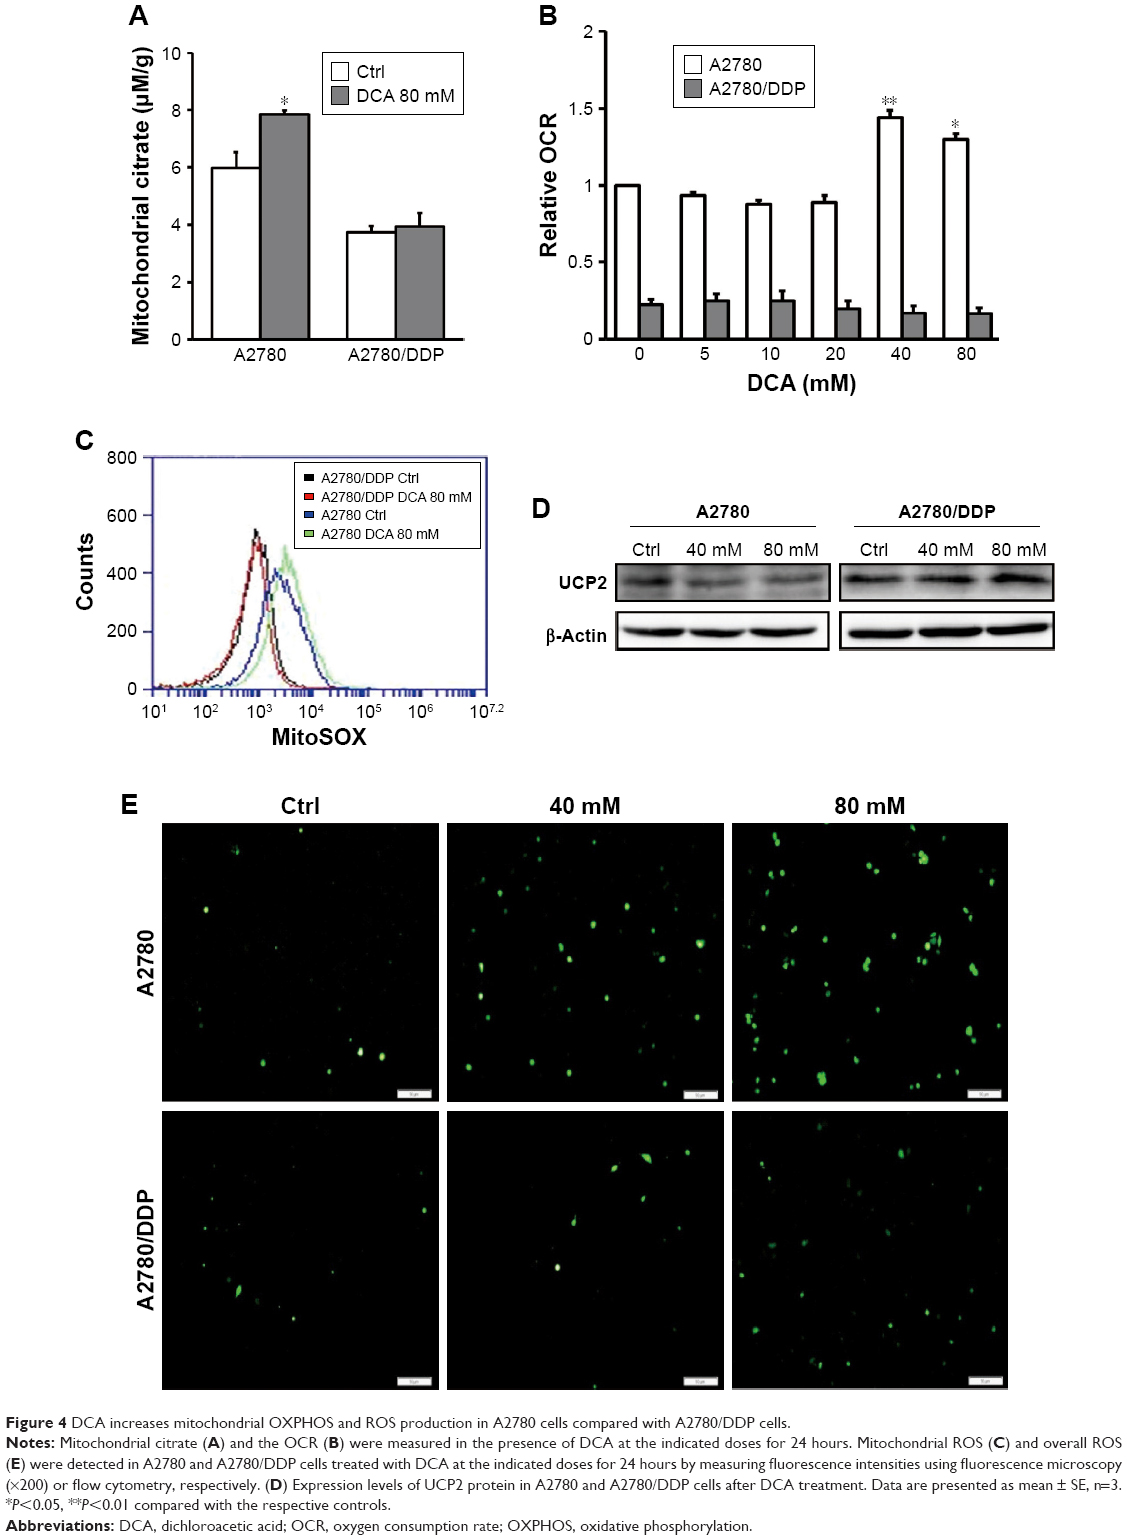 | Figure 4 DCA increases mitochondrial OXPHOS and ROS production in A2780 cells compared with A2780/DDP cells. |
Gene silencing of PDK1 increases cellular sensitivity to DCA in A2780/DDP cells
To further verify whether PDK1 expression is related to the low sensitivity of A2780/DDP cells to therapeutic agents, we silenced the PDK1 gene in A2780 and A2780/DDP cells. The survival rate of both ovarian cancer cell lines decreased, but that of A2780 cells decreased more significantly (Figure 5A). In addition, after PDK1 gene silencing the expression of UCP2 protein in A2780 cells decreased significantly but there was no significant change in A2780/DDP cells (Figure 5B).
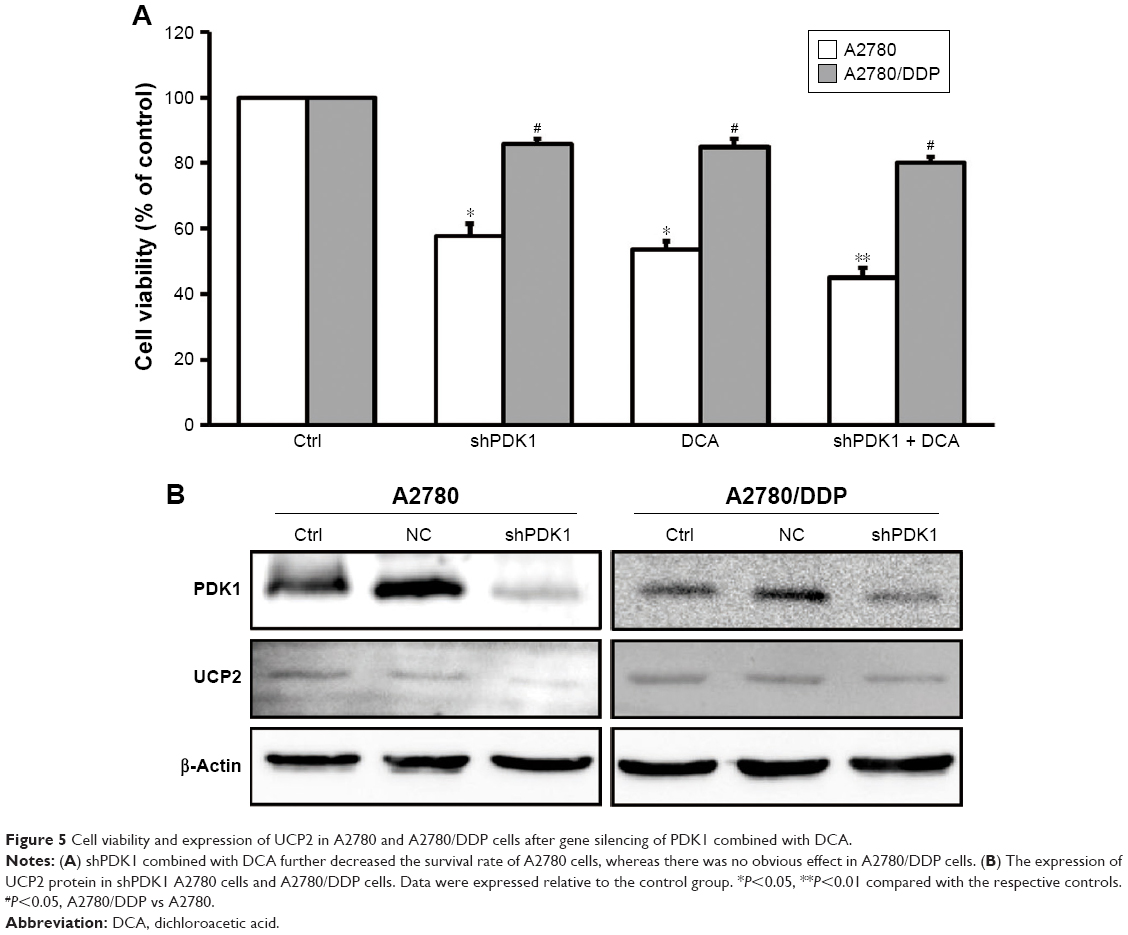 | Figure 5 Cell viability and expression of UCP2 in A2780 and A2780/DDP cells after gene silencing of PDK1 combined with DCA. |
Discussion
DCA has been used clinically for >30 years, but the molecular mechanism of its action is still not completely understood. Its effects have been recognized in various cancers, including pancreatic, colon, and endometrial cancers.18,19 DCA induced cell apoptosis through reactive oxygen species induced mitochondria-dependent signals. As well known, the mitochondrial-related apoptosis is the major mode of apoptosis. Mitochondrial is the most important organelle in cells, which controls the synthesis of ATP and OXPHOS. In this experiment, we examined its effects on two metabolic phenotypes in ovarian cancer cells. The PDK–PDH circuit plays an important role in regulating glycolytic and mitochondrial OXPHOS energy metabolism, and DCA increases PDH activity by inhibiting PDK to switch metabolism from glycolysis to mitochondrial respiration.20 However, not all cells are sensitive to DCA. Ruggieri et al investigated the effects of DCA on three oral squamous cell carcinoma lines, HSC-2, HSC-3, and PE5, and found that HSC-2 and HSC-3 cells are dependent on glycolysis and exhibit deficiencies in mitochondrial OXPHOS, resulting in higher sensitivity to DCA compared with PE5 cells.7 These results suggest that DCA significantly enhances respiratory activity and induces apoptosis but has no obvious effect on PE5 cells with stronger mitochondrial OXPHOS. In this study, we used ovarian cancer cell lines, A2780 and A2780/DDP, and evaluated their sensitivity to the metabolic drug DCA. DCA at 40 mM significantly inhibited cell viability and induced apoptosis of A2780 cells, whereas 80 mM DCA was required to significantly inhibit the viability of A2780/DDP cells. The metabolism of reprogrammed tumor cells changes to the glycolytic phenotype, although not all cancer cells exhibit the Warburg effect.21 In analysis of the metabolic phenotype, A2780 cells showed both glycolysis and mitochondrial OXPHOS, whereas the mitochondrial OXPHOS level of A2780/DDP cells was relatively low. Recent studies have shown that differences in DCA sensitivity are related to the glucose metabolism pattern associated with glycolysis and mitochondrial OXPHOS.
In a study of head and neck cancer, Roh et al found that the ratio of lactic acid production under normal conditions to lactic acid yield after addition of oligomycin is an indicator of the level of glycolysis.22,23 They further showed that tumor cells with a high glycolytic level were more sensitive to DCA. In this study, to investigate whether the different DCA sensitivities of A2780 and A2780/DDP cells were correlated with the level of glycolysis we first examined glycolysis-related indicators in the two ovarian cancer cell lines. The glucose uptake of A2780/DDP cells was higher than that of A2780 cells, and the expression levels of glycolysis-related genes HK2 and LDHA and glycolysis-related proteins GLUT4 and HK2 were also higher in A2780/DDP cells. Therefore, we hypothesized that the level of glycolysis was higher in A2780/DDP cells. PDK1 plays an important role in maintaining the level of glycolysis, and the conversion of pyruvate to acetyl CoA by PDH is vital to provide a link between glycolysis and the TCA cycle. In a study of head and neck cancer cells, Wigfield et al found that PDK1 overexpressing SCC-25 cells had high lactic acid metabolism and patients with PDK1 overexpression had poor prognoses.24 In our study, we also found significantly higher lactate production and lactate dehydrogenase activity in A2780/DDP cells with high expression of PDK1 and p-PDH compared with A2780 cells. These observations may explain why A2780/DDP cells were not sensitive to DCA. We further tested cell viability after gene silencing of PDK1. Treatment with shPDK1 combined with DCA further decreased the survival rate of A2780 cells; the survival rate of A2780/DDP cells also decreased but to a lesser extent. Thus, A2780/DDP cells with a higher level of glycolysis are less sensitive to DCA.
Studies have shown a relationship between glycolysis and tumor drug resistance. However, as the next stage of glycolysis, mitochondrial OXPHOS and its relationship with tumor cell drug resistance is now attracting attention. Pyruvate, the main product of the glycolysis pathway, is converted into lactic acid when oxygen is limited, whereas under normoxic conditions pyruvate is directed into mitochondria to be converted into acetyl-CoA by PDH, which is the first step in the TCA cycle. Acetyl-CoA further produces citric acid through the action of citrate synthase.25,26 Citric acid is an important metabolite of glycolysis and OXPHOS in tumor cells and a major indicator of mitochondrial function.16 Furthermore, mitochondria regulate ROS production and the release of apoptotic factors that activate caspases to promote cell death. Through PDK1 inhibition, it is possible to restore the aerobic oxidation of glucose by mitochondrial respiration. Chaudhary et al reported that prostate cancer cells with mitochondrial dysfunction are less sensitive to DCA.12 The results of our study also indicated that differences in mitochondrial functions of ovarian cancer cells lead to differences in DCA sensitivity.
The OCR is a measure of mitochondrial OXPHOS. We found that A2780 cells had a relatively high mitochondrial OCR whereas the mitochondrial OCR in A2780/DDP cells was four times lower, indicating loss of mitochondrial functions in A2780/DDP cells. ROS are a byproduct of OXPHOS and are mainly produced by mitochondrial complexes I, II, and III.27–29 The mitochondrial ROS level in A2780 cells was 2.9-fold higher than that in A2780/DDP cells, further indicating a loss of mitochondrial OXPHOS in A2780/DDP cells. In addition, a decline in mitochondrial ROS production can lead to apoptosis resistance of tumor cells, providing another reason why A2780/DDP cells are not sensitive to DCA.23 Citrate is a substrate and intermediate product of the TCA cycle that can enter the TCA cycle for oxidization or the cytoplasm through a transport protein, and is commonly used as an indicator of mitochondrial respiratory deficits.30 In our study, citrate production in the mitochondria of A2780 cells was significantly higher than that in A2780/DDP cells, indicating stronger mitochondrial respiration. Therefore, compared with A2780 cells, A2780/DDP cells have less mitochondrial respiration and lower susceptibility to DCA treatment.
UCP2 is a mitochondrial endoprotein that is thought to link cell bioenergy and glycolytic/aerobic phenotypes to cell division and cancer cell invasion.31 Derdak et al found that UCP2 enhances drug resistance in colon cancer cells.32 In our study, UCP2 expression in A2780/DDP cells was significantly higher than that in A2780 cells, which might be responsible for the insensitivity of A2780/DDP cells to DCA. The proton gradient produced by the electron transport chain in the mitochondrial inner membrane is necessary for coupling oxygen uptake to produce ATP, and UCP2 dissociates mitochondrial respiration by dispersing the proton gradient.33 An increase in UCP2 can generate a feedback mechanism for oxidative stress to control the generation of ROS, allowing tumor cells to survive and resist chemotherapeutic drugs.34–36 This may be a reason for the low ROS production in the mitochondria of A2780/DDP cells. Xu et al demonstrated that UCP2 switches energy metabolism from mitochondrial OXPHOS to glycolysis.15 In our study, A2780/DDP cells had higher levels of glycolysis and lower mitochondrial functions that may be associated with their high expression of UCP2. We found that DCA significantly promoted mitochondria OXPHOS in A2780 cells, including increased oxygen consumption, citrate production, and ROS production, and reduced lactate production and lactate dehydrogenase activity. Therefore, DCA causes a shift from glycolysis to mitochondrial OXPHOS in A2780 cells, whereas this metabolic effect was not significant in A2780/DDP cells. Mitochondria are the main sites for intracellular ROS production. DCA causes an imbalance in intracellular oxidative stress, which increased ROS production and oxidative stress in A2780 cells. In addition, our study revealed that UCP2 was associated with therapeutic resistance, and the underlying mechanism may involve inhibition of ROS production.34 The expression of UCP2 in A2780 cells was significantly decreased after DCA treatment but there was no significant change in UCP2 expression of A2780/DDP cells, which may be another explanation for the change in ROS after DCA treatment. Gene silencing of PDK1 by shPDK1 significantly reduced the expression of UCP2 protein in A2780 cells but had little effect on A2780/DDP cells. Thus, we hypothesize that UCP2 may induce changes in mitochondrial functions, leading to differences in DCA sensitivity.
Conclusion
Our study demonstrated that DCA has various effects on ovarian cancer cells with different metabolic phenotypes, in particular differences in mitochondrial OXPHOS and DCA sensitivity. This finding suggests that the effects of drugs that target sugar-metabolizing enzymes involve almost the entire process of glucose metabolism; therefore, comprehensive metabolic evaluation is required to determine drug efficacy, which may contribute to individualized antitumor therapy.
Acknowledgment
This study was funded by Jilin Provincial Research Foundation for the Development of Science and Technology Projects (20180101102JC).
Disclosure
The authors report no conflicts of interest in this work.
References
Roder F. An analysis of Warburg’s view on the origin of cancer cells. Philos Sci. 1956;23(4):343–347. | ||
Kroemer G, Pouyssegur J. Tumor cell metabolism: cancer’s Achilles’ heel. Cancer Cell. 2008;13(6):472–482. | ||
Morandi A, Indraccolo S. Linking metabolic reprogramming to therapy resistance in cancer. Biochim Biophys Acta Rev Cancer. 1868;2017(1):1–6. | ||
Samudio I, Fiegl M, Andreeff M. Mitochondrial uncoupling and the Warburg effect: molecular basis for the reprogramming of cancer cell metabolism. Cancer research. 2009;69(6):2163–2166. | ||
Kim JW, Dang CV. Cancer’s molecular sweet tooth and the Warburg effect. Cancer Res. 2006;66(18):8927–8930. | ||
Alkarakooly Z, Kilaparty SP, Al-Anbaky QA, Khan MS, Ali N. Dichloroacetic acid (DCA)-induced cytotoxicity in human breast cancer cells accompanies changes in mitochondrial membrane permeability and production of reactive oxygen species. J Cancer Ther. 2014;5(13):1234–1248. | ||
Ruggieri V, Agriesti F, Scrima R, et al. Dichloroacetate, a selective mitochondria-targeting drug for oral squamous cell carcinoma: a metabolic perspective of treatment. Oncotarget. 2015;6(2):1217–1230. | ||
Raimondi C, Falasca M. Targeting PDK1 in cancer. Curr Med Chem. 2011;18(18):2763–2769. | ||
Chambers KT, Leone TC, Sambandam N, et al. Chronic inhibition of pyruvate dehydrogenase in heart triggers an adaptive metabolic response. J Biol Chem. 2011;286(13):11155–11162. | ||
Kato M, Li J, Chuang JL, Chuang DT. Distinct structural mechanisms for inhibition of pyruvate dehydrogenase kinase isoforms by AZD7545, dichloroacetate, and radicicol. Structure. 2007;15(8):992–1004. | ||
Dhar S, Lippard SJ. Mitaplatin, a potent fusion of cisplatin and the orphan drug dichloroacetate. Proc Natl Acad Sci U S A. 2009;106(52):22199–22204. | ||
Chaudhary AK, Bhat TA, Kumar S, et al. Mitochondrial dysfunction-mediated apoptosis resistance associates with defective heat shock protein response in African-American men with prostate cancer. Br J Cancer. 2016;114(10):1090–1100. | ||
Klingenberg M. Mechanism and evolution of the uncoupling protein of brown adipose tissue. Trends Biochem Sci. 1990;15(3):108–112. | ||
Echtay KS, Roussel D, St-Pierre J, et al. Superoxide activates mitochondrial uncoupling proteins. Nature. 2002;415(6867):96–99. | ||
Xu Y, Miriyala S, Fang F, et al. Erratum: Manganese superoxide dismutase deficiency triggers mitochondrial uncoupling and the Warburg effect. Oncogene. 2017;36(28):4087. | ||
Icard P, Poulain L, Lincet H. Understanding the central role of citrate in the metabolism of cancer cells. Biochim Biophys Acta. 1825;2012(1):111–116. | ||
Zhou X, Chen R, Yu Z, et al. Dichloroacetate restores drug sensitivity in paclitaxel-resistant cells by inducing citric acid accumulation. Mol Cancer. 2015;14(1):63. | ||
Sánchez-Aragó M, Chamorro M, Cuezva JM. Selection of cancer cells with repressed mitochondria triggers colon cancer progression. Carcinogenesis. 2010;31(4):567–576. | ||
Saed GM, Fletcher NM, Jiang ZL, Abu-Soud HM, Diamond MP. Dichloroacetate induces apoptosis of epithelial ovarian cancer cells through a mechanism involving modulation of oxidative stress. Reprod Sci. 2011;18(12):1253–1261. | ||
Bhat TA, Kumar S, Chaudhary AK, Yadav N, Chandra D. Restoration of mitochondria function as a target for cancer therapy. Drug Discov Today. 2015;20(5):635–643. | ||
Gatenby RA, Gillies RJ. Why do cancers have high aerobic glycolysis? Nat Rev Cancer. 2004;4(11):891–899. | ||
Shen YC, Ou DL, Hsu C, et al. Activating oxidative phosphorylation by a pyruvate dehydrogenase kinase inhibitor overcomes sorafenib resistance of hepatocellular carcinoma. Br J Cancer. 2013;108(1):72–81. | ||
Roh JL, Park JY, Kim EH, Jang HJ, Kwon M. Activation of mitochondrial oxidation by PDK2 inhibition reverses cisplatin resistance in head and neck cancer. Cancer Lett. 2016;371(1):20–29. | ||
Wigfield SM, Winter SC, Giatromanolaki A, et al. PDK-1 regulates lactate production in hypoxia and is associated with poor prognosis in head and neck squamous cancer. Br J Cancer. 2008;98(12):1975–1984. | ||
Sugden MC, Holness MJ. Recent advances in mechanisms regulating glucose oxidation at the level of the pyruvate dehydrogenase complex by PDKs. Am J Physiol Endocrinol Metab. 2003;284(5):E855–E862. | ||
Fries M, Jung HI, Perham RN. Reaction mechanism of the heterotetrameric (alpha2beta2) E1 component of 2-oxo acid dehydrogenase multienzyme complexes. Biochemistry. 2003;42(23):6996–7002. | ||
Muller FL, Liu Y, van Remmen H. Complex III releases superoxide to both sides of the inner mitochondrial membrane. J Biol Chem. 2004;279(47):49064–49073. | ||
Quinlan CL, Treberg JR, Perevoshchikova IV, Orr AL, Brand MD. Native rates of superoxide production from multiple sites in isolated mitochondria measured using endogenous reporters. Free Radic Biol Med. 2012;53(9):1807–1817. | ||
Perevoshchikova IV, Quinlan CL, Orr AL, Gerencser AA, Brand MD. Sites of superoxide and hydrogen peroxide production during fatty acid oxidation in rat skeletal muscle mitochondria. Free Radic Biol Med. 2013;61:298–309. | ||
Lu J, Tan M, Cai Q. The Warburg effect in tumor progression: mitochondrial oxidative metabolism as an anti-metastasis mechanism. Cancer Lett. 2015;356(2 Pt A):156–164. | ||
Esteves P, Pecqueur C, Ransy C, et al. Mitochondrial retrograde signaling mediated by UCP2 inhibits cancer cell proliferation and tumorigenesis. Cancer Res. 2014;74(14):3971–3982. | ||
Derdak Z, Mark NM, Beldi G, et al. The mitochondrial uncoupling protein-2 promotes chemoresistance in cancer cells. Cancer Res. 2008;68(8):2813–2819. | ||
Akhmedov AT, Rybin V, Marín-García J. Mitochondrial oxidative metabolism and uncoupling proteins in the failing heart. Heart Fail Rev. 2015;20(2):227–249. | ||
Echtay KS. Mitochondrial uncoupling proteins – what is their physiological role? Free Radic Biol Med. 2007;43(10):1351–1371. | ||
Baffy G. Uncoupling protein-2 and cancer. Mitochondrion. 2010;10(3):243–252. | ||
Robbins D, Zhao Y. New aspects of mitochondrial uncoupling proteins (UCPs) and their roles in tumorigenesis. Int J Mol Sci. 2011;12(8):5285–5293. |
 © 2019 The Author(s). This work is published and licensed by Dove Medical Press Limited. The full terms of this license are available at https://www.dovepress.com/terms.php and incorporate the Creative Commons Attribution - Non Commercial (unported, v3.0) License.
By accessing the work you hereby accept the Terms. Non-commercial uses of the work are permitted without any further permission from Dove Medical Press Limited, provided the work is properly attributed. For permission for commercial use of this work, please see paragraphs 4.2 and 5 of our Terms.
© 2019 The Author(s). This work is published and licensed by Dove Medical Press Limited. The full terms of this license are available at https://www.dovepress.com/terms.php and incorporate the Creative Commons Attribution - Non Commercial (unported, v3.0) License.
By accessing the work you hereby accept the Terms. Non-commercial uses of the work are permitted without any further permission from Dove Medical Press Limited, provided the work is properly attributed. For permission for commercial use of this work, please see paragraphs 4.2 and 5 of our Terms.