Back to Journals » International Journal of Chronic Obstructive Pulmonary Disease » Volume 17
Diaphragm Ultrasound is an Imaging Biomarker that Distinguishes Exacerbation Status from Stable Chronic Obstructive Pulmonary Disease
Authors An TJ ![]() , Yoo YJ, Lim JU
, Yoo YJ, Lim JU ![]() , Seo W
, Seo W ![]() , Park CK
, Park CK ![]() , Rhee CK, Yoon HK
, Rhee CK, Yoon HK
Received 27 September 2021
Accepted for publication 21 December 2021
Published 4 January 2022 Volume 2022:17 Pages 3—12
DOI https://doi.org/10.2147/COPD.S341484
Checked for plagiarism Yes
Review by Single anonymous peer review
Peer reviewer comments 4
Editor who approved publication: Professor Min Zhang
Tai Joon An,1 Yeun Jie Yoo,2 Jeong Uk Lim,1 Wan Seo,3 Chan Kwon Park,1 Chin Kook Rhee,4 Hyoung Kyu Yoon1
1Division of Pulmonary and Critical Care Medicine, Department of Internal Medicine, Yeouido St. Mary’s Hospital, College of Medicine, The Catholic University of Korea, Seoul, Korea; 2Department of Rehabilitation Medicine, St. Vincent’s Hospital, College of Medicine, The Catholic University of Korea, Suwon, Korea; 3Department of Internal Medicine, St. Peter’s Hospital, Seoul, Korea; 4Division of Pulmonary and Critical Care Medicine, Department of Internal Medicine, Seoul St. Mary’s Hospital, College of Medicine, The Catholic University of Korea, Seoul, Korea
Correspondence: Hyoung Kyu Yoon Tel +82 2-3779-2213
Email [email protected]
Background: Evaluating the diaphragm muscle in chronic obstructive pulmonary disease (COPD) is important. However, the role of diaphragm ultrasound (DUS) in distinguishing the exacerbation status of COPD (AECOPD) is not fully understood. We set this study to evaluate the role of DUS as a biomarker for distinguishing the AECOPD.
Methods: COPD patients who underwent DUS were enrolled between March 2020 and November 2020. The diaphragm thickening fraction (TFmax) and diaphragm excursion (DEmax) during maximal deep breathing were measured. Patients were divided into exacerbation and stable groups. Demographics, lung function, and DUS findings were compared between the two groups. Receiver operating characteristic curve and univariate/multivariate logistic regression analyses were performed.
Results: Fifty-five patients were enrolled. The exacerbation group had a lower body mass index (BMI) (20.9 vs 24.2, p = 0.003), lower TFmax (94.8 ± 8.2% vs 158.4 ± 83.5%, p = 0.010), and lower DEmax (30.8 ± 11.1 mm vs 40.5 ± 12.5 mm, p = 0.007) compared to stable group. The areas under the TFmax (0.745) and DEmax (0.721) curves indicated fair results for distinguishing AECOPD. The patients were divided into low and high TFmax and DEmax groups based on calculated cut-off values. Low TFmax (odds ratio [OR] 8.40; 95% confidence interval [CI] 1.55– 45.56) and low DEmax (OR 11.51; 95% CI 1.15– 115.56) were associated with AECOPD after adjusting for age, sex, BMI, and lung functions.
Conclusion: DUS showed the possibility of an imaging biomarker distinguishing AECOPD from stable status.
Keywords: COPD, exacerbation, diaphragm, ultrasound, biomarker
Introduction
Chronic obstructive pulmonary disease (COPD) is a common chronic airway disease characterized by chronic airway inflammation with persistent airflow limitation.1,2 The goals of COPD management are to improve patient's symptoms and to reduce the COPD exacerbation (AECOPD). Impact of AECOPD is highly cost and accelerated with the progression of COPD.3 Therefore, detection of exacerbation status is particularly important in managing COPD. Currently, it is defined by symptom-based or event-based. However, it is still controversial due to its vague way of definition.4
For this reason, the biomarker of AECOPD was evaluated in various fields including the diaphragm muscle. Diaphragm muscle is key in the respiration process, and it is important to understand lung exercise physiology and the mechanics of COPD.5,6 Previous studies have shown that atrophy or dysfunction of the diaphragm are related to poor COPD outcomes, and these are also frequently found in AECOPD.7 The evaluation of the diaphragm is necessary for COPD patients, but it is difficult to achieve. The gold standard for evaluating diaphragm function is measuring trans-diaphragmatic pressure using an electromyogram during phrenic nerve stimulation or via maximal static inspiratory pressure and it is also a physiological biomarker of AECOPD.8,9 However, its use is extremely limited because it is invasive and time-consuming technique.
By contrast, diaphragm ultrasound (DUS) is an emerging alternative technique for evaluating the diaphragm muscle.10−16 It is a non-invasive, real-time, and intuitively understandable method for evaluating various aspects of the diaphragm.13,14 The method of DUS in COPD patients has been well described by previous studies.10,11 The usefulness of DUS in monitoring the improvement of AECOPD or in detecting the diaphragm dysfunction during AECOPD was well described in previous articles.17,18 In a recent systematic review, the role of DUS as an imaging biomarker was emphasized. However, few studies demonstrated DUS findings compared patients with a stable status to those with AECOPD.12,13 Also, there are no data about the value of diaphragm markers for distinguishing AECOPD from a stable COPD. We designed this study to analyze the effect of DUS findings as imaging biomarkers of AECOPD patients distinguishing from stable COPD patients.
Methods
Study Subjects
COPD patients who visited Yeouido St. Mary’s Hospital from March 2020 to November 2020 were reviewed retrospectively. They were previously diagnosed with COPD by pulmonologists and regularly visited hospital. All patients were selected if they performed DUS. They completed the modified Medical Research Council (mMRC) scale, COPD assessment test (CAT), history taking for Charlson comorbidity index (CCI), and pulmonary function tests (PFT) also. Patients were divided by the status of COPD, such as stable COPD and AECOPD. Inclusion and exclusion criteria were described as below.
Inclusion Criteria
- Patients who were aged ≥40 years old.
- Patients who meet the spirometry definition of COPD, such as forced expiratory volume in 1 sec/forced vital capacity ratio (FEV1/FVC) <0.70 in a post-bronchodilator response test.
- Patients who underwent DUS within 48 hours of visiting outpatient clinic for regular visit by stable COPD patients or admitting to hospital due to AECOPD.
Exclusion Criteria
- Patients who did not undergo DUS.
- Patients who underwent DUS after 48 hours of visiting clinics or admission.
- Patients with confounding factors to diaphragm functions, such as hemiplegia, quadriplegia, sequelae from an abdominal or thoracic operation, or diaphragm paralysis due to phrenic nerve palsy.
- Patients who did not complete the mMRC, CAT, CCI, and PFT when they underwent DUS.
- Patients who performed other interventions which affect the lung functions and the diaphragm muscles.
Definition of Severe Exacerbation of COPD and Stable COPD
AECOPD was defined by acute change in respiratory symptoms requiring medication change, such as systemic steroid or antibiotics.19 Severe AECOPD was defined who visits the emergency room or requires hospitalization due to exacerbation.4 Stable COPD patients were defined as who were not prescribed any systemic corticosteroid or antibiotics due to AECOPD for 3 months.
Comorbidities
Histories of medication and comorbidities were collected during the DUS exam. Electrical medical records were reviewed to confirm the comorbidities of the patients. The modified Charlson Comorbidity Index (mCCI), in which the chronic pulmonary disease categories are removed, was calculated to predict prognosis and mortality based on the International Classification of Diseases-10 diagnosis for the COPD patients.20
Diaphragm Ultrasound Protocol
All DUS exams were performed with a single high-resolution ultrasound machine (Affiniti 70, Phillips, Inc., Best, the Netherlands). The exams were conducted by a single pulmonology expert (Tai Joon An) who specializes in DUS more than 5 years. He is also a lecturer of lung and diaphragm ultrasound course of Korean Academy of Tuberculosis and Respiratory Diseases.
Measurement of Diaphragm Thickness and Excursion
DUS findings are well established in many previous studies.10,11,16 Patients were placed in a supine position, and the tests were performed at the right hemidiaphragm. A linear ultrasound probe (5–12 MHz) was used to measure the thickness of the diaphragm (DT) by B-mode. Diaphragm excursion (DE) was measured with a convex ultrasound probe (1–5 MHz) by M-mode. These measurements were repeated three times in the same position and the mean value was used as the representative value.
DT was measured in the zone of opposition in the right hemithorax over the mid-axillary line between the eighth and eleventh intercostal spaces in longitudinal intercostal view. DT was defined by the distance between the diaphragmatic pleura and the peritoneal membrane. First, it was measured at the end of expiration, which is correlated with functional residual capacity. Then, it was measured at the end of the inspiration during both quiet tidal breathing and maximal deep breathing.
DE was measured at the anterior subcostal margin of the right hemidiaphragm. A convex probe was positioned below the costal margin at the mid-clavicular line. The incidence angle of the ultrasound beam was perpendicular to the posterior third of the diaphragm, or the so-called DE line. The DE was the diaphragm inspiratory amplitude during respiration measured at the DE line in M-mode. DE was measured during quiet tidal breathing and maximal deep breathing (DEmax) (see Supplemental Figure 1).
Diaphragm Thickening Fraction
The thickening fraction of the diaphragm (TF) has been evaluated in many studies.10,11,15 It is related to the generation of diaphragm muscle pressure. The TF was calculated with the DT value. TF was defined as the ratio of DT changes between the end of expiration and the end of inspiration. The TF equation was [(DT at end-inspiration) – (DT at end-expiration)]/(DT at end-expiration) × 100. TF was also calculated during tidal breathing and maximal deep breathing (TFmax).
Statistical Analyses
The difference of clinical characteristic between stable COPD and AECOPD was analyzed. We used Student’s t test and the Mann–Whitney U-test for analyzing continuous variables according to the normality test results. Pearson’s chi-square test or Fisher’s exact test was used to compare categorical variables between groups. A receiver operating characteristic (ROC) curve analysis was performed to evaluate the usefulness of the DUS findings for classifying the exacerbation status. The Youden index was used to identify the optimal cut-off value for estimating exacerbation status. It was used to compare the ROC curves according to the variables. Binary univariate and multivariate logistic regression analyses were conducted to calculate the odds of being classified in the exacerbation group. A p-value <0.05 was considered to indicate significance. Student’s t test, the Mann–Whitney U-test, Pearson’s chi-square test, Fisher’s exact test, and the logistic regression analyses were performed using IBM SPSS Statistics for Windows, version 26.0 (IBM Corp., Armonk, NY, USA). The ROC curve analyses, the Youden’s index, and the comparison of the ROC curves were performed using MedCalc® Statistical Software version 19.5.6 (MedCalc Software Ltd., Ostend, Belgium; https://www.medcalc.org; 2020).
Results
Demographics of Study Subject
Fifty-five COPD patients were enrolled in the study. Twenty-two were classified as having an AECOPD and the remainder was in stable status (stable group). No significant differences in age, sex, mCCI, or COPD medication were observed between the two groups. The AECOPD group had a lower body mass index (BMI) than the stable group (20.9 vs 24.2 kg/m2, p = 0.003). Scores of the symptom and dyspnea scales, such as the CAT (25.4 ± 8.2 vs 13.7 ± 3.8, p < 0.001) and mMRC (3.1 ± 1.0 vs 1.7 ± 1.2, p < 0.001), were significantly higher in the AECOPD group than in the stable group. Smoking status and the baseline Global Initiative for Chronic Obstructive Lung Disease (GOLD) grouping differed between the two groups. Lung function was different between the two groups. Absolute values and predictive percentages of FVC and FEV1 were significantly lower in the AECOPD group than in the stable group. The air-trapping index (residual volume/total lung capacity, RV/TLC) was higher in the AECOPD group than in the stable group (51.7 ± 9.4 vs 43.7 ± 8.1, p = 0.019) (Table 1).
 |
Table 1 Patient Demographics |
DT at end-expiration and end-inspiration during quiet tidal breathing, and at end-inspiration during maximal deep breathing did not differ between the two groups. TF and DE during quiet tidal breathing did not differ between the AE and stable groups. TFmax and DEmax were significantly lower in the AECOPD group than in the stable group compared to values during tidal breathing (94.8 ± 8.2% vs 158.4 ± 83.5%, p = 0.010; 30.8 ± 11.1 mm vs 40.5 ± 12.5 mm, p = 0.007, respectively) (Table 1).
Diaphragm Ultrasound Distinguished Acute Exacerbation from Stable Status in COPD Patients
ROC curve analyses of TFmax and DEmax for distinguishing the AECOPD group were performed. The areas under the curve (AUC) for TFmax and DEmax were 0.745 and 0.721, respectively (Figure 1 and Table 2). The maximal Youden’s index was summarized for the maximum potential effectiveness of variables with optimal cut-off values. The TFmax cut-off value was 93.8% (sensitivity 68.4%, specificity 78.8%) and that of DEmax was 44.9 mm (sensitivity 95.2%, specificity 44.8%) (Table 2). No significant difference in TFmax and DEmax (p = 0.608) was observed when the ROC curves were compared (Figure 1).
 |
Table 2 Results of the Receiver Operating Characteristic Curve Analysis for COPD Exacerbation |
 |
Figure 1 Receiver operating characteristic (ROC) curve analysis for determining chronic obstructive pulmonary disease exacerbation status using diaphragm ultrasound findings. The ROC curve for distinguishing exacerbation from a stable status indicated that the outcomes were fair. The area under the curve (AUC) of the thickening fraction during maximal deep breathing (TFmax) was 0.745. The AUC of diaphragm excursion during maximal deep breathing (DEmax) was 0.721. No significant difference was observed between TFmax and DEmax for distinguishing exacerbation status (p = 0.608). Abbreviations: TF, thickening fraction at maximal inspiration; DE, diaphragm excursion at maximal inspiration. |
We also conducted ROC curve analyses for the other variables, such as the absolute values of FVC, FEV1, and BMI, because these variables are well-known exacerbation factors from previous studies. These variables exhibited clinical significance in the ROC curve analyses (Table 2). Therefore, we conducted multiple comparisons of the ROC curves to compare the performance of the TFmax (Figure 2A) and DEmax (Figure 2B) models with that of the others. The TFmax and DEmax models for the AECOPD group were non-inferior to those of FVC, FEV1, and BMI (Figure 2C).
 |
Figure 2 Multiple comparative analysis of the receiver operating characteristic (ROC) curve between diaphragm thickening, diaphragm excursion, lung function, and body mass index (BMI). The ROC curve of thickening fraction of diaphragm during maximal breathing (TFmax) (A) and diaphragm excursion during maximal breathing (DEmax) (B) showed in Figure 2. (C) There was no significant difference for distinguishing exacerbation both in TFmax and DEmax compared to those of forced vital capacity (FVC), forced expiratory volume in 1 second (FEV1), and BMI in multiple comparative analysis of the ROC curve analysis. Abbreviations: BMI, body mass index; TFmax, thickening fraction at maximal inspiration; DEmax, diaphragm excursion at maximal inspiration; FVC, forced vital capacity; FEV1, forced expiratory volume in 1 sec. |
Differences in Demographics According to Low or High TFmax and Low or High DEmax
We set new variables according to optimal TFmax and DEmax cut-off values. The low TFmax and high TFmax groups were divided by a cut-off value of 93.8%. The low DEmax and high DEmax groups were divided by a cut-off value of 44.9 mm. No significant differences in age, sex, mCCI, BMI, CAT score, or mMRC score were observed between the two groups. The low TFmax and low DEmax groups usually had many symptoms and exacerbation histories.
Lung functions, such as FEV1 and FVC, were lower in low DEmax group than high DEmax group. Lung functions between low TFmax group and high TFmax groups did not show consistent differences. However, the degree of air-trapping (RV/TLC) was consistently and significantly higher in low DUS imaging biomarker group (low TFmax or low DEmax) than high DUS biomarker group (high TFmax or high DEmax). Moreover, the percentage of AE patients was significantly higher in the low TFmax (63.2%) and low DEmax (55.6%) groups than in the high TFmax (23.5%) and high DEmax (7.1%) groups (Table 3).
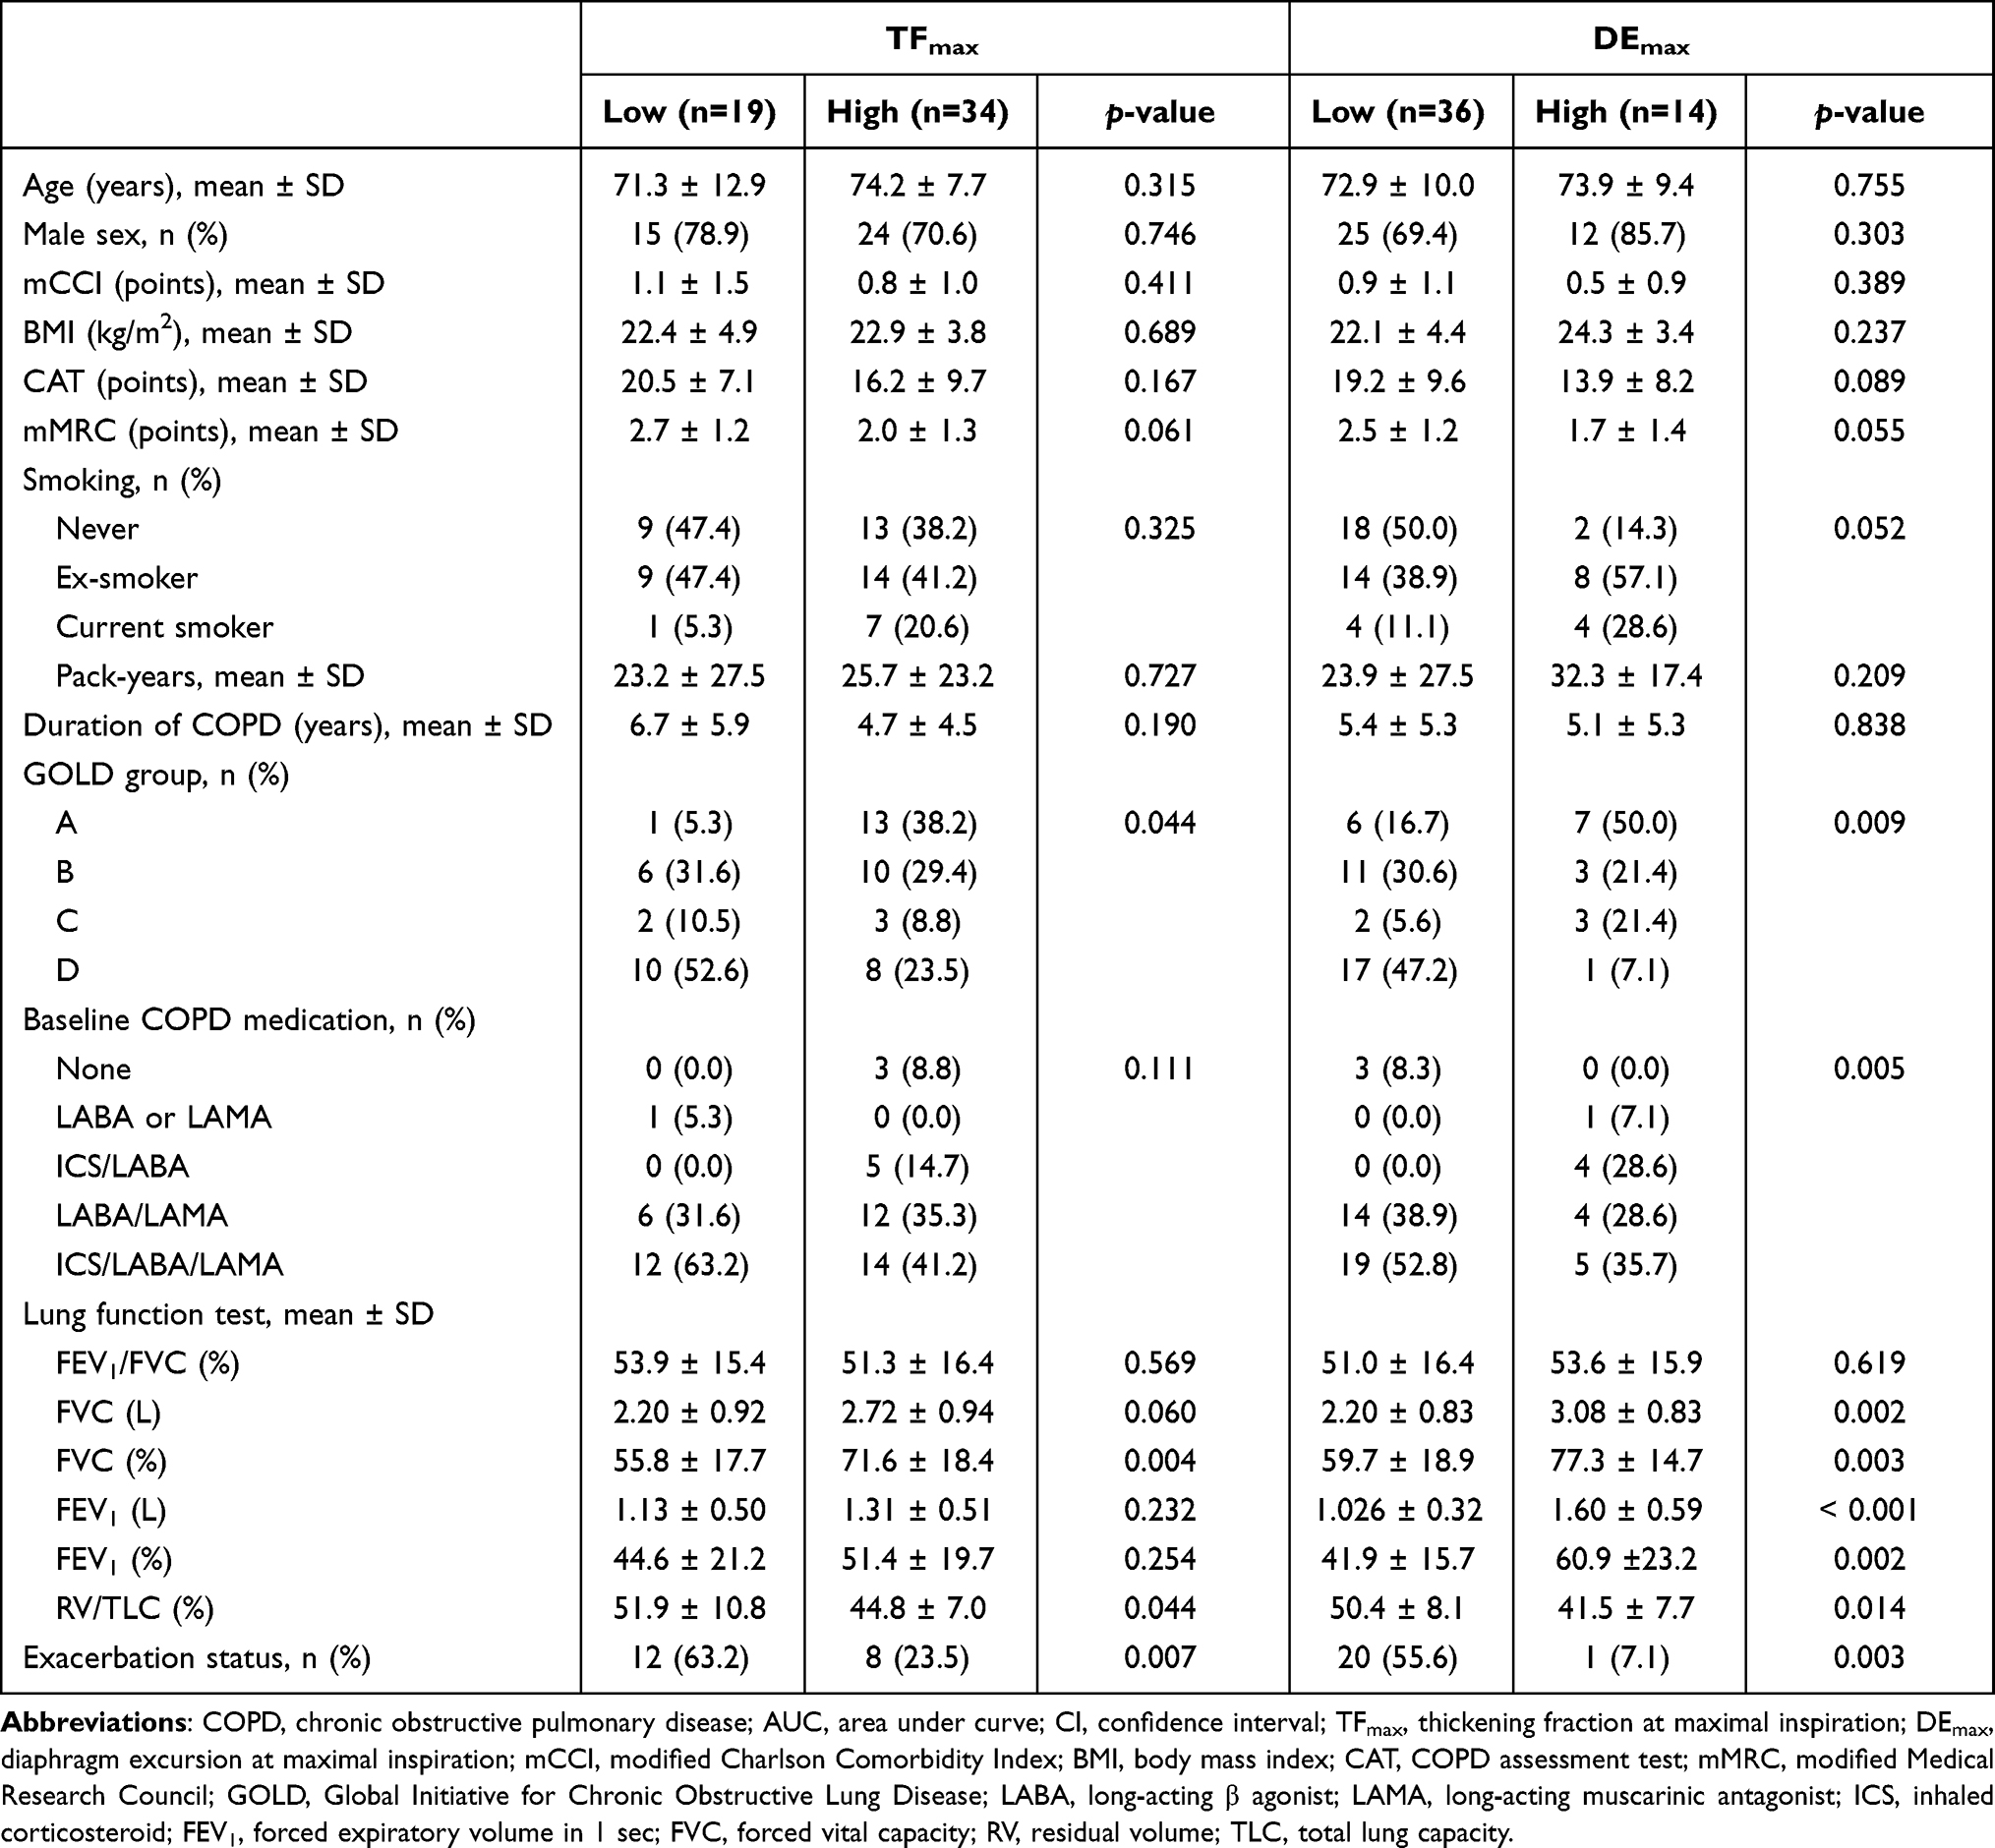 |
Table 3 Clinical Characteristics of COPD Patients According to Diaphragm Ultrasound Findings |
Low TFmax and Low DEmax Were Associated with AECOPD
We performed multivariate logistic regression analyses to determine whether a low TFmax and low DEmax could be used for distinguishing exacerbation status. The variables were entered into two models that included age, male sex, mCCI, and BMI. Model 1 included variables such as age, male sex, mCCI, BMI, and a low TFmax, and model 2 included a low DEmax as the variable instead of TFmax. In model 1 univariate analyses, a high mCCI, low BMI, and low TFmax were associated with exacerbation. In the adjusted analyses, a low BMI (odds ratio [OR] 0.70; 95% confidence interval [CI] 0.56–0.88) and low TFmax (OR 8.40; 95% CI 1.55–45.56) were associated with exacerbation. Similar results were observed for model 2. A high mCCI (OR 2.68; 95% CI 1.09–6.60), low BMI (OR 0.79; 95% CI 0.64–0.97), and low DEmax (OR 11.51; 95% CI 1.15–115.56) were associated with exacerbation after adjustment. Therefore, low TFmax and low DEmax groups were associated with an exacerbation status (Table 4).
 |
Table 4 Logistic Regression Analysis for Estimating Exacerbation of Chronic Obstructive Pulmonary Diseases |
Discussion
We designed this study to analyze the association between DUS findings and status of COPD, especially AECOPD. Many significant differences in DUS findings, such as the TFmax and DEmax, were observed between patients in stable status or in AECOPD. However, no significant difference in DT was observed at end-expiration or end-inspiration.
In this study, differences in breathing effort produced different results. Measuring the DUS biomarkers during maximal effort has shown the clinical importance whereas those of quiet tidal breathing did not. Respiratory muscle reserve or contractile strength was related to the change of diaphragm thickness (TF) or change of length (DE), not by muscle mass itself (DT) in previous studies. These findings support the results of previous articles.11,12,15,16 No previous study has examined differences in DUS findings between quiet breathing and maximal breathing both in stable and exacerbation status. Only the maximal deep breathing findings were different between the groups and those were associated with an exacerbation status. Possible related mechanism of these findings is air-trapping. Air-trapping, which is represented by the value of RV/TLC, is significantly different between stable COPD and AECOPD.21,22 In the previous study, air-trapping (RV/TLC) is major limiting factor of DUS in COPD patients.23 Therefore, the status of DUS findings can only be different between AECOPD and stable COPD and that is the reason that DUS imaging biomarkers during maximal breathing showed clinical significance compared to those of tidal breathing.
We also described the usefulness of TFmax and DEmax of distinguishing the AECOPD in the study. The results of the ROC curve analyses showed that TFmax and DEmax were not inferior markers to each other, and they have complementary roles. TFmax was highly specific (78.8%) and DEmax was extremely sensitive (95.2%). Both were non-inferior to other classical factors of AECOPD, such as age, sex, FVC, FEV1, and BMI. After dividing the patients into those with low or high TFmax and those with low or high DEmax, the low TFmax and low DEmax groups exhibited poorer lung function and a higher proportion of AECOPD. After adjusting for age, sex, mCCI, and BMI, low TFmax patients were classified into the AECOPD group 8.40-times higher than high TFmax patients, and low DEmax patients were classified into the AECOPD group 11.51-times higher than high DEmax patients. These findings suggest that DUS findings can be used as distinguishing imaging biomarkers for AECOPD. As far as we know, we firstly showed that they were non-inferior to each other and were complementary markers for detecting AECOPD. TFmax and DEmax should be checked together when DUS is performed on a patient who is suspected of AECOPD status.
Another interesting finding is the usefulness of the DUS findings. The results were associated with exacerbation status after adjustment, and the markers were not inferior to classical biomarkers such as FVC, FEV1, and BMI for classifying exacerbation. Compared to those markers, DUS is a real-time test that can be performed immediately when exacerbation is suspected. It is also evaluated in patients who cannot perform PFT due to various reasons. It is the most valuable benefit of DUS as a novel biomarker for distinguishing the severe AECOPD who need hospitalization.
Several limitations of this study should be discussed. First, the cut-off value of the DUS findings reflected maximal potential efficiency only. However, the cut-off values in this study were not inferior to those of conventional markers for classifying COPD status. More studies should specifically evaluate proper cut-off values. Second, we retrospectively included patients in this study. However, we compared the diaphragm marker itself without another intervention in this setting. Third, this study included small number of patients and did not matched baseline characteristics. However, it has the character of a pilot study, and we corrected many underlying factors by statistical method. Moreover, this study firstly described many interesting aspects of DUS imaging biomarker of distinguishing the AECOPD.
Conclusion
This study describes the utility of DUS in COPD patients. This is a novel study to report the role of DUS imaging biomarker for distinguishing AECOPD from stable status. We also showed the value of DUS findings with the consideration of other contributing factors, such as sex, age, and BMI. Based on the results, we showed the possibility of using DUS findings as novel complementary imaging biomarkers of AECOPD.
Abbreviations
COPD, chronic obstructive pulmonary disease; AECOPD, acute exacerbation of COPD; DUS, diaphragm ultrasound; mMRC, modified Medical Research Council scale; CAT, COPD assessment test; CCI, Charlson comorbidity index; FEV1, forced expiratory volume in 1 sec; FVC, forced vital capacity ratio; mCCI, modified Charlson comorbidity index; DT, thickness of diaphragm; DE, diaphragm excursion; DEmax, diaphragm excursion during maximal deep breathing; TF, thickening fraction of diaphragm; TFmax, thickening fraction of diaphragm during maximal deep breathing; ROC, receiver operating characteristic; RV/TLC, residual volume/total lung capacity; AUC, areas under the curve; BMI, body mass index; OR, odds ratio; CI, confidence interval; SD, standard deviation; GOLD, Global Initiative for Chronic Obstructive Lung Disease; LABA, long acting β agonist; LAMA, long-acting muscarinic antagonist; ICS, inhaled corticosteroid.
Data Sharing Statement
Researchers may request datasets which were used in this study to the corresponding author with reasonable request.
Ethics Approval and Consent to Participate
This study was approved by the Institutional Review Board of The Catholic University of Korea Yeouido St. Mary’s Hospital (approval no. SC20RIS0181). Informed consent was waived due to the retrospective nature of the study. All the data was anonymized for covering the patient data confidentiality and compliance with the Declaration of Helsinki.
Consent for Publication
All authors agreed with the publication.
Acknowledgment
The authors are grateful to Textcheck (www.textcheck.com) for English-language editing (certificate number: 20122713).
Funding
There is no funding to report.
Disclosure
Prof. Dr. Chin Kook Rhee reports personal fees from MSD, personal fees from AstraZeneca, personal fees from GSK, personal fees from Novartis, personal fees from Takeda, personal fees from Mundipharma, personal fees from Boehringer-Ingelheim, personal fees from Teva, personal fees from Sanofi, personal fees from Bayer, outside the submitted work. The authors have no other conflicts of interest to declare.
References
1. Lim JU, Kim DK, Lee MG, et al. Clinical characteristics and changes of clinical features in patients with asthma-COPD overlap in Korea according to different diagnostic criteria. Tuberc Respir Dis (Seoul). 2020;83(Supple 1):S34–S45. doi:10.4046/trd.2020.0031
2. Rhee CK, Kim K, Yoon HK, et al. Natural course of early COPD. Int J Chron Obstruct Pulmon Dis. 2017;12:663–668. doi:10.2147/COPD.S122989
3. Anzueto A. Impact of exacerbations on COPD. Eur Respir Rev. 2010;19(116):113–118. doi:10.1183/09059180.00002610
4. Kim V, Aaron SD. What is a COPD exacerbation? Current definitions, pitfalls, challenges and opportunities for improvement. Eur Respir J. 2018;52:5. doi:10.1183/13993003.01261-2018
5. Sinderby C, Spahija J, Beck J, et al. Diaphragm activation during exercise in chronic obstructive pulmonary disease. Am J Respir Crit Care Med. 2001;163(7):1637–1641. doi:10.1164/ajrccm.163.7.2007033
6. Zambon M, Greco M, Bocchino S, Cabrini L, Beccaria PF, Zangrillo A. Assessment of diaphragmatic dysfunction in the critically ill patient with ultrasound: a systematic review. Intensive Care Med. 2017;43(1):29–38. doi:10.1007/s00134-016-4524-z
7. Ottenheijm CA, Heunks LM, Sieck GC, et al. Diaphragm dysfunction in chronic obstructive pulmonary disease. Am J Respir Crit Care Med. 2005;172(2):200–205. doi:10.1164/rccm.200502-262OC
8. Ticinesi A, Meschi T, Narici MV, Lauretani F, Maggio M. Muscle ultrasound and sarcopenia in older individuals: a clinical perspective. J Am Med Dir Assoc. 2017;18(4):290–300. doi:10.1016/j.jamda.2016.11.013
9. Murphy PB, Kumar A, Reilly C, et al. Neural respiratory drive as a physiological biomarker to monitor change during acute exacerbations of COPD. Thorax. 2011;66(7):602–608. doi:10.1136/thx.2010.151332
10. Rittayamai N, Chuaychoo B, Tscheikuna J, Dres M, Goligher EC, Brochard L. Ultrasound evaluation of diaphragm force reserve in patients with chronic obstructive pulmonary disease. Ann Am Thorac Soc. 2020;17(10):1222–1230. doi:10.1513/AnnalsATS.202002-129OC
11. Okura K, Iwakura M, Shibata K, et al. Diaphragm thickening assessed by ultrasonography is lower than healthy adults in patients with chronic obstructive pulmonary disease. Clin Respir J. 2020;14(6):521–526. doi:10.1111/crj.13161
12. Shaikh H, Laghi F. Role of diaphragm ultrasound when NIV fails in COPD exacerbations. Respir Care. 2019;64(12):1600–1602. doi:10.4187/respcare.07523
13. Lim SY, Lim G, Lee YJ, et al. Ultrasound assessment of diaphragmatic function during acute exacerbation of chronic obstructive pulmonary disease: a pilot study. Int J Chron Obstruct Pulmon Dis. 2019;14:2479–2484. doi:10.2147/COPD.S214716
14. Zanforlin A, Smargiassi A, Inchingolo R, Valente S, Ramazzina E. Ultrasound in obstructive lung diseases: the effect of airway obstruction on diaphragm kinetics. A Short Pictorial Essay. J Ultrasound. 2015;18(4):379–384.
15. Kumar S, Chandra S. Ultrasound assessment of the diaphragm in patients with COPD. Chest. 2014;146(4):e146. doi:10.1378/chest.14-1095
16. Baria MR, Shahgholi L, Sorenson EJ, et al. B-mode ultrasound assessment of diaphragm structure and function in patients with COPD. Chest. 2014;146(3):680–685. doi:10.1378/chest.13-2306
17. Antenora F, Fantini R, Iattoni A, et al. Prevalence and outcomes of diaphragmatic dysfunction assessed by ultrasound technology during acute exacerbation of COPD: a pilot study. Respirology. 2017;22(2):338–344. doi:10.1111/resp.12916
18. Marchioni A, Castaniere I, Tonelli R, et al. Ultrasound-assessed diaphragmatic impairment is a predictor of outcomes in patients with acute exacerbation of chronic obstructive pulmonary disease undergoing noninvasive ventilation. Crit Care. 2018;22(1):109. doi:10.1186/s13054-018-2033-x
19. Wedzicha JA, Miravitlles M, Hurst JR, et al. Management of COPD exacerbations: a European Respiratory Society/American Thoracic Society guideline. Eur Respir J. 2017;49(3):1600791. doi:10.1183/13993003.00791-2016
20. Sundararajan V, Henderson T, Perry C, Muggivan A, Quan H, Ghali WA. New ICD-10 version of the Charlson comorbidity index predicted in-hospital mortality. J Clin Epidemiol. 2004;57(12):1288–1294. doi:10.1016/j.jclinepi.2004.03.012
21. Alter P, Orszag J, Kellerer C, et al. Prediction of air trapping or pulmonary hyperinflation by forced spirometry in COPD patients: results from COSYCONET. ERJ Open Res. 2020;6(3):00092–2020. doi:10.1183/23120541.00092-2020
22. Singh D. Small airway disease in patients with chronic obstructive pulmonary disease. Tuberc Respir Dis (Seoul). 2017;80(4):317–324. doi:10.4046/trd.2017.0080
23. Dos Santos Yamaguti WP, Paulin E, Shibao S, et al. Air trapping: the major factor limiting diaphragm mobility in chronic obstructive pulmonary disease patients. Respirology. 2008;13(1):138–144. doi:10.1111/j.1440-1843.2007.01194.x
 © 2022 The Author(s). This work is published and licensed by Dove Medical Press Limited. The
full terms of this license are available at https://www.dovepress.com/terms
and incorporate the Creative Commons Attribution
- Non Commercial (unported, 3.0) License.
By accessing the work you hereby accept the Terms. Non-commercial uses of the work are permitted
without any further permission from Dove Medical Press Limited, provided the work is properly
attributed. For permission for commercial use of this work, please see paragraphs 4.2 and 5 of our Terms.
© 2022 The Author(s). This work is published and licensed by Dove Medical Press Limited. The
full terms of this license are available at https://www.dovepress.com/terms
and incorporate the Creative Commons Attribution
- Non Commercial (unported, 3.0) License.
By accessing the work you hereby accept the Terms. Non-commercial uses of the work are permitted
without any further permission from Dove Medical Press Limited, provided the work is properly
attributed. For permission for commercial use of this work, please see paragraphs 4.2 and 5 of our Terms.