Back to Journals » Journal of Inflammation Research » Volume 16
Diagnostic Values of METTL1-Related Genes and Immune Characteristics in Systemic Lupus Erythematosus
Authors Liu Y, Zhu E, Lei Y, Luo A, Yan Y, Cai M, Liu S, Huang Y, Guan H ![]() , Zhong M, Li W, Lin L, Hultström M, Lai E, Zheng Z, Liu X, Tang C
, Zhong M, Li W, Lin L, Hultström M, Lai E, Zheng Z, Liu X, Tang C ![]()
Received 24 July 2023
Accepted for publication 31 October 2023
Published 17 November 2023 Volume 2023:16 Pages 5367—5383
DOI https://doi.org/10.2147/JIR.S431628
Checked for plagiarism Yes
Review by Single anonymous peer review
Peer reviewer comments 2
Editor who approved publication: Professor Ning Quan
Yu Liu,1,* Enyi Zhu,1,* Yan Lei,1,* Ailing Luo,2 Yaping Yan,2 Mansi Cai,2 Shanshan Liu,2 Yan Huang,3 Hui Guan,1 Ming Zhong,1 Weinian Li,4 Lian Lin,1 Michael Hultstöm,5,6 Enyin Lai,7 Zhihua Zheng,1 Xiaoping Liu,2 Chun Tang1
1Department of Nephrology, Center of Kidney and Urology, the Seventh Affiliated Hospital, Sun Yat-sen University, Shenzhen, 518107, People’s Republic of China; 2Department of Hematology, Guangzhou Women and Children’s Medical Center, Guangzhou Medical University, Guangdong Provincial Clinical Research Center for Child Health, Guangzhou, 510623, People’s Republic of China; 3The First Affiliated Hospital, Hengyang Medical School, University of South China, Hengyang, 421001, People’s Republic of China; 4Department of Rheumatology, Guangzhou First People’s Hospital, South China University of Technology, Guangzhou, 510623, People’s Republic of China; 5Department of Surgical Sciences, Anesthesiology and Intensive Care, Uppsala University, Uppsala, Sweden; 6Department of Medical Cell Biology, Unit for Integrative Physiology, Uppsala University, Uppsala, Sweden; 7Department of Physiology, School of Basic Medical Sciences, Zhejiang University School of Medicine, Hangzhou, 310058, People’s Republic of China
*These authors contributed equally to this work
Correspondence: Chun Tang; Xiaoping Liu, Email [email protected]; [email protected]
Purpose: Methyltransferase like 1 (METTL1) regulates epitranscriptomes via the m7G modification in mammalian mRNA and microRNA. Systemic lupus erythematosus (SLE) is caused by abnormal immune reactivity and has diverse clinical manifestations. RNA methylation as a mechanism to regulate gene expression is widely implicated in immune regulation. However, the role of m7G in immune response of SLE has not been extensively studied.
Patients and Methods: Expression of METTL1 was identified in the public dataset GSE122459 and validated in an independent cohort of SLE patients. We investigated the association between METTL1-expression and clinical manifestations of SLE. Subsequently, differentially expressed genes (DEG) that were correlated with METTL1-expression in GSE122459 were used for functional enrichment analysis. The correlation between infiltrating immune cells and METTL1, as well as candidate biomarkers identified to be correlated with either METTL1 or immune cell infiltration were assessed by single-sample GSEA. Potential mechanisms were explored with Gene ontology and KEGG pathway enrichment. Diagnostic performances of candidate biomarkers in SLE were analyzed.
Results: The mRNA and protein expression of METTL1 in SLE patients were significantly decreased in both datasets. METTL1-coexpressed DEGs were enriched in several key immune-related pathways. Activated CD8 T cells, activated CD4 T cells, memory B cells and type 2 helper T cells were different between patients with high and low METTL1 expression. Further, activated CD8 T-cells, activated CD4 T-cells, memory B-cells were correlated with METTL1. The genes of LAMP3, CD83, PDCD1LG2, IGKVD3D-20, IGKV5-2, IGKV2D-30, IGLV3-19 and IGLV4-60 were identified as candidate targets that were correlated with immune cell proportion. Moreover, LAMP3, CD83, and PDCD1LG2 expression were of diagnostic value in SLE as indicated by ROC analysis.
Conclusion: Our findings suggested that METTL1 and its candidate targets LAMP3, CD83, PDCD1LG2 may be used for diagnosing SLE and could be explored for developing targeted molecular therapy for SLE.
Keywords: methyltransferase like 1, systemic lupus erythematosus, immunity, single sample gene set enrichment analysis, biomarker
Introduction
Systemic lupus erythematosus (SLE) is caused by production of pathogenic autoantibodies and has diverse clinical manifestations caused by the abnormal immune responses.1,2 Studies have shown phenotypic and functional abnormalities of immune cells, including T cells and B cells, in SLE patients.3–6 Multiple subsets of T cells of SLE patients show impaired cytokine production and deficient immune capacity.7,8 Besides, SLE patients and lupus-prone mice display various B cell abnormalities including B cell lymphopenia and B cell hyperactivity.9 Increasing studies have shown that innate immunity deficiency is identified as important factors in the pathogenesis of SLE.10,11 Although researches on lupus have made rapid advances, the explicit pathogenesis remains elusive. Conventional treatments are often accompanied with unwanted side-effects like infection and kidney damage, which seriously impair the quality of life of SLE patients.12 Hence, the mechanism behind clinical presentation and symptoms of SLE needs to be further elucidated in order to developing targeted and individualized therapy.13
In the last decade, epigenetic mechanisms such as DNA methylation and histone modification have been identified during the development of SLE.14–16 Recently RNA methylation has been identified as a novel form of epigenetic regulation and reported to have effects in, for example, cancer and cardiovascular disease.17–19 Accumulating evidences show that RNA methylation is related to immune cell maturation and response, and its impacts on autoimmune disease is becoming apparent.20,21 RNA methylation is extensively distributed in multiple types of RNA, mainly comprising N7-methylguanosine (m7G),22 N6-methyladenosine (m6A),23 and 5-methylcytosine (m5C).24 Luo et al previously reported that multiple m6A-related enzymes including METTL14, ALKBH5 and YTHDF2 mRNA expression were decreased in PBMC of SLE patients,25 and this team also found that METTL3, METTL14, WTAP, FTO, ALKBH5 and YTHDF2 mRNA expression were decreased in PBMC of SLE patients, and ALKBH5 level was associated with anti-dsDNA, skin rash and ulcer, which can be a risk factor for SLE.26 Research also found that silencing of m5C demethyltransferase TET2 obviously inhibited Tfh cell polarization, which played a critical role in SLE.27 Methyltransferase like 1 (METTL1) is required to catalyze m7G, which is widely present in mRNA, tRNA, and rRNA.28 Recent studies have found that knockout of Mettl1 gene can induce defective self-renewal and neural differentiation of embryonic stem cells via disordered m7G tRNA modification.28 In addition, METTL1 has been shown to activate the let-7e miRNA/HMGA2 axis in a m7G-dependent manner.29 RNA methylation, like m6A and m5C, has been reported in SLE, but m7G has not been well characterized in SLE, and thus its function and mechanism need to be explored.
In this study, the METTL1 expression pattern of SLE was studied in a public dataset and an independent cohort of SLE patients. The relationship between METTL1 and immune cell infiltration in SLE was analyzed by single-sample Gene Set Enrichment Analysis (ssGSEA). Furthermore, a variety of promising METTL1-related immune molecules for the diagnosis of SLE were also investigated. Taken together, our study aims to understand the involvement of METTL1 in immune dysregulation during SLE.
Materials and Methods
Data Availability
The gene expression profiles were obtained from the Gene Expression Omnibus (GEO) public database (http://www.ncbi.nlm.nih.gov/geo/). GSE122459, consist of gene expression of peripheral blood mononuclear cells (PBMCs) from SLE patients and healthy controls (HC), and was used as the discovery dataset. In addition, the gene expression dataset GSE50772 was used for external validation.
SLE Patients and Clinical Information
Whole blood samples were obtained from 18 normal healthy controls and 45 eligible SLE patients, from the Seventh Affiliated Hospital of Sun Yat-sen University in Shenzhen, China. All cases met the SLE classification criteria of the American College of Rheumatology.30 Clinical information and laboratory examination data of SLE patients were collected and evaluated according to SLE Disease Activity Index (SLEDAI) scoring criteria.31 SLE patients with SLEDAI score ≥9 were considered to be active, while patients with SLEDAI score <9 were considered to be stable. This study was approved by the Ethics Committee of the Seventh Affiliated Hospital of Sun Yat-sen University and conducted in accordance with the Declaration of Helsinki. All patients and healthy volunteers signed informed consent. PBMCs were isolated from freshly heparinized blood samples using human peripheral blood lymphocyte separation medium (P8610, Solarbio, Beijing, China) according to the manufacturer’s instructions.
Identification of Immune-Related Differentially Expressed Genes (ImmuneDEGs)
METTL1-coexpressed genes by Pearson correlation test in GSE122459 were selected. The threshold points for METTL1-coexpressed genes were absolute r > 0.4 and P < 0.05. ImmPort database (https://www.immport.org) or previous research was utilized to identify the immune-related genes.32 DEGs overlapping with the METTL1-coexpressed genes and immune-related genes were defined as METTL1-coexpressed DEGs and immuneDEGs, respectively. Then, 8 immuneDEGs co-expressed with METTL1 were intersected, which were visualized by Venn diagram.
Gene Set Enrichment Analysis (GSEA)
In attempt to investigate the potential mechanism of METTL1 in SLE progression, GSEA between low and high METTL1 expression group was conducted. Molecular Signatures Database (MSigDB) KEGG gene set was selected as the reference file. The NES, NOM P-value and FDR were used to quantify the statistically significant enrichment.
Gene Functional Enrichment Analysis
The enrichment analysis of METTL1-coexpressed DEGs and ImmuneDEGs was conducted using Gene Ontology (GO) and Kyoto Encyclopedia of Genes and Genomes (KEGG) in the DAVID database (https://david.ncifcrf.gov/). GO enrichment analysis included biological process (BP), molecular function (MF), and cellular component (CC). An enrichment P value <0.05 was considered significant.
Immune Cells Infiltration Analysis
The ssGSEA was applied to analyze the abundance of immune cells in these patients. According to immune cell-specific marker genes, the enrichment score of the gene set represented the proportion of 28 types of infiltrating immune cells. The ssGSEA analysis was performed using the R package. The patients with METTL1 low- and high-expression groups were defined in the above dataset based on median METTL1 expression values. Subsequently, differential infiltration levels of immune cells were compared between the two groups.
Correlation Analysis Between METTL1 and Immune Cells
We further explored the association between METTL1 or the identified biomarkers and abundance of 28 immune cells. The correlation analyses were performed using Pearson coefficient and visualized in R software.
Evaluation of the Diagnostic Effectiveness of Biomarkers
The diagnostic values of the identified biomarker in patients with SLE were assessed using receiver operating characteristic curve (ROC) analysis by SSPA Statistics 25. The diagnostic accuracy of SLE versus HC was determined by the area under the ROC curve (AUC).
Western Blotting
For protein extraction, PBMCs were lysed by RIPA buffer. Protein lysates were quantified by the BCA method (23227, ThermoFisher Scientific, Vienna, Austria) and boiled with loading buffer. To detect the expression of METTL1, proteins were separated using SDS-PAGE and electrotransferred to PVDF membrane. After 1 h of blocking with 5% non-fat milk, membranes were followingly incubated with primary antibodies for anti-METTL1 (1:1000, PA5-80810, Invitrogen, Vienna, Austria) and anti-Vinculin (1:1000, 66305-1-Ig, Proteintech, Wuhan, China) at 4°C overnight. Post rinsing with TBST, the membranes were incubated with anti-rabbit IgG-HRP antibody (1:5000, SA00001-1, Proteintech, Wuhan, China) or anti-mouse IgG-HRP antibody (1:5000, SA00001-2, Proteintech, Wuhan, China) for 1 h at room temperature. Quantification was performed by measuring the intensity of the gels using ImageJ.
RNA Isolation and Real Time PCR
Total cellular RNA was extracted from PBMCs samples using TRIzol (108–95-2, Invitrogen) method. Complementary DNA (cDNA, 1 μg) was reverse transcribed from RNA using the PrimeScript RT reagent kit (RR047B, Takara, Beijing, China), and amplified in triplicate with TB Green Premix Ex Taq II (RR820B, Takara, Beijing, China) with specific primers by quantitative real-time PCR reactions. The primers used were as follows: METTL1 (Forward primer) 5’ AAACCCCGGACTGGGATCAT 3’; METTL1 (Reverse primer) 5’ CTGGCTTCACAGGGTAGCG 3’; GAPDH (Forward primer) 5’ AGAAGGCTGGGGCTCATTTG 3’; GAPDH (Reverse primer) 5’ AGGGGCCATCCACAGTCTTC 3’; The relative abundance of mRNA was standardized against the levels of GAPDH as the internal control.
Statistical Analysis
Continuous variable analysis was conducted using unpaired t-test, or Mann–Whitney test for non-parametric data; Clinical features between groups were compared by a chi-squared test of independence. Correlation was performed using Pearson correlation test. P-value <0.05 was considered statistically significant. The statistical analyses were performed using R version 4.1.2, GraphPad Prism 7.0 and SPSS version 25.0 software.
Results
METTL1 Was Downregulated in SLE PBMCs
We conducted the study according to the following flow diagram (Figure 1). Using GSE122459 dataset, we found that the METTL1 mRNA expression was statistically downregulated in SLE compared with healthy controls (Figure 2A). To explore whether METTL1 plays a key role in SLE, we examined METTL1 expression in an independent SLE cohort, including a total of 45 SLE patients and 18 HC for further validation. Similarly, we revealed the mRNA level of METTL1 in PBMCs of SLE patients was remarkably lower than that of HC in the validation cohort. We classified the patients into SLE patients with active disease (n = 20; SLEDAI score: 18.60 ± 2.63) and SLE patients in stable period (n = 25; SLEDAI score: 3.44 ± 0.65) using the SLEDAI score.
 |
Figure 1 Overall design and workflow of the study. Flow diagram for the analysis procedure used to explore the underlying role of METTL1 for this research. Abbreviation: METTL1, Methyltransferase like 1. |
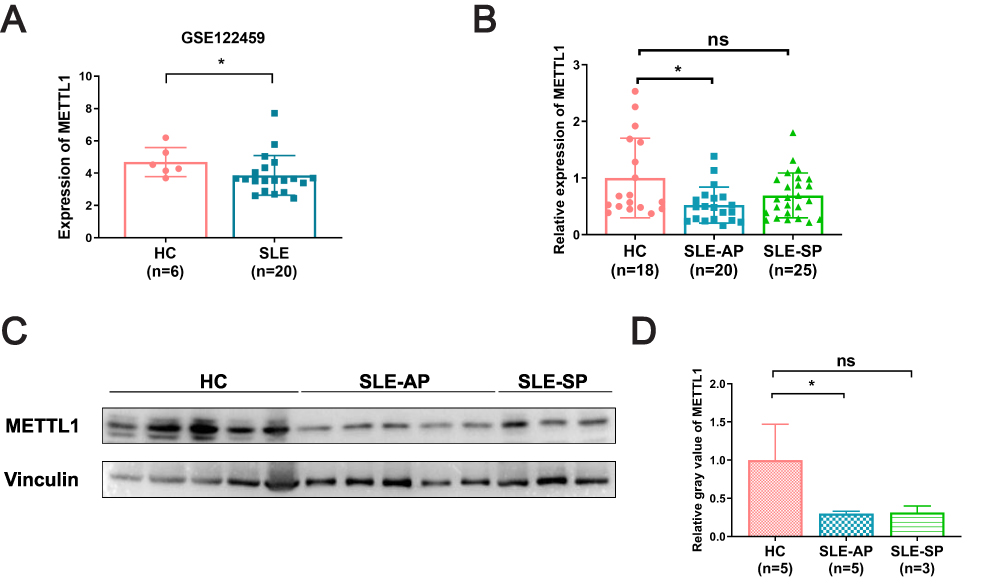 |
Figure 2 METTL1 was downregulated in SLE patient. (A) METTL1 mRNA expression between SLE (n=20) and HC (n=6) in GSE122459; (B) RT-qPCR for METTL1 mRNA expression in HC (n=18), SLE-AP (n=20) and SLE-SP (n=25); (C)Western blotting for METTL1 protein expression in HC (n=5) and SLE patients (n=8); (D) Quantitative analysis of METTL1 protein levels in HC (n=5), SLE-AP (n=5) and SLE-SP (n=3). Student’s unpaired two-tailed t test or Mann–Whitney test. Data are means ± SEM. *P < 0.05. Abbreviations: METTL1, Methyltransferase like 1; SLE, Systemic lupus erythematosus; HC, Healthy controls; SLE-AP, SLE patients in active period; SLE-SP, SLE patients in stable period. |
Notably, we found that the mRNA expression of METTL1, among patients with active disease but not in stable period, were remarkably decreased compared to that in HC group (Figure 2B). Our data showed accordant change of METTL1 protein level by Western blotting (Figure 2C and D). In short, these results demonstrated that SLE patients exhibited a distinct expression of METTL1 as compared to healthy individuals.
METTL1 Was Correlated with B Cells and Suppressor T Cells in SLE
To explore the relationship between the expression of METTL1 and clinical features in SLE patients, we classified the samples into high and low METTL1 expression groups using the median METTL1 mRNA value. The clinicopathological characteristics of our cohort were selected and analyzed (Additional file 1: Table S1). However, there were no differences between SLE patients with high and low METTL1-level group after using Bonferroni to correct the p-values (Table 1). Notably, METTL1 was positively correlated with peripheral blood B cells, while negatively correlated with suppressor T cells in SLE (Figure 3A-L). These data suggested that the deficiency of METTL1 had the potential to participate in the progression of SLE.
 |
Table 1 Comparison of Clinical Characteristics Between SLE Patients with METTL1 Low and High Expression |
 |
Figure 3 Relationship between downregulation of METTL1 and clinical features in SLE. Correlation between METTL1 expression and age (A), C3 (B), C4 (C), IgM (D), IgA (E), IgG (F) (n=45), peripheral T lymphocyte (G), T helper cell (H), suppressor T cell (I), B lymphocyte (J) (n=12), NK cell (K) (n=10), and CD4/+CD8+ (L) (n=14). Pearson correlation test. Abbreviations: METTL1, Methyltransferase like 1; SLE, Systemic lupus erythematosus. |
METTL1 Was Enriched in Aberrant Immune Pathways in SLE
To gain insight into the biological processes of METTL1 in SLE, the GSEA analysis was used to predict the underlying signaling pathways of METTL1. The results showed that METTL1 expression was negatively correlated with Notch-signaling pathway, Fcγ-R-mediated phagocytosis, MAPK pathway and toll-like receptor signaling pathway, arousing our interest in the molecular network about METTL1 in SLE (Figure 4A and B).
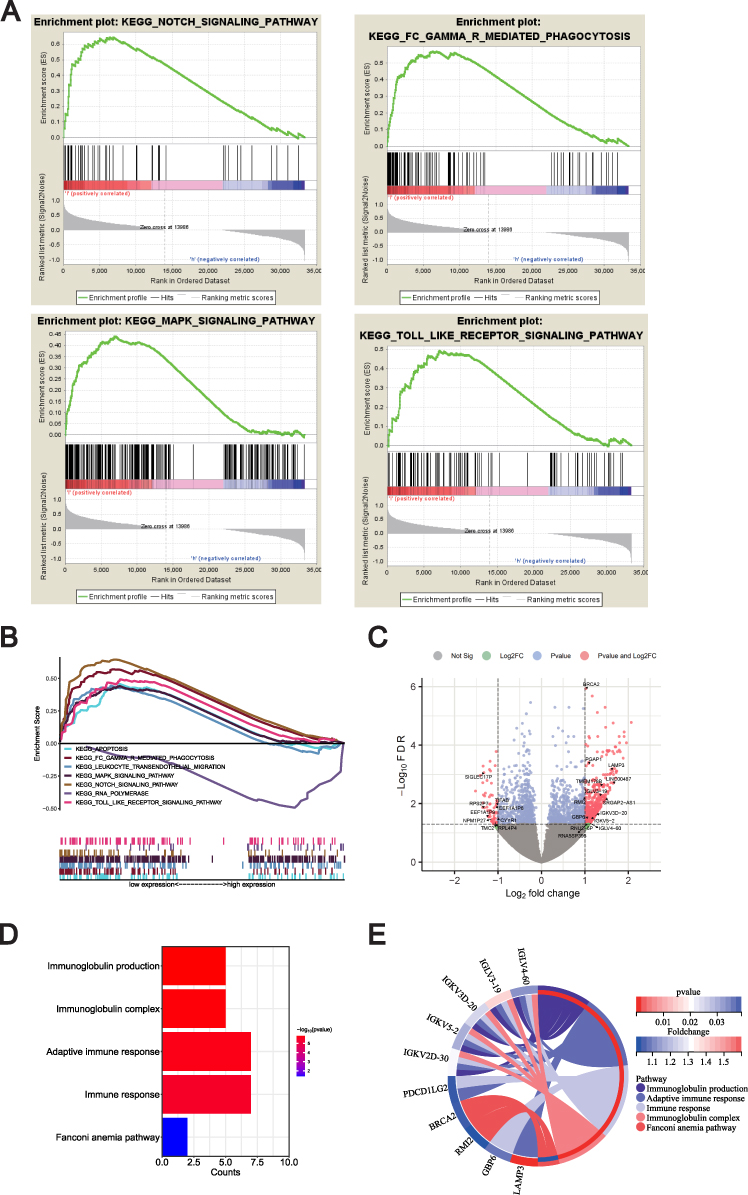 |
Figure 4 Exploration of METTL1-related function enrichment analysis. (A) GSEA enriched pathways in low METTL1 expression group; (B) Multiple GSEA enriched pathways in low METTL1 expression group; Volcano plot (C) for 35 METTL1-coexpressed DEGs; Bubble pot (D) and Circos plot (E) for the enrichment of METTL1-coexpressed DEGs. Abbreviations: METTL1, Methyltransferase like 1; SLE, Systemic lupus erythematosus; GSEA, Gene Set Enrichment Analysis; METTL1-coexpressed, DEGs METTL1-coexpressed differentially expressed genes. |
Furthermore, we identified 5515 METTL1-coexpressed genes in the discovery dataset, including 3937 positively and 1578 negatively correlated co-expressed genes. Out of these, we defined 448 up-regulated and 60 down-regulated genes in SLE as DEGs, and obtained 35 METTL1-coexpressed DEGs (Figure 4C, additional file 2: Table S2). To explore enriched GO and KEGG pathways among the METTL1-coexpressed DEGs, we used DAVID Bioinformatics Resources and revealed that various immune-related biological pathways were significantly associated with METTL1-coexpressed DEGs. Our analysis showed that the enriched pathways mainly included immunoglobulin production, immunoglobulin complex, adaptive immune response, immune response and Fanconi anemia pathway (Figure 4D and E). Overall, our findings indicated that the function of METTL1 was closely related to the aberrant immune pathways known to be important in SLE.
METTL1 Was Related to Immune Cell Infiltrates
Inspired by the pathway enrichment analysis results, we analyzed the infiltration of 28 immune cell subpopulations by ssGSEA in GSE122459 dataset and determined the fraction of 28 kinds of immune cells in each sample (Additional file 3: Table S3). We found 4 types of immune cells were significantly different between low and high METTL1 expression groups, presented in the violin diagram (Figure 5A). The results indicated that central memory CD4 T cells, activated CD8 T cells and monocytes were the main infiltrating immune cells. Then we evaluated the correlation of 28 types of immune cells in SLE PBMCs. Data were shown that activated CD8 T cells were positively correlated with activated CD4 T cells, central memory CD4 T cells and memory B cells, while negatively related to monocytes (Figure 5B). These results revealed a distinct spectrum of immune cell levels among low and high METTL1 expression group in SLE patients.
 |
Figure 5 Correlation on of METTL1 with Immune cell infiltrates in SLE.Violin plot (A) for abundance of 28 infiltrating immune cell types in low and high METTL1 expression group; (B) Correlation analysis between METTL1 and infiltrating immune cells; (C) Correlation between METTL1 and activated CD4 T cell, activated CD8 T cell and memory B cell. Mann–Whitney test and Pearson correlation test. Abbreviations: METTL1, Methyltransferase like 1; SLE, Systemic lupus erythematosus. |
Additionally, we further examined the correlations between METTL1 expression and immune cells using the GSE122459 dataset (Figure 5B, additional file 4: Table S4). Our analysis indicated that METTL1 was positively correlated with central memory CD4 T cell, activated CD8 T cell, immature B cell, activated B cell, activated CD4 T cell and memory B cells, while negatively correlated with T follicular helper cell, regulatory T cell, monocyte, gamma delta T cell, and macrophage (Figure 5B and C). These results suggested that METTL1 might affect the dysregulation of immune cells in SLE.
Intersection and Validation of ImmuneDEGs Co-Expressed with METTL1
SLE is characterized by aberrant immune response and release of inflammatory mediators. To determine ImmuneDEGs in SLE, we compared DEGs with the immune-related genes and identified 66 ImmuneDEGs (Additional file S5: Table S5). By analyzing the GO functions of these ImmuneDEGs, we observed that they were mainly enriched in the immunoglobulin production and immune response (Figure 6A and B). Also, KEGG analysis revealed that IL-17 signaling pathway, chemokine signaling pathway and cytokine–cytokine receptor interaction pathways were significantly enriched (Figure 6C and D).
 |
Figure 6 Intersection and validation of ImmuneDEGs co-expressed with METTL1. Bubble plot (A) and circos plot (B) for the GO enrichment analysis of ImmuneDEGs; Bubble plot (C) and circos plot (D) for the KEGG enrichment of ImmuneDEGs; Venn diagram (E) of 8 candidate genes overlapping ImmunDEGs and METTL1-coexpressed genes; Volcano plot (F) and Heatmap (G) and for 8 candidate genes between SLE and HC; Violin plot (H) for the expression of LAMP3, CD83 and PDCDILG2 in GSE50772 dataset for validation. Mann–Whitney test. Data are means ± SEM. *P < 0.05, ***P < 0.001. Abbreviations: ImmuneDEGs, Immune-related differentially expressed genes; METTL1, Methyltransferase like 1; SLE, Systemic lupus erythematosus; GO, Gene Ontology; BP Biological process; MF, Molecular function; CC, Cellular component; KEGG, Kyoto Encyclopedia of Genes and Genomes; M-co, DEGs METTL1-coexpressed differentially expressed genes. HC, Healthy controls; LAMP3, Lysosomal associated membrane protein 3; CD83, CD83 molecule; PDCD1LG2, Programmed cell death 1 ligand 2. |
To further explore the possible immune targets of METTL1 in SLE, we screened 8 ImmuneDEGs that simultaneously co-expressed with METTL1 via venn diagram, including lysosomal associated membrane protein 3 (LAMP3), CD83 molecule (CD83), programmed cell death 1 ligand 2 (PDCD1LG2), IGKVD3D-20, IGKV5-2, IGKV2D-30, IGLV3-19) and IGLV4-60 (Figure 6E). And we visualized the final candidate biomarkers by the volcano map (Figure 6F) and heatmap (Figure 6G). Afterwards, we verified the expression trend of LAMP3, CD83 and PDCD1LG2, which agreed with that in GSE50772 (Figure 6H). These results suggested that these candidate genes might be downstream targets of METTL1 and involved in abnormal immune response of SLE.
METTL1-Coexpressed ImmunDEGs Correlated with Infiltrating Immune Cells
Subsequently, we analyzed the correlation of LAMP3, CD83, PDCD1LG2, IGKVD3D-20, IGKV5-2, IGKV2D-30, IGLV3-19 and IGLV4-60 with various immune cell types in SLE using the GSE122459 dataset (Additional file 6: Table S6). We found that LAMP3 was significantly correlated with activated CD8 T cell and activated CD4 T cell (Figure 7A); CD83 was remarkably correlated with activated CD8 T cell (Figure 7B); PDCD1LG2 was not correlated with activated CD8 T cell, activated CD4 T cell or memory B cell (Figure 7C). IGLV3-19, IGKV5-2 and IGKV4-60 was greatly positively correlated with activated CD8 T cell, activated CD4 T cell and memory B cell, respectively (Figure 7D-F); IGKVD3D-20 was evidently positively correlated with activated CD4 T cell and memory B cell (Figure 7G); IGKVD2D-30 was remarkably positively correlated with activated CD4 T cell (Figure 7H). To our interest, these genes were mostly related to the activated CD8 T cell, activated CD4 T cell and memory B cells, which were distinctly expressed among low and high METTL1 groups. In brief, METTL1 and these co-expressed ImmuneDEGs may collectively participate in the immune pathogenesis of SLE by regulating the immune cells.
 |
Figure 7 Correlation between METTL1-coexpressed ImmuneDEGs and differential expressed immune cells. Correlation between LAMP3 (A), CD83 (B), PDCD1LG2 (C), IGKV5-2 (D), IGKV3D-20 (E), IGLV4-60 (F), IGLV3-19 (G), IGKV2D-30 (H) and infiltrating immune cells. Pearson correlation test. Abbreviations: METTL1, Methyltransferase like 1; ImmuneDEGs, Immune-related differentially expressed genes; LAMP3, Lysosomal associated membrane protein 3; CD83, CD83 molecule; PDCD1LG2, Programmed cell death 1 ligand 2. |
METTL1 and Coexpressed ImmunDEGs Had Favorable Diagnostic Values in Both Discovery and Validated Cohorts
To evaluate the diagnostic performance of METTL1, LAMP3, CD83, PDCD1LG2, IGKVD3D-20, IGKV5-2, IGKV2D-30, IGLV3-19 and IGLV4-60 in SLE, we performed ROC analysis using GSE122459 dataset. The results showed that the AUC values of METTL1, LAMP3, CD83 and PDCD1LG2 in SLE were respectively 0.800, 0.900, 0.883 and 0.825, with the combined AUC of LAMP3, CD83 and PDCD1LG2 reaching 0.975 (Figure 8A and B). The AUC values of IGKVD3D-20, IGKV5-2, IGKV2D-30, IGLV3-19 and IGLV4-60 in SLE were respectively 0.850,0.783, 0.858, 0.858 and 0.740, with the combined AUC of IGKVD3D-20, IGKV5-2, IGKV2D-30, IGLV3-19 and IGLV4-60 reaching 0.925 (Figure 8C). The above data indicated that these candidate biomarkers had high accuracy in classifying SLE patients. Afterwards, we employed our SLE cohort and GSE50772 dataset to validate the results. The AUC values of METTL1 in our SLE cohort were 0.655 (Figure 8D). We also revealed that the diagnostic ability of the three genes was consistent with the results from the GSE122459 dataset, among which the diagnostic power of LAMP3 was better than that of CD83, and PDCD1LG2 (AUC of LAMP3, CD83, PDCD1LG2 and the three combined: 0.795, 0.670, 0.657 and 0.832) (Figure 8E). These results indicate that the candidate genes have favorable diagnostic performance for SLE.
 |
Figure 8 Diagnostic values of METTL1-coexpressed ImmuneDEGs in both discovery and validated cohorts. (A) ROC analysis for METTL1 in GSE122459; (B) ROC analysis for LAMP3, CD83, and PDCD1LG2 in GSE122459; (C) ROC analysis for IGKV5-2, IGKV3D-20, IGLV4-60, IGLV3-19, and IGKV2D-30 in GSE122459; (D) ROC analysis for METTL1 in our SLE cohort; (E) ROC analysis for LAMP3, CD83, and PDCD1LG2 in GSE50772. Abbreviations: METTL1, Methyltransferase like 1; ImmuneDEGs, Immune-related differentially expressed genes; LAMP3, Lysosomal associated membrane protein 3; CD83, CD83 molecule; PDCD1LG2, Programmed cell death 1 ligand 2; ROC, Receiver operating characteristic curve. |
Discussion
The main result of the present study was that METTL1 was down regulated in SLE and that putative target genes are associated with immune cell activation consistent with the SLE phenotype. Epigenetic regulation, such as DNA methylation and histone modification, has been found to affect the development and function of the immune system by regulating gene expression, thus participating in the occurrence of autoimmune diseases. Increasing recent evidence suggests that RNA methylation plays an important role in the pathogenesis of SLE.33 Several studies have shown that m6A modification levels were dysregulated in SLE patients and closely related to the regulation of lncRNA expression.34 In addition, multiple m6A-associated enzymes, including METTL3, METTL14, WTAP, FTO, ALKBH5 and YTHDF2, as well as m5C methyltransferase NSUN2, were dysregulated in SLE patients.25,26,35 Recent studies revealed that METTL1 may regulate epitranscriptomes via the m7G modification in the 3′UTR of mammalian mRNA and microRNA.36 METTL1-mediated m7G is known for diverse processes of RNA metabolism, such as the regulation of mRNA transcription, microRNA (miRNA) biosynthesis, and tRNA stability.37,38 Although METTL1 has been reported to drive the progression of various diseases, there are no studies addressing its role in autoimmune disorders, such as SLE. Our study found that METTL1 expression was both transcriptionally and translationally downregulated in SLE patients. Previous studies have found that the expression of m6A- and m5C-related proteins in SLE patients was dysregulated. Our study further confirmed that m7G methyltransferase METTL1 was also dysregulated in SLE patients, which indicated m7G may be involved in the development of SLE.
In addition, recent studies have found that liver-specific overexpression or knockdown of Mettl1 distinctly influenced the accumulation of polymorphonuclear-myeloid-derived suppressor cells, which consequently affected the infiltration of CD8+T cells.39 METTL1 also exhibited a significant association with tumor immune microenvironment infiltration and various immune modulators.40 However, studies on the role of METTL1 in the immune system and autoimmune diseases are still limited. Our study found that abnormal expression of METTL1 in SLE was closely related to the abundance of multiple immune cells. METTL1 level was related to peripheral blood B cells and suppressor T cells. To explore its potential function in SLE, we employed GSEA analysis. The data demonstrated that genes were more likely to be enriched in Notch signaling pathway, Fcγ-R-mediated phagocytosis, MAPK pathway and toll-like receptor signaling pathway in SLE cohorts with low METTL1 expression. All these pathways were reported to be involved in SLE by regulating immune cells or inflammatory cytokines.41–44 The GO and KEGG analysis indicated that METTL1-coexpressed DEGs were enriched in immune-related pathways enrichment. To sum up, these results suggested that METTL1 may play a key role in SLE immunity.
The aberrant subpopulations and function of T and B lymphocytes have been identified as critical factors in the pathophysiology of SLE. The effects of RNA methylation on the immune system have been extensively explored, including differentiation and maturation of T cells,45,46 early B cell development,47 and macrophage activation.48 By analyzing ssGSEA data, we revealed an immune infiltration in SLE, and found that the fraction of activated CD8 T cells, activated CD4 T cells, Type 2 T helper cells and memory B immune cells were remarkably varied among groups with low and high expression of METTL1. Besides, we explored the relationship between METTL1 and immune cells infiltration for the possible immune-related value of METTL1. The results revealed the marked positive correlativity between METTL1 and activated CD8 T cell, activated CD4 T cell, memory B cells. There has been reported that CD4+ and CD8+ T cells in SLE were abnormally activated on account of aberrant T cell signaling pathways, thus leading to inflammatory responses, help to B cells, and autoimmunity.8 It has been found that increased CD28-deficient CD8+ T cells and switched memory B cells were correlated with disease activity of SLE patients.49,50 Therefore, we supposed that METTL1 could influence the immunity of SLE by regulating these aberrant immune cells.
Considering the essential role of abnormal immune system in the pathophysiology of SLE, the dysregulated immune-related genes are promising targets for modulating its progression. We identified eight DEGs: LAMP3, CD83, PDCD1LG2, IGKVD3D-20, IGKV5-2, IGKV2D-30, IGLV3-19 and IGLV4-60 that overlapped with both the METTL1-coexpressed DEGs and ImmuneDEGs. Our analysis showed that LAMP3 was significantly positively correlated with activated CD8 T cell and activated CD4 T cell; CD83 was remarkably positively correlated with activated CD8 T cell; IGLV3-19, IGKV5-2 and IGKV4-60 was greatly positively correlated with activated CD8 T cell, activated CD4 T cell and memory B cell, respectively; IGKVD2D-30 was remarkably positively correlated with activated CD4 T cell; IGKVD3D-20 was greatly positively correlated with activated CD4 T cell and memory B cell. Previous research reported that LAMP3+ dendritic cells can affect depleted CD8+T cells through PDL1-PD1 and CD200-CD200R signaling.51 The abundance of LAMP3+ dendritic cells in tumors may be positively correlated with the infiltration levels of functionally depleted CD8+ T cells and CD4+ regulatory T cells.52 In addition, the downregulation of CD83 on dendritic cells was revealed to decrease capacity in the priming of functional tumor antigen-specific CD8+ T cells.53 Moreover, variable (IGKV and IGLV) genes encoded immunoglobulin kappa (IGK) and immunoglobulin lambda (IGL) light chain, which were both B cell receptor components closely related to BCR signaling pathways.54 From all above, these data indicated METTL1 and its candidate genes could be conjointly involved in the activation of immune response by affecting various immune cells.
For ROC curve analysis, we found that LAMP3, CD83, and PDCD1LG2 were of diagnostic values in SLE, and the diagnostic value of LAMP3 was much higher than CD83 and PDCD1LG2. While the diagnostic performances of LAMP3, CD83 and PDCD1LG2 have been described in various cancers,55–57 their diagnostic values in SLE have not been reported previously. Our findings provided additional candidate diagnostic biomarkers for SLE. However, considering the limitation of clinical samples of patients, the expression levels, and diagnostic performance of LAMP3, CD83, and PDCD1LG2 in SLE require independent validation.
Conclusion
In summary, the present study suggested that reduced expression of m7G methyltransferase METTL1 was related to peripheral blood B cells and suppressor T cells in SLE. We identified that METLL1 and its co-expressed ImmuneDEGs LAMP3, CD83, and PDCD1LG2 had strong correlations with immune cell abundance. Moreover, we demonstrated that LAMP3, CD83, and PDCD1LG2 were promising diagnostic biomarkers for SLE. The data in this study provide new insights for key proteins in RNA methylation and novel diagnostic biomarkers in SLE with potential mechanistic roles in SLE development that can inform future research.
Abbreviations
SLE, Systemic lupus erythematosus; m7G, N7-methylguanosine; m6A, N6-methyladenosine; m5C, 5-methylcytosine; METTL1, Methyltransferase like 1; WDR4, WD repeat domain 4; ssGSEA, Single-sample gene set enrichment analysis; GEO, Gene Expression Omnibus; PBMCs, Peripheral blood mononuclear cells; HC, Healthy controls; DEGs, Differentially expressed genes; SLEDAI, SLE Disease Activity Index; ImmuneDEGs, Immune-related differentially expressed genes; GSEA, Gene Set Enrichment Analysis; GO, Gene Ontology; BP, Biological process; MF, Molecular function; CC, Cellular component; KEGG, Kyoto Encyclopedia of Genes and Genomes; ROC, Receiver-operating characteristic curve; AUC, Area under the ROC curve; LAMP3, Lysosomal associated membrane protein 3; CD83, CD83 molecule; PDCD1LG2, Programmed cell death 1 ligand 2.
Data Sharing Statement
The datasets supporting the conclusions of this study are available in the Gene Expression Omnibus (GEO) datasets (http://www.ncbi.nlm.nih.gov/geo/) and its additional files.
Study Approval
This study was approved by the Research and Experimental Animal Ethics Committee of the Seventh Affiliated Hospital of Sun Yat-sen University (Certificate Number: 2019SYSUSH-037) and conducted in accordance with the Declaration of Helsinki.
Acknowledgments
We thank the GEO for providing available data for SLE.
Author Contributions
All authors made a significant contribution to the work reported, whether that is in the conception, study design, execution, acquisition of data, analysis and interpretation, or in all these areas; took part in drafting, revising or critically reviewing the article; gave final approval of the version to be published; have agreed on the journal to which the article has been submitted; and agree to be accountable for all aspects of the work.
Funding
The research was supported by Shenzhen Municipal Science and Technology Innovation Commission (JCYJ20210324123414040), and Guangdong Basic and Applied Basic Research Foundation (2019A1515110488 and 2020A1515110306).
Disclosure
The authors report no conflicts of interest in this work.
References
1. Frieri M. Mechanisms of disease for the clinician: systemic lupus erythematosus. Ann Allergy Asthma Immunol. 2013;110(4):228–232. doi:10.1016/j.anai.2012.12.010
2. D’Cruz DP, Khamashta MA, Hughes GR. Systemic lupus erythematosus. Lancet. 2007;369(9561):587–596.
3. Tsokos GC. Systemic lupus erythematosus. N Engl J Med. 2011;365(22):2110–2121.
4. Luo Q, Huang Z, Ye J, et al. PD-L1-expressing neutrophils as a novel indicator to assess disease activity and severity of systemic lupus erythematosus. Arthritis Res Ther. 2016;18:47.
5. Jenks SA. Altered B cell receptor signaling in human systemic lupus erythematosus. Autoimmun Rev. 2009;8(3):209–213.
6. Crispin JC, Kyttaris VC, Terhorst C, Tsokos GC. T cells as therapeutic targets in SLE. Nat Rev Rheumatol. 2010;6(6):317–325.
7. Gravano DM, Hoyer KK. Promotion and prevention of autoimmune disease by CD8+ T cells. J Autoimmun. 2013;45:68–79.
8. Moulton VR, Tsokos GC. T cell signaling abnormalities contribute to aberrant immune cell function and autoimmunity. J Clin Invest. 2015;125(6):2220–2227.
9. Moulton VR, Suarez-Fueyo A, Meidan E, Li H, Mizui M, Tsokos GC. Pathogenesis of Human Systemic Lupus Erythematosus: a Cellular Perspective. Trends Mol Med. 2017;23(7):615–635.
10. Manderson AP, Botto M, Walport MJ. The role of complement in the development of systemic lupus erythematosus. Annu Rev Immunol. 2004;22:431–456.
11. Kono DH, Baccala R, Theofilopoulos AN. TLRs and interferons: a central paradigm in autoimmunity. Curr Opin Immunol. 2013;25(6):720–727.
12. Basta F, Fasola F, Triantafyllias K, Schwarting A. Systemic Lupus Erythematosus (SLE) Therapy: the Old and the New. Rheumatol Ther. 2020;7(3):433–446.
13. La Paglia GMC, Leone MC, Lepri G, et al. One year in review 2017: systemic lupus erythematosus. Clin Exp Rheumatol. 2017;35(4):551–561.
14. Zhu H, Mi W, Luo H, et al. Whole-genome transcription and DNA methylation analysis of peripheral blood mononuclear cells identified aberrant gene regulation pathways in systemic lupus erythematosus. Arthritis Res Ther. 2016;18:162.
15. Coit P, Yalavarthi S, Ognenovski M, et al. Epigenome profiling reveals significant DNA demethylation of interferon signature genes in lupus neutrophils. J Autoimmun. 2015;58:59–66.
16. Zhao M, Wu X, Zhang Q, et al. RFX1 regulates CD70 and CD11a expression in lupus T cells by recruiting the histone methyltransferase SUV39H1. Arthritis Res Ther. 2010;12(6):R227.
17. Yao L, Yin H, Hong M, et al. RNA methylation in hematological malignancies and its interactions with other epigenetic modifications. Leukemia. 2021;35(5):1243–1257.
18. Wu S, Zhang S, Wu X, Zhou X. m(6)A RNA Methylation in Cardiovascular Diseases. Mol Ther. 2020;28(10):2111–2119.
19. Jung G, Hernandez-Illan E, Moreira L, Balaguer F, Goel A. Epigenetics of colorectal cancer: biomarker and therapeutic potential. Nat Rev Gastroenterol Hepatol. 2020;17(2):111–130.
20. Dong L, Cao Y, Hou Y, Liu G. N(6) -methyladenosine RNA methylation: a novel regulator of the development and function of immune cells. J Cell Physiol. 2022;237(1):329–345.
21. Zhou W, Wang X, Chang J, Cheng C, Miao C. The molecular structure and biological functions of RNA methylation, with special emphasis on the roles of RNA methylation in autoimmune diseases. Crit Rev Clin Lab Sci. 2021;1–16.
22. Malbec L, Zhang T, Chen YS, et al. Dynamic methylome of internal mRNA N(7)-methylguanosine and its regulatory role in translation. Cell Res. 2019;29(11):927–941.
23. Dominissini D, Moshitch-Moshkovitz S, Schwartz S, et al. Topology of the human and mouse m6A RNA methylomes revealed by m6A-seq. Nature. 2012;485(7397):201–206.
24. Trixl L, Lusser A. The dynamic RNA modification 5-methylcytosine and its emerging role as an epitranscriptomic mark. Wiley Interdiscip Rev RNA. 2019;10(1):e1510.
25. Luo Q, Rao J, Zhang L, et al. The study of METTL14, ALKBH5, and YTHDF2 in peripheral blood mononuclear cells from systemic lupus erythematosus. Mol Genet Genomic Med. 2020;8(9):e1298.
26. Luo Q, Fu B, Zhang L, Guo Y, Huang Z, Li J. Decreased Peripheral Blood ALKBH5 Correlates with Markers of Autoimmune Response in Systemic Lupus Erythematosus. Dis Markers. 2020;2020:8193895.
27. Wu H, Huang X, Qiu H, et al. High salt promotes autoimmunity by TET2-induced DNA demethylation and driving the differentiation of Tfh cells. Sci Rep. 2016;6:28065.
28. Lin S, Liu Q, Lelyveld VS, Choe J, Szostak JW, Gregory RI. Mettl1/Wdr4-Mediated m(7)G tRNA Methylome Is Required for Normal mRNA Translation and Embryonic Stem Cell Self-Renewal and Differentiation. Mol Cell. 2018;71(2):244–255 e245.
29. Pandolfini L, Barbieri I, Bannister AJ, et al. METTL1 Promotes let-7 MicroRNA Processing via m7G Methylation. Mol Cell. 2019;74(6):1278–1290 e1279.
30. Hochberg MC. Updating the American College of Rheumatology revised criteria for the classification of systemic lupus erythematosus. Arthritis Rheum. 1997;40(9):1725.
31. Bombardier C, Gladman DD, Urowitz MB, Caron D, Chang CH. Derivation of the SLEDAI. A disease activity index for lupus patients. The Committee on Prognosis Studies in SLE. Arthritis Rheum. 1992;35(6):630–640.
32. Bindea G, Mlecnik B, Tosolini M, et al. Spatiotemporal dynamics of intratumoral immune cells reveal the immune landscape in human cancer. Immunity. 2013;39(4):782–795.
33. Lv X, Liu X, Zhao M, et al. RNA Methylation in Systemic Lupus Erythematosus. Front Cell Dev Biol. 2021;9:696559.
34. Wu J, Deng LJ, Xia YR, et al. Involvement of N6-methyladenosine modifications of long noncoding RNAs in systemic lupus erythematosus. Mol Immunol. 2022;143:77–84.
35. Guo G, Wang H, Shi X, et al. Disease Activity-Associated Alteration of mRNA m(5) C Methylation in CD4(+) T Cells of Systemic Lupus Erythematosus. Front Cell Dev Biol. 2020;8:430.
36. Devarkar SC, Wang C, Miller MT, et al. Structural basis for m7G recognition and 2’-O-methyl discrimination in capped RNAs by the innate immune receptor RIG-I. Proc Natl Acad Sci U S A. 2016;113(3):596–601.
37. Tomikawa C. 7-Methylguanosine Modifications in Transfer RNA (tRNA). Int J Mol Sci. 2018;19(12):57.
38. Chen W, Feng P, Song X, Lv H, Lin H. iRNA-m7G: identifying N(7)-methylguanosine Sites by Fusing Multiple Features. Mol Ther Nucleic Acids. 2019;18:269–274.
39. Zeng X, Liao G, Li S, et al. Eliminating METTL1-mediated accumulation of PMN-MDSCs prevents hepatocellular carcinoma recurrence after radiofrequency ablation. Hepatology. 2022.
40. Gao Z, Xu J, Zhang Z, et al. A Comprehensive Analysis of METTL1 to Immunity and Stemness in Pan-Cancer. Front Immunol. 2022;13:795240.
41. Salmon JE, Kimberly RP, Gibofsky A, Fotino M. Defective mononuclear phagocyte function in systemic lupus erythematosus: dissociation of Fc receptor-ligand binding and internalization. J Immunol. 1984;133(5):2525–2531.
42. Jenks SA, Cashman KS, Zumaquero E, et al. Distinct Effector B Cells Induced by Unregulated Toll-like Receptor 7 Contribute to Pathogenic Responses in Systemic Lupus Erythematosus. Immunity. 2018;49(4):725–739 e726.
43. Breitkopf DM, Jankowski V, Ohl K. The YB-1:Notch-3 axis modulates immune cell responses and organ damage in systemic lupus erythematosus. Kidney Int. 2020;97(2):289–303.
44. Xiao ZX, Hu X, Zhang X, et al. High salt diet accelerates the progression of murine lupus through dendritic cells via the p38 MAPK and STAT1 signaling pathways. Signal Transduct Target Ther. 2020;5(1):34.
45. Li HB, Tong J, Zhu S, et al. m(6)A mRNA methylation controls T cell homeostasis by targeting the IL-7/STAT5/SOCS pathways. Nature. 2017;548(7667):338–342.
46. Yao Y, Yang Y, Guo W, et al. METTL3-dependent m(6)A modification programs T follicular helper cell differentiation. Nat Commun. 2021;12(1):1333.
47. Zheng Z, Zhang L, Cui XL, et al. Control of Early B Cell Development by the RNA N(6)-Methyladenosine Methylation. Cell Rep. 2020;31(13):107819.
48. Du J, Liao W, Liu W, et al. N(6)-Adenosine Methylation of Socs1 mRNA Is Required to Sustain the Negative Feedback Control of Macrophage Activation. Dev Cell. 2020;55(6):737–753 e737.
49. Wei C, Anolik J, Cappione A, et al. A new population of cells lacking expression of CD27 represents a notable component of the B cell memory compartment in systemic lupus erythematosus. J Immunol. 2007;178(10):6624–6633.
50. Zabinska M, Krajewska M, Koscielska-Kasprzak K, Klinger M. CD3(+)CD8(+)CD28(-) T Lymphocytes in Patients with Lupus Nephritis. J Immunol Res. 2016;2016:1058165.
51. Liu Y, He S, Wang XL, et al. Tumour heterogeneity and intercellular networks of nasopharyngeal carcinoma at single cell resolution. Nat Commun. 2021;12(1):741.
52. Zhang Q, He Y, Luo N, et al. Landscape and Dynamics of Single Immune Cells in Hepatocellular Carcinoma. Cell. 2019;179(4):829–845 e820.
53. Aerts-Toegaert C, Heirman C, Tuyaerts S, et al. CD83 expression on dendritic cells and T cells: correlation with effective immune responses. Eur J Immunol. 2007;37(3):686–695.
54. Jackson KJ, Kidd MJ, Wang Y, Collins AM. The shape of the lymphocyte receptor repertoire: lessons from the B cell receptor. Front Immunol. 2013;4:263.
55. Nagelkerke A, Mujcic H, Bussink J, et al. Hypoxic regulation and prognostic value of LAMP3 expression in breast cancer. Cancer. 2011;117(16):3670–3681.
56. Li Z, Ju X, Lee K, et al. CD83 is a new potential biomarker and therapeutic target for Hodgkin lymphoma. Haematologica. 2018;103(4):655–665.
57. Chen C, Liang C, Wang S, et al. Expression patterns of immune checkpoints in acute myeloid leukemia. J Hematol Oncol. 2020;13(1):28.
 © 2023 The Author(s). This work is published and licensed by Dove Medical Press Limited. The
full terms of this license are available at https://www.dovepress.com/terms
and incorporate the Creative Commons Attribution
- Non Commercial (unported, 3.0) License.
By accessing the work you hereby accept the Terms. Non-commercial uses of the work are permitted
without any further permission from Dove Medical Press Limited, provided the work is properly
attributed. For permission for commercial use of this work, please see paragraphs 4.2 and 5 of our Terms.
© 2023 The Author(s). This work is published and licensed by Dove Medical Press Limited. The
full terms of this license are available at https://www.dovepress.com/terms
and incorporate the Creative Commons Attribution
- Non Commercial (unported, 3.0) License.
By accessing the work you hereby accept the Terms. Non-commercial uses of the work are permitted
without any further permission from Dove Medical Press Limited, provided the work is properly
attributed. For permission for commercial use of this work, please see paragraphs 4.2 and 5 of our Terms.
Recommended articles
Local Hyperthermia Combined With Imiquimod Cleared Recalcitrant and Extensive Warts in a Patient With Systemic Lupus Erythematosus
Wang GH, Wang YB, Cheng YA, Chen HD, Gao XH, Qi RQ
Clinical, Cosmetic and Investigational Dermatology 2025, 18:241-244
Published Date: 23 January 2025
Integrated Approach for Biomarker Discovery and Mechanistic Insights into the Co-Pathogenesis of Type 2 Diabetes Mellitus and Non-Hodgkin Lymphoma

Zhu Y, Liu J, Wang B
Diabetes, Metabolic Syndrome and Obesity 2025, 18:267-282
Published Date: 31 January 2025