Back to Journals » Clinical Interventions in Aging » Volume 20
Diagnostic Value of 18F-FDG PET/CT Parameters Combined with Serum FOXM1 for Lymph Node Metastasis in Colorectal Cancer
Authors Zhu Y, Bo L, Li L, Sun Y, Wu B ![]()
Received 24 June 2025
Accepted for publication 25 October 2025
Published 8 December 2025 Volume 2025:20 Pages 2447—2455
DOI https://doi.org/10.2147/CIA.S538944
Checked for plagiarism Yes
Review by Single anonymous peer review
Peer reviewer comments 2
Editor who approved publication: Dr Zhi-Ying Wu
Yuanqing Zhu,1,* Lei Bo,2,* Lin Li,1 Yinggang Sun,1 Bo Wu1
1Department of Gastrointestinal Surgery, The 960th Hospital of the PLA Joint Logistics Support Force, Jinan, People’s Republic of China; 2Department of Clinical Laboratory, The 960th Hospital of the PLA Joint Logistics Support Force, Jinan, People’s Republic of China
*These authors contributed equally to this work
Correspondence: Bo Wu, Email [email protected]
Objective: To evaluate the diagnostic value of maximum standardized uptake value (SUVmax), total lesion glycolysis (TLG), and metabolic tumor volume (MTV) in 18F-FDG PET/CT combined with serum forkhead box protein M1 (FOXM1) for detecting lymph node metastasis (LNM) in colorectal cancer (CRC).
Methods: A retrospective study was conducted on 107 CRC patients who underwent 18F-FDG PET/CT and serum FOXM1 testing, with postoperative pathology as the reference standard. Patients were divided into LNM-positive (n=52) and LNM-negative (n=55) groups. PET/CT metabolic parameters (SUVmax, TLG, MTV) and serum FOXM1 levels were compared, correlations were analyzed by Spearman’s test, and receiver operating characteristic (ROC) curves were plotted to assess diagnostic efficacy.
Results: SUVmax was significantly higher in LNM-negative patients, whereas TLG, MTV, and serum FOXM1 were higher in LNM-positive patients (all P< 0.05). Serum FOXM1 showed negative correlation with SUVmax (r=− 0.356) and positive correlation with TLG and MTV (r=0.564, 0.549). The combined model of SUVmax, TLG, MTV, and FOXM1 yielded the highest diagnostic performance (AUC=0.971, sensitivity=92.2%, specificity=94.3%).
Conclusion: SUVmax, TLG, MTV, and FOXM1 are interrelated and, when combined, provide superior diagnostic value for CRC LNM, though validation in larger, multicenter cohorts is needed.
Keywords: 18F-FDG PET/CT, SUVmax, TLG, MTV, serum FOXM1, colorectal cancer, lymph node metastasis
Introduction
Colorectal cancer (CRC) is one of the most prevalent malignant tumors worldwide, characterized by high incidence and mortality rates. Early diagnosis and timely treatment are crucial for improving patient survival.1,2 Lymph node metastasis (LNM) in CRC significantly affects prognosis and therapeutic strategies, as the number and location of metastatic lymph nodes determine clinical staging and treatment planning.3,4 Traditional imaging methods such as CT and MRI have limitations in detecting micrometastases and assessing tumor metabolic activity.5,6
Fluorodeoxyglucose (18F-FDG) positron emission tomography/computed tomography (PET/CT) has increasingly been applied in oncology diagnostics due to its ability to integrate anatomical and metabolic imaging, providing detailed information on tumor metabolism and volume.7,8 Among PET/CT metabolic parameters, maximum standardized uptake value (SUVmax), total lesion glycolysis (TLG), and metabolic tumor volume (MTV) are widely recognized as sensitive indicators of tumor activity.9,10 Recent studies have further highlighted PET/CT’s accuracy in lymph node staging for CRC, demonstrating improved detection of small metastases and prognostic value. For instance, a study by Xu et al assessed the quantification of intratumoral metabolic heterogeneity using 18F-FDG PET, highlighting its predictive value for LNM in CRC patients.11 Another study by Liu et al explored the prognostic significance of 18F-FDG PET-defined heterogeneity parameters, emphasizing their role in predicting clinical outcomes in CRC.12
Serum forkhead box protein M1 (FOXM1), a transcription factor involved in cell proliferation and metastasis, has been implicated in CRC progression and drug resistance.13,14 Emerging evidence suggests that combining molecular biomarkers with imaging parameters may enhance diagnostic accuracy. For instance, Xu et al and Long et al reported that FOXM1 levels correlate with tumor aggressiveness and may complement metabolic imaging.15,16 However, studies evaluating the joint diagnostic performance of serum FOXM1 and 18F-FDG PET/CT parameters in CRC LNM remain scarce. Therefore, this study retrospectively analyzed clinical data from 107 CRC patients to investigate the combined diagnostic value of SUVmax, TLG, MTV, and serum FOXM1 for CRC LNM, aiming to provide a novel, multi-parameter diagnostic approach with potential clinical application.
Materials and Methods
General Information
A retrospective analysis was conducted on 107 patients with pathologically CRC admitted to our hospital from April 2021 to July 2024. Inclusion criteria were: (1) age ≥18 years, no gender restriction; (2) newly diagnosed CRC without prior treatment; (3) standardized 18F-FDG PET/CT scans and serum biomarker testing; (4) complete clinical and follow-up data; (5) voluntary participation and informed consent. Exclusion criteria included: (1) prior chemotherapy, radiotherapy, targeted therapy, or surgery; (2) non-primary CRC or prior malignancy in other sites; (3) severe comorbidities affecting normal physiology; pregnancy or lactation; (4) incomplete PET/CT or serum data; (5) inability to comply with study procedures. All patients underwent radical surgery. Based on postoperative histopathology, patients were divided into Group A (n=52, LNM) and Group B (n=55, no LNM) (Supplementary Information 1).
Ethical approval was obtained from the 960th Hospital of the PLA Joint Logistics Support Force Medical Ethics Committee (Approval No.: CRC24-ZD01011). The study adhered to the Declaration of Helsinki, with anonymized data handling and laboratory personnel blinded to imaging results to minimize bias.
PET/CT Examination
Whole-body 18F-FDG PET/CT was performed after at least 4 hours of fasting, with blood glucose levels below 160 mg/dL. Patients were instructed to hydrate and empty their bladder prior to scanning. 18F-FDG was administered intravenously at a dose of 4.0 MBq/kg. After injection, patients rested supine for approximately 50 minutes. Low-dose CT was performed for attenuation correction, followed by whole-body PET imaging from skull base to mid-thigh. Lesion regions of interest (ROI) were delineated using PETVCAR software to extract metabolic parameters, including maximum standardized uptake value (SUVmax), metabolic tumor volume (MTV), and total lesion glycolysis (TLG). MTV and TLG were calculated using a 40% SUVmax threshold. Images were independently interpreted by two experienced nuclear medicine physicians; discrepancies were resolved by discussion.
Serum FOXM1 Detection
Fasting venous blood samples (5 mL) were collected preoperatively. Serum was separated by centrifugation and stored at 4°C until analysis. FOXM1 concentrations were measured using a human ELISA kit according to the manufacturer’s instructions, with laboratory personnel blinded to PET/CT results. Optical density (OD) was measured at 450 nm, and concentrations were calculated from a standard curve. All procedures were performed according to the standardized protocol to ensure accuracy and repeatability.
LNM Assessment
Postoperative histopathology served as the gold standard for LNM. A median of 14 lymph nodes (range 8–24) were dissected per patient, and only histologically confirmed metastatic nodes were considered positive. No diagnoses were based solely on imaging or follow-up.
Statistical Analysis
Graphs were created using GraphPad Prism 8, and data were processed using SPSS 22.0 software. Continuous variables were presented as mean ± SD or median (IQR) as appropriate. Group comparisons were performed using independent sample t-tests. Categorical data were expressed as n (%) and analyzed using chi-square tests. Spearman correlation coefficients (with 95% CI) assessed relationships among SUVmax, MTV, TLG, and FOXM1. ROC curves were used to evaluate diagnostic performance. AUC comparisons between individual parameters and the combined model were performed using DeLong’s test to support the superiority of the combined model.
To address potential overfitting due to the modest sample size (n=107), internal validation was conducted using bootstrap resampling (1000 iterations). Multivariable logistic regression was performed to adjust for potential confounders, including tumor location, CEA levels, and MSI status. Statistical significance was set at P<0.05.
Sample size calculation: Based on an expected AUC of 0.85, α = 0.05, and 80% power (β = 0.2), at least 50 patients with LNM were required, consistent with our study design.
Results
Comparison of Basic Information Between Group A and Group B
A total of 107 CRC patients were included, with 52 patients in Group A (lymph node-positive) and 55 in Group B (lymph node-negative). No missing data were observed for baseline characteristics. Tumor long diameter was measured using preoperative imaging (CT or MRI) along the longest axis. The baseline characteristics, including gender, age, degree of differentiation, and tumor long diameter, showed no significant differences between groups (P > 0.05), indicating comparability (Table 1).
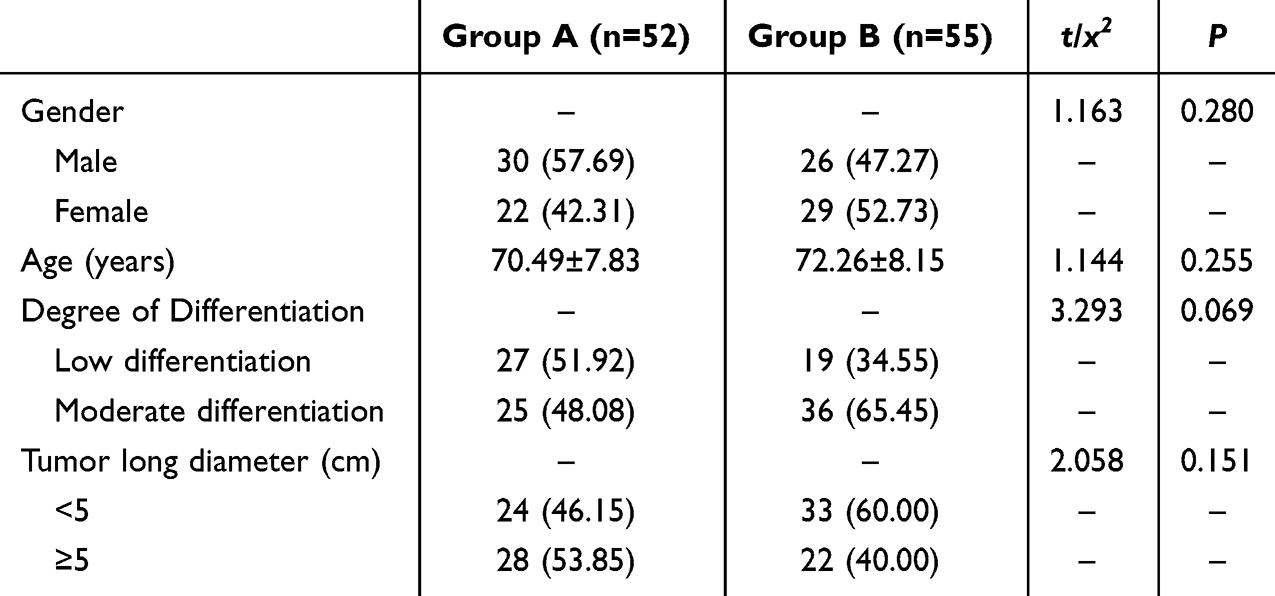 |
Table 1 Comparison of Basic Information Between Group A and Group B ( |

Comparison of SUVmax, TLG, and MTV Levels Between Group A and Group B
The SUVmax, MTV, and TLG levels in Group A were 12.09 ± 4.85, 16.54 ± 3.11, and 159.08 ± 47.36, respectively. In Group B, the levels were 15.86 ± 5.32, 8.97 ± 3.15, and 112.19 ± 30.27, respectively. SUVmax in Group B was higher than in Group A (P < 0.05), while MTV and TLG were lower in Group B compared to Group A (P < 0.05). See Figure 1.
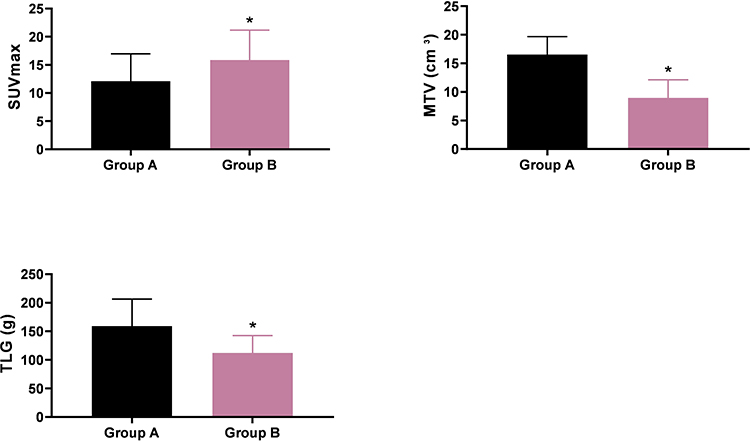 |
Figure 1 Comparison of SUVmax, TLG, and MTV Levels Between Group A and Group B ( Notes: Inter-group comparison, *P < 0.05; Group A (n=52), Group B (n=55). |

Comparison of Serum FOXM1 Levels Between Group A and Group B
The serum FOXM1 level in Group A was 47.96 ± 8.03, while in Group B, it was 32.05 ± 9.16. The serum FOXM1 level in Group B was lower than in Group A (P < 0.05). See Figure 2.
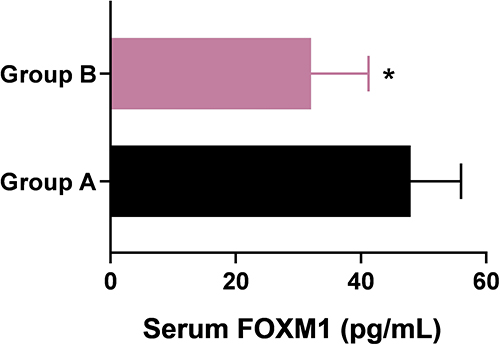 |
Figure 2 Comparison of Serum FOXM1 Levels Between Group A and Group B. Notes: Inter-group comparison, *P < 0.05; Group A (n=52), Group B (n=55). |
Correlation Analysis Among SUVmax, TLG, MTV, and FOXM1
Spearman correlation analysis showed: FOXM1 negatively correlated with SUVmax (r = −0.356, 95% CI: −0.541 to −0.132, P < 0.05); FOXM1 positively correlated with MTV (r = 0.564, 95% CI: 0.367–0.712) and TLG (r = 0.549, 95% CI: 0.343–0.701, P < 0.05); SUVmax negatively correlated with MTV (r = −0.431, 95% CI: −0.610 to −0.214) and TLG (r = −0.264, 95% CI: −0.470 to −0.047); MTV positively correlated with TLG (r = 0.443, 95% CI: 0.238–0.618, P < 0.05). See Table 2 and Figures 3–5.
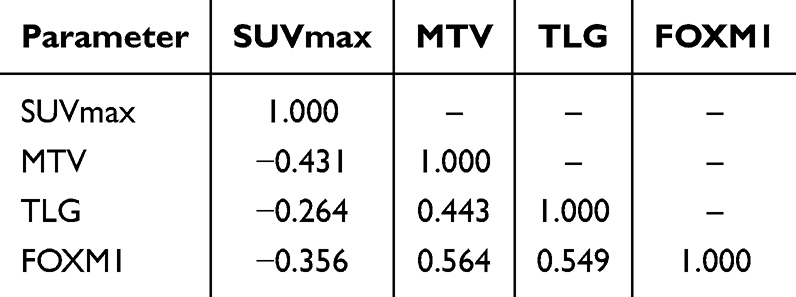 |
Table 2 Correlation Analysis Among SUVmax, TLG, MTV, and FOXM1 (n=107) |
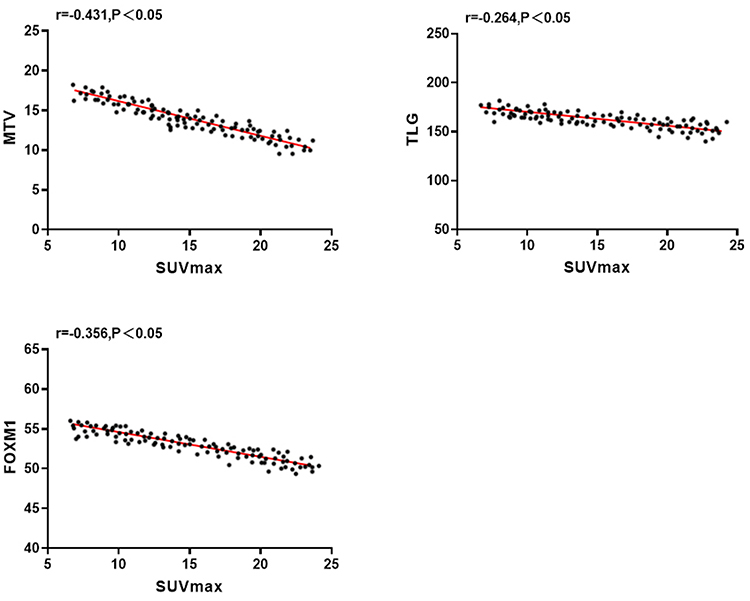 |
Figure 3 Correlation Analysis of MTV, TLG, and FOXM1 with SUVmax (n=107). |
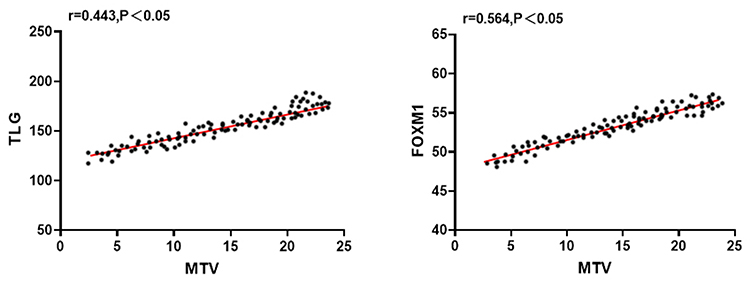 |
Figure 4 Correlation Analysis of TLG and FOXM1 with MTV (n=107). |
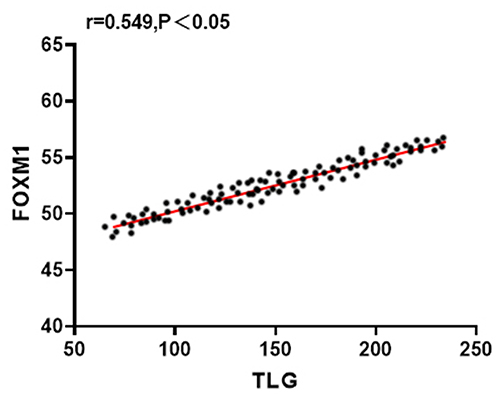 |
Figure 5 Correlation Analysis of FOXM1 with TLG (n=107). |
Diagnostic Value Analysis of Various Parameters for CRC LNM
ROC curve analysis showed the combination of SUVmax, MTV, TLG, and FOXM1 achieved the highest diagnostic accuracy: AUC = 0.97, sensitivity = 92.2% (95% CI: 83.7–97.0%), specificity = 94.3% (95% CI: 85.9–98.2%). Individual parameters had lower performance, and “MPM” (multi-parameter model) was defined as the combination of SUVmax, MTV, and TLG. Hosmer-Lemeshow test indicated good calibration (P = 0.61), supporting model reliability. See Table 3 and Figure 6.
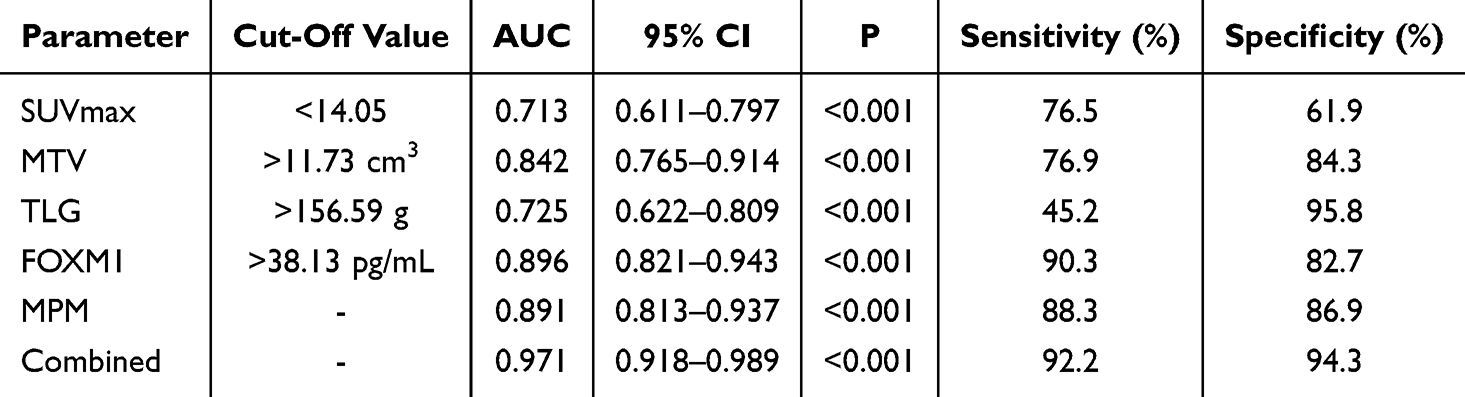 |
Table 3 Diagnostic Value Analysis of Various Parameters for CRC LNM |
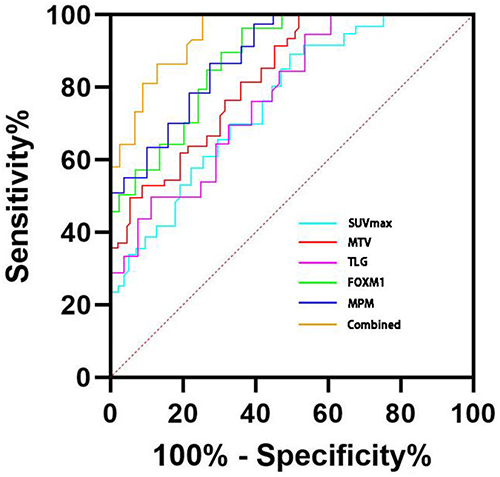 |
Figure 6 ROC Curve of Diagnostic Value of Various Parameters for CRC LNM. |
Discussion
LNM is one of the common metastatic pathways of CRC and plays a critical role in tumor staging assessment and the formulation of individualized treatment strategies.17,18 The presence of LNM often indicates that the disease has progressed to a locally advanced or systemic dissemination stage,19 and it is associated with poor patient prognosis. Therefore, accurate evaluation of LNM can not only optimize treatment strategies but also provide a more precise basis for prognosis prediction.
At present, 18F-FDG PET/CT has received widespread attention in tumor diagnosis, especially its metabolic parameters (such as SUVmax, MTV, and TLG). Previous studies20–22 have demonstrated that these parameters can reflect tumor metabolic activity and burden, and are closely related to tumor aggressiveness and staging. The results of this study showed that the SUVmax of LNM patients was significantly lower than that of non-metastatic patients (P<0.05), while the levels of MTV and TLG were significantly higher (P<0.05). ROC curve analysis further revealed that among individual indicators, MTV had the highest diagnostic efficacy, TLG had the strongest specificity, whereas the diagnostic value of SUVmax was relatively limited. Notably, SUVmax showed an “abnormally reduced” phenomenon in LNM patients, which may be related to partial volume effects in small metastatic lymph nodes, decreased peak metabolic activity caused by intratumoral necrosis, or measurement bias due to threshold setting. Similar results have also been reported in previous studies by Yang & Liu,23 suggesting that SUVmax alone may not reliably reflect metastatic activity in CRC and should be interpreted with caution. In contrast, MTV and TLG, which reflect the overall metabolic burden of tumors, demonstrated more significant clinical advantages in the diagnosis of LNM.
In recent years, FOXM1 has attracted attention due to its critical role in various malignancies. As a transcription factor, FOXM1 is highly expressed in hepatocellular carcinoma, breast cancer, lung cancer, and brain tumors,24–27 and is closely related to tumor proliferation, angiogenesis, metastasis, and drug resistance.28,29 Studies30 have shown that abnormal FOXM1 expression can enhance tumor invasiveness by regulating glucose uptake and metabolic pathways. In this study, serum FOXM1 levels in CRC patients with LNM were significantly higher than those in non-metastatic patients (P<0.05), and the AUC and sensitivity of FOXM1 in diagnosing LNM were superior to any single PET/CT metabolic parameter. This result is consistent with recent studies on FOXM1 as a biomarker,31–33 further confirming its potential application value in CRC.
Correlation analysis revealed that FOXM1 was negatively correlated with SUVmax, but positively correlated with MTV and TLG, suggesting that FOXM1 may influence PET/CT metabolic features by regulating tumor metabolic activity. Previous studies34,35 have confirmed that inhibition of FOXM1 can reduce glucose uptake and metabolic capacity of cells by downregulating key glycolytic enzymes (such as HK1, HK2, and Glut1), which is consistent with the findings of this study.
Notably, when serum FOXM1 was combined with PET/CT metabolic parameters, the diagnostic performance of LNM was further improved, with the AUC reaching 0.971. This combined model not only improved sensitivity and specificity but also has translational potential: in clinical practice, it can assist in preoperative patient stratification, guide surgical planning, and identify high-risk populations requiring adjuvant therapy, providing practical value beyond traditional imaging.
However, this study also has several limitations: (1) the sample size was relatively small, including only 107 CRC patients, limiting the generalizability of the results; (2) the single-center retrospective design introduced inherent selection bias; (3) lack of external validation and prospective confirmation; (4) absence of molecular pathological stratification (such as KRAS and MSI status), which may affect FOXM1 expression and PET/CT parameter performance; (5) potential confounding factors (such as lifestyle and family history) were not fully considered. Future studies should conduct multicenter prospective cohort research and explore machine learning models that combine PET/CT parameters with serum biomarkers to optimize risk prediction.
In conclusion, the combined application of 18F-FDG PET/CT metabolic parameters and serum FOXM1 provides a promising new strategy for diagnosing CRC LNM. By improving diagnostic accuracy and clinical feasibility, this approach is expected to promote the development of individualized treatment plans and prognosis evaluation, thereby improving long-term survival and quality of life for patients.
Conclusion
This study demonstrates that the combination of SUVmax, MTV, TLG, and serum FOXM1 exhibits relatively high diagnostic accuracy for LNM in CRC. The findings suggest that this multi-parameter approach has potential clinical value for preoperative patient stratification and individualized treatment planning. However, these results should be interpreted as preliminary. Their reliability and generalizability require further validation in larger, multicenter, prospective studies before routine clinical implementation.
Disclosure
The authors report no conflicts of interest in this work.
References
1. Li XY, Yao JN, Dong XY, et al. Clinical features and prognostic analysis of colorectal extranodal NK/T cell lymphoma. Zhonghua Zhong Liu Za Zhi. 2024;46(8):782–793. doi:10.3760/cma.j.cn112152-20231026-00260
2. Zheng RS, Sun Kexin, Zhang Siwei, et al. Cancer incidence and mortality in China, 2022. Zhonghua Zhong Liu Za Zhi. 2024;46(3):221–231. doi:10.3760/cma.j.cn112152-20240119-00035
3. Xi KX, Song SY, Luo ZK, et al. The prognostic impact of number-indexes of lymph nodes in stage N1c colorectal cancer patients. Zhonghua Yi Xue Za Zhi. 2022;102(19):1423–1429. doi:10.3760/cma.j.cn112137-20220214-00297
4. Wu W, Zeng S, Zhang X, et al. The value of tumor deposits in evaluating colorectal cancer survival and metastasis: a population-based retrospective cohort study. World J Surg Oncol. 2022;20:41. doi:10.1186/s12957-022-02503-6
5. Engel R, Kudura K, Antwi K, et al. Diagnostic accuracy and treatment benefit of PET/CT in staging of colorectal cancer compared to conventional imaging. Surg Oncol. 2024;57:102151. doi:10.1016/j.suronc.2023.102151
6. Liu Y, Wan LJ, Zhang HM, et al. MRI associated biomarker analysis for diagnosis of lymph node metastasis in T1-2 stage rectal cancer. Zhonghua Zhong Liu Za Zhi. 2021;43(2):207–212. doi:10.3760/cma.j.cn112152-20200429-00391
7. Guo Y, Yao ZM, Chen M, Chen CX. The correlation between metabolic parameters in 18F-FDG PET-CT and solid and micropapillary histological subtypes in lung adenocarcinoma. Zhonghua Zhong Liu Za Zhi. 2022;44(6):555–561. doi:10.3760/cma.j.cn112152-20200804-00710
8. Peng P, Wu N, Tao XL, et al. Pretreatment evaluation of 18F-FDG PET-CT in extranodal NK/T-cell lymphoma. Zhonghua Zhong Liu Za Zhi. 2022;44(4):370–376. doi:10.3760/cma.j.cn112152-20200525-00485
9. Lee JH, Kim S, Lee HS, et al. Different prognostic impact of glucose uptake in visceral adipose tissue according to sex in patients with colorectal cancer. Sci Rep. 2021;11:21556. doi:10.1038/s41598-021-00712-4
10. Qi Z, Tang K, Lu X, Zhu Y, Xu N. Value of 18F-FDG PET/CT in the diagnosis and grading of incidental colorectal adenomas. Rev Esp Med Nucl Imagen Mol. 2025;44(2):500075. doi:10.1016/j.remn.2025.500075
11. Xu L, Huang G, Wang Y, Huang G, Liu J, Chen R. 2-[18F]FDG PET-based quantification of lymph node metabolic heterogeneity for predicting lymph node metastasis in patients with colorectal cancer. Eur J Nucl Med Mol Imaging. 2024;51(6):1729–1740. doi:10.1007/s00259-024-06085-2
12. Liu X, Xiang K, Geng GY, et al. Prognostic value of intratumor metabolic heterogeneity parameters on 18F-FDG PET/CT for patients with colorectal cancer. Contrast Media Mol Imaging. 2022;2022:2586245. doi:10.1155/2022/2586245
13. Feng HN, Shao XX, Bu P, et al. Expression of CDK6 and FOXM1 in peripheral T-cell lymphoma and their significance. Zhonghua Bing Li Xue Za Zhi. 2020;49(6):594–600. doi:10.3760/cma.j.cn112151-20191104-00710
14. Ge N, Jiang Y, Pan Z, Wan J. Forkhead box M1 regulates the proliferation, invasion, and drug resistance of gastric cancer cells via circ_NOTCH1. Zhongguo Yi Xue Ke Xue Yuan Xue Bao. 2023;45(5):713–720. doi:10.3881/j.issn.1000-503X.15584
15. Xu M, Shao X, Li H, Zhang Z, Zhou C, Cheng Z. Clinical value and potential association of Rab1A and FoxM1 aberrant expression in colorectal cancer. Sci Rep. 2020;10:20160. doi:10.1038/s41598-020-77259-3
16. Long Z, Yi Z, Yan W, Wang H. Trends in the immunotherapy for glioblastoma: a two-decade bibliometric analysis. Hum Vaccin Immunother. 2025;21:2466299. doi:10.1080/21645515.2025.2466299
17. Wei R, Zheng Z, Li Q, et al. Prognostic and predictive value of examined lymph node count in stage III colorectal cancer: a population-based study. World J Surg Oncol. 2024;22:155. doi:10.1186/s12957-024-03012-1
18. Fariha Kaunain S and Kumar Pandurangan A. (2025). Immunotherapy for Colorectal Cancer: Recent Advancements. Innov Discov, 2(3), 12 10.53964/id.2025012
19. Wu C, Wang Y, Gao H, Zhang Y, Dai M, Li S. Relationship between salt-inducible kinase 2 (SIK2) and lymph node metastasis in colorectal cancer patients complicated with chronic schistosomiasis. Zhejiang Da Xue Xue Bao Yi Xue Ban. 2021;50(5):607–613. doi:10.3724/zdxbyxb-2021-0157
20. Zhao CY, Deng XY, Wang HS, et al. Value of 18F-FDG PET-CT imaging to predict epidermal growth factor receptor mutations in patients with lung squamous cell carcinoma. Zhonghua Zhong Liu Za Zhi. 2021;43(7):795–800. doi:10.3760/cma.j.cn112152-20190111-00006
21. Gu Q, Chen SF, Chen KL, et al. The clinical application value of brain 18F-FDG PET/CT in the diagnostics of Parkinsonian syndromes. Zhonghua Yi Xue Za Zhi. 2023;103(41):3294–3300. doi:10.3760/cma.j.cn112137-20230707-01181
22. Zhao T, Bai M, Wang R, et al. Prognostic value and imaging features of 18F-FDG PET-CT in follicular lymphoma with different histopathology grade. Zhonghua Xue Ye Xue Za Zhi. 2024;45(8):776–780. doi:10.3760/cma.j.cn121090-20240208-00059
23. Yang Z, Liu Z. The efficacy of 18F-FDG PET/CT-based diagnostic model in the diagnosis of colorectal cancer regional lymph node metastasis. Saudi J Biol Sci. 2020;27(3):805–811. doi:10.1016/j.sjbs.2019.12.022
24. Suzuki T, Takei J, Fukasawa N, et al. 18F-Fluoromisonidazole-PET and immunohistochemistry verified tumor oxygenation, stemness, and immunosupportive microenvironment after preoperative neoadjuvant bevacizumab for newly diagnosed glioblastoma. World Neurosurg. 2023;175:e1364–e1374. doi:10.1016/j.wneu.2023.03.098
25. Gu Y, Wang W, Wang X, et al. Author correction: integrated network analysis identifies hsa-miR-4756-3p as a regulator of FOXM1 in triple negative breast cancer. Sci Rep. 2021;11:20732. doi:10.1038/s41598-021-00000-0
26. Xu C, Zhang S, Lv J, et al. Machine learning identification of a novel vasculogenic mimicry-related signature and FOXM1’s role in promoting vasculogenic mimicry in clear cell renal cell carcinoma. Transl Oncol. 2025;53:102312. doi:10.1016/j.tranon.2025.102312
27. Shim JK, Lim SH, Jeong JH, et al. A lignan from Alnus japonica inhibits glioblastoma tumorspheres by suppression of FOXM1. Sci Rep. 2022;12:13990. doi:10.1038/s41598-022-13990-2
28. Damaševičius R. (2024). Explainable Artificial Intelligence Methods for Breast Cancer Recognition. Innov Discov, 1(3), 25 10.53964/id.2024025
29. Tian S, Han G, Lu L, Meng X. Circ-FOXM1 contributes to cell proliferation, invasion, and glycolysis and represses apoptosis in melanoma by regulating miR-143-3p/FLOT2 axis. World J Surg Oncol. 2020;18:56. doi:10.1186/s12957-020-01828-5
30. Wang RT, Miao RC, Zhang X, et al. Fork head box M1 regulates vascular endothelial growth factor-A expression to promote the angiogenesis and tumor cell growth of gallbladder cancer. World J Gastroenterol. 2021;27(8):692–707. doi:10.3748/wjg.v27.i8.692
31. Wu HY, Luo LF, Wei F, Jiang HM. Comprehensive clinicopathological significance and putative transcriptional mechanisms of Forkhead box M1 factor in hepatocellular carcinoma. World J Surg Oncol. 2023;21:366. doi:10.1186/s12957-023-03084-0
32. Xiao H, Jiang Z, Fu X, et al. High expression of forkhead box M1 (FOXM1) is a poor prognostic biomarker in lung adenocarcinoma. Transl Cancer Res. 2020;9(10):6331–6343. doi:10.21037/tcr-20-2027
33. Wang I. Meta-analysis of efficacy and safety of total neoadjuvant therapy compared with neoadjuvant chemoradiotherapy for locally advanced rectal cancer. J Mod Med Oncol. 2023;3. doi:10.53964/jmmo.2023006 6.
34. Bai J, Li Y, Cai L. Clinical implications of forkhead box M1, cyclooxygenase-2, and glucose-regulated protein 78 in breast invasive ductal carcinoma. World J Clin Cases. 2023;11(30):7284–7293. doi:10.12998/wjcc.v11.i30.7284
35. Tao J, Xu XS, Song YZ, Liu C. Correction to “Downregulation of FoxM1 inhibits the viability and invasion of gallbladder carcinoma cells, partially dependent on the induction of cellular senescence”. World J Gastroenterol. 2021;27(26):4246–4247. doi:10.3748/wjg.v27.i26.4246
 © 2025 The Author(s). This work is published and licensed by Dove Medical Press Limited. The
full terms of this license are available at https://www.dovepress.com/terms
and incorporate the Creative Commons Attribution
- Non Commercial (unported, 4.0) License.
By accessing the work you hereby accept the Terms. Non-commercial uses of the work are permitted
without any further permission from Dove Medical Press Limited, provided the work is properly
attributed. For permission for commercial use of this work, please see paragraphs 4.2 and 5 of our Terms.
© 2025 The Author(s). This work is published and licensed by Dove Medical Press Limited. The
full terms of this license are available at https://www.dovepress.com/terms
and incorporate the Creative Commons Attribution
- Non Commercial (unported, 4.0) License.
By accessing the work you hereby accept the Terms. Non-commercial uses of the work are permitted
without any further permission from Dove Medical Press Limited, provided the work is properly
attributed. For permission for commercial use of this work, please see paragraphs 4.2 and 5 of our Terms.
Recommended articles
Interleukin-6 as a Predictive Marker for Lymph Node and Distant Metastasis in Colorectal Cancer: A Retrospective Cohort Study
Xiao J, Tian M, Chen G, Li H
Cancer Management and Research 2025, 17:1525-1535
Published Date: 1 August 2025
Predictive Value of Preoperative [18F]FDG PET/CT-Derived Heterogeneity Index for Occult Lymph Node Metastasis in Clinical N0 Gastric Adenocarcinoma
Wu B, Tian WJ, Li L, Zhu YQ, Sun YG
International Journal of General Medicine 2025, 18:5581-5589
Published Date: 17 September 2025