")
Back to Journals » Diabetes, Metabolic Syndrome and Obesity » Volume 14
Diabetes Mellitus as a Risk Factor for Progression from Acute Kidney Injury to Acute Kidney Disease: A Specific Prediction Model
Authors Zhao H, Liang L, Pan S, Liu Z, Liang Y, Qiao Y, Liu D, Liu Z
Received 22 February 2021
Accepted for publication 4 May 2021
Published 25 May 2021 Volume 2021:14 Pages 2367—2379
DOI https://doi.org/10.2147/DMSO.S307776
Checked for plagiarism Yes
Review by Single anonymous peer review
Peer reviewer comments 2
Editor who approved publication: Prof. Dr. Antonio Brunetti
Huanhuan Zhao,1– 5,* Lulu Liang,1– 5,* Shaokang Pan,1 Zhenjie Liu,1 Yan Liang,1 Yingjin Qiao,1 Dongwei Liu,1– 5 Zhangsuo Liu1– 5
1Department of Nephrology, The First Affiliated Hospital of Zhengzhou University, Zhengzhou, 450052, People’s Republic of China; 2Research Institute of Nephrology, Zhengzhou University, Zhengzhou, 450052, People’s Republic of China; 3Research Center for Kidney Disease, Zhengzhou, 450052, Henan Province, People’s Republic of China; 4Key Laboratory of Precision Diagnosis and Treatment for Chronic Kidney Disease in Henan Province, Zhengzhou, 450052, People’s Republic of China; 5Core Unit of National Clinical Medical Research Center of Kidney Disease, Zhengzhou, 450052, People’s Republic of China
*These authors contributed equally to this work
Correspondence: Zhangsuo Liu; Dongwei Liu
Department of Nephrology, The First Affiliated Hospital of Zhengzhou University, No. 1, Jianshe East Road, Zhengzhou, 450052, Henan Province, People’s Republic of China
Tel +86-0371-66295921
Email [email protected]; [email protected]
Purpose: Acute kidney injury is very common in hospitalized patients and carries a significant risk of mortality. Although timely intervention may improve patient prognosis, studies on the development of acute kidney disease in patients with acute kidney injury remain scarce. Thus, we constructed a prediction model to identify patients likely to develop acute kidney disease.
Patients and Methods: Among 474 patients screened for eligibility, 261 were enrolled and randomly divided into training (185 patients) and independent validation cohorts (76 patients). Least absolute shrinkage and selection operator regression and multivariate logistic regression analyses were used to select features and build a nomogram incorporating the selected predictors: diabetes, anemia, oliguria, and peak creatinine. Calibration, discrimination, and the clinical usefulness of the model were assessed using calibration plots, the C-index, receiver operating characteristic curves, and decision curve analysis.
Results: Diabetes was significantly associated with the presence of AKD. Peak creatinine, oliguria, and anemia also contributed to the progression of acute kidney injury. The model displayed good predictive power with a C-index of 0.834 and an AUC of 0.834 (95% confidence interval (CI): 0.773– 0.895) in the training cohort and a C-index of 0.851 and an AUC of 0.851 (95% CI: 0.753– 0.949) in the validation cohort. The calibration curves also showed that the model had a medium ability to predict acute kidney disease risk. Decision curve analysis showed that the nomogram was clinically useful when interventions were decided at the possibility threshold of 22%.
Conclusion: This novel prediction nomogram may allow for convenient prediction of acute kidney disease in patients with acute kidney injury, which may help to improve outcomes.
Keywords: diabetes mellitus, acute kidney injury, anemia, oliguria, nomogram
Introduction
Acute kidney injury (AKI) is a common complication of critical illness, affecting up to 20% of hospitalized patients and almost half of patients in the intensive care unit (ICU).1,2 AKI can increase in-hospital stay or long-term mortality. For example, among patients with septic shock, the 60-day mortality rate of patients with AKI is three to five times that of those without AKI.3 Furthermore, survivors of AKI have an increased risk of chronic kidney disease (CKD) and end-stage kidney disease (ESRD), both of which can diminish a patient’s quality of life and cause a heavy burden for their families and the health system.4 At present, AKI and CKD represent a continuum of the disease process but are not discrete entities. Thus, the term acute kidney disease (AKD) was proposed to unify the more established concepts of AKI and CKD.5 In 2017, the Acute Disease Quality Initiative (ADQI) workgroup proposed a new definition of AKD in their expert consensus document. AKD was defined as AKI stage one or higher persisting ≥7 days and <90 days.6 Recently, a prospective, multicenter cohort study reported that early recovery of kidney function after AKI was associated with better long-term clinical outcomes.7 Additionally, some experts have suggested that initiating critical interventions during the window of this AKD period may effectively improve the prognosis of patients. However, research regarding AKD is scarce. To date, only one study has attempted to use kidney biopsy samples to characterize AKD.8 The ADQI 16 workgroup consensus noted that, to ensure more meaningful application of the concept of AKD in clinical practice, further studies concerning the epidemiology of AKD—including predictors, disease course, and results related to AKI are warranted.6
Advancements in computer science have enabled the development of predictive models for various diseases based on electronic medical records surveillance.9,10 Therefore, in this novel, retrospective study, we aimed to identify risk factors for AKD. We also constructed a clinical prediction model to identify patients likely to have AKD based on clinical risk scores.
Materials and Methods
Patient Selection
We screened all patients admitted to the First Affiliated Hospital of Zhengzhou University from January 2018 to December 2018. The requirement for informed consent was waived due to the retrospective nature of the study. A total of 474 patients were clinically diagnosed with AKI, acute renal failure, or acute renal insufficiency. Patients were included in this study if they met the Kidney Disease: Improving Global Outcomes (KDIGO) AKI diagnostic criteria, if it was their first hospital admission due to AKI, and if we were able to obtain their serum creatinine value ≥7 days after the diagnosis of AKI from the medical record or their serum creatinine value dropped to less than 1.5 times the normal value within 7 days. Patients who were younger than 18 years old, those with a history of kidney disease or nephrectomy, and those whose medical records were incomplete were excluded (Figure 1). A total of 261 patients who met the inclusion and exclusion criteria were included in this study and were randomly divided into the training (n=185) and validation (n=76) groups.
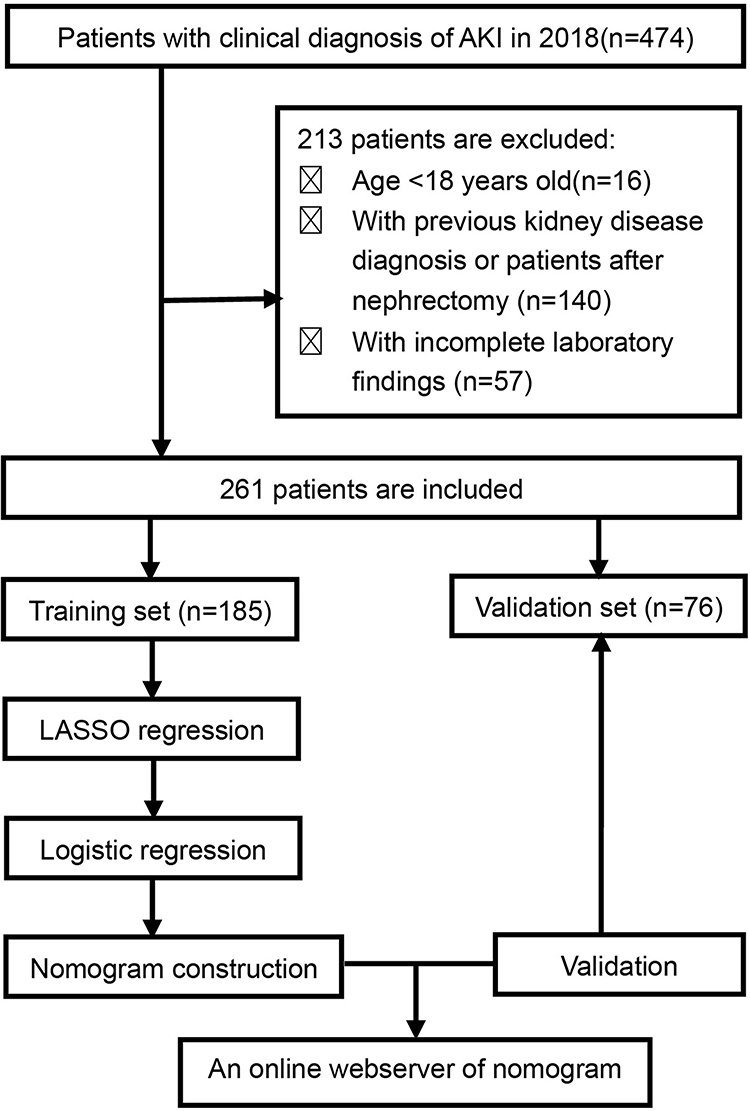 |
Figure 1 Patient screening and study design flow chart. Abbreviations: AKI, acute kidney injury; KDIGO, Kidney disease: Improving Global Outcomes; LASSO, least absolute shrinkage and selection operator. |
Data Acquisition
We retrospectively collected patient data, including demographic characteristics (age, sex), vascular risk factors (hypertension, diabetes mellitus), laboratory parameters on the day of admission (white blood cell (WBC) count, hemoglobin (Hb), platelet (PLT) count, blood urea nitrogen (BUN), all serum creatinine values (Scr), uric acid (UA), alanine aminotransferase (ALT), total protein (TP), blood Albumin (ALB), total cholesterol (T-CHO), triglyceride (TG), low-density lipoprotein (LDL), high-density lipoprotein (HDL), 24-h urine volume, and presence of proteinuria), admission department, and receipt of continuous renal replacement therapy (CRRT). Hypertension was defined based on blood pressure values higher than the normal value (systolic blood pressure ≥140 mmHg/or diastolic blood pressure ≥90 mmHg) on three different days. Diabetes was defined by any of the following conditions: 1) blood glucose ≥11.1 mmol/L (200 mg/dl) at any time of the day; 2) fasting blood glucose level ≥7.0 mmol/L (126 mg/dl); or 3) oral glucose tolerance test 2-hour blood glucose level ≥11.1 mmol/L (200 mg/dl). Proteinuria was defined when the 24-hour urine protein level exceeded 0.15 g, the urine protein/creatinine was >0.2 g/g, or the urine protein qualitative test was positive. Oliguria was defined as a 24-hour urine output less than 400 mL. Anemia was defined as Hb <120 g/L for men and Hb <110 g/L for women. Uric acid values over 420 micromoles per liter for men or over 360 micromoles per liter for women were defined as high uric acid. We used the discrete BUN (quartile) and peak values of creatinine (quintile) with equal frequency to ensure clinical relevance.
Definition of AKI and AKD
Definition of AKI
AKI was defined as any of the following (not graded): increase in serum creatinine (SCr) by ≥0.3 mg/dL (≥26.5 mol/L) within 48 hours or increase in SCr to ≥1.5 times baseline, which is known or presumed to have occurred within the prior 7 days; or urine volume <0.5 mL/kg/h for 6 hours. AKI Stage 1 was defined as an Scr increase of more than 26.5μmol/L within 48 h or increase of ≥1.5 of the threshold less than 2.0 times within 7 days. AKI Stage 2 was defined as an SCr increase of 2.0 to 2.9 times the value. AKI Stage 3 was defined as an SCr increase up to the refractive index of more than 3.0 times, an Scr >353.6 μmol/L, or the start of CRRT.5
Definition of AKD
AKD was defined as the presence of AKI Stage 1 or higher persisting ≥7 days but <90 days after the onset of AKI, in accordance with the diagnostic criteria of the ADQI.6
Statistics Software and Data Analysis
Statistical analysis was performed using R software (version 3.6.3; https://www.R-project.org). Feature selection, nomogram establishment, calibration curve generation, AUC measurements, and decision curve analysis were performed using the “tableone,” “glmnet,” “Hmisc,” “regplot,” “pROC,” “rmda,” and “rms” packages in R software. To develop a dynamic nomogram online application (APP) for predicting the occurrence of AKD, we used the “rsconnect” and “DynNom” packages in R software.
Continuous variables are expressed as the median (interquartile range) or mean ± standard deviation (SD), while categorical variables are expressed as absolute frequencies, n (%). The continuous and categorical data were compared between the training and validation groups using the chi-square test, independent Samples t-test, or Mann–Whitney U-test. A P value of 0.05 (two-tailed) was considered significant.
Construction of the Nomogram Model
Least absolute shrinkage and selection operator (LASSO) regression was used to select the optimal predictive features while fitting a generalized linear model in this study.11 This method can select features for better performance parameters and control the complexity of the model through a series of parameters to avoid overfitting. Features with nonzero coefficients in the LASSO regression model were selected.12 To predict the probability of AKD, a multivariable logistic regression (MLR) analysis was performed by incorporating the features selected in the LASSO regression model. P values in the multivariable analysis were based on the Wald test, and a P value ≤0.05 was considered significant. A forest plot was drawn to describe the results of the MLR, and it included the P-value, odds ratio (OR), and 95% confidence interval (CI) of visually selected features. Statistically significant predictors were applied to develop a model of AKD risk prediction for patients with AKI.13 This model weights the predictors according to the regression coefficients of all significant predictors and gives a score for each value level of each predictor. Then, we mapped the values of each significant predictor to points ranging from 0 to 100. The total points obtained for each model corresponded to the probability of AKD.
Validation of the Nomogram Model
The calibration of the models was measured using calibration curves.14 The receiver operating characteristic curve (ROC) and the average optimism of the area under the curve (AUC) were measured to quantify the discrimination performance and the predictive ability of the AKD nomogram. The AKD risk nomogram was validated both internally and externally to ascertain its predictive power.
In the internal validation, we used a bootstrap resampling method for obtaining relatively unbiased estimates (1000 repetitions). The model was refitted, and accuracy and bias were estimated to calculate a relatively corrected C-index for each group of 1000 bootstrap samples.15 In the external validation, we measured the predictive accuracy of the nomogram by measuring the AUC of the validation cohort.
We also performed decision curve analysis (DCA) to evaluate the clinical usefulness of the predictive model by analyzing the clinical net benefit of the prediction model in both the training and validation cohorts.16 The selected probability thresholds are where the expected benefit of intervention is equal to the expected benefit of avoiding intervention. When a patient’s probability fell within the probability thresholds, the model was considered to provide more benefit.17
Results
Patient Characteristics
Of the 474 patients with AKI who visited our clinic from January 2018 to December 2018, 261 met the inclusion and exclusion criteria. These patients were randomly divided into the training group (n=185) and the validation group (n=76). The epidemiological and clinical characteristics of the training and validation cohorts are summarized in Table 1. We observed no significant differences in patient characteristics between the two cohorts. In the training cohort, 127 patients developed AKD, resulting in an AKD incidence of 68.6%. Patients with oliguria (P<0.05) and anemia (P<0.05) were more likely to develop AKD than those without oliguria and anemia. Patients with AKD tended to have significantly higher peak creatinine (P<0.0001), higher BUN (P=0.001), lower PLT (P<0.05), and lower ALB (P<0.05) levels than those without AKD. All patient data for the training cohort, including demographic characteristics, clinical findings, and laboratory test results, are provided in Table 2.
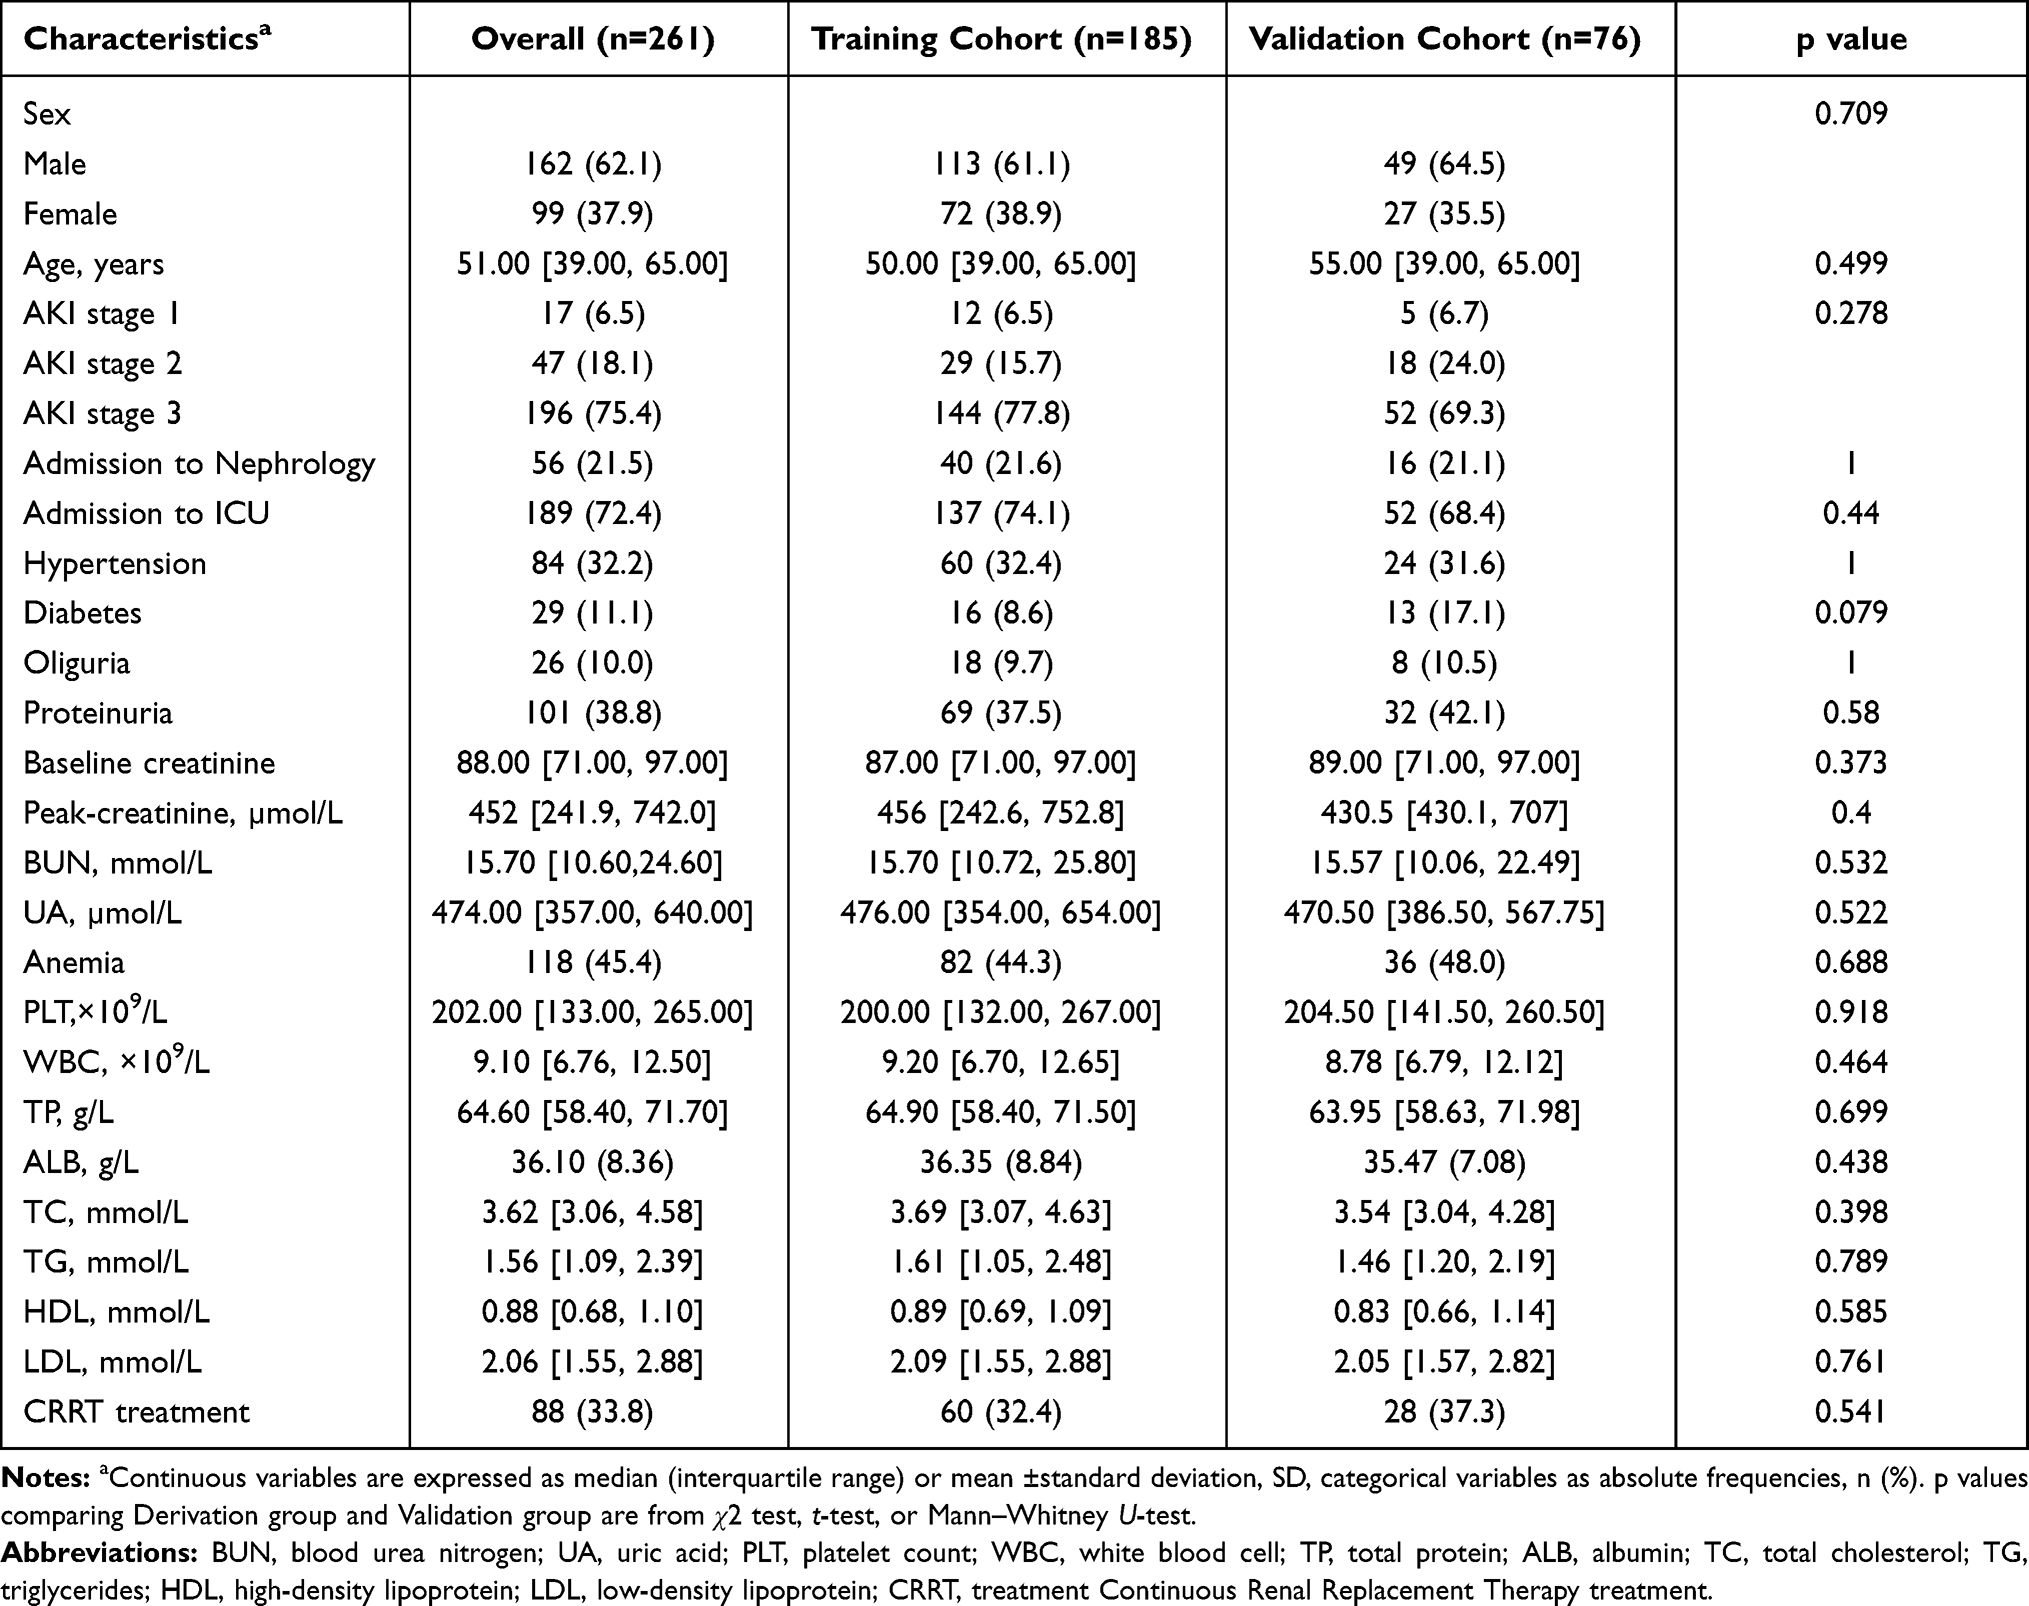 |
Table 1 Details of Patients’ Characteristics in the Training Cohort (N=185) and Validation Cohort (N=76) of the AKD Prediction Model |
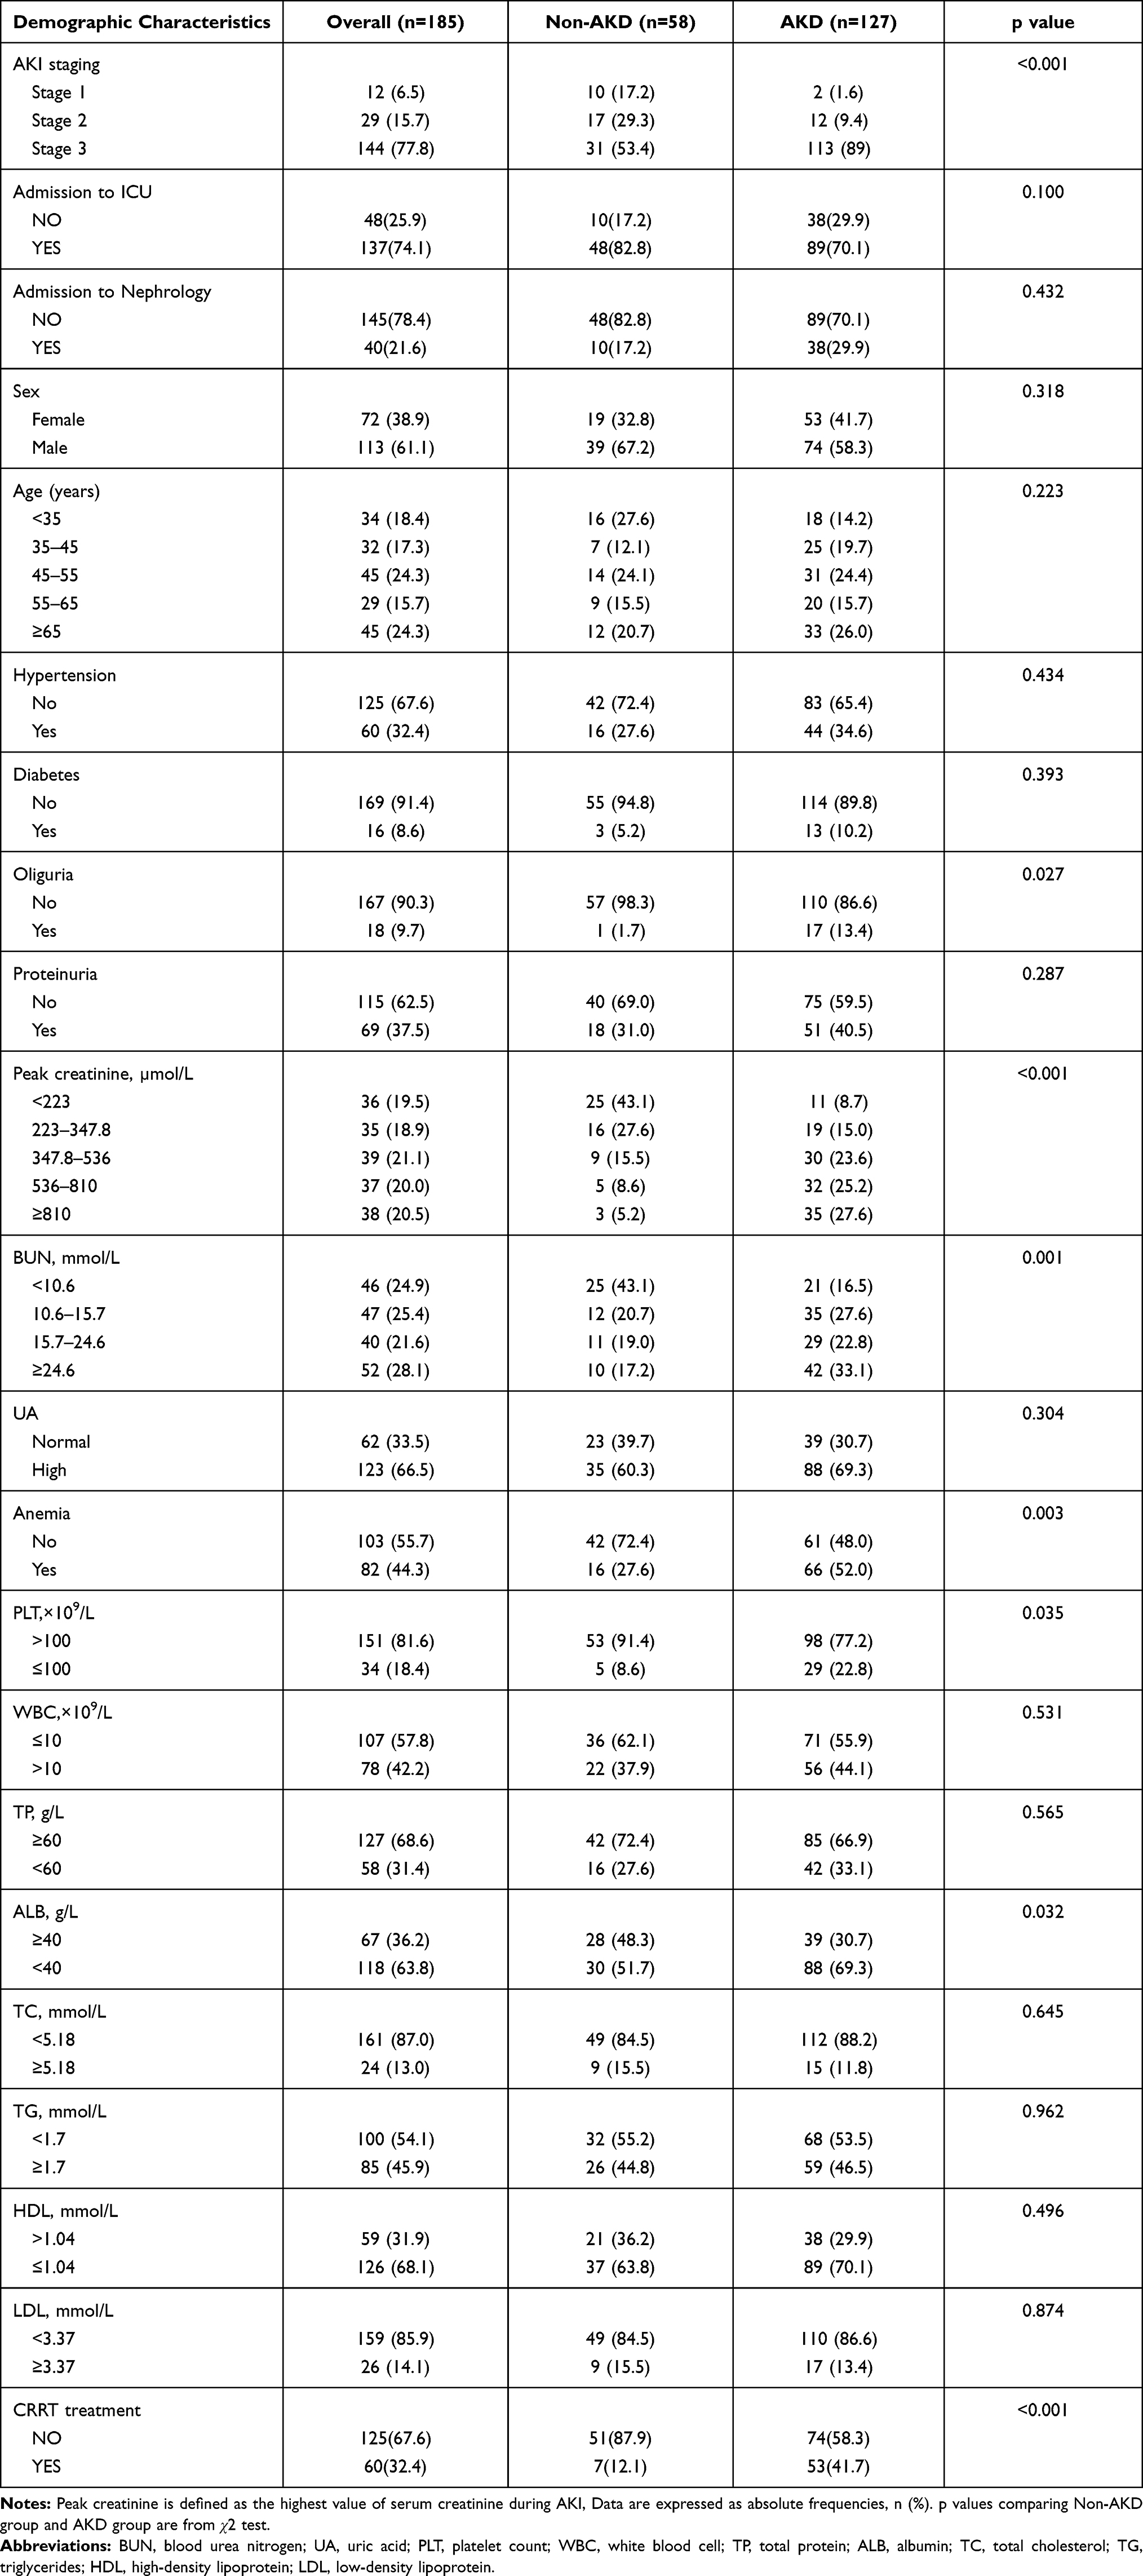 |
Table 2 Differences Between Demographic Characteristics of Non-AKD and AKD Groups in the Training Cohort |
Feature Selection
Among the demographic characteristics, clinical findings, and laboratory test results, 18 features including sex, age hypertension, diabetes, oliguria, proteinuria, anemia, BUN, peak creatinine, WBC, PLT, UA, TP, ALB, TG, TC, LDL, and HDL were reduced to six potential predictors based on 185 patients in the cohort (3:1 ratio; shown in Figure 2A and B). Their coefficients in the LASSO regression were nonzero. These six potential predictors included hypertension, diabetes, peak-creatinine, oliguria, anemia, and PLT. These factors were further subjected to MLR analysis. MLR analyses revealed that diabetes, peak creatinine, oliguria, and anemia were significantly associated with the presence of AKD (Figure 3).
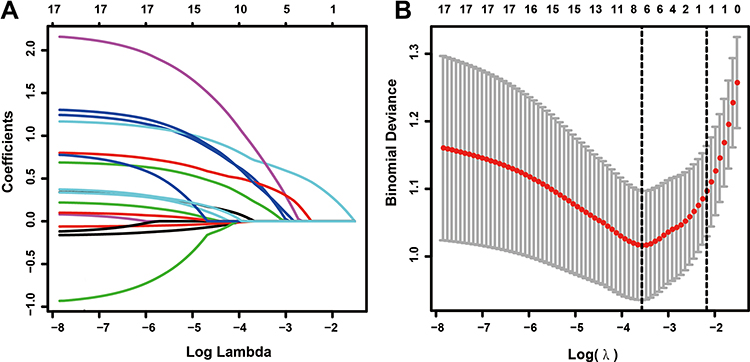 |
Figure 2 Feature selection using the LASSO regression analysis. (A) LASSO coefficient profiles of the non-zero variables of AKI patients. A coefficient profile plot was produced against the log (lambda) sequence. (B) Seven features with nonzero coefficients were selected by optimal lambda. By verifying the optimal parameter (lambda) in the LASSO model, the partial likelihood deviance (binomial deviance) curve was plotted versus log (lambda). |
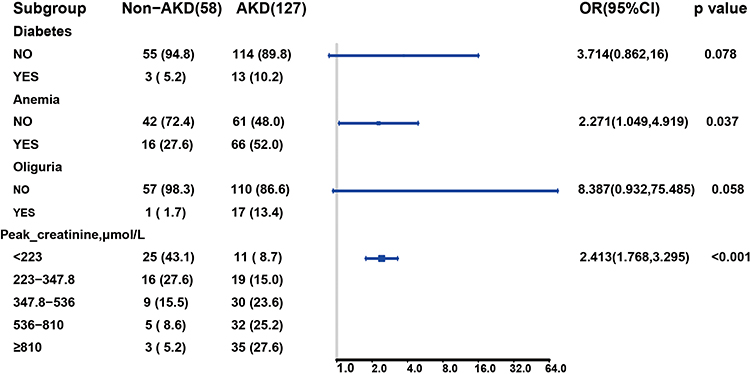 |
Figure 3 Multivariate regression analysis in predictive factors of AKD in the training cohort. OR and 95% CI are presented to show the risk of predictive factors. |
Nomogram Establishment and Validation
Based on the LASSO and MLR analyses, we established a model incorporating the significant risk factors to predict the probability of AKD and presented this model as a nomogram (Figure 4A). The equation describing the probability of AKD was as follows: P = 1/(1 + exp (2X)). In this equation, X = −2.1743 + 1.3120 × V1 + 0.8204 × V2 + 2.1267 × V3 +0.8810 × V4. V1 represents diabetes (0 if no diabetes and 1 if diabetes), V2 represents anemia (0 if no anemia and 1 if anemia), V3 represents oliguria (0 if no oliguria and 1 if oliguria), and V4 represents peak creatinine (1 if <223 µmol/L, 2 if 223–347.8 µmol/L, 3 if 347.8–536 µmol/L, 4 if 536–810 µmol/L, 5 if ≥810µmol/L). The calibration curve of the AKD risk nomogram in patients with AKI demonstrated good agreement (Figure 4B). The AUC of the ROC curve of the AKD risk nomogram in the training group (Figure 5A) was 0.834 (95% CI: 0.773–0.895), which denotes good performance.
 |
Figure 4 Nomogram for predicting AKD risk and a calibration curve of the nomogram. (A) Nomogram to estimate the risk of AKD presence in AKI patients. The nomogram to predict AKD was created based on four risk factors (Diabetes, Anemia, Oliguria, and Higher Peak-creatine level). The points of each variable are added to correspond to the total points line. (B) Calibration curve of the AKD predictive nomogram. The x-axis represents the predicted AKD risk. The y-axis represents the actual diagnosed AKD. The apparent and the bias-corrected values are close to each other, indicating that the nomogram has a good predictive performance. |
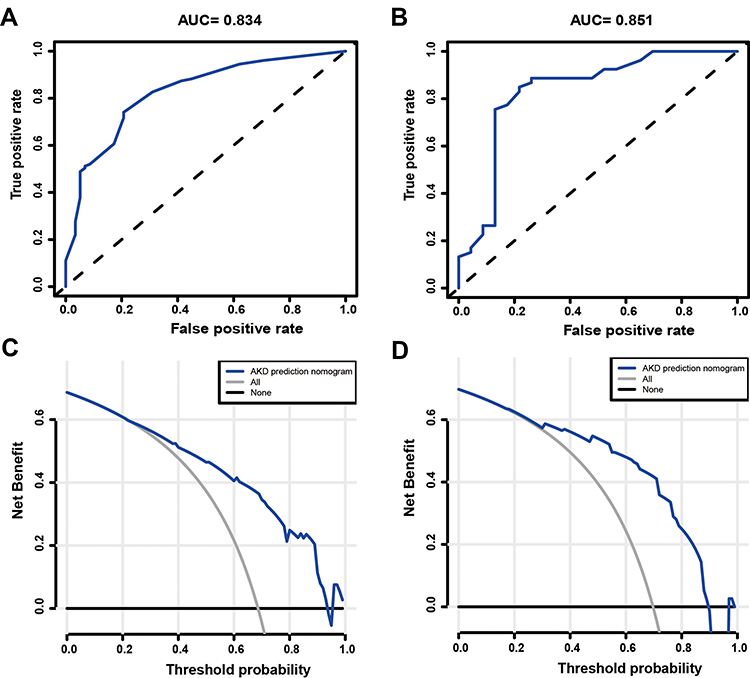 |
Figure 5 Evaluation of the prediction effect of the nomogram in the derivation (A and C) and validation (B and D) cohorts. (A and B) The pooled AUC of the ROC curve. The x-axis is the false positive rate of the risk prediction. The blue line represents the performance of the nomogram. The y-axis is the true positive rate of the risk prediction. (C and D) Decision curve analysis for the nomogram for predicting AKD risk in the AKI cohort. The x-axis is the probability. The y-axis measures the net benefit. The blue solid line is from the prediction model. The gray line represents the assumption that all AKI patients will develop into patients with AKD. The black line represents the assumption that no patients will develop into patients with AKD. |
The AKD risk nomogram was validated both internally and externally. In the internal validation, the C-index for the nomogram was 0.807. In the external validation, we confirmed the nomogram in the validation cohort of 76 patients. The AUC of the ROC curve in the validation set was 0.851 (95% CI: 0.753–0.949), which suggested good discrimination (Figure 5B). The AKD risk nomogram exhibited apparently good prediction capability.
Clinical Use
The decision curve analysis for the AKD risk nomogram is presented in Figure 5C–D. In the training group, threshold probabilities >22% and <93% received more benefit from using this nomogram to predict AKD risk (Figure 5C). The clinical net benefit of prediction models was confirmed using the validation cohort. The results for the validation cohort showed that using the nomogram to predict the risk of AKD was more beneficial between a threshold probability of 18% and 89% (Figure 5D).
We also developed a dynamic nomogram online APP to assist researchers and clinicians in predicting AKD probability in patients with AKI, under the following URL: https://yohou.shinyapps.io/DynNomapp/. In this tool, one can pull sliders for covariates (diabetes (0 if no diabetes and 1 if diabetes), anemia (0 if no anemia and 1 if anemia), oliguria (0 if no oliguria and 1 if oliguria), peak creatinine (1 if <223 µmol/L, 2 if 223–347.8 µmol/L, 3 if 347.8–536 µmol/L, 4 if 536–810 µmol/L, 5 if ≥810µmol/L)) and press the “predict” button to generate the probability of AKD occurrence and the corresponding 95% confidence intervals, which are plotted in the “Graphical Summary” tab.18 Clinicians can easily determine AKD probability by inputting the clinical features of patients and then reading the output graphs and tables generated by the web server.
Discussion
Currently, there are no practical tools to help clinicians identify patients who are likely to develop AKD, which makes the clinical examination of AKD difficult. The easy-to-understand AKD risk nomogram we developed using four risk factors (diabetes, anemia, oliguria, and peak creatinine) is the first to predict the individual probability of AKD for patients with AKI. We also developed a dynamic nomogram with a user-friendly digital interface, which can be used to facilitate clinical decisions. Moreover, the discrimination and robustness of our AKD risk nomogram were demonstrated by internal and external validation in an independent patient cohort.
Prevalence of AKD Among Patients with AKI
In our study, the prevalence rates of AKD in patients with AKI in the training and validation cohorts were 68.6% and 69.7%, respectively. In other words, AKI persisted in 68.6% or 69.7% of patients ≥7 days after the onset of AKI and for a duration <90 days. However, AKD cannot simply be conceptualized as a stage prior to CKD but occurring after AKI. We must be aware that many patients with evolving kidney disease may not meet the strict standards of AKI (or CKD), such as patients with uncertain or subacute kidney disease.
Main Risk Factors for AKD in Patients with AKI
Diabetes
Our study highlights diabetes as a risk factor for the development of AKD in patients with AKI, which is consistent with many other studies.19–21 See et al20 reported that diabetes was associated with poor long-term outcomes of AKI in a meta-analysis of cohort studies. In a Canadian population-based cohort study (n=190,714), Pannu et al found that participants with complicated diabetes were less likely to recover renal function.7 Furthermore, diabetes is a major cause of end-stage renal disease (ESRD). In summary, patients with AKI who have diabetes often exhibit poor prognosis, highlighting the importance of achieving better glycemic control in this population.
Anemia
Another factor influencing the probability of AKD in patients with AKI is anemia. A previous clinical trial reported that the presence of anemia is strongly associated with an increased risk of developing contrast-induced AKI (adjusted OR=5.3, 95% CI=3.8–7.3, P<0.001).22 In a retrospective study of 920 patients undergoing cardiopulmonary bypass, lowering the hemoglobin concentration by 1 g/dL increased the risk of AKI by 16% (95% CI=1.05–1.31, P=0.018).23 Despite the large number of articles that have reported that anemia is a key risk factor for AKI, few studies have investigated the association between anemia and transition from AKI to AKD. Researchers have proposed that hypoxia contributes to the progression of AKI and its transition to CKD/ESRD.24,25 Anemia can cause differential degrees of tissue hypoxia in the kidney. In theory, correction of anemia should ameliorate hypoxia and therefore decrease the probability of AKD in patients with AKI.22
Oliguria
Oliguria is significantly associated with the occurrence of AKD and is an important index in our nomogram. Although uncommon, its clinical appearance often indicates a more severe AKI stage and poor prognosis. Cheng et al reported that oliguria was an independent risk factor of 90-day or 1-year adverse prognosis (P<0.05) in hospitalized patients with post-contrast acute kidney injury.26 Similarly, a nationwide survey of patients with AKI revealed that oliguria occurrence at the time of AKI diagnosis was an independently significant prognostic indicator of in-hospital mortality.27 Transient oliguria may have a relatively benign nature; however, it is still a symptom of which clinicians must remain aware. Earlier intervention in patients with AKI who exhibit oliguria may prevent the development of AKD.
Peak Creatinine
Serum creatinine is the most common diagnostic marker of AKI.28 Increased creatinine may be caused by excessive production or decreased renal excretion, both of which are associated with the progression of AKI. In addition, James et al reported that the mortality risk generally rose with increasing peak creatinine.29
Limitations
First, the main limitation of our study is its retrospective nature. We were unable to fully exclude all potential biases, even though we employed stringent selection criteria. Second, we screened patients with AKI based on the clinical diagnosis from our medical record system. It is possible that some cases of AKI were not recognized by the electronic medical record system. We also excluded some patients with missing information, including several patients who died before developing AKD, which may have led to bias in our results. Third, the external validation cohort used in our study was not established using information from other hospitals. This was a single-center research study, and the findings should be corroborated by multicenter prospective studies with large sample sizes.
Despite these limitations, our results indicate that our nomogram predicting AKD probability may be an effective tool for improving our understanding of the basic process of AKD and improving outcomes in affected patients.
Conclusion
In this study, we developed and validated a model with good accuracy in predicting AKD risk in patients with AKI. Our findings also highlight the importance of diabetes mellitus as a risk factor for the progression to AKI. This nomogram can help clinicians evaluate the risk of AKD in patients with AKI and may provide evidence for incorporating assessments of AKD risk into clinical practice. Further studies are required to determine whether individual interventions based on this nomogram will reduce AKD risk and improve prognosis among patients with AKI.
Abbreviations
AUC, area under the curve; AKI, acute kidney injury; ICU, intensive care unit; CKD, chronic kidney disease; ESRD, end-stage kidney disease; AKD, acute kidney disease; ADQE, Acute Disease Quality Initiative; WBC, white blood cells; Hb, hemoglobin; PLT, platelets; BUN, blood urea nitrogen; Scr, serum creatinine; UA, uric acid; ALT, alanine aminotransferase; TP, total protein; ALB, blood Albumin; T-CHO, total cholesterol; TG, triglyceride; LDL, low-density lipoprotein; HDL, high-density lipoprotein; CRRT, continuous renal replacement therapy; LASSO, least absolute shrinkage and selection operator; MLR, multivariate logistic regression; OR, odds ratio; CI, confidence interval; DCA, decision curve analysis.
Data Sharing Statement
The datasets used or analyzed during the current study are available from the corresponding author: Zhangsuo Liu on reasonable request.
Ethical Approval and Consent to Participate
The research approval was obtained from the First Affiliated Hospital of Zhengzhou University’s Ethics Committee (approval no. 2019⁃KY⁃291). Patient consent to review their medical records was waived by the Ethics Committee and due to the retrospective nature of our study. The research was carried out in accordance with the Declaration of Helsinki (as revised in 2013). And we ensure the dignity of patients by making all patients’ information anonymous and confidential.
Acknowledgments
The authors are accountable for all aspects of the work in ensuring that questions related to the accuracy or integrity of any part of the work are appropriately investigated and resolved. Huanhuan Zhao and Lulu Liang are co-first authors in this study. Dongwei Liu and Zhangsuo Liu are co-correspondence authors for this study.
Author Contributions
All authors made substantial contributions to conception and design, acquisition of data, or analysis and interpretation of data; took part in drafting the article or revising it critically for important intellectual content; agreed to submit to the current journal; gave final approval of the version to be published; and agree to be accountable for all aspects of the work.
Funding
This work was supported by grants from National Science and Technology Major Project of China (Grant No. 2020ZX09201-009) and the National Key Research and Development Program (No.2016YFC1305404). There are no conflicts of interest to declare.
Disclosure
The authors have no conflicts of interest to declare.
References
1. Ronco C, Bellomo R, Kellum JA. Acute kidney injury. Lancet. 2019;394(10212):1949–1964. doi:10.1016/s0140-6736(19)32563-2
2. Hoste EA, Bagshaw SM, Bellomo R, et al. Epidemiology of acute kidney injury in critically ill patients: the multinational AKI-EPI study. Intensive Care Med. 2015;41(8):1411–1423. doi:10.1007/s00134-015-3934-7
3. Kellum JA, Chawla LS, Keener C, et al. The effects of alternative resuscitation strategies on acute kidney injury in patients with septic shock. Am J Respir Crit Care Med. 2016;193(3):281–287. doi:10.1164/rccm.201505-0995OC
4. Chawla LS, Eggers PW, Star RA, Kimmel PL. Acute kidney injury and chronic kidney disease as interconnected syndromes. N Engl J Med. 2014;371(1):58–66. doi:10.1056/NEJMra1214243
5. Palevsky PM, Liu KD, Brophy PD, et al. KDOQI US commentary on the 2012 KDIGO clinical practice guideline for acute kidney injury. Am J Kidney Dis. 2013;61(5):649–672. doi:10.1053/j.ajkd.2013.02.349
6. Chawla LS, Bellomo R, Bihorac A, et al. Acute kidney disease and renal recovery: consensus report of the acute disease quality initiative (ADQI) 16 workgroup. Nat Rev Nephrol. 2017;13(4):241–257. doi:10.1038/nrneph.2017.2
7. Bhatraju PK, Zelnick LR, Chinchilli VM, et al. Association between early recovery of kidney function after acute kidney injury and long-term clinical outcomes. JAMA Netw Open. 2020;3(4):e202682. doi:10.1001/jamanetworkopen.2020.2682
8. Chu R, Li C, Wang S, Zou W, Liu G, Yang L. Assessment of KDIGO definitions in patients with histopathologic evidence of acute renal disease. Clin J Am Soc Nephrol. 2014;9(7):1175–1182. doi:10.2215/cjn.06150613
9. Zhang Z, Navarese EP, Zheng B, et al. Analytics with artificial intelligence to advance the treatment of acute respiratory distress syndrome. J Evid Based Med. 2020;13(4):301–312. doi:10.1111/jebm.12418
10. Khan ZF, Alotaibi SR. Applications of artificial intelligence and big data analytics in m-health: a healthcare system perspective. J Healthc Eng. 2020;2020:8894694. doi:10.1155/2020/8894694
11. Friedman J, Hastie T, Tibshirani R. Regularization paths for generalized linear models via coordinate descent. J Stat Softw. 2010;33(1):1–22. doi:10.18637/jss.v033.i01
12. Kidd AC, McGettrick M, Tsim S, Halligan DL, Bylesjo M, Blyth KG. Survival prediction in mesothelioma using a scalable Lasso regression model: instructions for use and initial performance using clinical predictors. BMJ Open Respir Res. 2018;5(1):e000240. doi:10.1136/bmjresp-2017-000240
13. Iasonos A, Schrag D, Raj GV, Panageas KS. How to build and interpret a nomogram for cancer prognosis. J Clin Oncol. 2008;26(8):1364–1370. doi:10.1200/jco.2007.12.9791
14. Vickers AJ, Van Calster B, Steyerberg E. Decision curves, calibration, and subgroups. J Clin Oncol. 2017;35(4):472–473. doi:10.1200/jco.2016.69.1576
15. Pencina MJ, D’Agostino RB. Overall C as a measure of discrimination in survival analysis: model specific population value and confidence interval estimation. Stat Med. 2004;23(13):2109–2123. doi:10.1002/sim.1802
16. Vickers AJ, Cronin AM, Elkin EB, Gonen M. Extensions to decision curve analysis, a novel method for evaluating diagnostic tests, prediction models and molecular markers. BMC Med Inform Decis Mak. 2008;8(1):53. doi:10.1186/1472-6947-8-53
17. Zhang Z, Rousson V, Lee WC, et al. Decision curve analysis: a technical note. Ann Transl Med. 2018;6(15):308. doi:10.21037/atm.2018.07.02
18. Jalali A, Alvarez-Iglesias A, Roshan D, Newell J, Calabrese R. Visualising statistical models using dynamic nomograms. PLoS One. 2019;14(11):e0225253. doi:10.1371/journal.pone.0225253
19. Shah S, Leonard AC, Harrison K, Meganathan K, Christianson AL, Thakar CV. Mortality and recovery associated with kidney failure due to acute kidney injury. Clin J Am Soc Nephrol. 2020;15(7):995–1006. doi:10.2215/cjn.11200919
20. See EJ, Jayasinghe K, Glassford N, et al. Long-term risk of adverse outcomes after acute kidney injury: a systematic review and meta-analysis of cohort studies using consensus definitions of exposure. Kidney Int. 2019;95(1):160–172. doi:10.1016/j.kint.2018.08.036
21. Fortrie G, de Geus HRH, Betjes MGH. The aftermath of acute kidney injury: a narrative review of long-term mortality and renal function. Crit Care. 2019;23(1):24. doi:10.1186/s13054-019-2314-z
22. Sreenivasan J, Zhuo M, Khan MS, et al. Anemia (hemoglobin ≤ 13 g/dL) as a risk factor for contrast-induced acute kidney injury following coronary angiography. Am J Cardiol. 2018;122(6):961–965. doi:10.1016/j.amjcard.2018.06.012
23. Karkouti K, Wijeysundera DN, Yau TM, et al. Acute kidney injury after cardiac surgery: focus on modifiable risk factors. Circulation. 2009;119(4):495–502. doi:10.1161/circulationaha.108.786913
24. Venkatachalam MA, Weinberg JM, Kriz W, Bidani AK. Failed tubule recovery, AKI-CKD transition, and kidney disease progression. J Am Soc Nephrol. 2015;26(8):1765–1776. doi:10.1681/asn.2015010006
25. Tanaka S, Tanaka T, Nangaku M. Hypoxia as a key player in the AKI-to-CKD transition. Am J Physiol Renal Physiol. 2014;307(11):F1187–1195. doi:10.1152/ajprenal.00425.2014
26. Cheng W, Wu X, Liu Q, et al. Post-contrast acute kidney injury in a hospitalized population: short-, mid-, and long-term outcome and risk factors for adverse events. Eur Radiol. 2020;30(6):3516–3527. doi:10.1007/s00330-020-06690-3
27. Pan HC, Wu PC, Wu VC, et al. A nationwide survey of clinical characteristics, management, and outcomes of acute kidney injury (AKI) - patients with and without preexisting chronic kidney disease have different prognoses. Medicine (Baltimore). 2016;95(39):e4987. doi:10.1097/md.0000000000004987
28. Levey AS, Perrone RD, Madias NE. Serum creatinine and renal function. Annu Rev Med. 1988;39(1):465–490. doi:10.1146/annurev.me.39.020188.002341
29. James B, Sykes L, Flanagan E, Sinha S, Kalra P, Green D. Mortality risk by peak serum creatinine in hospital episodes complicated by acute kidney injury. Clin Med (Lond). 2020;20(Suppl 2):s109–s110. doi:10.7861/clinmed.20-2-s109
 © 2021 The Author(s). This work is published and licensed by Dove Medical Press Limited. The full terms of this license are available at https://www.dovepress.com/terms.php and incorporate the Creative Commons Attribution - Non Commercial (unported, v3.0) License.
By accessing the work you hereby accept the Terms. Non-commercial uses of the work are permitted without any further permission from Dove Medical Press Limited, provided the work is properly attributed. For permission for commercial use of this work, please see paragraphs 4.2 and 5 of our Terms.
© 2021 The Author(s). This work is published and licensed by Dove Medical Press Limited. The full terms of this license are available at https://www.dovepress.com/terms.php and incorporate the Creative Commons Attribution - Non Commercial (unported, v3.0) License.
By accessing the work you hereby accept the Terms. Non-commercial uses of the work are permitted without any further permission from Dove Medical Press Limited, provided the work is properly attributed. For permission for commercial use of this work, please see paragraphs 4.2 and 5 of our Terms.