")
Back to Journals » Diabetes, Metabolic Syndrome and Obesity » Volume 7
Diabetes disease progression in Goto-Kakizaki rats: effects of salsalate treatment
Authors Wang X, DuBois DC, Cao Y, Jusko WJ, Almon R
Received 9 April 2014
Accepted for publication 9 May 2014
Published 1 August 2014 Volume 2014:7 Pages 381—389
DOI https://doi.org/10.2147/DMSO.S65818
Checked for plagiarism Yes
Review by Single anonymous peer review
Peer reviewer comments 3
Xi Wang,1 Debra C DuBois,1,2 Yanguang Cao,2 William J Jusko,2,3 Richard R Almon1–3
1Department of Biological Sciences, University at Buffalo, Buffalo, NY, USA; 2Department of Pharmaceutical Sciences, University at Buffalo, Buffalo, NY, USA; 3New York State Center of Excellence in Bioinformatics and Life Sciences, Buffalo, NY, USA
Abstract: This study investigates the antidiabetic effects of salsalate on disease progression of diabetes in non-obese diabetic Goto-Kakizaki (GK) rats, an experimental model of type 2 diabetes. Salsalate was formulated in rat chow (1,000 ppm) and used to feed rats from 5 to 21 weeks of age. At 5 weeks of age, GK and Wistar (WIS) control rats were subdivided into four groups, each composed of six rats: GK rats with standard diet (GK-C); GK rats with salsalate-containing diet (GK-S); WIS rats with standard diet (WIS-C); and WIS rats with salsalate-containing diet (WIS-S). The GK-C rats (167.2±11.6 mg/dL) showed higher blood glucose concentrations than WIS-C rats (133.7±4.9 mg/dL, P<0.001) at the beginning of the experiment, and had substantially elevated blood glucose from an age of 15 weeks until sacrifice at 21 weeks (341.0±133.6 mg/dL). The GK-S rats showed an almost flat profile of blood glucose from 4 weeks (165.1±11.0 mg/dL) until sacrifice at 21 weeks of age (203.7±22.2 mg/dL). While this difference in blood glucose between 4 and 21 weeks in GK-S animals was significant, blood glucose at 21 weeks was significantly lower in GK-S compared to GK-C animals. At sacrifice, salsalate decreased plasma insulin (GK-S =1.0±0.3; GK-C =2.0±0.3 ng/mL, P<0.001) and increased plasma adiponectin concentrations (GK-S =15.9±0.7; GK-C =9.7±2.0 µg/mL, P<0.001). Salsalate also lowered total cholesterol in GK-S rats (96.1±8.5 mg/dL) compared with GK-C rats (128.0±11.4 mg/dL, P<0.001). Inflammation-related genes (Ifit1 and Iigp1) exhibited much higher mRNA expression in GK-C rats than WIS-C rats in liver, adipose, and muscle tissues, while salsalate decreased the Ifit1 and Iigp1 mRNA only in adipose tissue. These results suggest that salsalate acts to both increase adiponectin and decrease adipose tissue-based inflammation while preventing type 2 diabetes disease progression in GK rats.
Keywords: type 2 diabetes, salicylates, inflammation, adiponectin
Introduction
Type 2 diabetes mellitus (T2D) is a metabolic disorder that is characterized by elevated blood glucose. The two major physiological hallmarks of T2D are insulin resistance and relative insulin deficiency caused by β-cell failure. Patients with T2D have higher death rates regardless of sex, age, or other factors. The number of diabetes patients increased from 194 million worldwide in 1980 to 347 million in 2008.1 The World Health Organization (WHO) projects that diabetes will be the seventh leading cause of death in 2030.2 Prevention and treatment of T2D has become both urgent and a major challenge for human health.
Growing evidence has linked T2D with low-grade systemic inflammation.3 In humans, several immune gene alleles were identified by genome-wide association studies to have an association with increased risk of T2D.4 Furthermore, upregulation of proinflammatory gene expression and immune mediators, such as C-reactive protein, IL-6, and TNF-α, have been observed in T2D patients.5 In addition, unhealthy diets and sedentary lifestyles have also been shown to elicit a profound proinflammatory response.6–8 It is possible that existing low-grade systemic inflammation can be suppressed by experimental strategies aimed at blocking the production or action of proinflammatory signaling pathways, thereby treating T2D. The expression of many proinflammatory genes is enhanced by the transcription factor nuclear factor kappa beta (NF-κB). It has been demonstrated that impaired activation of NF-κB in myeloid cells by mutating IκB kinase β (IKK-β) can improve glucose tolerance and reduce high fat diet-induced insulin resistance in liver and muscle tissues from mice.9 Therefore, NF-κB could represent a potentially important therapeutic target for treating T2D, at least in some cases.
Recent attention has focused on the salicylate class of drugs, which are routinely used to reduce inflammation.10 Ebstein, in 1876, first published the effects of salicylates on glucose and noted that 5 g of sodium salicylate reduced glycosuria in patients with diabetes.11 In the late 1990s, researchers found that the drug salsalate (a non-acetylated dimer of salicylic acid), might also help diabetics.12 Recent studies confirm earlier observations.13–15 There are several studies12–15,18 on the glycemic effects of salicylates and aspirin (acetylated salicylic acid) in the literature, but the mechanism of antidiabetic effects of salsalate is still unclear. Recently, sodium salicylate and aspirin have been shown to inhibit activation of the transcription factor NF-κB by preventing IKK-β from degradation.16 High doses of aspirin have been shown to inhibit IKK-β and might therefore ameliorate insulin resistance and improve glucose tolerance in at least some patients with T2D.17 However, high-dose aspirin may cause severe side effects involving the gastrointestinal system. Salsalate is non-acetylated and is a better-tolerated form of salicylate, which acts similarly to aspirin and may be useful in the treatment of T2D. A few small clinical trials showed salsalate was effective in improving glycemic control in patients with T2D.14,18 However, the exact mechanism and effects of salsalate on treatment of T2D have not been completely determined.
The Goto-Kakizaki (GK) rat is a non-obese diabetic animal model. This established T2D rat strain was developed by selective breeding of more glucose intolerant Wistar (WIS) rats over 30 generations.19 The GK rat exhibits a spontaneous polygenic T2D and has decreased β-cell numbers and function.20 Previous studies in our laboratory indicated that the disease progression of GK rats is accompanied by chronic inflammation.21–23 Thus, the GK rat represents a good animal model for studying human T2D pathophysiology and the effects of therapeutic options. We have demonstrated that salsalate treatment of GK animals greatly ameliorated the hyperglycemia that developed in those animals.24 The current study is a follow-up designed to investigate mechanisms associated with salsalate effects in these diabetic GK rats.
Materials and methods
Animals
Twelve GK rats were received from Taconic Farm (Germantown, NY, USA) at the age of 4 weeks. Twelve age-matched WIS rats were purchased from Harlan Laboratories (Indianapolis, IN, USA). All animals were housed individually under standard laboratory animal conditions including a 12-hour/12-hour light/dark cycle with free access to water and food. These rats were divided into four groups of six animals each: diabetic GK rats with salsalate treatment (GK-S); GK rat controls without salsalate treatment (GK-C); nondiabetic WIS rats without salsalate treatment (WIS-C); and WIS rats with salsalate treatment (WIS-S). After 1 week of acclimation, non-salsalate-treated groups were fed a standard rat chow (AIN-76A with bacon flavor; TestDiet, Richmond, IN, USA), while salsalate-treated groups were fed the same diet containing 0.1% salsalate (1,000 ppm) until 21 weeks of age. Body weights and food intakes were measured every 2 days at constant times (9 am). Diet was changed every other day, and leftover food was weighed to assess food intake. Blood glucose in non-fasting animals was measured every week (Wednesday, 9 am) using a BD Logic™ blood glucose meter (BD, Franklin Lakes, NJ, USA). Animals were sacrificed at age 21 weeks. Blood was collected from each rat at sacrifice using ethylenediaminetetraacetic acid (EDTA) as anticoagulant. Blood was centrifuged at 2,000 ×g for 15 minutes at 4°C to prepare plasma, which was stored at –80°C. Adipose, liver, and muscle tissues were harvested at sacrifice and stored at –80°C for extraction/gene expression analysis by quantitative reverse transcription polymerase chain reaction (qRTPCR).
Plasma assays
Plasma total cholesterol (TC) was measured by an in vitro enzymatic method using Cholesterol E kit (Wako Diagnostics, Richmond, VA, USA) with modifications to a microtiter plate format. Standards (at seven different concentrations) with a linear range from 0 to 200 mg/dL were prepared from a commercial standard solution in the kit. Two quality controls were also made at high and low concentrations. Samples consisting of 10 μL plasma (triplicates) or standards (duplicates) were added into each well followed by 300 μL reconstituted color reagent. Absorbance was detected at 600 nm after 12 minutes’ incubation at 37°C. TC concentrations were calculated from absorbance of standards by linear regression.
Plasma triglycerides (TG) were measured using an enzymatic colorimetric assay, L-Type TGH (Wako Diagnostics) also modified to a plate format. Standards (seven concentrations) were constituted from the lipid calibrator provided in the kit. Ten-microliter plasma samples (triplicates) and standards (duplicates) were added to each well along with 80 μL enzyme color A. After 5 minutes’ incubation at 37°C, absorbance R1 was measured at 600 nm. Then, 40 μL enzyme color B was added into each well. Absorbance R2 was measured after 8 minutes’ incubation at 37°C. TG was calculated by subtracting R2 from R1 with linear regression.
Insulin in plasma taken at sacrifice was measured using the Ultra Sensitive Rat Insulin ELISA kit (Crystal Chem Inc., Downers Grove, IL, USA). Plasma adiponectin concentrations were measured using the Rat Adiponectin ELISA kit (ALPCO Diagnostics, Salem, NH, USA). All assays were performed according to the manufacturer’s instructions; standards were run in duplicate and experimental samples in triplicate.
qRTPCR assays
The quantity of adiponectin, interferon-inducible GTPase 1 (Iigp1), and interferon-induced protein with tetratricopeptide repeats 1 (Ifit1) messenger RNA (mRNA) from rat tissues were extrapolated from gene-specific in vitro transcribed complementary RNA (cRNA) standards as determined by real-time qRTPCR using TaqMan-based probes. Primers and probes sequences were designed and synthesized by Biosearch Technologies, Inc., (Petaluma, CA, USA). The Stratagene Brilliant qRT-PCR Core Reagent Kit 1-Step (Agilent Technologies, Santa Clara, CA, USA) was used to perform one-step qRT-PCR in a Stratagene MX3005P thermocycler (Agilent Technologies) according to the manufacturer’s instructions. In vitro transcribed sense cRNA standards were used to generate standard curves. Primer and probe sequences were as follows:
- Ifit1 forward primer: 5′ TGCCTGGGTGCATTACCA 3′
- Ifit1 reverse primer: 5′ GTAGCGGAAGGGACTTGAGAA 3′
- Ifit1 probe: 5′ FAM-CTTGGCAGAAGCCCAGATCTACCTG-BHQ1 3′
- Iigp1 forward primer: 5′ GCGACAATCTTTGAAGCAGAAGA 3′,
- Iigp1 reverse primer: 5′ GGAAGGTCAGTGAAGGGATGATG 3′
- Iigp1 probe: 5’ FAM-TTTGGCTCGAAGCCTTTGCAGC-BHQ1 3′
- Adiponectin forward primer: 5’ GAGACGCAGGTGTTCTTGGT 3′
- Adiponectin reverse primer: 5’ CTTCCGCTCCTGTCATTCCA 3′
- Adiponectin probe: 5’ FAM-CCTAAGGGTGACCCAGGAGATGC-BHQ1 3′
Samples were run in triplicate, and standards (seven concentrations) were run in duplicate. Additional no-reverse transcriptase controls were run for each RNA sample to ensure the absence of genomic DNA contamination; no-template controls were also run in each experiment as negative controls.
Statistical analysis
Intra-assay and inter-assay coefficient of variation% for all plasma and qRTPCR assays were less than 15%, and all r2 values of standard curves were greater than 0.99. Results are shown as mean ± standard deviation (SD). The comparison of values between groups was performed by using two-way analysis of variance (ANOVA) tests followed by the Holm–Sidak post hoc test on rank-transformed data, using SigmaStat software (version 3.5; Systat Software, San Jose, CA, USA). Critical significance was accepted at a P-value less than 0.05.
Results
Body weights and food intakes
Figure 1A compares mean body weights of GK and WIS animals fed salsalate in their diet with normal-diet-fed animals throughout the course of this study. As expected, all four groups of animals exhibited continuous increases in body weights, which were almost linear up through 12 weeks of age and then tended to plateau at later ages. The GK animals were slightly heavier than WIS animals throughout; this difference was significant (P<0.01) by the end of the study. There was a trend for lower body weights in salsalate fed animals compared to the same strain not receiving salsalate. However, there is no distinct difference in food intake when normalized to body weight in any of the groups (Figure 1B). This is consistent with previous modeling efforts suggesting that reduced body weight in salsalate-treated animals results from increased metabolic rate despite similar energy intakes.24 As no obvious difference existed in normalized food intake in GK-S and WIS-S, this suggested that GK and WIS rats consumed comparable amounts of salsalate per body weight. As confirmed by high-performance liquid chromatography analyses, this produced comparable salicylic acid concentrations in the blood of GK and WIS animals fed salsalate.24
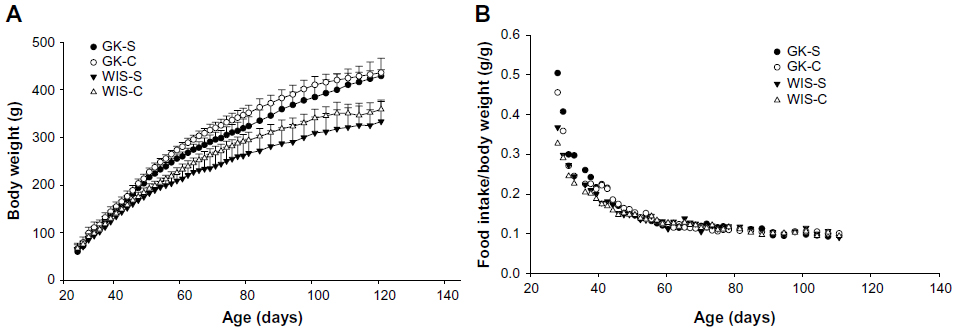 | Figure 1 Body weight and food intake with salsalate treatment. |
Blood glucose and plasma insulin
Untreated GK rats, which were 4 weeks old at the beginning of the experiment, showed mild hyperglycemia (167.2±11.6 mg/dL) that slowly progressed until 14 weeks old, indicating that disease was extant before 4 weeks of age. This observation is in agreement with previous report that T2D is evident in GK rats before birth.20 The blood glucose concentrations of GK-C rats substantially increased at 14 to 15 weeks and finally reached a plateau at around 18 weeks of age. Blood glucose concentrations of GK-C rats were significantly higher than WIS rats throughout the study (P<0.001). The concentrations of blood glucose in these four groups of animals have been previously published and well characterized by a disease progression model.24 The profile of the blood glucose concentrations in WIS-C, GK-S, and GK-C are illustrated in Figure 2. No significant differences were observed between WIS-C and WIS-S in blood glucose at any age, and their profiles were essentially superimposable. Although blood glucose concentrations of GK-S rats were still significantly higher than WIS rats, salsalate inhibited the continuous rise of blood glucose that occurred in non-drug-treated GKs and resulted in an essentially flat glucose profile in GK-S animals. As a consequence, blood glucose in GK-S rats was significantly lower (P<0.05) than in GK-C rats from 18 weeks of age onward. Plasma insulin concentrations were significantly lower in salsalate-treated rats at sacrifice (Figure 3), regardless of strain (GK-S =1.0±0.3; WIS-S =1.1±0.3; GK-C =2.0±0.3; WIS-C =1.9±0.3). These results suggest that salsalate enhanced insulin sensitivity.
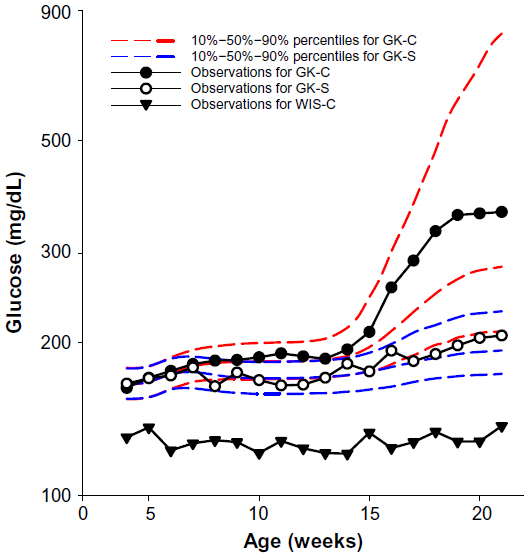 | Figure 2 Profiles of blood glucose with salsalate treatment. |
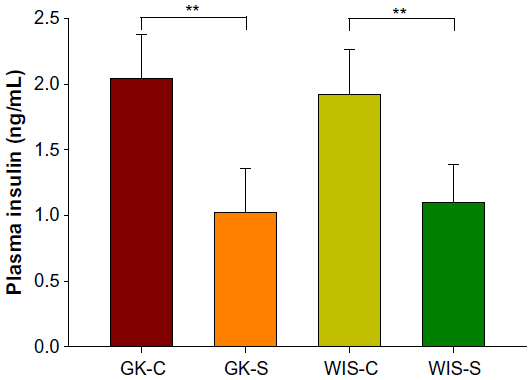 | Figure 3 Plasma insulin with salsalate treatment. |
Plasma lipids
Concentrations of TC and TG in plasma taken at sacrifice are presented in Figure 4. Although GK and WIS animals exhibited no significant differences in TC, salsalate therapy was associated with decreased plasma TC in both strains (Figure 4A: GK-S =96.1±8.5; WIS-S =98.0±16.6; GK-C =128.0±11.4; WIS-C =131.1±16.7 mg/dL). The WIS-C rats (93.7±34.2 mg/dL) showed significantly lower plasma TG than diabetic GK-C rats (162.9±46.6 mg/dL) at sacrifice (Figure 4B). While there was no significant effect of salsalate, plasma TG in GK-S animals (122.2±29.5 mg/dL) were intermediate between untreated GK and WIS animals. Other plasma lipids including plasma free fatty acids and low-density lipoprotein cholesterol were also measured, but no significant differences were observed (data not shown).
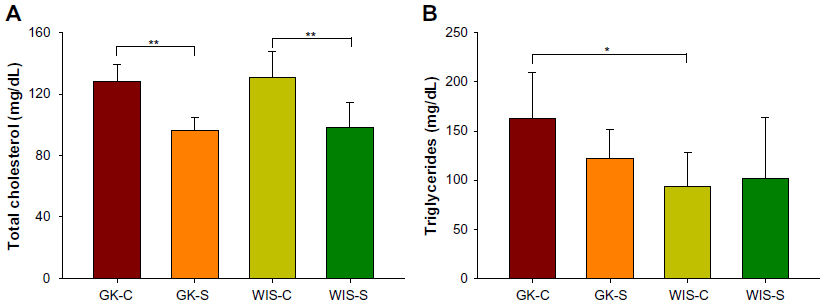 | Figure 4 Plasma lipids with salsalate treatment. |
Plasma adiponectin and adiponectin mRNA
At sacrifice, plasma adiponectin concentrations were much higher in salsalate-treated GK animals (15.9±0.7 μg/mL) than in GK control animals (9.7±2.0 μg/mL) (Figure 5A). However, this difference was not reflected in adiponectin mRNA (Figure 5B). These results suggest that salsalate might exert its antidiabetic effects through increasing plasma adiponectin by regulation of translation processes.
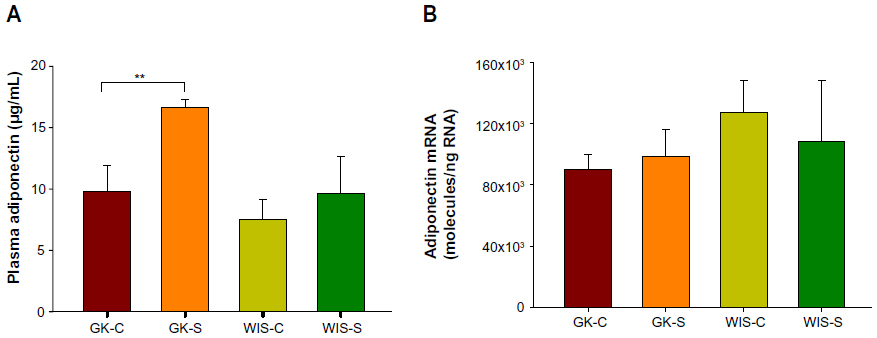 | Figure 5 Plasma adiponectin and adiponectin mRNA with salsalate treatment. |
Gene expression comparisons
Our previous studies on GK animals entailed microarray analyses of liver, adipose tissue, and skeletal muscle.21–23 We further examined two genes, both related in some way to inflammatory processes and previously identified as differentially regulated in all three tissues during the entire disease progression time course in our array studies. We developed specific and highly quantitative qRTPCR assays for both genes, and compared their expression in liver, adipose tissue, and muscle taken from all four groups of animals. The Ifit1 and Iigp1 expressions were significantly higher in all three tissues from untreated GK animals compared to WIS controls (Figures 6–8). The qRTPCR analyses in non-salsalate-treated GK rats from this study are consistent with results from our previous microarray studies.21–23 This suggests that heightened inflammation is present in GK rats. In adipose tissue, salsalate significantly decreased mRNA expression of Ifit1 and Iigp1 in GK animals (Figure 6), indicating that salsalate impacts the inflammation-related gene expression in adipose tissue. However, there was no therapeutic effect of salsalate shown in liver and muscle tissues from GK animals (Figures 7 and 8). In contrast, expression of Ifit1 mRNA in liver tissue of GK-S animals was higher than that in the GK-C group.
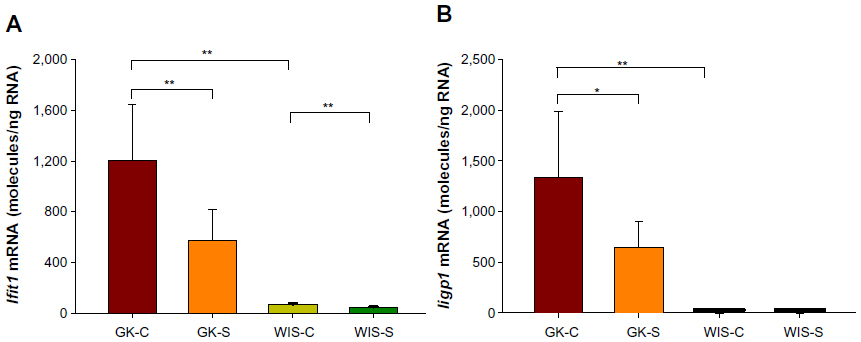 | Figure 6 Expression of genes reflecting inflammation in adipose tissue with salsalate treatment. |
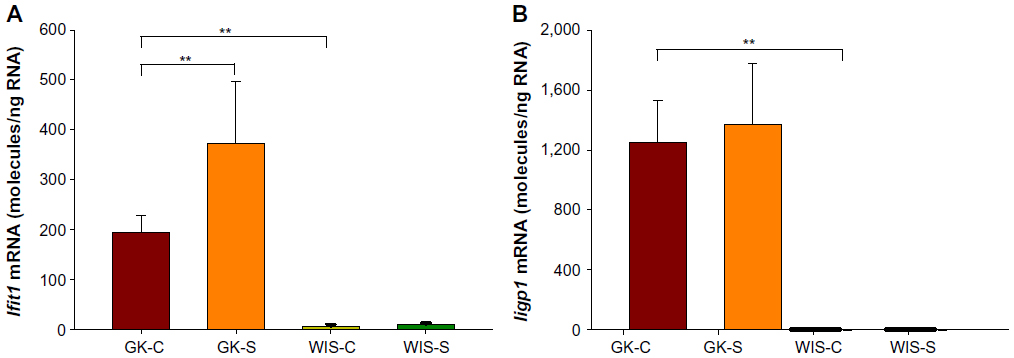 | Figure 7 Expression of genes reflecting inflammation in liver tissue with salsalate treatment. |
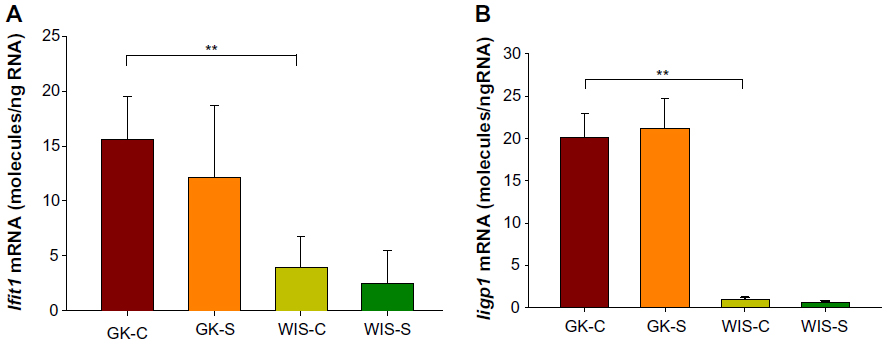 | Figure 8 Expression of genes reflecting inflammation in muscle tissue with salsalate treatment. |
Discussion
Although a rather heterogeneous disease, human T2D pathogenesis is characterized by two major hallmarks: insulin resistance and β-cell dysfunction. The present study further demonstrated that the GK rat is an appropriate animal model with which to study the etiology of T2D and is very useful for evaluating potential antidiabetic drug effects. In this study, untreated GK rats exhibited mild hyperglycemia at 4 weeks of age, which continued until age 14 weeks. Blood glucose concentrations sharply increased at the age of 14 weeks and reached a plateau at around 18 weeks. As reported previously, to a large degree, salsalate ameliorated T2D disease progression in GK rats as evidenced by the observation of more flattened blood glucose concentrations.24 This was reinforced by the reduction in insulin concentrations shown here, which suggests an increased insulin sensitivity with salsalate treatment.
We have previously described T2D disease progression in GK rats, which showed hyperglycemia in all ages accompanying hyperinsulinemia at around age 8 weeks with plasma insulin concentrations declining from week 12 to week 20.22 Although the time occurrence of insulin resistance in GK rats is not clear in the literature, our previous observation pointed out that insulin resistance is an important factor contributing to glucose intolerance. The progressively decreasing plasma insulin concentrations from an age of 12 to 20 weeks indicates that β-cell dysfunction is occurring, leading to development of overt diabetes. The magnitude of hyperglycemia and disease progression varied between the GK rats in this study and those used in our previous study. This difference could be a result of epigenetic differences in the two populations of GK rats. Epigenetics, which involves DNA modifications, histone modifications, and/or micro RNAs, results in the inherited changes in gene function without change in their coding sequence.25 There is also growing evidence suggesting that epigenetic mechanisms are associated with T2D.26
Evidence over recent years suggests that inflammation may be a common factor contributing to insulin resistance and β-cell dysfunction.4 Heightened chronic inflammation is also detected in GK rats with T2D. Our previous gene expression analysis in non-drug-treated GK rats revealed that chronic inflammation was present in liver, skeletal muscle, and adipose tissues of these animals. Based on microarray results, expression of two inflammation-related genes (Ifit1 and Iigp1) was measured by qRTPCR in the present study. Interferons (IFNs) are protein cytokines produced by immune cells against a variety of foreign agents, especially in response to virus infection. Correlations between high levels of IFNs and insulin resistance have been reported in both humans and animals.27,28 The higher expression of Ifit1 and Iigp1 genes in diabetic GK animal in the liver, adipose tissue, and muscle provides evidence of a heightened inflammatory state in these animals. Our results in non-salsalate-treated animals in this study are in agreement with our previous microarray results.21–23 Both Ifit1 and Iigp1 expressions were higher in non-salsalate-treated GK rats than in WIS rats in liver, skeletal muscle, and adipose tissue in the present study. Thus, targeting inflammation may be a viable strategy for treating T2D.
Salsalate and several salicylate-related drugs have been employed as anti-inflammatory therapy for treating diseases such as rheumatoid arthritis for decades; over a century ago, salicylates were shown to have the effect of lowering blood glucose in T2D patients.11,13,14,18 In the present study, salsalate resulted in flattened blood glucose concentrations over all ages in treated GK rats compared with untreated GK rats. Although the blood glucose concentrations of treated GK rats were still significantly higher than in control WIS rats, salsalate to a large extent controlled blood glucose, indicating that it ameliorated severe hyperglycemia and prevented T2D progression in treated diabetic GK rats. This finding is consistent with clinical trials.13–15,29 The pro-inflammation-related genes, Ifit1 and Iigp1, are two NF-κB responsive genes whose expressions were also lowered by salsalate in adipose tissue. Recent studies suggest that a state of chronic inflammation, specifically mediated by NF-κB, might be involved in the pathogenesis of insulin resistance.4,9 Salsalate has been reported to have the ability to inhibit transactivation of NF-κB by binding to IκB.16 Taken together, this suggests that salsalate might decrease inflammatory gene expression by inhibition of NF-κB. However, the present study demonstrates that these effects are prominent in adipose tissue only.
In addition, we observed increased plasma adiponectin in the salsalate-treated GK rats (Figure 5). Adiponectin is a hormone exclusively secreted from adipose tissue and is involved in regulating glucose as well as breakdown of fatty acids.30 A few clinical trials have indicated increased circulating adiponectin after administration of salsalate.13,15,29 Therefore, salsalate might exert its antidiabetic effects by increasing plasma adiponectin, although the mechanisms of this effect are not clear. In our study, increased expression of adiponectin mRNA did not occur. We have also noted a “disconnect” between plasma adiponectin and adiponectin mRNA expression in Zucker diabetic fatty rats, and others have reported similar results in Zucker fatty rats.31 Interestingly, previous studies demonstrated that adiponectin exerts its function partially by activating 5’ adenosine monophosphate-activated protein kinase (AMPK).32,33 AMPK is an emerging drug target for diabetes, since it plays an important role in regulating energy homeostasis. Activated AMPK can enhance insulin sensitivity and foster a metabolic milieu that may reduce the risk of T2D. A recent study also suggests that AMPK could be directly activated by salsalate. Kahn et al showed that aspirin and salicylate could activate AMPK in cells and in liver tissue from diabetic mice.34 Thus, salsalate may activate AMPK in multiple ways and further studies are warranted on this potential mechanism.
GK rats are a useful model for understanding diabetic disease progression and evaluating drugs for the treatment of T2D. Amelioration of hyperglycemia in these animals by salsalate resulted in decreased insulin output, increased plasma adiponectin concentrations, and a reduction of inflammatory gene expression in adipose tissue. One concern when interpreting results obtained when using animal models for disease is their applicability to the disease in humans. T2D in humans is a rather heterogeneous disease. In many cases, obesity and other conditions that cause chronic inflammation are associated with the development of T2D in humans. However, it is unclear if T2D caused by epigenetic factors such as perinatal exposure to corticosteroids or maternal diabetes is also driven by chronic inflammation or by other factors. Therefore, it is possible that salsalate may be therapeutically effective in only a subset of humans and animals with T2D.
Acknowledgment
This work was supported by NIH Grant GM 24211.
Disclosure
The authors report no conflicts of interest in this work.
References
Maruthur NM. The growing prevalence of type 2 diabetes: increased incidence or improved survival? Curr Diab Rep. 2013;13(6):786–794. | |
World Health Organization. Geneva: Global status report on noncommunicable diseases 2010. Available from: http://www.who.int/nmh/publications/ncd_report_full_en.pdf. Accessed July 24, 2014. | |
Nowlin SY, Hammer MJ, D’Eramo Melkus G. Diet, inflammation, and glycemic control in type 2 diabetes: an integrative review of the literature. J Nutr Metab. 2012;2012:542698. | |
Kempf K, Rose B, Herder C, Kleophas U, Martin S, Kolb H. Inflammation in metabolic syndrome and type 2 diabetes: impact of dietary glucose. Ann N Y Acad Sci. 2006;1084:30–48. | |
Navarro-Gonzalez J, Mora-Fernandez C, Gomez-Chinchon M, Muros M, Herrera H, Garcia J. Serum and gene expression profile of tumor necrosis factor-alpha and interleukin-6 in hypertensive diabetic patients: effect of amlodipine administration. Int J Immunopathol Pharmacol. 2010;23(1):51–59. | |
Mann S, Beedie C, Balducci S, et al. Changes in insulin sensitivity in response to different modalities of exercise: a review of the evidence. Diabetes Metab Res Rev. 2014;30(4):257–268. | |
Kolb H, Mandrup-Poulsen T. An immune origin of type 2 diabetes? Diabetologia. 2005;48(6):1038–1050. | |
Pietraszek A, Gregersen S, Hermansen K. Acute effects of dietary fat on inflammatory markers and gene expression in first-degree relatives of type 2 diabetes patients. Rev Diabet Stud. 2011;8(4):477–489. | |
Arkan MC, Hevener AL, Greten FR, et al. IKK-beta links inflammation to obesity-induced insulin resistance. Nat Med. 2005;11(2):191–198. | |
Reymond P, Farmer EE. Jasmonate and salicylate as global signals for defense gene expression. Curr Opin Plant Biol. 1998;1(5):404–411. | |
Ebstein W. Zur therapie des Diabetes mellitus, insbesondere über die Anwendung des salicylsauren Natron bei demselben. Berliner Klinische Wochenschrift. 1876;13:4. German. | |
Kim JK, Kim YJ, Fillmore JJ, et al. Prevention of fat-induced insulin resistance by salicylate. J Clin Invest. 2001;108(3):437–446. | |
Fleischman A, Shoelson SE, Bernier R, Goldfine AB. Salsalate improves glycemia and inflammatory parameters in obese young adults. Diabetes Care. 2008;31(2):289–294. | |
Goldfine AB, Conlin PR, Halperin F, et al. A randomised trial of salsalate for insulin resistance and cardiovascular risk factors in persons with abnormal glucose tolerance. Diabetologia. 2013;56(4):714–723. | |
Goldfine AB, Fonseca V, Jablonski KA, et al. The effects of salsalate on glycemic control in patients with type 2 diabetes: a randomized trial. Ann Intern Med. 2010;152(6):346–357. | |
Kopp E, Ghosh S. Inhibition of NF-kappa B by sodium salicylate and aspirin. Science. 1994;265(5174):956–959. | |
Hundal RS, Petersen KF, Mayerson AB, et al. Mechanism by which high-dose aspirin improves glucose metabolism in type 2 diabetes. J Clin Invest. 2002;109(10):1321–1326. | |
Faghihimani E, Aminorroaya A, Rezvanian H, Adibi P, Ismail-Beigi F, Amini M. Salsalate improves glycemic control in patients with newly diagnosed type 2 diabetes. Acta Diabetol. 2013;50(4):537–543. | |
Goto Y, Suzuki K, Ono T, Sasaki M, Toyota T. Development of diabetes in the non-obese NIDDM rat (GK rat). Adv Exp Med Biol. 1988;246:29–31. | |
Portha B, Giroix MH, Tourrel-Cuzin C, Le-Stunff H, Movassat J. The GK rat: a prototype for the study of non-overweight type 2 diabetes. Methods Mol Biol. 2012;933:125–159. | |
Nie J, Xue B, Sukumaran S, Jusko WJ, DuBois DC, Almon RR. Differential muscle gene expression as a function of disease progression in Goto-Kakizaki diabetic rats. Mol Cell Endocrinol. 2011;338(1–2):10–17. | |
Almon RR, DuBois DC, Lai W, Xue B, Nie J, Jusko WJ. Gene expression analysis of hepatic roles in cause and development of diabetes in Goto-Kakizaki rats. J Endocrinol. 2009;200(3):331–346. | |
Xue B, Sukumaran S, Nie J, Jusko WJ, DuBois DC, Almon RR. Adipose tissue deficiency and chronic inflammation in diabetic Goto-Kakizaki rats. PLoS One. 2011;6(2):e17386. | |
Cao Y, DuBois DC, Sun H, Almon RR, Jusko WJ. Modeling diabetes disease progression and salsalate intervention in Goto-Kakizaki rats. J Pharmacol Exp Ther. 2011;339(3):896–904. | |
Egger G, Liang G, Aparicio A, Jones PA. Epigenetics in human disease and prospects for epigenetic therapy. Nature. 2004;429(6990):457–463. | |
Ling C, Groop L. Epigenetics: a molecular link between environmental factors and type 2 diabetes. Diabetes. 2009;58(12):2718–2725. | |
Mofredj A, Howaizi M, Grasset D, et al. Diabetes mellitus during interferon therapy for chronic viral hepatitis. Dig Dis Sci. 2002;47(7):1649–1654. | |
Li Z, Soloski MJ, Diehl AM. Dietary factors alter hepatic innate immune system in mice with nonalcoholic fatty liver disease. Hepatology. 2005;42(4):880–885. | |
Koska J, Ortega E, Bunt JC, et al. The effect of salsalate on insulin action and glucose tolerance in obese non-diabetic patients: results of a randomised double-blind placebo-controlled study. Diabetologia. 2009;52(3):385–393. | |
Bruun JM, Lihn AS, Verdich C, et al. Regulation of adiponectin by adipose tissue-derived cytokines: in vivo and in vitro investigations in humans. Am J Physiol Endocrinol Metab. 2003;285(3):E527–E533. | |
Oana F, Takeda H, Hayakawa K, et al. Physiological difference between obese (fa/fa) Zucker rats and lean Zucker rats concerning adiponectin. Metabolism. 2005;54(8):995–1001. | |
Kadowaki T, Yamauchi T. Adiponectin receptor signaling: a new layer to the current model. Cell Metab. 2011;13(2):123–124. | |
Yamauchi T, Kamon J, Minokoshi Y, et al. Adiponectin stimulates glucose utilization and fatty-acid oxidation by activating AMP-activated protein kinase. Nat Med. 2002;8(11):1288–1295. | |
Kahn BB, Alquier T, Carling D, Hardie DG. AMP-activated protein kinase: ancient energy gauge provides clues to modern understanding of metabolism. Cell Metab. 2005;1(1):15–25. |
 © 2014 The Author(s). This work is published and licensed by Dove Medical Press Limited. The full terms of this license are available at https://www.dovepress.com/terms.php and incorporate the Creative Commons Attribution - Non Commercial (unported, v3.0) License.
By accessing the work you hereby accept the Terms. Non-commercial uses of the work are permitted without any further permission from Dove Medical Press Limited, provided the work is properly attributed. For permission for commercial use of this work, please see paragraphs 4.2 and 5 of our Terms.
© 2014 The Author(s). This work is published and licensed by Dove Medical Press Limited. The full terms of this license are available at https://www.dovepress.com/terms.php and incorporate the Creative Commons Attribution - Non Commercial (unported, v3.0) License.
By accessing the work you hereby accept the Terms. Non-commercial uses of the work are permitted without any further permission from Dove Medical Press Limited, provided the work is properly attributed. For permission for commercial use of this work, please see paragraphs 4.2 and 5 of our Terms.