Back to Journals » Risk Management and Healthcare Policy » Volume 14
Development Trend of Infectious Disease Hospitals in China 2002–2018: A Longitudinal Analysis of National Survey Data
Authors Wang QL, Huang BH, Liu WP, Yi HG, Tang SW ![]()
Received 20 October 2020
Accepted for publication 10 December 2020
Published 13 January 2021 Volume 2021:14 Pages 155—162
DOI https://doi.org/10.2147/RMHP.S287841
Checked for plagiarism Yes
Review by Single anonymous peer review
Peer reviewer comments 3
Editor who approved publication: Professor Marco Carotenuto
Qing-Liang Wang,1 Bing-Hua Huang,2 Wen-Pei Liu,3 Hong-Gang Yi,3 Shao-Wen Tang3
1Department of Medical Affairs, Qilu Hospital of Shandong University, Jinan, People’s Republic of China; 2Department of Hospital-Acquired Infection Prevention and Control, The Second Affiliated Hospital of Shandong University of Traditional Chinese Medicine, Jinan, People’s Republic of China; 3Department of Epidemiology and Biostatistics, School of Public Health, Nanjing Medical University, Nanjing, People’s Republic of China
Correspondence: Qing-Liang Wang
Department of Medical Affairs, Qilu Hospital of Shandong University, 107 Wenhuaxi Road, Lixia District, Jinan, Shandong Province 250012, People’s Republic of China
Email [email protected]
Shao-Wen Tang
Department of Epidemiology and Biostatistics, School of Public Health, Nanjing Medical University, 818 Tianyuandong Road, Jiangning District, Nanjing, Jiangsu Province 211166, People’s Republic of China
Email [email protected]
Background: Infectious disease hospitals (IDHs) play very important roles in the battle against the infectious disease. The present study aims to systematically analyze the development trends and possible problems of IDHs in China.
Methods: Most of the data came from the China Health Statistics Yearbook 2003– 2019. Joinpoint Regression Model was used to analyze the development trends of IDHs between 2002 and 2018.
Results: From 2002 to 2018, the number of IDHs in China increased from 126 to 167, with an average annual percent change (AAPC) of 1.82%. The ratio of nurses to beds increased from 0.38 to 0.46 with the AAPC of 0.88%, and average business housing area per bed increased with an AAPC of 1.97%. The percentage of liabilities to total assets increased year by year and the percentage of medical business costs to total expenditure decreased. The segmented trend of daily visits per physician from 2014 to 2018 was stable, and the segmented trend of daily inpatients per physician from 2012 to 2018 decreased significantly. In 2017, the rates of surgical inpatients leaving the hospital without the doctor’s advice and surgical inpatients mortality were higher than 2016.
Conclusion: Although the development of IDHs was generally good in China, the scale of IDHs was generally small, the ability to respond to major emergencies was weak, the problem of irrational resource allocation was still prominent, and the operation of IDHs was facing a dilemma.
Keywords: infectious disease hospital, trend analysis, longitudinal analysis, national survey data
Introduction
The novel coronavirus 2019 (COVID-19), which started as an outbreak in China in December 2019,1 has rapidly spread all over the world, such that on March 11, 2020 the WHO declared this disease as a pandemic.2 China has included COVID-19 in the Class B infectious diseases as stipulated in the Law of the People’s Republic of China on the Prevention and Control of Infectious Diseases, and has adopted prevention and control measures for Class A infectious diseases.3 According to the report of the WHO (as of April 18, 2020), the current outbreak of COVID-19 has affected over 2,164,111 people and killed more than 146,198 people in more than 200 countries throughout the world.4 Although the existing evidence has proved that masks are effective in preventing the spread of COVID-19, at the same time adequate social distance, diligent hand hygiene and other effective preventive measures should be taken.5 The emergence of COVID-19 has exposed the weaknesses of the global public health system, including emergency response capabilities for emerging infectious diseases and the formulation of emergency policies.6
Actively treating patients, especially critically ill patients, was one of the important tasks in response to the COVID-19 pandemic. Therefore, infectious disease hospitals (IDHs) played a vital role in the treatment of patients with COVID-19, even including various other infectious diseases. After the closure of Wuhan City, regular wards in all hospitals, as well as gymnasiums, conference centers, and other public buildings, were transformed into quarantine wards and medical resources nationwide, including medical staff, equipment, and diagnostic agents, were rapidly concentrated in Wuhan.7 Two hospitals, Huoshenshan and Leishenshan, were built in 16 days, with a total capacity of 2600 beds, enabling patients to receive effective treatment. China’s tremendous efforts to stop the epidemic have prevented further transmission of COVID-19 within China. In fact, after the severe acute respiratory syndrome (SARS) pandemic in 2003, China’s IDHs entered a period of rapid construction and development, and made some achievements. However, with the steady incidence of infectious diseases in China in recent years and the deepening of the new medical reform, the continued existence and development of IDHs is facing many difficulties and challenges.8–10 The COVID-19 pandemic re-exposed problems in the development of China’s IDHs. This study intends to describe the current development situation and explore the existing problems of IDHs in China through the analysis of relevant data and materials.
Methods
Data Collection
Most of the data in this study was obtained from the China Health Statistics Yearbook 2003–2019, and the variables in the data set included the number of IDHs, the number of licensed (assistant) physicians, the number of registered nurses, building area, assets and liabilities, medical income and expenditure, the number of hospital beds, hospital medical business status, and medical resource utilization. The numbers of notifiable infectious diseases in various regions in 2018 were mainly from monthly or annual data published on the official website of the health administrative departments or the Centers for Disease Control and Prevention (CDCs) of various regions. In 2018, there were 39 notifiable infectious diseases in China, including Class A (2 infectious diseases), Class B (26 infectious diseases), and Class C (11 infectious diseases). The data of proportions of beds in negative pressure wards (NPWs) and intensive care units (ICUs), and medical services, quality and safety in IDHs from 2016 to 2017 came from the National Report on the Services, Quality and Safety in Medical Care System 2018, which was conducted by the National Health Commission and surveyed all 125 IDHs in 2017 and 146 IDHs in 2018 nationwide.11 Data for the Hong Kong Special Administrative Region, Macau Special Administrative Region and Taiwan was not included in this study.
Data Check and Process
First, a data check was conducted to find the abnormal values. The data on paper and online were compared to determine their accuracy. Second, multiple methods were used to impute missing data. For example, the numbers of notifiable infectious diseases in Qinghai Province and the Tibet Autonomous Region in 2018 and 2017 were not available on the official websites, and the 2017 data of the two regions on the Public Health Science Data Center of the Chinese CDC were used (the database is currently updated only up to 2017). The data for most months of the numbers of notifiable infectious diseases in Yunnan Province in 2018 were not available on the official website, so the data in 2017 was used. The data for June 2018 of the Ningxia Hui Autonomous Region and Xinjiang Uygur Autonomous Region was not available, and the average values of the data of June 2017 and June 2019 for the two regions were used to fill in the missing data, respectively. There was no economic data in the China Health Statistics Yearbook 2004, so the average values of two adjacent data were used to fill in the missing economic data for 2003. Third, all data from 2002 to 2018 were categorized into six dimensions (number of IDHs, medical personnel, building area, economic situation, medical workload, number of beds and utilization) and 35 indicators. Since the numbers of hospital beds in IDHs by region were not available, the numbers of infectious disease beds in all hospitals by region were used for analysis.
Statistical Analysis
The mean, percentage, ratio, daily visits per physician, daily inpatients per physician, bed turnover times, bed working days, bed utilization rate, and average length of stay (ALOS) were calculated based on the original data. Some proportions were calculated by the following formula: daily visits per physician=number of outpatient visits/number of licensed (assistant) physicians/251, daily inpatients per physician=total bed days occupied by inpatients/number of licensed (assistant) physicians/365, bed turnover time=number of discharged patients/average number of hospital beds, bed working days=total bed days occupied by inpatients/average number of hospital beds, bed utilization rate=total bed days occupied by inpatients/total open bed days×100%, ALOS=total bed days occupied by discharged patients/number of discharged patients. The following two formulas were used to calculate the data from the World Health Statistics: the ratio of nurses to beds=the number of nursing and midwifery personnel (per 10,000 population)/the number of hospital beds (per 10,000 population), the ratio of nurses to physicians=the number of nursing and midwifery personnel (per 10,000 population)/the number of physicians (per 10,000 population).
Microsoft Excel 2019 software (Microsoft Corp.) was used to make geographic information maps. Joinpoint Regression Model (version 4.8.0.1, April, 2020; Statistical Research and Applications Branch, National Cancer Institute) was used to analyze the development trends of IDHs between 2002 and 2018.12 Since this study had 17 data points, the maximum number of joinpoints for all models was limited to three (four line segments) according to the algorithmic recommendations.13 The general trend of an indicator from 2002 to 2018 was expressed as an average annual percent change (AAPC),14 and if the AAPC was within one segment, t-test was used to examine whether the AAPC was statistically different from zero. Otherwise, Z test was used. A segmented trend was expressed as an annual percent change (APC), and t-test was used to examine statistical difference. The terms “increase”, “upward”, “decrease”, or “downward” were used to describe the statistically significant AAPC or APC, and the term “stable” was used to describe the trends without statistical significance. Chi-squared test was used to examine the differences of the proportion of beds in NPWs and ICUs in IDHs between 2016 and 2017. All analyses were performed using R software for Windows version 3.5.3 (https://www.r-project.org/). A two-tailed p<0.05 was regarded as statistically significant.
Results
Trends in the Number of IDHs
The number of IDHs in China increased from 126 to 167 from 2002 to 2018, with an AAPC of 1.82% (p<0.05) (Table 1). The trend line was segmented into two parts by Joinpoint Regression Model: the first part was the growth period from 2002 to 2009, when the number of IDHs increased from 126 to 162, with an APC of 3.79% (p<0.05); the second part was the stable period from 2009 to 2018, when the number of IDHs changed little, from 162 to 167, with an APC of 0.32% (p>0.05) (Table S1). IDHs were grouped by the number of beds to observe the trend in the number of hospitals in each group from 2002 to 2018, and the results showed that the numbers of IDHs in the four groups with beds ≥300 displayed upward trends, the numbers of IDHs with bedsbetween 100 and 200 displayed a downward trend, and the numbers in the remaining two groups displayed stable trends (Table 1, Figure S1, Table S1, Table S2).
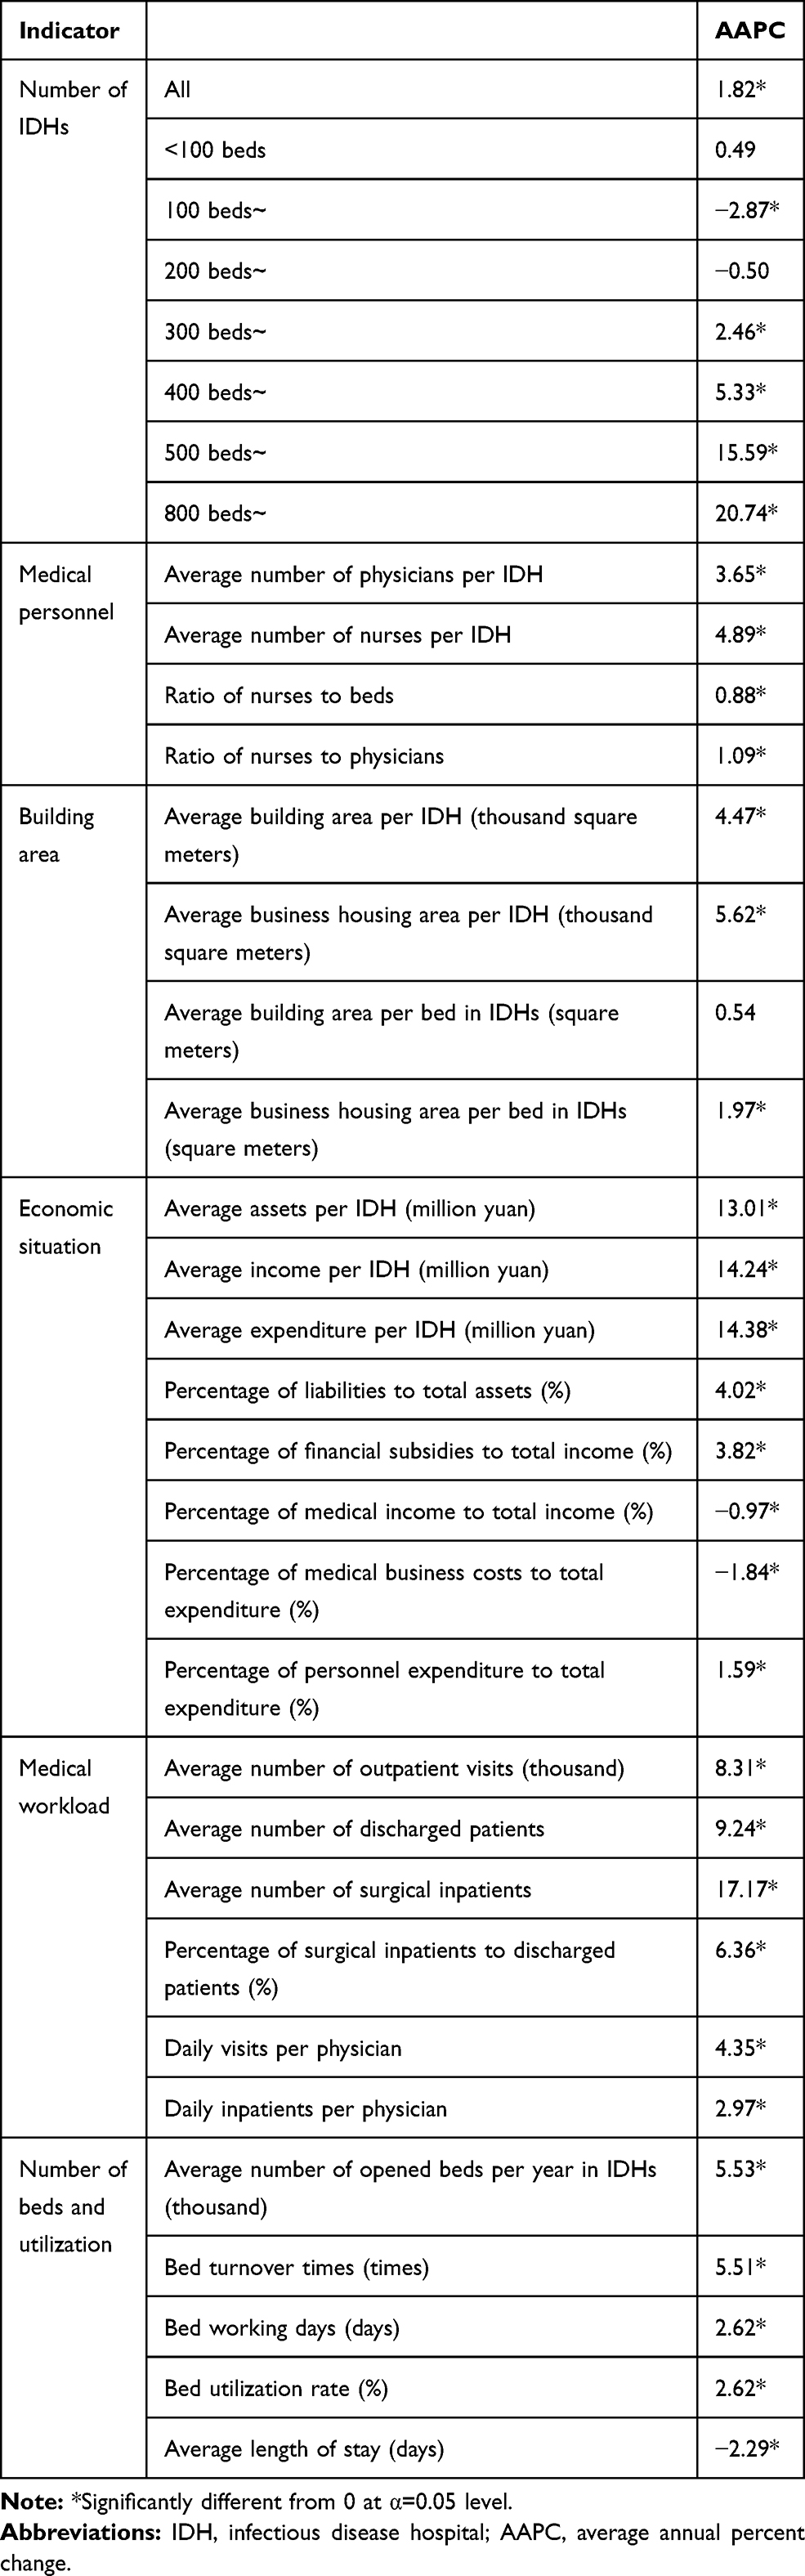 |
Table 1 Temporal Trends Analysis for Development of IDHs in China, 2002–2018 |
Resources in IDHs
From 2002 to 2018, the average numbers of licensed (assistant) physicians and registered nurses per IDH in China increased from 50.39 to 90.01 and from 71.05 to 149.95, and the AAPC were 3.65% and 4.89% (both p<0.05), respectively. The ratio of nurses to beds increased from 0.38 to 0.46, with an AAPC of 0.88% (p<0.05), and the ratio of nurses to physicians increased from 1.41 to 1.67, with an AAPC of 1.09% (p<0.05) (Table 1, Table S2, Figure S2).
The average building area and the average business housing area per IDH increased from 15.34 thousand square meters to 29.62 thousand square meters and from 9.16 thousand square meters to 22.64 thousand square meters, and the AAPC was 4.47% and 5.62% (p<0.05), respectively; the average business housing area per bed of IDH also showed a statistically significant upward trend, but the growth trend of average building area per bed of IDH was stable (Table 1, Table S2, Figure S3).
The trends of the eight economic indicators were statistically significant, two of which were decreasing trends (percentage of medical income to total income, percentage of medical business costs to total expenditure) and the remaining six indicators were increasing trends (average assets/income/expenditure per IDH, percentage of liabilities to total assets, percentage of financial subsidies to total income, and percentage of personnel expenditure to total expenditure) (Table 1, Table S2, Figure S4).
From 2002 to 2018, the average number of open beds per year in China’s IDHs increased from 23.49 thousand to 54.53 thousand, with an AAPC of 5.53% (p<0.05) (Table 1, Table S2, Figure S5). The distribution of the number of infectious disease beds in all hospitals by region was not consistent with the distribution of the number of notifiable infectious diseases by region in 2018 (Table 2, Figure S6). The proportion of the beds in negative pressure wards to the total number of open beds decreased from 3.47% to 2.81%, and the proportion of beds in intensive care units increased from 1.28% to 1.29% (both p>0.05), in IDHs from 2016 to 2017 (Table 3).
 |
Table 2 The Number of Infectious Disease Beds in IDHs and Notifiable Infectious Diseases by Region in 2018 |
 |
Table 3 The Proportion of Beds in NPWs and ICUs in Sampled IDHs, 2016–2017 |
Medical Business Situation of IDHs
From 2002 to 2018, the average numbers of outpatient visits, discharged patients and surgical inpatients, per IDH, increased from 32.77 thousand to 115.26 thousand, from 1671.54 to 6656.35, and from 102.77 to 1075.10, with an AAPC of 8.31%, 9.24% and 17.71% (all p<0.05), respectively. The trends of the percentage of surgical inpatients to discharged patients, daily visits per physician, and daily inpatients per physician were all increasing (Table 1, Table S2, Figure S7).
From the perspective of the utilization of beds in IDHs from 2002 to 2018, bed turnover times, bed working days and bed utilization rate increased with an AAPC of 5.51%, 2.62% and 2.62% (all p<0.05), respectively; the ALOS decreased with an AAPC of 2.29% (p<0.05) (Table 1, Table S2, Figure S5).
From the perspective of medical quality and safety, the rates of inpatients leaving the hospital without the doctor’s advice, unplanned rehospitalization within 31 days and the inpatient mortality, decreased by 0.37, 1.08 and 0.08 percentage points (all p<0.0001), respectively, in IDHs from 2016 to 2017, while the rates of surgical inpatients leaving the hospital without the doctor’s advice, unplanned re-surgery and surgical inpatient mortality increased by 1.30, 0.02 and 0.08 percentage points (p<0.0001, p=0.4221, p=0.0014), respectively (Table 4).
 |
Table 4 Results of Some Indicators of Medical Quality and Safety in Sampled IDHs, 2016–2017 |
Discussion
To the best of our knowledge, this is the first nationwide longitudinal analysis study that comprehensively analyzes the development of IDHs in China from 2002 to 2018. The development trend of IDHs in China was generally good in terms of the improvement in the number of hospitals, the number of physicians and nurses, hospital beds, hospital building area and business housing area, medical business quantity, medical quality and safety, and the utilization efficiency of medical resources. However, based on the Standards for the Construction of Infectious Disease Hospitals (JB [2016] No. 131) issued by China in 2016,15 there were still many shortcomings in the development of IDHs.
The scale was generally small, and the ability to respond to major emergencies was weak. Although the number of IDHs with more than 500 beds in China increased significantly from 2002 to 2018, the scale of most IDHs was still small, the capacity to accommodate patients was very limited, and the ability to respond to major emergencies was very weak. Taking Wuhan as an example, the only two IDHs in Wuhan had a total of approximately 900 beds; in the face of the outbreak of COVID-19, the number of beds immediately became insufficient. From the perspective of development speed, the number and scale of hospitals grew very slowly in recent years. As shown in Table 1, the APC of the numbers of hospitals from 2009 to 2018 was only 0.32%, and the APC of the average business housing area per bed from 2004 to 2018 was only 0.29%.
The problem of irrational resource allocation was still prominent. The geographic information maps showed the distribution of infectious disease beds in all hospitals by region was not consistent with the distribution of notifiable infectious diseases by region. The geographic information maps showed that the ranking by the number of infectious disease beds was inconsistent with the ranking by the number of notifiable infectious diseases for some provinces. For example, in 2018, the number of notifiable infectious diseases in Guangdong province and Zhejiang province ranked first and second nationwide, respectively, but the number of infectious disease beds ranked sixth and ninth, respectively, and the ratio of the two numbers was very high in the two provinces; in Yunnan province and Liaoning province, the number of notifiable infectious diseases ranked sixteenth and twenty-first, respectively, but the number of infectious disease beds ranked seventh and third, respectively, and the ratio of the two numbers was very low in the two provinces. It meant that in some provinces, there was a shortage of hospital beds or high utilization rates, while in some provinces, there were surplus hospital beds or low utilization rates.
The ratios of nurses to beds and nurses to physicians were small. Both indicators are important for evaluating the configuration of physicians and nurses. According to the Basic Standards for Medical Institutions (trial) (WYF [1994] No. 30),16 the ratio of nurses to beds of IDHs should be 0.4. From 2002 to 2018, the ratio of nurses to beds of IDHs in China fluctuated around 0.4, and was slightly above 0.4 in recent years, the highest value was 0.46 in 2018. However, 0.4 was the standard issued in 1994. The incidence of Class A and B infectious diseases was 196.12 per 100,000 in 1994, and it was 220.51 per 100,000 in 2018; the spectrum of infectious diseases in 2018 differed greatly from that in 1994, and the population in 2018 was much larger than in 1994,17 so the 0.4 standard was not applicable to the actual situation. Even with the 0.6 standard suggested in the Outline of the National Health Service System (2015–2020) (GBF [2015] No. 14), there was still a large gap in the allocation of nursing resources in IDHs.18 The calculation results of World Health Statistics 2014 data showed that the ratio of nurses to beds in China from 2006 to 2013 was 0.4, which was much lower than the average level of other regions in the world during the same period, and male nurses were very scarce.19,20 IDHs are different from ordinary hospitals, and the care of patients with infectious diseases depends only on professional nurses; family members and caregivers cannot be in close contact. Therefore, the COVID-19 pandemic entailed an urgent need for nurses. The ratio of nurses to physicians was also small from 2002 to 2018, its maximum value was 1.69 in 2016, and it fell to 1.67 in 2018. According to the calculation results of the data in World Health Statistics 2019, the ratio of nurses to physicians in China from 2009 to 2018 was 1.29, which was lower than the average level of other regions in the world during the same period (Table S3).21
The continued existence and development were facing a dilemma. The liabilities of China’s IDHs increased continuously. The percentage of liabilities to total assets was 24.87% in 2002, increasing to 42.41% in 2018, with an AAPC of 4.02%. Although there is no reasonable range for the proportion of hospital liability in China, a high proportion of liability can greatly increase hospital operating costs and even expose hospital operations to difficulties and potential bankruptcy risk. One study believed that the proportion of hospital liabilities should be controlled within 30%.22 In recent years, China has continuously deepened the new medical reform and eliminated drug bonuses. As a result, the medical incomes of IDHs, which mainly concern internal medicine, have generally decreased, and their solvency has been greatly reduced. A high proportion of liability hinders the continued existence and development of IDHs. The public hospital liability problem has attracted great attention from the central and local governments, and some provinces have adopted related policies and measures to eliminate the risk.22,23 In addition, the percentages of medical income to total income and medical business costs to total expenditure in IDHs decreased significantly from 2002 to 2018.
Although the average numbers of outpatient visits and discharged patients per IDH generally increased from 2002 to 2018, the growth rates for daily visits per physician, daily inpatients per physician, bed turnover times, bed utilization rate and bed working days slowed down after 2012, even some growth rates were negative, which meant that although the quantity of medical services increased, the growth rate did not match the increase in the number of hospital beds. In addition, the level of comprehensive medical care in IDHs needs to be improved. Traditional IDHs, mainly in internal medicine, cannot meet the actual needs. The rates of surgical inpatients leaving the hospital without the doctor’s advice, unplanned re-surgery and the surgical inpatient mortality were higher in 2017 than in 2016. This indicated that the level of surgical care in IDHs was generally weak, and high-quality medical services could not be provided for surgical patients, resulting in increases in the values of the above three surgery-related indicators.
Analysis content is limited by available data and their form. First, some data are not available online, leading to the use of their nearest neighbour data instead, which may lead to inaccurate results. Second, since the number of beds in IDHs in each region is not available, the number of infectious disease beds in all hospitals in each region is used instead, when analyzing the regional distribution of the number of beds. Third, due to the lack of similar literature at home and abroad, there are few data available for comparison, or the data used for comparison is not the latest. Fourth, since the China Health Statistics Yearbook 2020 has not been released, we could not analyze the data for 2019.
Based on the present longitudinal analysis of national survey data, the scale of IDHs in China was generally small, the ability to respond to major emergencies was weak, the problem of irrational resource allocation was still prominent, and the operation of IDHs was facing a dilemma. More efforts will be needed to strengthen the construction and development of the public health system in the future.
Author Contributions
All authors made substantial contributions to conception and design, acquisition of data, or analysis and interpretation of data; took part in drafting the article or revising it critically for important intellectual content; agreed to submit to the current journal; gave final approval of the version to be published; and agree to be accountable for all aspects of the work.
Funding
This study was supported by National Natural Science Foundation of China (grant number: 82073614) and Priority Academic Program Development of Jiangsu Higher Education Institutions (PAPD).
Disclosure
The authors report no conflicts of interest in this work.
References
1. Zhu ZB, Zhong CK, Zhang KX, et al. Epidemic trend of corona virus disease 2019 (COVID-19) in mainland China. Chin J Prev Med. 2020;54:E022. doi:10.3760/cma.j.cn112150-20200222-00163
2. Agrawal S, Goel AD, Gupta N. Emerging prophylaxis strategies against COVID-19. Monaldi Arch Chest Dis. 2020;90. doi:10.4081/monaldi.2020.1289.
3. National Health Commission of the People’s Republic of China. Announcement of the national health commission of the People’s Republic of China (No.1 in 2020); 2020. Available from: http://www.nhc.gov.cn/xcs/zhengcwj/202001/44a3b8245e8049d2837a4f27529cd386.shtml>.
4. Chakraborty I, Maity P. COVID-19 outbreak: migration, effects on society, global environment and prevention. Sci Total Environ. 2020;728:138882. doi:10.1016/j.scitotenv.2020.138882
5. Tirupathi R, Bharathidasan K, Palabindala V, Salim SA, Al-Tawfiq JA. Comprehensive review of mask utility and challenges during the COVID-19 pandemic. Infez Med. 2020;28:57–63.
6. Chatterjee P, Nagi N, Agarwal A, et al. The 2019 novel coronavirus disease (COVID-19) pandemic: a review of the current evidence. Indian J Med Res. 2020;151:147–159. doi:10.4103/ijmr.IJMR_519_20
7. Shi Y, Wang G, Cai X-P, et al. An overview of COVID-19. J Zhejiang Univ Sci B. 2020;21(5):343–360. doi:10.1631/jzus.B2000083
8. De-Bing D. Analysis of municipal infectious disease hospital survival crisis in China. Med Soc (Berkeley). 2014;27:64–66.
9. Feng-Yao W, Dong W-Y. The status and strategies of infectious disease hospital. Chin Hosp. 2013;17:26–27.
10. Xiao-Fang Y, Zheng H-L. Survival status and development strategies of infectious disease hospitals. J Health Econ Res. 2013;60–62.
11. National Health Commission of the People’s Republic of China. National Report on the Services, Quality and Safety in Medical Care System 2018.
12. Kim HJ, Fay MP, Feuer EJ, Midthune DN. Permutation tests for joinpoint regression with applications to cancer rates. Stat Med. 2000;19(3):335–351. doi:10.1002/(sici)1097-0258(20000215)19:3<335::aid-sim336>3.0.co;2-z
13. Kim HJ, Luo J, Kim J, Chen HS, Feuer EJ. Clustering of trend data using joinpoint regression models. Stat Med. 2014;33(23):4087–4103. doi:10.1002/sim.6221
14. Clegg LX, Hankey BF, Tiwari R, Feuer EJ, Edwards BK. Estimating average annual per cent change in trend analysis. Stat Med. 2009;28(29):3670–3682. doi:10.1002/sim.3733
15. Ministry of Housing and Urban-Rural Construction of the People’s Republic of China & National Development and Reform Commission. Notice on the approval and release of the standards for the construction of infectious disease hospitals (JB [2016] No.131); 2016. Available from: http://www.mohurd.gov.cn/wjfb/201612/t20161222_230047.html>
16. Ministry of Health of the People’s Republic of China. Notice on the issuance of basic standards for medical institutions (trial) (WYF [1994] No.30); 1994. Available from: http://www.nhc.gov.cn/yzygj/s3576/201706/4d84820f321144c290ddaacba53cb590.shtml>.
17. National Health Commission of the People’s Republic of China. China Health Statistics Yearbook 2019.
18. General Office of the State Council of the People’s Republic of China. Notice on the issuance of the outline of the national health service system (2015–2020) (GBF [2015] No.14); 2015. Available from: http://www.gov.cn/zhengce/content/2015-03/30/content_9560.htm>.
19. World Health Organization. World health statistics 2014; 2014. Available from: https://apps.who.int/iris/bitstream/handle/10665/112738/9789240692671_eng.pdf?sequence=1.
20. Yang J-S, Hao D-J. Dilemmas for nurses in China. Lancet. 2018;392(10141):30. doi:10.1016/s0140-6736(18)31185-1
21. World Health Organization. World health statistics 2019; 2019. Available from: https://apps.who.int/iris/bitstream/handle/10665/324835/9789241565707-eng.pdf?sequence=9&isAllowed=y>.
22. Guo X-Y. Where to Go for Public Hospital Debt. China Hospital CEO; 2017:44–47.
23. Yan L, Peng Y, Shen Y, Liu L. Research on the liabilities situation and resolution suggestions of county-level public hospitals in Yunnan. Chin Health Econ. 2018;37:30–32.
 © 2021 The Author(s). This work is published and licensed by Dove Medical Press Limited. The
full terms of this license are available at https://www.dovepress.com/terms
and incorporate the Creative Commons Attribution
- Non Commercial (unported, 3.0) License.
By accessing the work you hereby accept the Terms. Non-commercial uses of the work are permitted
without any further permission from Dove Medical Press Limited, provided the work is properly
attributed. For permission for commercial use of this work, please see paragraphs 4.2 and 5 of our Terms.
© 2021 The Author(s). This work is published and licensed by Dove Medical Press Limited. The
full terms of this license are available at https://www.dovepress.com/terms
and incorporate the Creative Commons Attribution
- Non Commercial (unported, 3.0) License.
By accessing the work you hereby accept the Terms. Non-commercial uses of the work are permitted
without any further permission from Dove Medical Press Limited, provided the work is properly
attributed. For permission for commercial use of this work, please see paragraphs 4.2 and 5 of our Terms.