Back to Journals » Psychology Research and Behavior Management » Volume 16
Development of the Cultural Tightness-Looseness Orientation Scale for College Students
Received 11 January 2023
Accepted for publication 28 February 2023
Published 9 March 2023 Volume 2023:16 Pages 665—681
DOI https://doi.org/10.2147/PRBM.S402850
Checked for plagiarism Yes
Review by Single anonymous peer review
Peer reviewer comments 2
Editor who approved publication: Dr Igor Elman
Shuwei Sun,1 Haiyan Zhang2
1School of Mathematics and Statistics, Xuzhou University of Technology, Xuzhou, Jiangsu, People’s Republic of China; 2Business School, Jiangsu Normal University, Xuzhou, Jiangsu, People’s Republic of China
Correspondence: Haiyan Zhang, Business School, Jiangsu Normal University, No. 101 Shanghai Road, Tongshan, Xuzhou, Jiangsu, 221116, People’s Republic of China, Tel +86 15996963625, Email [email protected]
Background: “The cultural tightness-looseness orientation of college students”, which involves college students’ cognition about tolerance for non-learning-behavior in class, strength of learning-behavior norms in class, and strength of social norms in the generalized macro-context, offers a new perspective to explain college students’ psychology and behavior and could effectively promote their all-round development. However, there is severely lack of a reliable and valid instrument. Hence, we seek to develop the Cultural Tightness-Looseness Orientation Scale for College Students (CTLOS-S) in the Chinese context.
Methods: We firstly pooled the initial 17 measuring items of CTLOS-S through literature review and the open-ended interview. After conducting questionnaire survey among 264 college students using the initial scale, we did a series of reliability and validity tests to get the formal CTLOS-S, based on which we further administered questionnaire survey among 755 college students to check its reliability, construct validity, criterion validity, content validity, and across-gender invariance.
Results: The formal CTLOS-S contains 7-item subscale of tolerance orientation for non-learning-behavior in class, 4-item subscale of strength orientation of learning-behavior norms in class, and 3-item subscale of strength orientation of social norms in the generalized macro-context. The testing results of the second-stage questionnaire survey data (N = 755) demonstrate that the reliability coefficients of CTLOS-S and its three subscales are 0.85, 0.85, 0.83, and 0.76 separately, the internal 3-factor structure validity of CTLOS-S is satisfactorily acceptable with χ2(74) = 318.76, CFI = 0.94, TLI = 0.93, RMSEA = 0.06, and SRMR = 0.04, and the content validity and criterion validity are satisfactory as the total score of CTLOS-S is positively correlated with each score of its three subscales and the total score of learning engagement scale. Besides, the 3-factor structure of CTLOS-S is invariant across gender.
Conclusion: The 14-item CTLOS-S we develop is a reliable and valid instrument for researchers to conduct quantitative studies on college students’ cultural tightness-looseness orientation.
Keywords: the cultural tightness-looseness orientation of college students, tolerance orientation for non-learning-behavior in class, strength orientation of learning-behavior norms in class, strength orientation of social norms in the generalized macro-context
Introduction
As an effective way to promote college students’ all-round development, scientifically explaining and accurately predicting their psychology and behavior undoubtedly could provide a reliable guarantee for the healthy and sustainability of higher education development. Therefore, scholars in all kinds of fields or disciplines up to now have been tirelessly exploring college students’ psychology and behavior from a variety of perspectives such as personality,1 attitude and motive,2,3 growth background and macro environment,4 teachers’ feedback,5 and so on. Since social norms are well confirmed to play crucial roles in influencing human beings’ psychology and behavior,6,7 the concept “cultural tightness-looseness”, which mainly depicts human beings’ strength of social norms for important behaviors and tolerance for behavioral deviance,8–10 can be applied to college students, who are the fundamental audience as well as the vital consumers of higher education, and is more likely to become a new, important perspective to understand and foresee college students’ psychology and behavior. Moreover, a great number of the existing theoretical and empirical studies regarding the definition,8–12 the influencing factors,7,10,12–14 the operationalization,10,12,15–17 and the consequences of cultural tightness-looseness16–33 have laid solid foundation for scientifical interpretation and accurate prediction of college students’ psychology and behavior from this new perspective.
Surely, we cannot directly use this somewhat “broad” concept to explore college students’ psychology and behavior since college students have their own particularities in terms of their cultural tightness-looseness. For example, college students not only live in a broad society but also spend most of their time learning in “class”, which is a dominant situation that college students stay in almost every day but has its own characteristics compared to the other situations such as the broad society surrounding them. In an effort to better explore college students’ cultural tightness-looseness, therefore, our study specifies the broad concept “cultural tightness-looseness” as a concrete construct “the cultural tightness-looseness orientation of college students” and defines it as college students’ cognition or perception about tolerance for non-learning-behavior in class, strength of learning-behavior norms in class, and strength of social norms in the generalized macro-context according to the well-established definition of cultural tightness-looseness.8–10 Just like that cultural tightness-looseness in a broad sense exerts wide impacts on human beings’ work and life, the cultural tightness-looseness orientation of college students permeates their daily life and is often strengthened by a series of psychological processes which are necessary for them to adapt to the external environment.10 Due to the fact that college students usually have individual difference in the quality and quantity of knowledge and come from not-the-same backgrounds, they may differ individually in their strength orientation of social norms and tolerance orientation for deviance in both the macro and micro situations.9,34 Consequently, it is necessary to conduct theoretical and empirical research on the cultural tightness-looseness orientation of college students.
As a Chinese saying goes, “sharpen tools make good work”, an instrument that could effectively evaluate “the cultural tightness-looseness orientation of college students” is surely crucial to scientifically facilitate the empirical research on college students’ psychology and behavior from this new perspective of cultural tightness-looseness and in turn will determine the reliability and validity of the empirical research conclusions. After having a systematic literature review, our study finds that the 6-item scale of cultural tightness-looseness developed by Gelfand et al in 201110 is the main instrument that has been widely recognized, accepted, and used by scholars for empirical research at the micro level.20–22,30 Besides, the data of 33 countries’ or the extended 57 countries’ cultural tightness-looseness relatively calculated by Gelfand et al in 2011 and Eriksson et al in 2021 using the above 6-item scale,10,35 the cultural tightness index of 50 US states based on 9 indicators computed by Harrington and Gelfand in 2014,16 and the data of 68 countries’ cultural tightness-looseness calculated by Uz in 2015 using EWVS database,17 are the primary second-hand data sources for scholars to conduct empirical research at the medium and macro levels.23,25–29,31–33 While using the extant data of cultural tightness-looseness has the advantage of convenience, there is inevitably the limitation that the second-hand data could only capture static information of cultural tightness-looseness at a fixed point of time rather than the real-time dynamics. Besides, although human beings’ cultural tightness-looseness tends to be stable for a period of time, the volatility, uncertainty, complexity, and ambiguity of the current globe as well as its broad and deep integration to some extent make human beings’ cultural tightness-looseness become more and more dynamic. In this case, exclusively relying on the second-hand data to explore the possible causes or consequences is undoubtedly difficulty to meet the time-fit research aim, which thereby is likely to lead to the inaccuracy of research conclusions. Moreover, the extant data, whether it is the cultural tightness-looseness data of 33 countries,10 the extended 57 countries,35 50 US states,16 or 68 countries,17 almost fails to cover all countries or regions in the globe, which largely constrains the empirical research of cultural tightness-looseness for countries or regions that were not taken into consideration previously. Therefore, what our study greatly concerns is a reliable and valid CTLOS-S which can help researchers collect college students’ real-time cognition of cultural tightness-looseness anywhere and anytime. However, the existing 6-item scale of cultural tightness-looseness developed by Gelfand et al,10 which is the main instrument that has been widely recognized, accepted, and used by scholars for empirical research at the micro level,20–22,30 merely reflects college students’ strength orientation of social norms in the generalized macro-context and cannot capture their tolerance orientation for non-learning-behavior and strength orientation of learning-behavior norms in “class” which is a dominant situation that college students stay in almost every day. So, the main aim of our study is to newly develop the items that could effectively measure college students’ tolerance orientation for non-learning-behavior and strength orientation of learning-behavior norms in “class”, which could combine with Gelfand et al’s 6 items assessing strength orientation of social norms and deviance-tolerance orientation in the generalized macro-context to constitute a reliable and valid CTLOS-S.
As we said earlier, the construct “the cultural tightness-looseness orientation of college students” is the specific application of the broad concept “cultural tightness-looseness” to college students. The relevant research consists of studies at the national level such as the comparison study of cultural tightness-looseness orientation between the Chinese and American college students, studies at the regional level such as the cross-region study of college students’ cultural tightness-looseness orientation between South China and North China, studies at the organizational level such as the study exploring why college students from Peking University and Nanjing University differ in cultural tightness-looseness orientation, and studies at the individual level such as the investigation aiming at the impact of college students’ cultural tightness-looseness orientation on their learning engagement and career decision-making. Certainly, there are sharp differences as well as mutually nested relations among these research levels. For example, the lower, micro levels of college students’ cultural tightness-looseness orientation not only depict the particularity of behavioral norms in the direct micro-situation such as “class” but also share the commonality of the relatively higher, macro levels such as the organizational, regional, or national level of cultural tightness-looseness. Since the cultural tightness-looseness orientation of college students at the higher, macro levels could be measured through the aggregation of that at the lower, micro levels, we mainly seek to develop CTLOS-S at the most micro level, ie, the individual level.
The remainder of the paper is mainly structured as follows. Section “Literature Review” mainly summarizes the relevant empirical studies in recent ten years (2012–2022) at great length to lay foundation for CTLOS-S development. Section “Participants and Methods” chiefly introduces participants, procedure, item preparation, criterion variable selection and instrument, and statistical analysis. Section “Results” primarily reports how the formal 14-item CTLOS-S was obtained from the initial 17 measuring items and the reliability and validity testing results of the formal 14-item CTLOS-S. Section “Discussion” has a brief summary and discusses the deleted items and main limitations of CTLOS-S.
Literature Review
After systematically reviewing the representative, empirical studies of cultural tightness-looseness in recent ten years (2012–2022), we summarize the main measurements or empirical data sources of cultural tightness-looseness, of which the results are presented in Table 1.
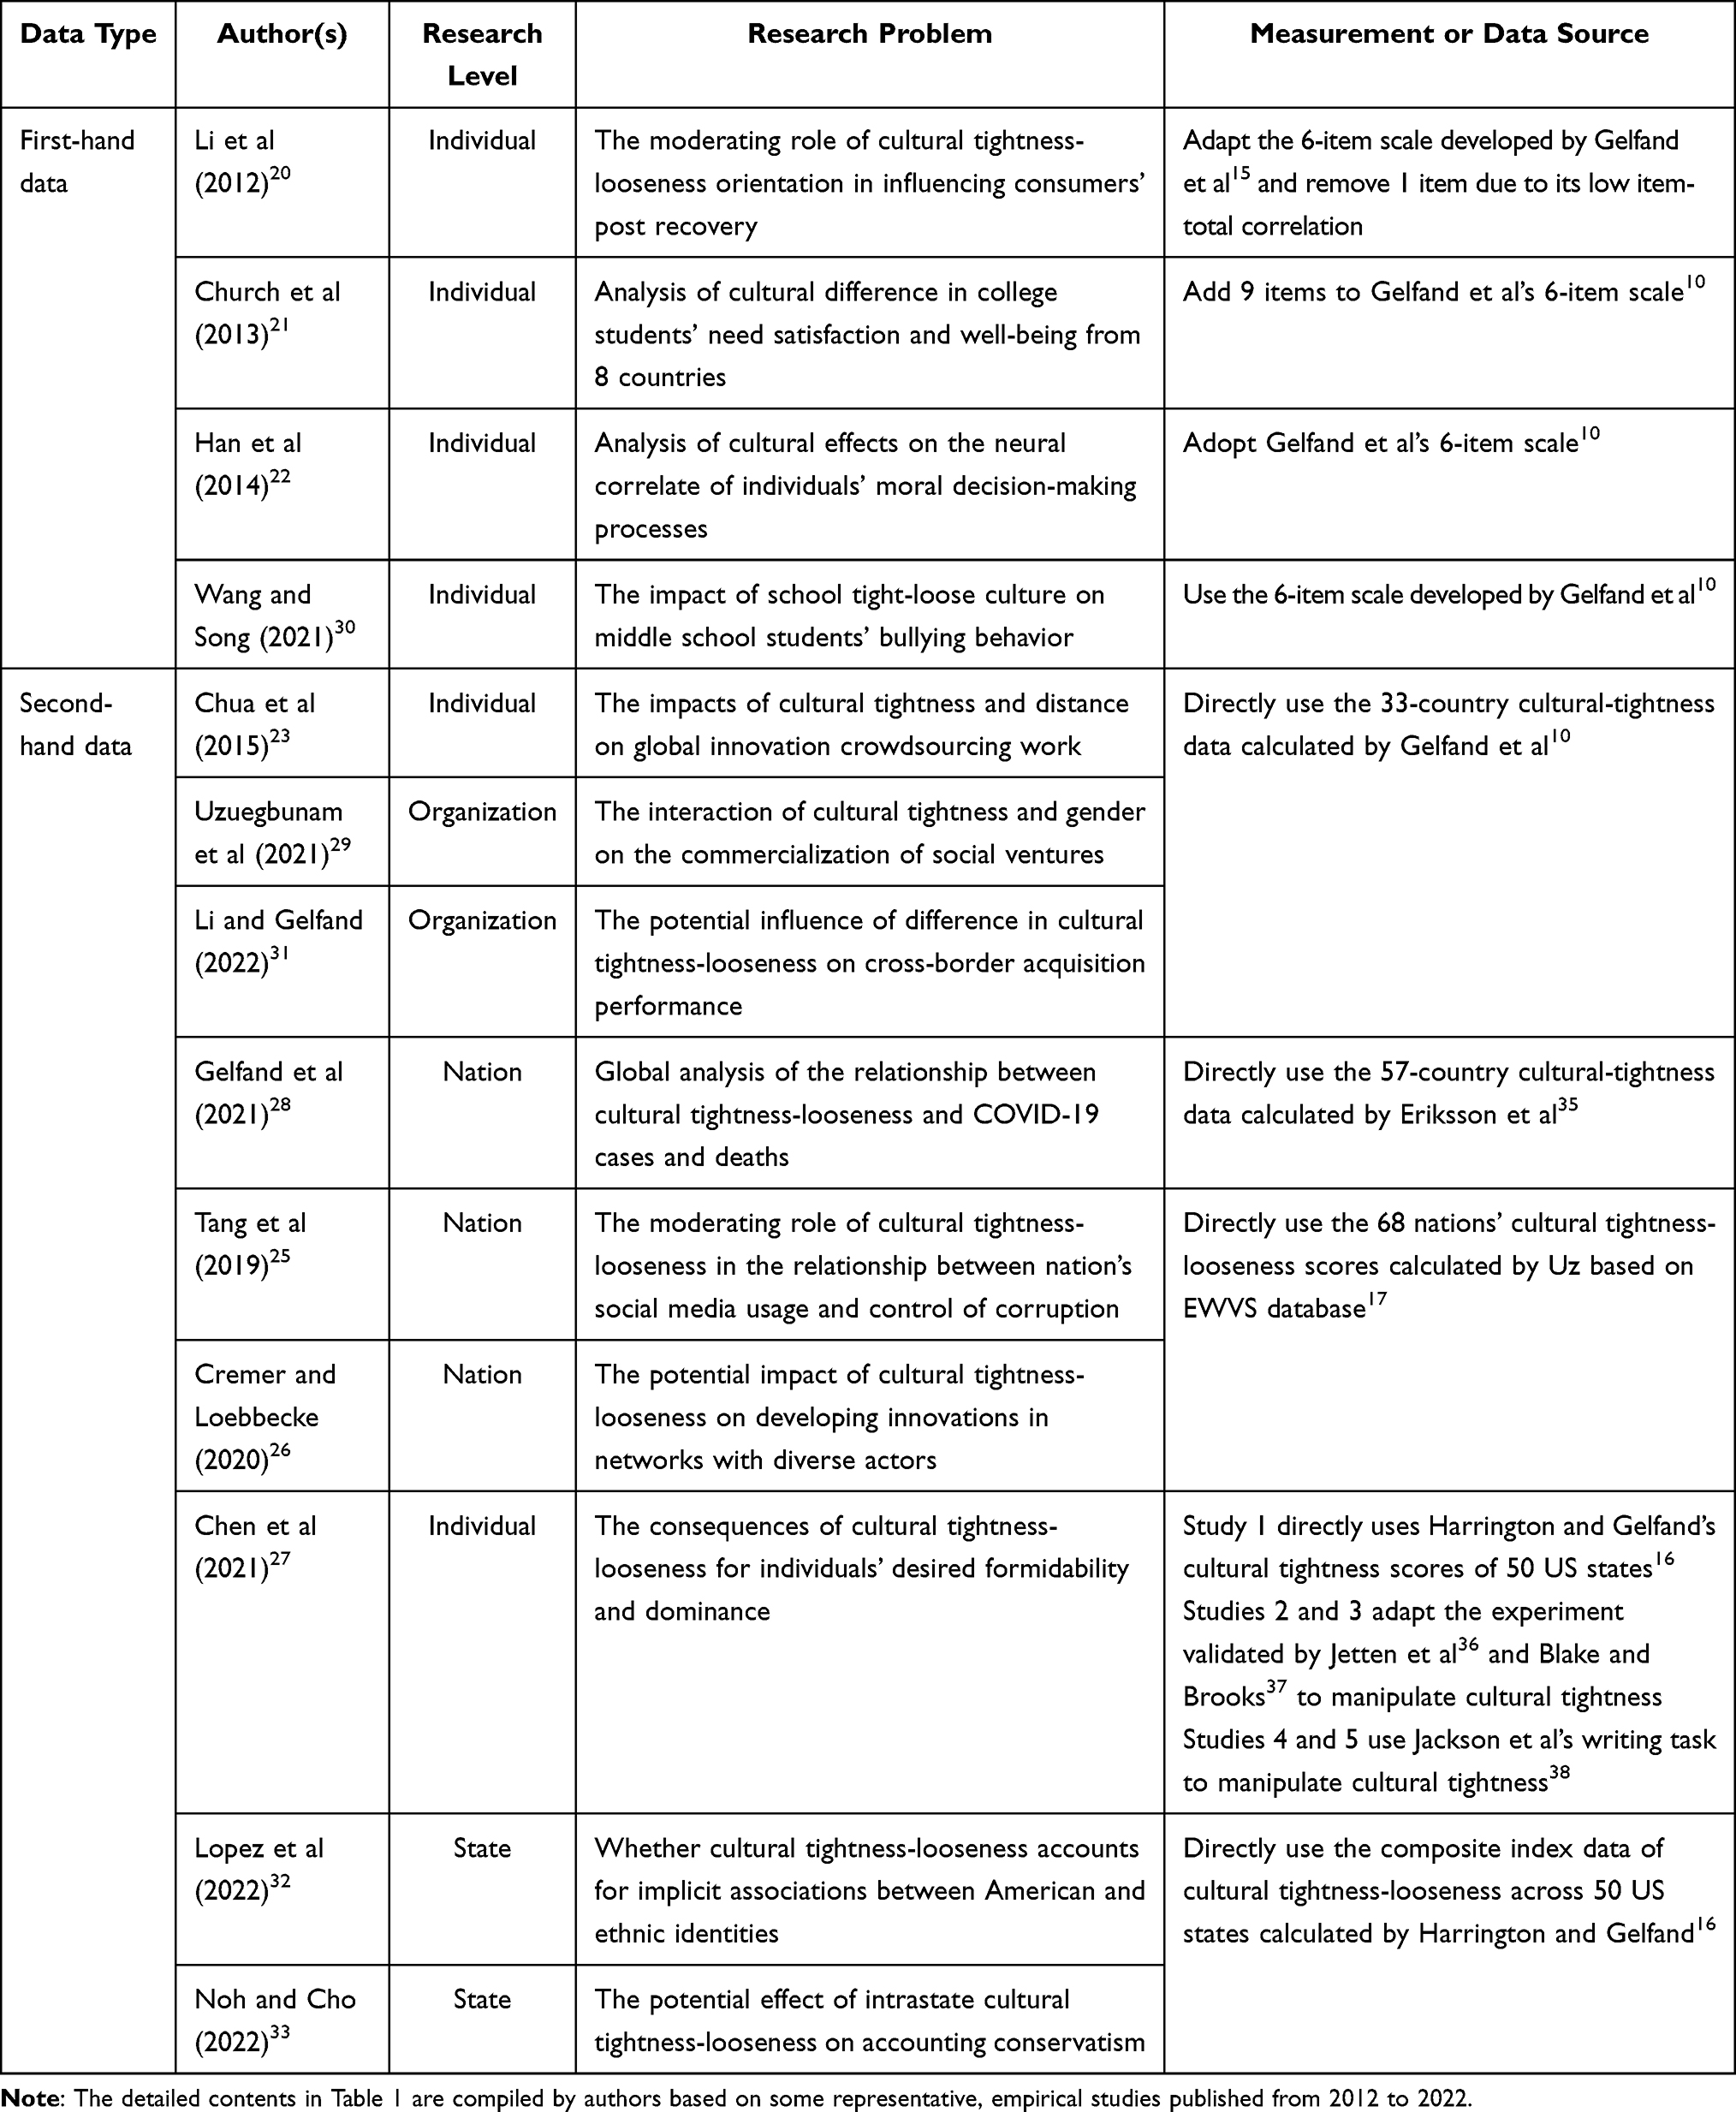 |
Table 1 Main Measurements or Data Sources of Cultural Tightness-Looseness (2012–2022) |
As shown in Table 1, the empirical studies of cultural tightness-looseness published in recent ten years (2012–2022) could be classified into two subtypes according to whether the empirical data came from researchers’ own investigation or the extant data calculated previously by others: one subtype mainly relies on the first-hand investigation data and the other subtype primarily exploits the second-hand data. Besides, the 6-item scale of cultural tightness-looseness developed by Gelfand et al in 2011,10 is the main measuring-tool that has been widely recognized, accepted, and used by scholars for empirical studies at the micro or individual level;20–22,30 the cultural tightness-looseness data of 33 countries and the extended 57 countries relatively calculated by Gelfand et al in 2011 and Eriksson et al in 2021 using the above 6-item scale,10,35 the cultural tightness index of 50 US states based on 9 indicators computed by Harrington and Gelfand in 2014,16 and the cultural tightness-looseness data of 68 countries calculated by Uz in 2015 using EWVS database,17 are the primary second-hand data sources for researchers to carry out empirical studies at the state and nation levels.23,25–29,31–33
As mentioned earlier, exploiting the existing data, such as 33 or the extended 57 countries’ cultural tightness-looseness data separately computed by Gelfand et al in 2011 and Eriksson et al in 2021,10,35 50 US states’ cultural tightness index calculated by Harrington and Gelfand in 2014,16 and 68 countries’ cultural tightness-looseness data computed by Uz in 2015,17 almost fails to capture the real-time dynamics of human beings’ cultural tightness-looseness and is more likely to result in the inaccuracy of research findings. Hence, what our study is strongly interested in is exactly the 6-item scale of cultural tightness-looseness developed by Gelfand et al in 2011 which can achieve the dynamic, time-fit research aim.10 These 6 items assessing the extent to which social norms are clearly defined, pervasive, and reliably imposed within nations are ① “There are many social norms that people are supposed to abide by in this country”, ② “In this country, there are very clear expectations for how people should act in most situations”, ③ “People agree upon what behaviors are appropriate versus inappropriate in most situations in this country”, ④ “People in this country have a great deal of freedom in deciding how they want to behave in most situations”, ⑤ “In this country, if someone acts in an inappropriate way, others will strongly disapprove”, and ⑥ “People in this country almost always comply with social norms”.10 Obviously, these 6 measuring items have distinctive characteristics of the generalized macro-context, which to some extent ensures the universality of Gelfand et al’s scale. It is worthy to note that, in addition to the above 6 items measuring people’s strength of social norms in general situation, Gelfand et al developed 12 items evaluating people’s social norms strength and deviance tolerance in everyday situations that they inhabit in the local worlds. In this way, Gelfand et al, on the one hand, ensured the universality of the scale through the original 6 items assessing human beings’ strength of social norms in the generalized macro-context and, on the other hand, guaranteed the content validity of the scale through the additional 12 items measuring people’s strength of social norms and tolerance for deviance in the local, everyday situations.
It is a pity that scholars severely ignore to appraise respondents’ strength of social norms and tolerance for deviant behaviors in the local, everyday situations when they exclusively employ Gelfand et al’s 6-item scale focusing on the generalized macro-context to measure respondents’ cultural tightness-looseness orientation in their empirical research, particularly in their empirical studies on the consequences of cultural tightness-looseness at the micro level, which therefore tends to reduce the accuracy of research conclusions through a somewhat flawed instrument of cultural tightness-looseness with lower content validity. For example, when empirically examining the potential interaction of overcompensation attainability and cultural tightness-looseness orientation on consumers’ intention to voice complaint at the individual level, Li et al adapted Gelfand et al’s 6-item scale that exclusively assesses people’s social norms strength in the generalized macro-context, deleted 1 item with low item-total correlation, and used the left 5 items to measure experiment participants’ cultural tightness-looseness orientation.20 These five items are ① “I have clear expectations of what behaviors are appropriate or inappropriate in most situations in our society”, ② “I have clear expectations of how people should act in most situations in our society”, ③ “I have clear expectations of what social norms are appropriate or inappropriate in most situations in our society”, ④ “I think people are supposed to follow the social norms in our society”, and ⑤ “I think people should not have a great deal of freedom in deciding how they want to behave in most situations”.20 It is apparent that these 5 measuring items do not depict consumers’ tolerance for service suppliers’ deviant behaviors in the most service-consuming situations. For another example, when exploring the impact of school tight-loose culture on middle school students’ bullying behavior in China, Wang and Song directly adopted Gelfand et al’s 6-item scale aiming at the generalized macro-context to operationalize “school tight-loose culture”.30 Their study not only confuses the specific concept “school tight-loose culture” with the broad concept “cultural tightness-looseness” but also neglects the direct influences of students’ social norms strength and deviance tolerance in the dominant micro-situation, ie, “school”, on their bullying behavior.
To sum up, pertaining to the operationalization of cultural tightness-looseness in recent empirical studies (2012–2022), researchers mainly adopted or adapted Gelfand et al’s 6-item scale to merely evaluate people’s cultural tightness-looseness in the generalized macro-context and severely neglected to assess people’s cultural tightness-looseness in the local, everyday situations, which is more likely to result in the inappropriate research findings. This is exactly the major limitation of extant empirical studies on cultural tightness-looseness, as well as the underlying reason why our study is committed to developing CTLOS-S rather than directly adopting Gelfand et al’s 6-item scale to appraise the cultural tightness-looseness orientation of college students.
Participants and Methods
Abiding by the fundamental principles of scale development,39 our study at first pooled the initial 17 measuring items of CTLOS-S based on literature review, the open-ended interview, and experts’ suggestions; we then took the Chinese college students in real-life as sample to conduct the first-stage questionnaire survey using the initial CTLOS-S; we continued to perform extreme group test, item-total correlation analysis, Cronbach test, and exploratory factor analysis of the first-stage questionnaire survey data to obtain the formal CTLOS-S; finally, we implemented the second-stage questionnaire survey adopting the formal CTLOS-S to do a series of reliability, validity, and across-gender invariance tests.
Participants
Our participants are the Chinese college students in real life sampled from two universities in Jiangsu Province, ie, Jiangsu Normal University and Xuzhou University of Technology, through the cluster random sampling technique. Two stages of questionnaire surveys were both completed using the drop-off and pick-up approach to ensure a higher response rate.40 First, we got the selected majors, grades, and classes from the above two universities through the cluster random sampling technique; second, students from these chosen majors, grades, and classes gathered in a classroom by class, were informed about the purpose, procedure, and confidentiality of the following two stages of questionnaire surveys, and decided whether to take part in our questionnaire surveys according to their own will; third, after obtaining the participation consent letter from the sampled students, each questionnaire was on-site allocated to each participant and was on-site picked up when it was fully filled.
The first-stage questionnaire survey, which mainly aims at investigating the cultural tightness-looseness orientation of college students with the initial CTLOS-S, lasted two months, ie, from early November to late December in Year 2021. As we said previously, the first-stage questionnaire survey data was primarily used for the extreme group test, item-total correlation analysis, Cronbach test, and exploratory factor analysis of the initial CTLOS-S. Three hundred questionnaires in all were dropped-off and picked-up on site, of which 264 were valid ones, with a valid response rate of 88.00%. Among 264 valid participants, 162 were females (61.36%) and 102 were males (38.64%); 56, 96, 78, and 34 separately came from grade one (21.21%), grade two (36.36%), grade three (29.55%), and grade four (12.88%).
The second-stage questionnaire survey, which primarily aims at investigating the cultural tightness-looseness orientation of college students with the formal CTLOS-S and college students’ learning engagement as the criterion variable, commenced two months later and lasted three months, ie, from early March to late May in Year 2022. To avoid the answering bias, the measuring items of CTLOS-S and learning engagement scale were randomly merged into a questionnaire. As we said early, the second-stage questionnaire survey data was mainly used to test the reliability, validity, and across-gender invariance of the formal CTLOS-S. Nine hundred questionnaires in all were distributed and collected on site, of which 755 were valid ones, with a valid response rate of 83.89%. Among 755 valid participants, 409 were females (54.17%) and 346 were males (45.83%); 170, 369, 67, and 149 separately came from grade one (22.52%), grade two (48.87%), grade three (8.87%), and grade four (19.74%).
Methods
Item Preparation
As aforementioned, “the cultural tightness-looseness orientation of college students”, in which our study is interested to develop an instrument, is mainly a construct at the individual level that depicts to what degree individual college student perceives the tolerance for non-learning-behavior in the local, micro-situation “class”, to what degree she/he perceives the strength of learning-behavior norms in the local, micro-situation “class”, and to what degree she/he perceives the strength of social norms in the generalized macro-context. Therefore, in terms of the measuring items, CTLOS-S should at least consist of the following three dimensions: “tolerance orientation for non-learning-behavior in class” dimension which mainly generalizes individual college student’s total perception of tolerance for deviance in class, ie, the non-learning-behavior in class, “strength orientation of learning-behavior norms in class” dimension which primarily focuses on individual college student’s overall cognition of learning-behavior norms in class, and “strength orientation of social norms in the generalized macro-context” dimension which mainly reflects individual college student’s general cognition of social norms in the generalized macro-context.
Regarding the operationalization of the third dimension “strength orientation of social norms in the generalized macro-context”, we still adopt the 6-item scale of cultural tightness-looseness developed by Gelfand et al in 2011,10 which is widely recognized and well accepted by scholars.20–22,30 As for the operationalization of the first dimension “tolerance orientation for non-learning-behavior in class” and the second dimension “strength orientation of learning-behavior norms in class”, which are two powerful supplements at the local, micro-class level to the third dimension, we mainly rely on expert-interview, deduction, and induction to obtain some typical learning behaviors in class and some representative non-learning behaviors in class.41 After multiple rounds of summary, feedback, and re-summary, 7 representative non-learning behaviors in class and 4 typical learning behaviors in class were finally acquired. Accordingly, we add 7 new items measuring individual college student’s tolerance orientation for non-learning-behavior in class and 4 new items evaluating individual college student’s strength orientation of learning-behavior norms in class to Gelfand et al’s 6-item scale mainly appraising individual college student’s strength orientation of social norms in the generalized macro-context. As shown in Table 2, therefore, the initial CTLOS-S has 17 measuring items in all with 7-item subscale of individual college student’s tolerance orientation for non-learning-behavior in class, 4-item subscale of individual college student’s strength orientation of learning-behavior norms in class, and 6-item subscale of individual college student’s strength orientation of social norms in the generalized macro-context. It is worthy to note that we acquire the Chinese version of Gelfand et al’s 6-item scale through the back-translation procedure between English and Chinese.42,43
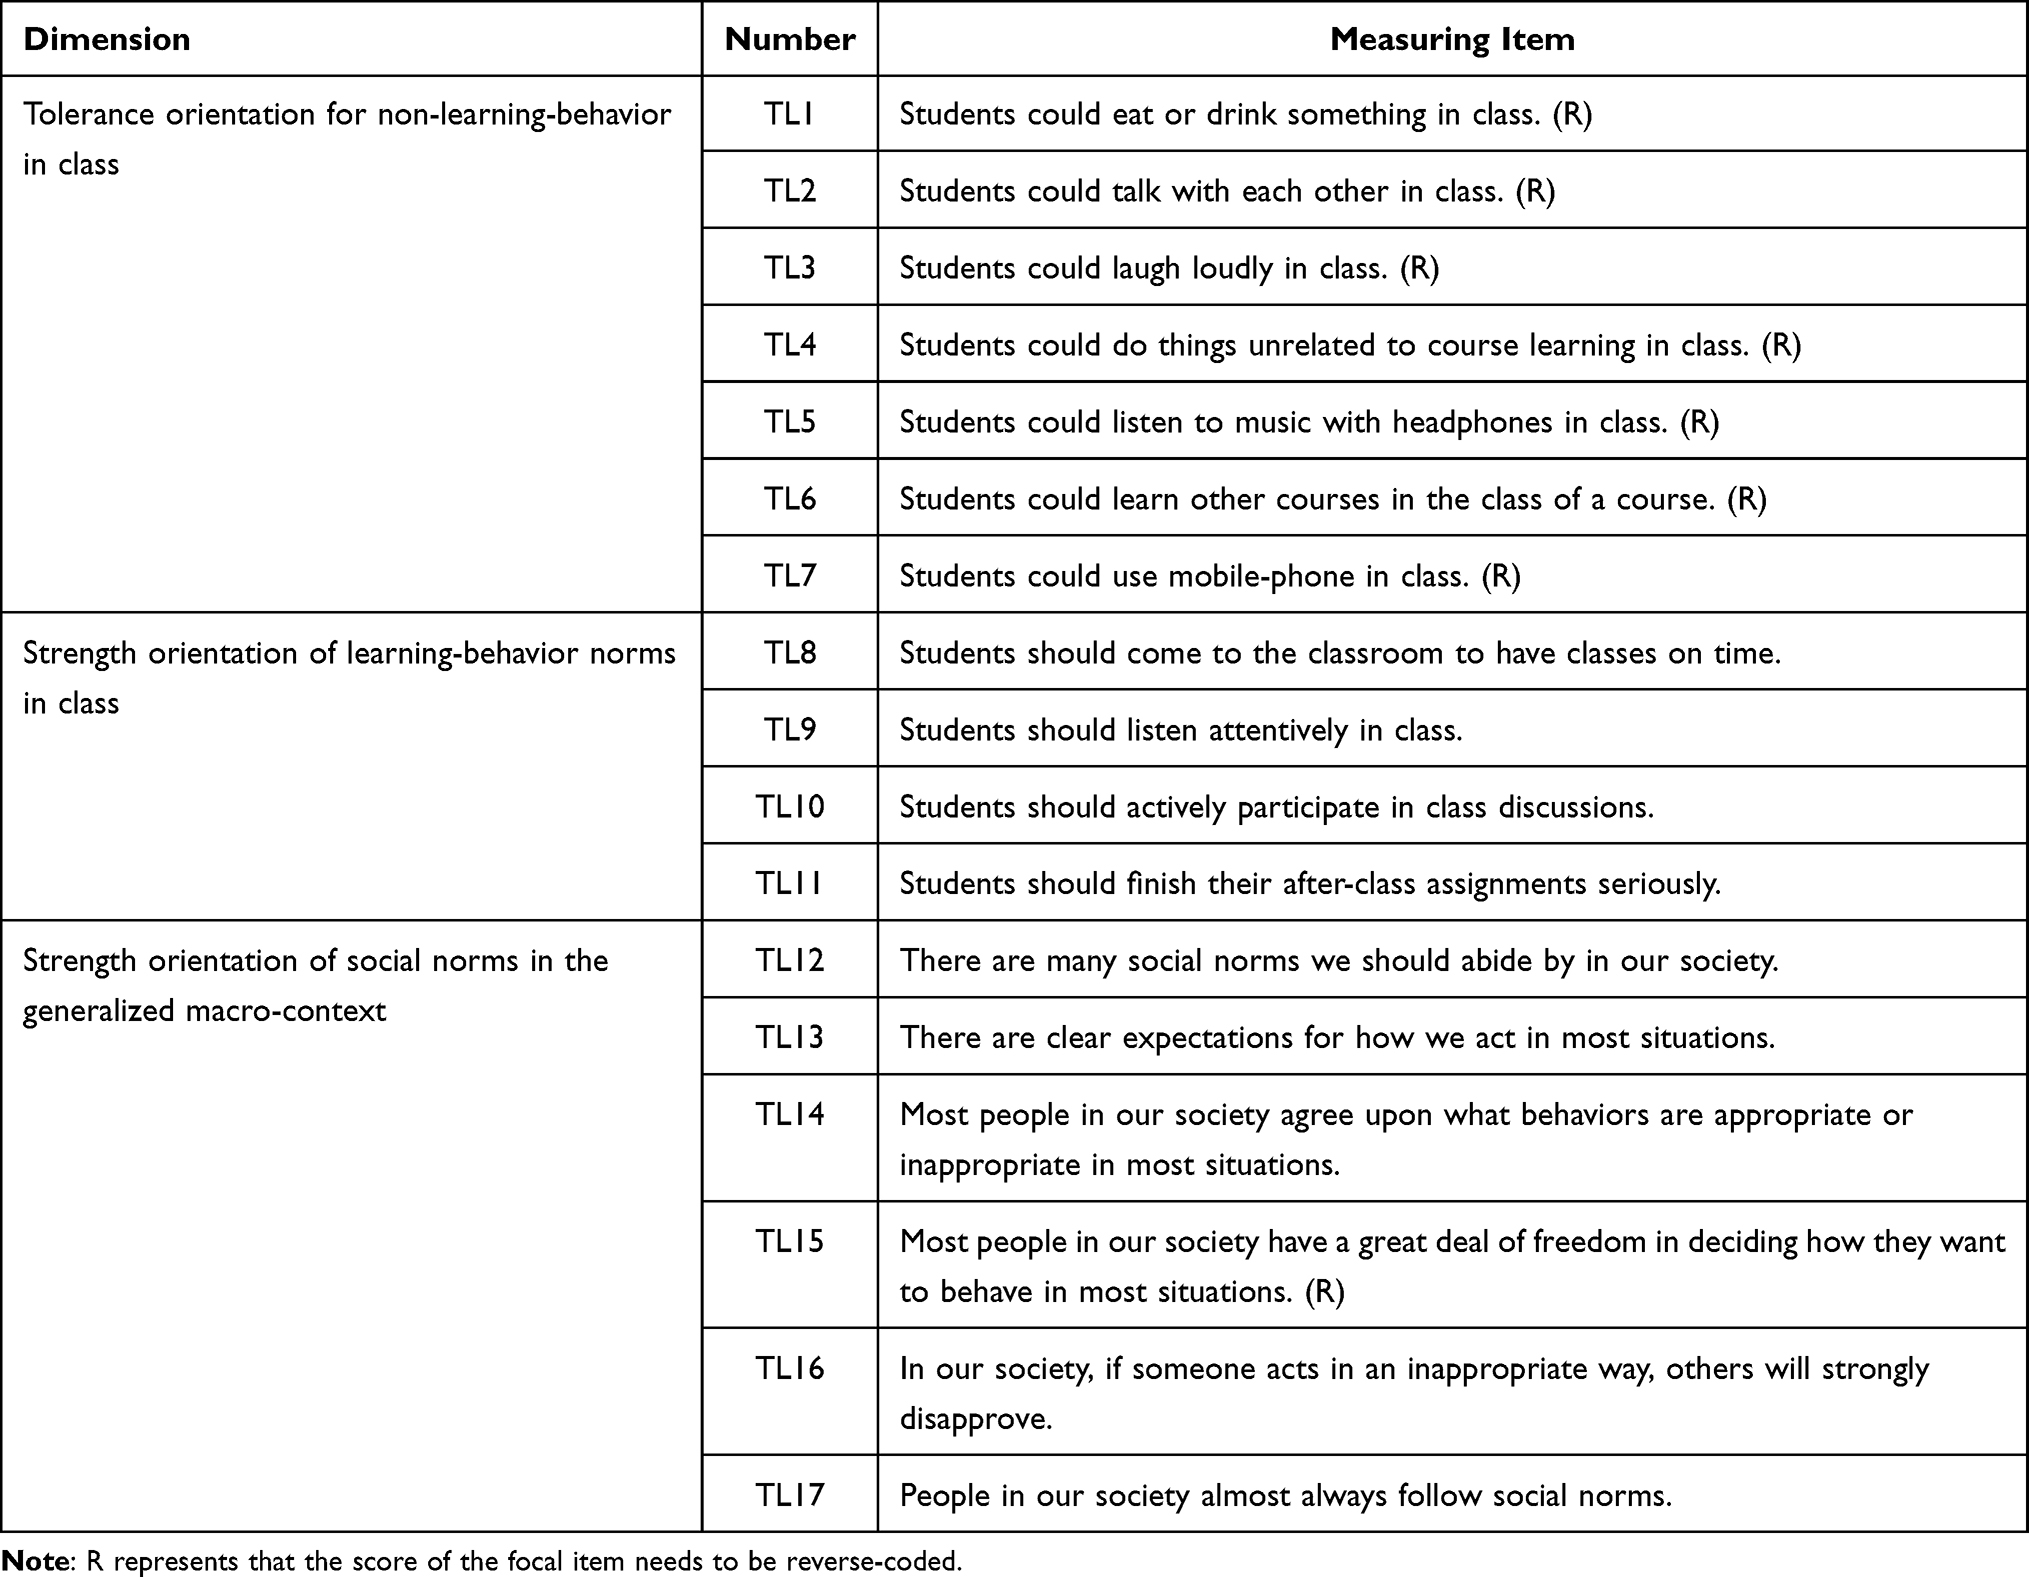 |
Table 2 The Initial CTLOS-S (17 Measuring Items) |
In the first-stage questionnaire survey, each college student obtained by the cluster random sampling technique was required to use the 7-point Likert rating method to evaluate these initial 17 measuring items (items TL1-TL17 in Table 2) based on her/his actual perception or feeling: 1-strongly disagree, 2-disagree, 3-slightly disagree, 4-neutral, 5-slightly agree, 6-agree, 7-strongly agree. Generally, the higher the scores of these measuring items, the tighter individual college student’s cultural orientation becomes; the lower the scores of these measuring items, the looser individual college student’s cultural orientation becomes. It should be noted that the 7 measuring items for the first dimension (items TL1-TL7 in Table 2) are reverse-scored.
Criterion Variable Selection and Instrument
It is well established that cultural tightness-looseness orientation influences human beings’ psychology and behavior.16–33 For example, Gelfand et al’s study confirmed that the individuals in a tight culture tend to have a higher level of self-control or self-management compared to those in a loose culture,19 Wang and Song empirically revealed that the culturally tight schools could effectively decrease students’ bullying behavior in China,30 and Noh and Cho’s study on the potential impact of intrastate cultural tightness-looseness on firms’ accounting conservatism found that the firms located in culturally tight states of the USA are more likely to boost accounting conservatism which in turn could decrease the uncertainty of future economic events.33
As a construct that primarily depicts college students’ strength orientation of social norms and tolerance orientation for deviant behaviors, “the cultural tightness-looseness orientation of college students” will also profoundly affect their psychology and behavior such as “learning engagement” which mainly refers to a positive, fulfilling, and study-related state of college students’ mind and is primarily characterized by learning vigor, learning dedication, and learning absorption.44,45 To test the criterion validity of CTLOS-S, we choose “learning engagement” as the criterion variable. We assessed individual college student’s learning engagement with the 17-item scale developed by Schaufeli et al (see in Appendix 1),44,45 which includes 6-item subscale of learning vigor, 5-item subscale of learning dedication, and 6-item subscale of learning absorption. A representative item for learning vigor subscale is “When I get up in the morning, I feel like going to class”, a typical item for learning dedication subscale is “I find my studies to be full of meaning and purpose”, and an example item for learning absorption subscale is “When I am studying, I forget everything else around me”.
In the second-stage questionnaire survey, each college student selected by the cluster random sampling technique was asked to use the 7-point Likert rating method to evaluate these 17 measuring items of learning engagement (see in Appendix 1) according to her/his reality: 1-strongly disagree, 2-disagree, 3-slightly disagree, 4-neutral, 5-slightly agree, 6-agree, 7-strongly agree. The reliability testing results of the total scale and its three subscales are good as the corresponding Cronbach’s alpha coefficients are 0.95, 0.88, 0.90, and 0.89. Certainly, college students participating in the second-stage questionnaire survey as well were requested to use the same rating method to appraise the formal 14 measuring items of CTLOS-S (see in Appendix 2).
Statistical Analysis
Using the first-stage questionnaire survey data (N = 264), we run independent sample t-test of the score-difference between the high-scored group (the top 27% participants) and the low-scored group (the bottom 27% participants), item-total correlation analysis, Cronbach test, and exploratory factor analysis with SPSS software to screen the initial 17 measuring items and identify the internal structure of CTLOS-S. Then, employing the second-stage questionnaire survey data (N = 755), a series of confirmatory factor analyses were further implemented with MPLUS software to test the construct validity and across-gender invariance of the formal 14-item CTLOS-S; Cronbach test and correlation analysis were as well conducted with SPSS software to test the reliability, criterion validity, and content validity of the formal 14-item CTLOS-S.
Results
Extreme Group Test
Following the specific procedure of extreme group test,46 first, we summed up each score of these 17 measuring items to acquire a total score of cultural tightness-looseness orientation for each participant based on the first-stage questionnaire survey data (N = 264); second, according to the total score, we ranked the participants from the highest to the lowest and classified the top 27% ones and the bottom 27% ones relatively into the high- and low-scored groups of cultural tightness-looseness orientation; third, we run independent sample t-test of the score-difference between the high- and low-scored groups, of which the results are shown in Table 3.
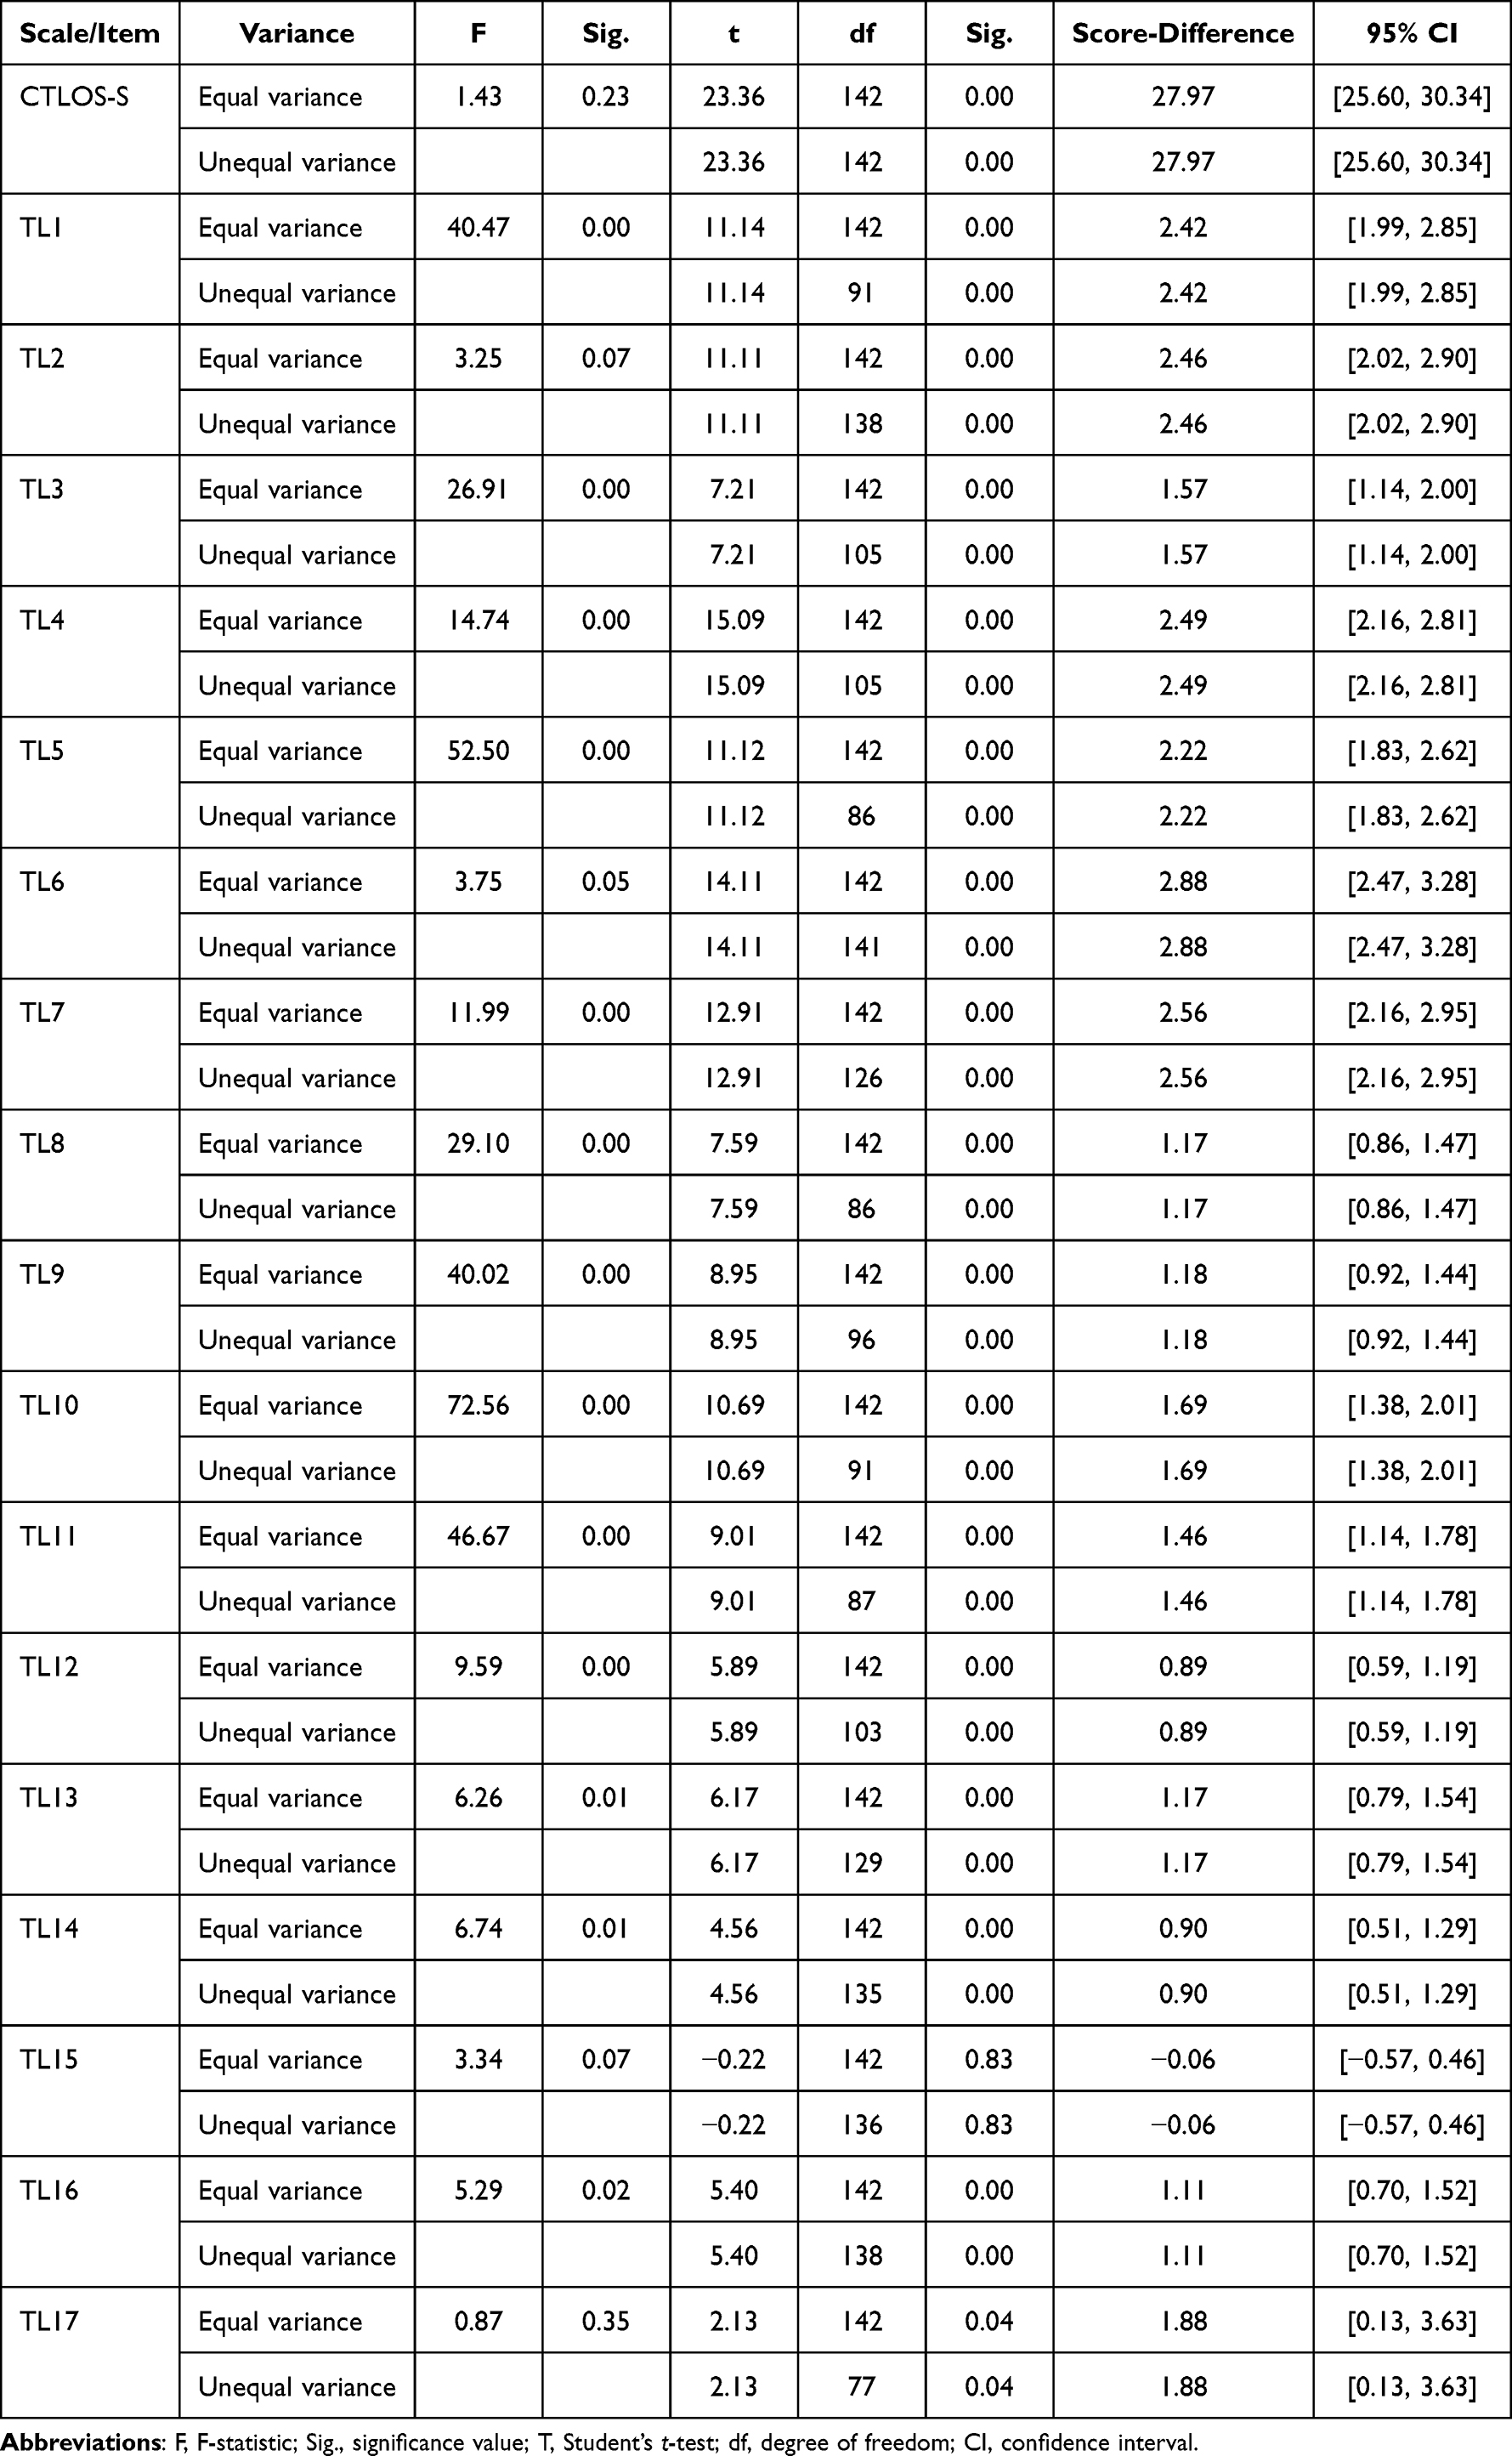 |
Table 3 Results of Extreme Group Test (N = 264) |
As indicated in Table 3, except for item TL15 (the score-difference value = −0.06, p = 0.83, 95% CI = [−0.57, 0.46], including 0, not significant), the score-difference values of the left 16 items (items TL1-TL14, TL16, and TL17) and the total scale between the high- and low-scored groups are all positively significant at the 0.05 level, which suggests that these 16 items and the total scale could effectively distinguish college students’ tighter and looser cultural-orientation. Accordingly, we delete item TL15 from the initial CTLOS-S.
Item-Total Correlation Analysis
After deleting item TL15, we continued to perform item-total correlation analysis of the retained 16 items, of which the results indicate that these 16 correlation coefficients, ie, 0.61, 0.61, 0.49, 0.71, 0.64, 0.48, 0.65, 0.63, 0.50, 0.55, 0.59, 0.44, 0.41, 0.36, 0.31, and 0.37, are all greater than the criterion of 0.3047 and are all significant at the 0.05 level. Therefore, the retention of items TL1-TL14, TL16, and TL17 is as well supported by the results of item-total correlation analysis.
Cronbach Test
Based on the 16 retained items (items TL1-TL14, TL16, and TL17), we further conducted Cronbach test, of which the results are presented in Table 4.
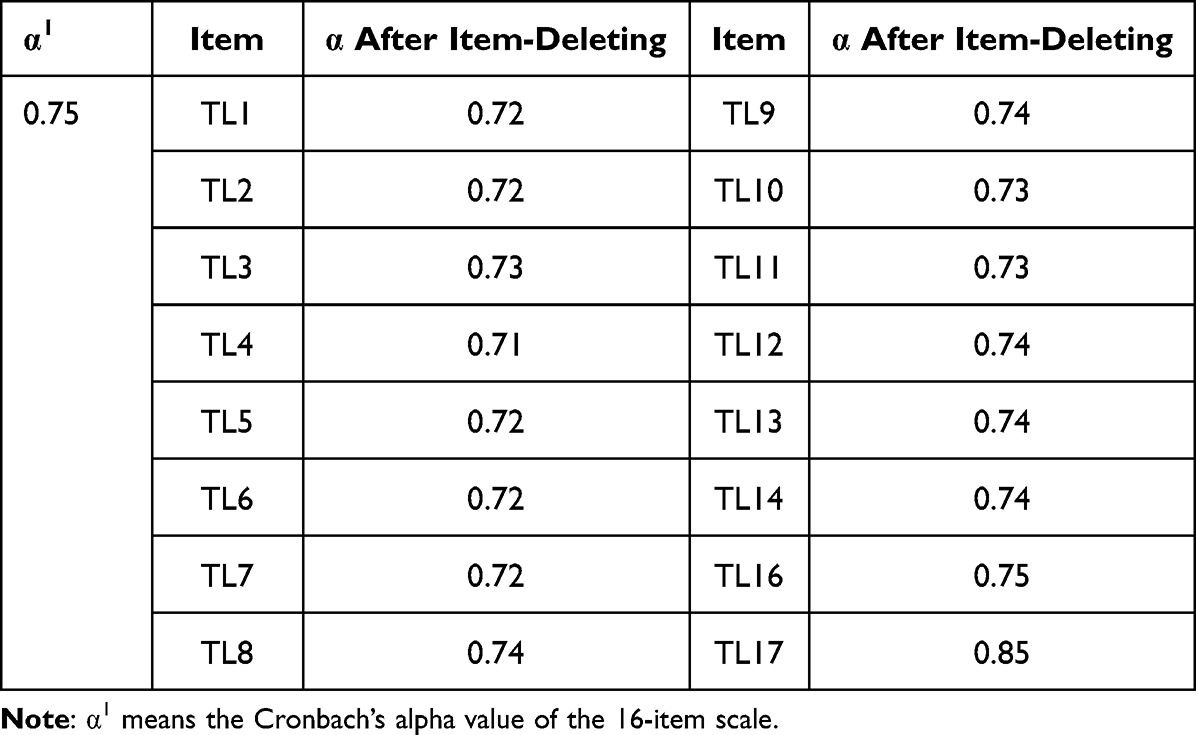 |
Table 4 Results of Cronbach Test for the Retained 16 Items (N = 264) |
When comparing the Cronbach’s alpha values of CTLOS-S before (the first column in Table 4) and after deleting the focal item (the third and fifth columns in Table 4), we can find that if we delete item TL17, the Cronbach’s alpha value of CTLOS-S will soar up from 0.75 to 0.85. Hence, we delete item TL17 from the retained 16 items.
Exploratory Factor Analysis
For the 15 retained items after the deletion of items TL15 and TL17, we continued to run exploratory factor analysis (EFA) to screen the measuring items and identify the internal structure of CTLOS-S based on the first-stage questionnaire survey data (N = 264). To check whether our empirical data was suitable or not for EFA, we calculated the value of Kaiser–Meyer–Olkin (KMO) and the corresponding p value of Bartlett’s test of sphericity at first. As KMO value (0.84) is higher than the criterion of 0.70 and the corresponding p value of Bartlett’s test of sphericity (χ2(105) = 1585.14, p = 0.00) is lower than 0.05,48,49 our empirical data (N = 264) was suitable for EFA. Table 5 summarizes the results of EFA.
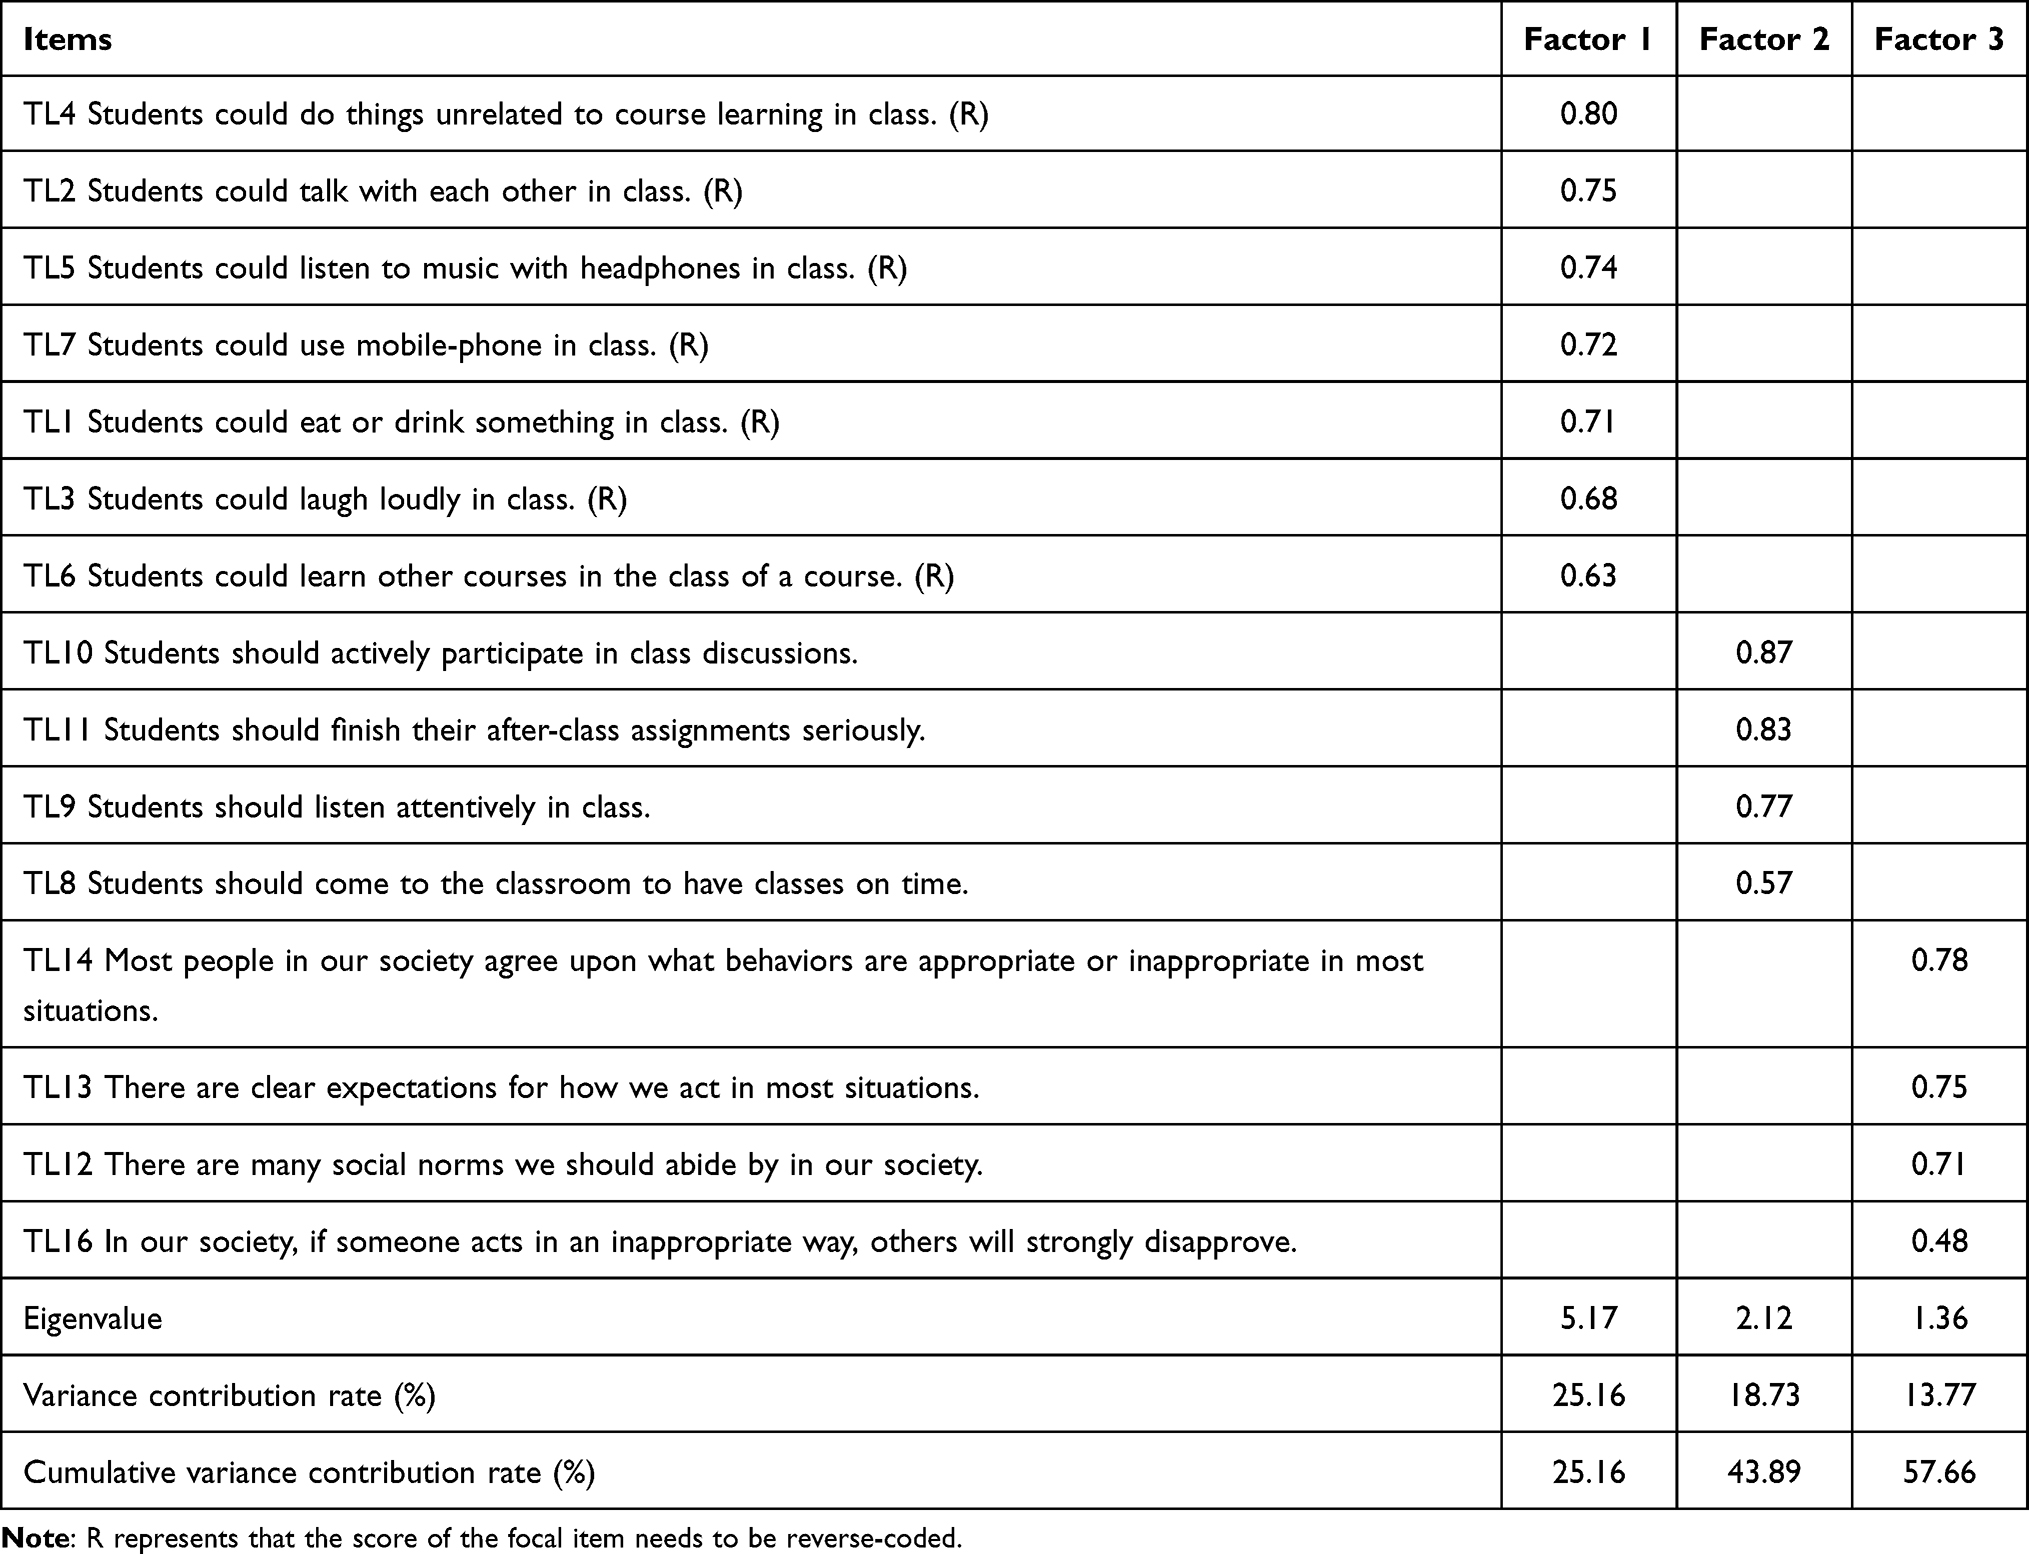 |
Table 5 Results of EFA for the Retained 15 Items (N = 264) |
As shown in Table 5, three factors, of which the eigenvalues (5.17, 2.12, and 1.36) are higher than 1.00 and the cumulative variance contribution rate (57.66%) is more than the acceptable criterion of 50.00%,49 are extracted from the retained 15 items (items TL1-TL14 and TL16). As the loading value of item TL16 (0.48) is lower than the satisfactory criterion of 0.50,50 we drop it. Finally, a 14-item CTLOS-S with 3-factor structure has been yielded. Drawing on our conceptualization of “the cultural tightness-looseness orientation of college students” and the items each factor contains in Table 5, factor 1 is named “tolerance orientation for non-learning-behavior in class” dimension, factor 2 is named “strength orientation of learning-behavior norms in class” dimension, and factor 3 is named “strength orientation of social norms in the generalized macro-context” dimension.
Reliability Test
Using the second-stage questionnaire survey data (N = 755), the reliability tests of the formal 14-item CTLOS-S and its three subscales (see in Appendix 2) were further performed with SPSS software, of which the results suggest that the corresponding Cronbach’s alpha coefficients are 0.85, 0.85, 0.83, and 0.76. Since they are all greater than the satisfactory criterion of 0.70,51 the formal 14-item CTLOS-S and its three subscales all have good reliability.
Construct Validity Test
Also, using the questionnaire data from the second-stage survey (N = 755), a series of confirmatory factor analyses (CFA) with MPLUS software were run to test the 3-factor structure of the formal 14-item CTLOS-S which was found by EFA early. Table 6 summarizes CFA fit results of the hypothesized 3-factor model and its possible, alternative 2-factor and 1-factor models, which indicate that the fit indices of the hypothesized 3-factor model (Model “F1, F2, F3”) are satisfactory with χ2(74) = 318.76, χ2/df = 4.31, CFI = 0.94, TLI = 0.93, RMSEA = 0.06, and SRMR = 0.04 and are significantly superior to all the alternative models at the 0.001 level.52 Besides, the standardized factor loading values of the hypothesized 3-factor model range from 0.51 to 0.84 with an average value of 0.69. Hence, the formal 14-item CTLOS-S has good construct validity.
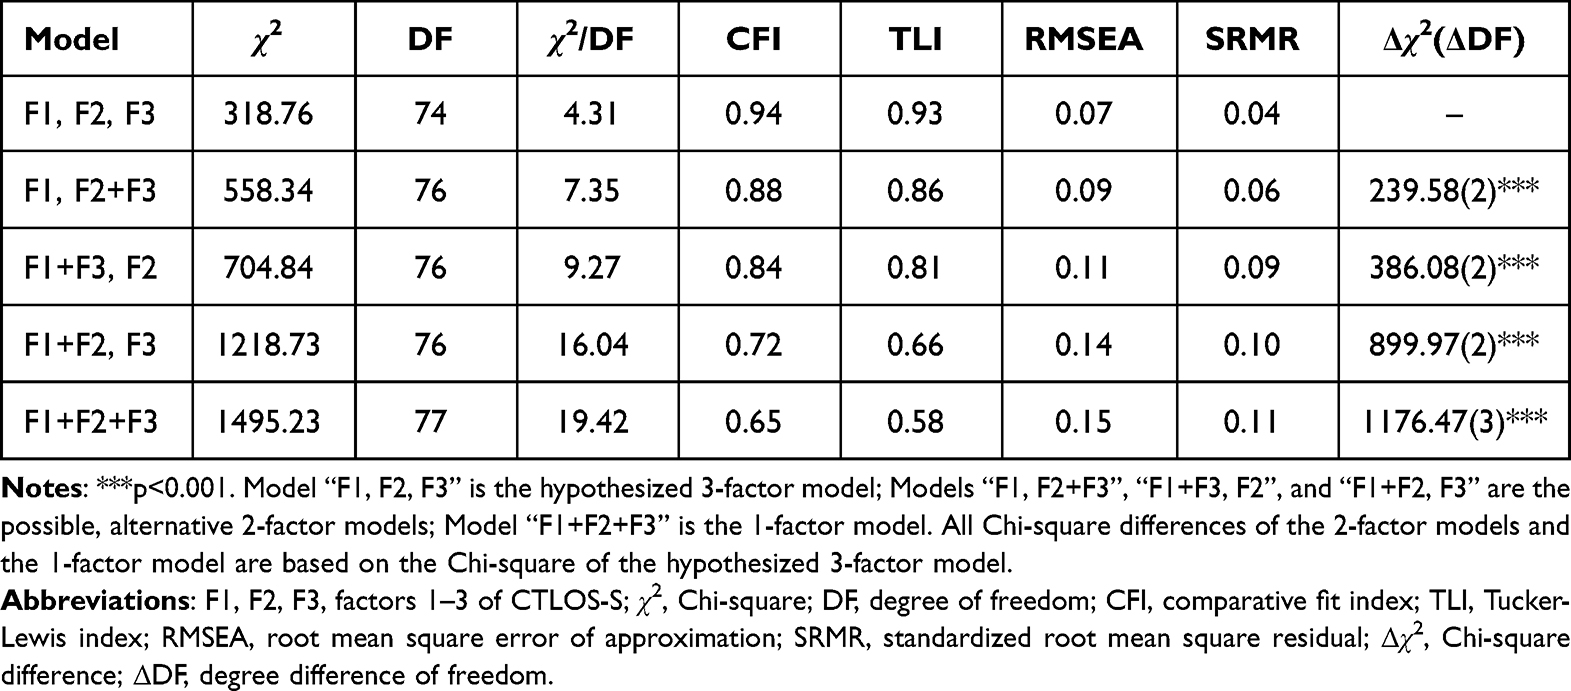 |
Table 6 Fit Results of Confirmatory Factor Analyses (N = 755) |
Criterion Validity Test
Based on the second-stage questionnaire survey data (N = 755), correlation analysis between the formal 14-item CTLOS-S (see in Appendix 2) and the 17-item scale of college students’ learning engagement (see in Appendix 1) with SPSS software was carried out to test the criterion validity of CTLOS-S, of which the results are presented in Table 7.
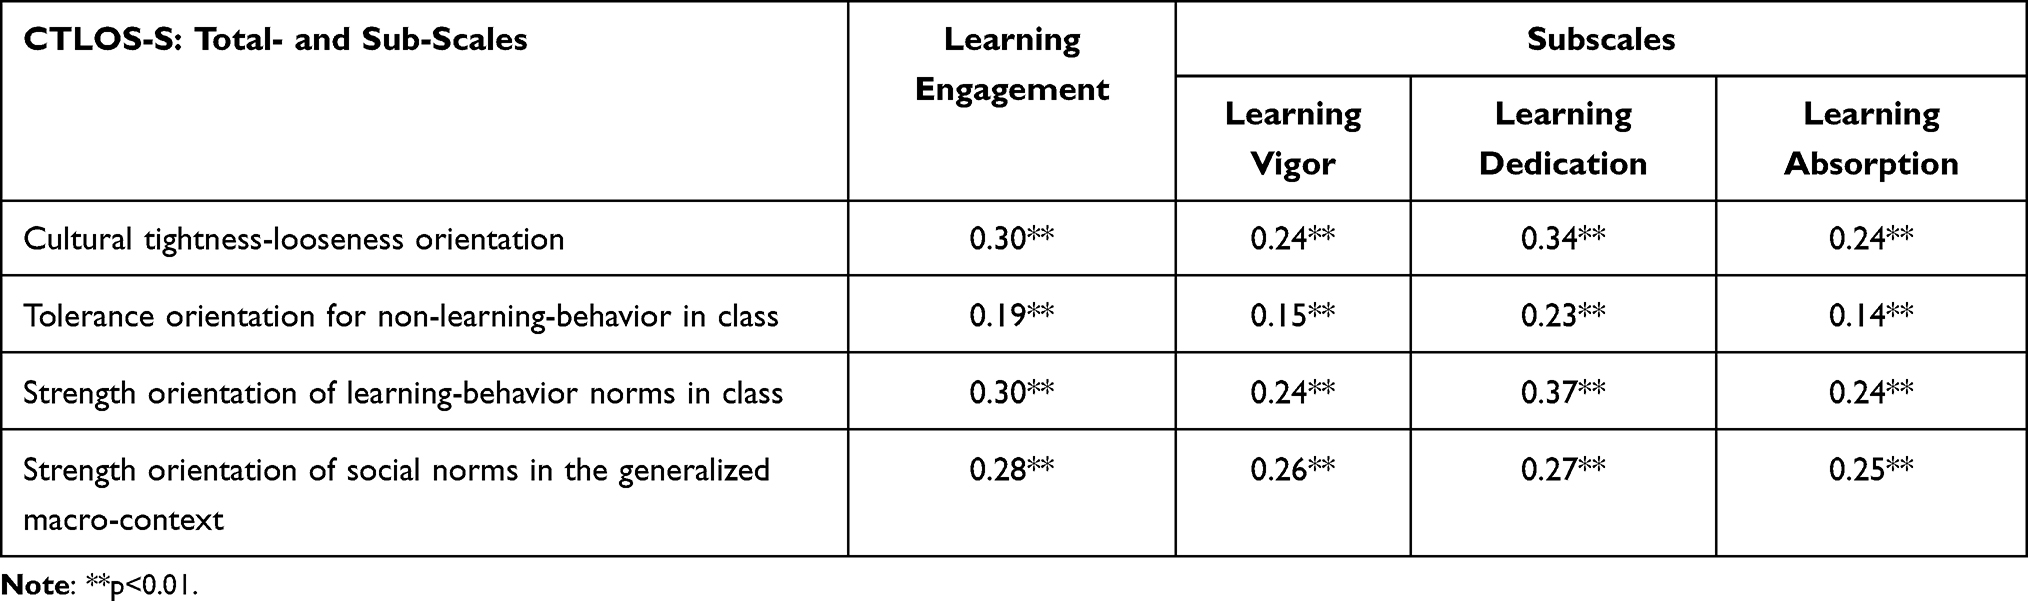 |
Table 7 Results of Criterion Validity Test (N = 755) |
As suggested in Table 7, college students’ cultural tightness-looseness orientation is significantly, positively related to their learning engagement (r = 0.30, p < 0.01), learning vigor (r = 0.24, p < 0.01), learning dedication (r = 0.34, p < 0.01), and learning absorption (r = 0.24, p < 0.01). Moreover, (1) “tolerance orientation for non-learning-behavior in class” dimension is significantly, positively related to learning engagement (r = 0.19, p < 0.01), learning vigor (r = 0.15, p < 0.01), learning dedication (r = 0.23, p < 0.01), and learning absorption (r = 0.14, p < 0.01), (2) “strength orientation of learning-behavior norms in class” dimension is significantly, positively related to learning engagement (r = 0.30, p < 0.01), learning vigor (r = 0.24, p < 0.01), learning dedication (r = 0.37, p < 0.01), and learning absorption (r = 0.24, p < 0.01), and (3) “strength orientation of social norms in the generalized macro-context” dimension is significantly, positively related to learning engagement (r = 0.28, p < 0.01), learning vigor (r = 0.26, p < 0.01), learning dedication (r = 0.27, p < 0.01), and learning absorption (r = 0.25, p < 0.01). Accordingly, the formal 14-item CTLOS-S has good criterion validity.53
Content Validity Test
As well using the second-stage questionnaire survey data (N = 755), correlation analysis between the formal 14-item CTLOS-S and its three subscales (see in Appendix 2) with SPSS software was run to test the internal content validity, of which the results are displayed in Table 8.
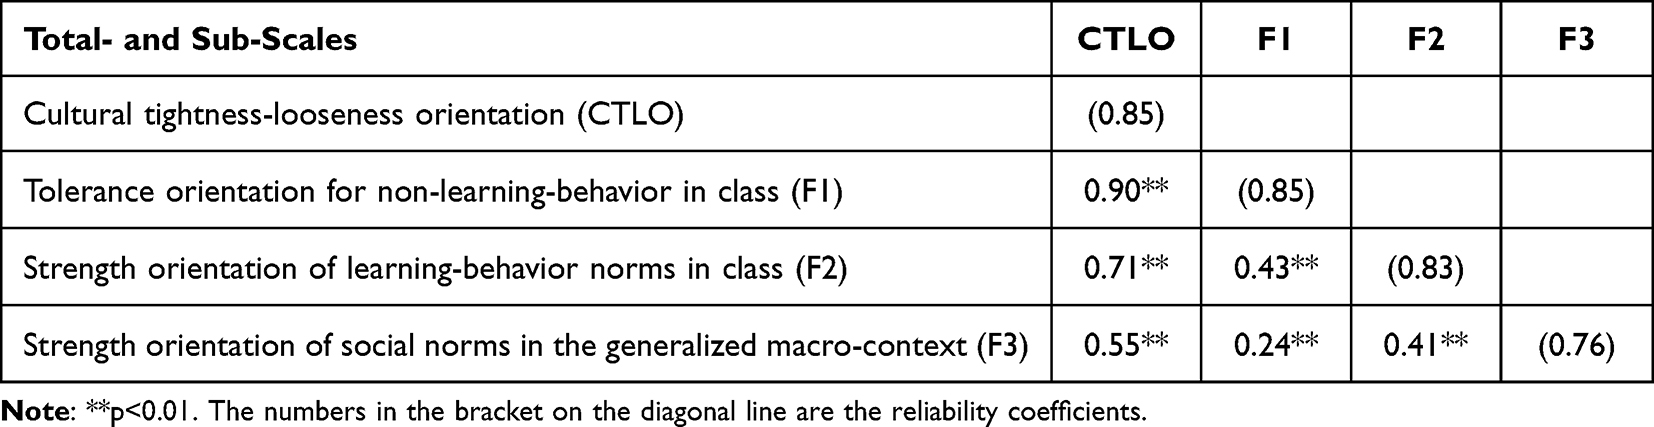 |
Table 8 Results of Content Validity Test (N = 755) |
As shown in Table 8, the correlation coefficients separately between the total scale and its three subscales (0.90, 0.71, and 0.55) and between each two of the three subscales (0.43, 0.24, and 0.41) are all positively significant at the 0.01 level. Therefore, the formal 14-item CTLOS-S has good content validity.
Measurement Invariance Test Across Gender
Employing the second-stage questionnaire survey data (N = 755), measurement invariance test across gender was implemented to check whether the 3-factor structure of the formal 14-item CTLOS-S is established robustly across gender, of which the results are presented in Table 9.
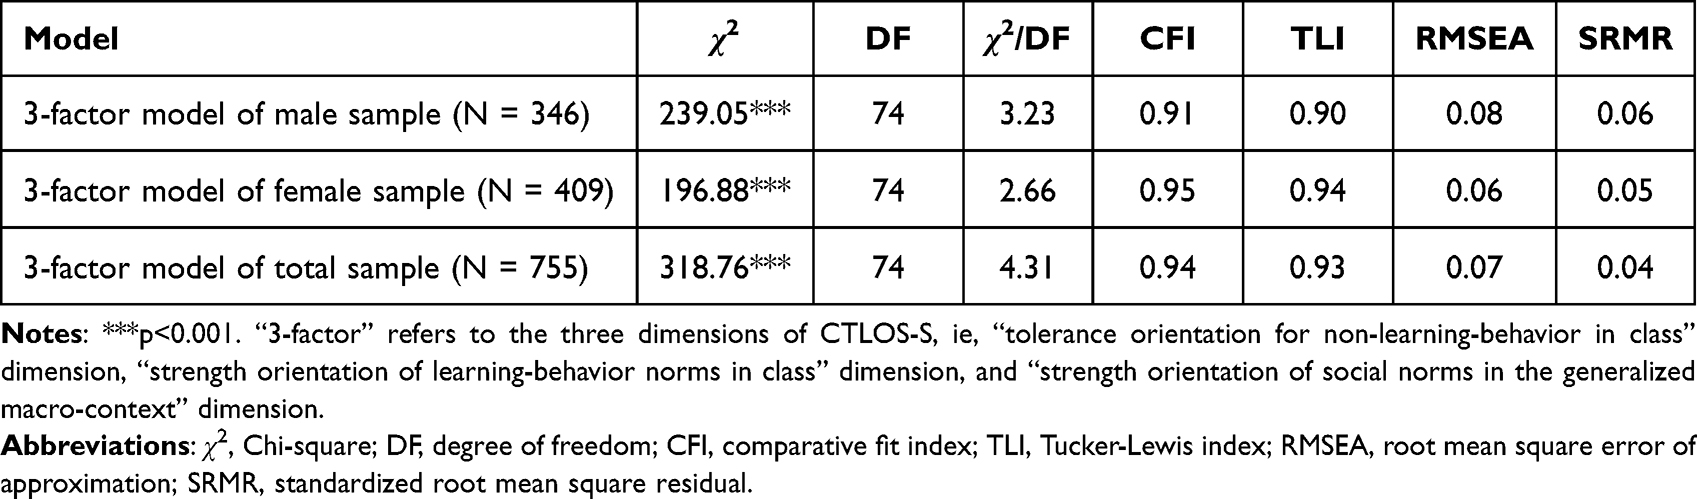 |
Table 9 Results of Measurement Invariance Test Across Gender |
Table 9 suggests that the 3-factor model’s fit indices for male sample’s cultural tightness-looseness orientation (N = 346) are good: χ2(74) = 239.05, χ2/df = 3.23, CFI = 0.91, TLI = 0.90, RMSEA = 0.08, and SRMR = 0.06. The 3-factor model’s fit indices for female sample’s cultural tightness-looseness orientation (N = 409) are as well good: χ2(74) = 196.88, χ2/df = 2.66, CFI = 0.95, TLI = 0.94, RMSEA = 0.06, and SRMR = 0.05. Hence, the formal 14-item CTLOS-S with 3-factor structure has a characteristic of invariance across gender.
Discussion
College students inhabit in not only the generalized macro-context but also the local, unique class-situation, which are distinct from each other yet have the relation that the local class-situation is closely nested in the generalized macro-context. College students’ strength orientation of social norms and tolerance orientation for deviance in both the generalized macro-context and the local class-situation therefore are strong forces resulting in their differentiated psychology and behavior.7,10,54 Particularly, college students’ general perception of what they should do and what they are not allowed to do in the local class-situation will directly influence their learning behavior, learning engagement, and learning achievement, which thereby will further affect the talent-cultivation quality of higher education.55 Hence, our study applies the somewhat broad concept “cultural tightness-looseness” to college students, puts forward a concrete construct “the cultural tightness-looseness orientation of college students”, and seeks to scientifically develop an instrument with good reliability and validity to lay foundation for further empirical research.
According to the existing definition of cultural tightness-looseness and related literature,8–10 the construct “the cultural tightness-looseness orientation of college students” proposed by our study mainly involves college students’ tolerance orientation for non-learning-behavior in class, strength orientation of learning-behavior norms in class, and strength orientation of social norms in the generalized macro-context. Thus, the operationalization of “the cultural tightness-looseness orientation of college students” should comprehensively reflect college students’ cultural tightness-looseness orientation at both the macro-context level and the micro-class level. However, the extant research tends to measure human beings’ cultural tightness-looseness orientation exclusively at the macro-context level and severely neglects its operationalization at the micro-situation level.20–22,30 Accordingly, adopting Gelfand et al’s 6-item scale, which merely focuses on the measurement of human beings’ cultural tightness-looseness orientation at the macro-context level, to operationalize “the cultural tightness-looseness orientation of college students” is undoubtedly biased. Hence, our study develops 11 new items to appraise college students’ cultural tightness-looseness orientation at the micro-class level based on literature review, the open-ended interviews, and experts’ suggestions, which combine with Gelfand et al’s 6 items measuring college students’ cultural tightness-looseness orientation at the macro-context level to form the initial 17 measuring items of CTLOS-S (items TL1-TL17 in Table 2). We performed the first-stage questionnaire survey (N = 264) using the initial CTLOS-S and conducted extreme group test, item-total correlation analysis, Cronbach test, and exploratory factor analysis to yield the formal CTLOS-S, based on which we continued the second-stage questionnaire survey (N = 755) to further test the reliability, validity, and across-gender invariance of the formal CTLOS-S.
As the score-difference value of item TL15 between the high- and low-scored groups in extreme group test is not significant at the 0.05 level, we delete item TL15; since the deletion of item TL17 in Cronbach test could raise the Cronbach’s alpha value of CTLOS-S from 0.75 to 0.85, we delete item TL17; because the loading value of item TL16 in exploratory factor analysis is lower than the satisfactory criterion of 0.50, we drop item TL16. The above three items (items TL15-TL17) deleted from the initial CTLOS-S all belong to the subscale of college students’ strength orientation of social norms in the generalized macro-context. As presented in Table 2, item TL15 mainly depicts college students’ opinion of “Most people in our society have a great deal of freedom in deciding how they want to behave in most situations”, item TL16 largely describes college students’ viewpoint of “In our society, if someone acts in an inappropriate way, others will strongly disapprove”, and item TL17 primarily reflects college students’ perception of “People in our society almost always follow social norms”. It is speculated by our study that the Chinese college students may have different understandings about “a great deal”, “strongly”, and “almost”. As they do not reach a consensus on the extent to what extent the freedom can be “a great deal” of freedom, the score-difference value of item TL15 between the high- and low-scored groups is not statistically significant; since they do not agree with the extent to what extent others’ disapproval can be “strong”, the loading value of item TL16 in exploratory factor analysis is lower; as they do not have a shared understanding of the extent to what extent the occurring frequency can be “almost” always, item TL17 makes little contribution to the reliability of CTLOS-S.
The confirmatory factor analysis results of the formal 14 measuring items support the hypothesized 3-factor structure of CTLOS-S. Specifically, the first factor primarily involves college students’ tolerance orientation for non-learning-behavior in class which contains 7 reverse-scored items (items TL1-TL7 in Table 5), the second factor mainly refers to college students’ strength orientation of learning-behavior norms in class which contains 4 items (items TL8-TL11 in Table 5), and the third factor largely encompasses college students’ strength orientation of social norms in the generalized macro-context which contains 3 items (items TL12-TL14 in Table 5). The positively significant results of correlation analysis between the total scale and its three subscales suggest good content validity of CTLOS-S. Good criterion validity of CTLOS-S is as well supported by the significant, positive correlation coefficients between “the cultural tightness-looseness orientation of college students” and “learning engagement”. Moreover, the testing results of measurement invariance across gender confirm that the 3-factor structure of the formal CTLOS-S remains robust across gender, indicating that there is no significant difference between Chinese male and female college students in their understanding of each measuring item in the formal CTLOS-S.
To sum up, the formal 14-item CTLOS-S with 3-factor structure developed by our study meets the requirements of psychometrics well and can be used as an effective measuring-tool to evaluate “the cultural tightness-looseness orientation of college students”. There are, however, two main research limitations that should be addressed in future. First, we need more empirical evidence supporting the deletion of items TL15-TL17 from Gelfand et al’s original 6 items measuring college students’ strength orientation of social norms in the generalized macro-context. Second, pertaining to the 11 measuring items (items TL1-TL11 in Table 5) we newly develop to assess college students’ tolerance orientation for non-learning-behavior in class and strength orientation of learning-behavior norms in class, we should continue to conduct more questionnaire surveys among college students from other countries or regions in the future to further improve the reliability and validity, since they are merely developed under the background of Chinese colleges and universities.
Conclusion
Our study applies the broad concept “cultural tightness-looseness” to college students and puts forward a new construct “the cultural tightness-looseness orientation of college students”. To lay foundation for empirical research, we develop a 14-item CTLOS-S (see in Appendix 2) after a series of works including literature review, the open-ended interview among experts, induction, deduction, extreme group test, item-total correlation analysis, reliability test, validity test, and measurement invariance test across gender. The 14-item CTLOS-S is confirmed to have good reliability and validity. Besides, it contains three subscales separately assessing college students’ tolerance orientation for non-learning-behavior in class, strength orientation of learning-behavior norms in class, and strength orientation of social norms in the generalized macro-context. Scholars attempting to conduct quantitative studies on the influencing factors or the potential consequences of college students’ cultural tightness-looseness could adopt this 14-item CTLOS-S.
Ethical Statement
Our study was approved by the Human Research Ethics Committee (HREC) at School of Mathematics and Statistics, Xuzhou University of Technology. All procedures involving human participants were in accordance with the ethical standards of the institutional and/or national research committee and with the 1964 Helsinki Declaration and its later amendments or comparable ethical standards with written informed consent from all subjects.
Acknowledgments
The authors acknowledge financial support from the Philosophy and Social Science Research Project in Colleges and Universities in Jiangsu Province (the grant No. 2022SJYB1164), Postgraduate Research & Practice Innovation Program of Jiangsu Normal University (the grant No. 2022XKT0825), and Innovation and Entrepreneurship Training Program for College Students of Jiangsu Normal University (the grant No. XSJCX12144).
Disclosure
The authors report no conflicts of interest in this work.
References
1. Shi Z, Li S, Chen G. Assessing the psychometric properties of the Chinese version of ten-item personality inventory (TIPI) among medical college students. Psychol Res Behav Manag. 2022;15:1247–1258. doi:10.2147/PRBM.S357913
2. Swaim JA, Maloni MJ, Napshin SA, et al. Influences on student intention and behavior toward environmental sustainability. J Bus Ethics. 2014;124(3):465–484. doi:10.1007/s10551-013-1883-z
3. Swan SC, Lasky NV, Fisher BS, et al. Just a dare or unaware? Outcomes and motives of drugging (“drink spiking”) among students at three college campuses. Psychol Violence. 2017;7(2):253–264. doi:10.1037/vio0000060
4. Zhang H, Sun S. Zero-sum construal of workplace success promotes initial work role behavior by activating prevention focus: evidence from Chinese college and university graduates. Front Psychol. 2020;11:1191. doi:10.3389/fpsyg.2020.01191
5. Lipnevich A, Smith J. Effects of differential feedback on students’ examination performance. J Exp Psychol Appl. 2009;15(4):319–333. doi:10.1037/a0017841
6. Fishbein M, Ajzen I. Belief, Attitude, Intention, and Behavior: An Introduction to Theory and Research. Reading, MA: Addision-Wesley; 1975.
7. Chan DKS, Gelfand MJ, Triandis HC, et al. Tightness-looseness revisited: some preliminary analyses in Japan and the United States. Int J Psychol. 1996;31(1):1–12. doi:10.1080/002075996401179
8. Triandis HC. The self and social behavior in differing cultural contexts. Psychol Rev. 1989;96(3):506–520. doi:10.1037/0033-295x.96.3.506
9. Gelfand MJ, Nishii LH, Raver JL. On the nature and importance of cultural tightness-looseness. J Appl Psychol. 2006;91(6):1225–1244. doi:10.1037/0021-9010.91.6.1225
10. Gelfand MJ, Raver JL, Nishii LH, et al. Differences between tight and loose cultures: a 33-nation study. Science. 2011;332(6033):1100–1104. doi:10.1126/science.1197754
11. Ryan BF, Straus MA. The integration of Sinhalese society. Res Stud State Coll Washington. 1954;22:179–227.
12. Pelto PJ. The differences between “tight” and “loose” societies. Trans-Action. 1968;5:37–40.
13. Mrazek AJ, Chiao JY, Blizinsky KD, et al. The role of culture-gene coevolution in morality judgment: examining the interplay between tightness-looseness and allelic variation of the serotonin transporter gene. Culture Brain. 2013;1:100–117. doi:10.1007/s40167-013-0009-x
14. Roos P, Gelfand M, Nau D, et al. Societal threat and cultural variation in the strength of social norms: an evolutionary basis. Organ Behav Hum Dec. 2015;129:14–23. doi:10.1016/j.obhdp.2015.01.003
15. Gelfand MJ, Raver JL, Nishii LH, et al. Assessment of cultural tightness-looseness across nations. Unpublished research scale, Cornell University; 2007. Available from: http://people.ucalgary.ca/∼taras/private/CultureSurveyCatalogue.pdf.
16. Harrington JR, Gelfand MJ. Tightness-looseness across the 50 United States. Proc Natl Acad Sci USA. 2014;111(22):7990–7995. doi:10.1073/PNAS.1317937111
17. Uz I. The index of cultural tightness and looseness among 68 countries. J Cross Cult Psychol. 2015;46(3):319–335. doi:10.1177/0022022114563611
18. Carpenter S. Effects of cultural tightness and collectivism on self-concept and causal attributions. Cross Cult Res. 2000;34(1):38–56. doi:10.1177/106939710003400103
19. Gelfand MJ. Culture’s constraints: international differences in the strength of social norms. Curr Dir Psychol Sci. 2012;21(6):420–424. doi:10.1177/0963721412460
20. Li C, Fock H, Mattila AS. The role of cultural tightness-looseness in the ethics of service recovery. J Market. 2012;25(1):3–16. doi:10.1080/08911762.2012.697379
21. Church AT, Katigbak MS, Locke KD, et al. Need satisfaction and well-being: testing self-determination theory in eight cultures. J Cross Cult Psychol. 2012;44(4):507–534. doi:10.1177/0022022112466590
22. Han H, Glover GH, Jeong C. Cultural Influences on the neural correlate of moral decision making processes. Behav Brain Res. 2014;259:215–228. doi:10.1016/J.BBR.2013.11.012
23. Chua RYJ, Roth Y, Lemoine JF. The impact of culture on creativity: how cultural tightness and cultural distance affect global innovation crowdsourcing work. Admin Sci Quart. 2015;60(2):189–227. doi:10.1177/0001839214563595
24. Guan Y, Chen SX, Levin N, et al. Differences in career decision-making profiles between American and Chinese university students: the relative strength of mediating mechanisms across cultures. J Cross Cult Psychol. 2015;46(6):856–872. doi:10.1177/0022022115585874
25. Tang Z, Chen L, Zhou Z, et al. The effects of social media use on control of corruption and moderating role of cultural tightness-looseness. Gov Inform Q. 2019;36(4):101384. doi:10.1016/j.giq.2019.06.001
26. Cremer S, Loebbecke C. Patented innovations developed in networks: the role of cultural looseness. Ind Market Manag. 2020;89:459–470. doi:10.1016/j.indmarman.2019.12.013
27. Chen H, Wang X, Zang H, et al. Being a tough person in a tight world: cultural tightness leads to a desire for muscularity. J Exp Soc Psychol. 2021;96:104183. doi:10.1016/j.jesp.2021.104183
28. Gelfand MJ, Jackson JC, Pan X, et al. The relationship between cultural tightness–looseness and COVID-19 cases and deaths: a global analysis. Lancet Planet Health. 2021;5(3):135–144. doi:10.1016/S2542-5196(20)30301-6
29. Uzuegbunam I, Pathak S, Taylor-Bianco A, et al. How cultural tightness interacts with gender in founding teams: insights from the commercialization of social ventures. J Bus Ventur. 2021;36(4):106127. doi:10.1016/j.jbusvent.2021.106127
30. Wang L, Song Y. The impact of school tight-loose culture on bullying in middle school: the mediating effect of collective moral disengagement and collective efficacy (in Chinese). Educ Res Exp. 2021;65(1):93–96.
31. Li C, Gelfand MJ. The influence of cultural tightness-looseness on cross-border acquisition performance. J Econ Behav Organ. 2022;195:1–15. doi:10.1016/j.jebo.2022.01.004
32. Lopez H, Devos T, Somo A. State-level cultural tightness-looseness accounts for implicit associations between American and White identities. Curr Res Ecol Soc Psychol. 2022;3:100033. doi:10.1016/j.cresp.2021.100033
33. Noh M, Cho MK. Cultural tightness and accounting conservatism. J Contemp Account. 2022;18:100305. doi:10.1016/j.jcae.2021.100305
34. Aarts H, Dijksterhuis A. The silence of the library: environment, situational norm, and social behavior. J Pers Soc Psychol. 2003;84(1):18–28. doi:10.1037/0022-3514.84.1.18
35. Eriksson K, Strimling P, Gelfand M, et al. Perceptions of the appropriate response to norm violation in 57 societies. Nat Commun. 2021;12(1):1481. doi:10.1038/s41467-021-21602-9
36. Jetten J, Mols F, Postmes T. Relative deprivation and relative wealth enhances anti-immigrant sentiments: the v-curve re-examined. PLoS One. 2015;10(10):e0139156. doi:10.1371/journal.pone.0139156
37. Blake KR, Brooks RC. Status anxiety mediates the positive relationship between income inequality and sexualization. Proc Natl Acad Sci USA. 2019;116(50):25029–25033. doi:10.1073/pnas.1909806116
38. Jackson JC, Gelfand M, Ember CR. A global analysis of cultural tightness in non-industrial societies. Proc Biol Sci. 2020;287(1930):20201036. doi:10.1098/rspb.2020.1036
39. Flora DB, Flake JK. The purpose and practice of exploratory and confirmatory factor analysis in psychological research: decisions for scale development and validation. Can J Behav Sci. 2017;49(2):78–88. doi:10.1037/cbs0000069
40. Bryman A. Social Research Methods.
41. Hinkin T. A brief tutorial on the development of measures for use in survey questionnaires. Org Res Methods. 1998;1(1):104–121. doi:10.1177/109442819800100106
42. Brislin RW. Translation and content analysis of oral and written material. In: Triandis HC, Berry JW, editors. Handbook of Cross-Cultural Psychology. Boston, M A: Allyn & Bacon; 1980:349–444.
43. Zhang H, Sun S, Xu H, et al. Detrimental effect of the characteristic-human-capital-inputs-based horizontal pay dispersion on team member work role performance via employee benign and malicious envy: an evidence from China. Psychol Res Behav Manag. 2022;15:3097–3116. doi:10.2147/PRBM.S383969
44. Schaufeli WB, Martínez IM, Pinto AM, et al. Burnout and engagement in university students: a cross-national study. J Cross Cult Psychol. 2002;33(5):464–481. doi:10.1177/0022022102033005003
45. Schaufeli WB, Salanova M, González-Romá V, et al. The measurement of engagement and burnout: a confirmative analytic approach. J Happiness Stud. 2002;3(1):71–92. doi:10.1023/A:1015630930326
46. Zhang H. Horizontal Pay Dispersion and Team Member Performance: Based on the Formative-Causation and Envy (in Chinese). Beijing: China Financial & Economic Publishing House; 2020.
47. Lu W. SPSS for Windows: Statistical Analysis (in Chinese). Beijing: Publishing House of Electronics Industry; 2006.
48. Tabachnick B, Fidel F. Using Multivariate Statistics. New York: Harper Collins Publishers; 1989.
49. Kaiser HF. An index of factorial simplicity. Psychometrika. 1974;39(1):31–36. doi:10.1007/BF02291575
50. Hair JF, Black WC, Babin BJ, et al. Multivariate Data Analysis: A Global Perspective.
51. Nunnally JC. Psychometric Theory.
52. Bentler PM, Bonett DG. Significance tests and goodness of fit in the analysis of covariance structures. Psychol Bull. 1980;88(3):588–606. doi:10.1037/0033-2909.88.3.588
53. Luo S, Jiang Y. Management Survey Research Methodology. Chongqing University Press: Chongqing; 2014.
54. Lu J, Chen H, Yue G. Tight-loose culture: a new dimension of cross-cultural psychology (in Chinese). Adv Psychol Sci. 2017;25(5):887–902. doi:10.3724/SP.J.1042.2017.00887
55. Jiang J, Ke G. China’s move to mass higher education since 1998: analysis of higher education expansion policies. High Educ Q. 2021;75:418–437. doi:10.1111/hequ.12313
 © 2023 The Author(s). This work is published and licensed by Dove Medical Press Limited. The
full terms of this license are available at https://www.dovepress.com/terms
and incorporate the Creative Commons Attribution
- Non Commercial (unported, 3.0) License.
By accessing the work you hereby accept the Terms. Non-commercial uses of the work are permitted
without any further permission from Dove Medical Press Limited, provided the work is properly
attributed. For permission for commercial use of this work, please see paragraphs 4.2 and 5 of our Terms.
© 2023 The Author(s). This work is published and licensed by Dove Medical Press Limited. The
full terms of this license are available at https://www.dovepress.com/terms
and incorporate the Creative Commons Attribution
- Non Commercial (unported, 3.0) License.
By accessing the work you hereby accept the Terms. Non-commercial uses of the work are permitted
without any further permission from Dove Medical Press Limited, provided the work is properly
attributed. For permission for commercial use of this work, please see paragraphs 4.2 and 5 of our Terms.