Back to Journals » Diabetes, Metabolic Syndrome and Obesity » Volume 17
Development of Serum Lactate Level-Based Nomograms for Predicting Diabetic Kidney Disease in Type 2 Diabetes Mellitus Patients
Authors Jiang C ![]() , Ma X, Chen J, Zeng Y, Guo M
, Ma X, Chen J, Zeng Y, Guo M ![]() , Tan X, Wang Y, Wang P, Yan P, Lei Y, Long Y
, Tan X, Wang Y, Wang P, Yan P, Lei Y, Long Y ![]() , Law BYK, Xu Y
, Law BYK, Xu Y
Received 6 December 2023
Accepted for publication 19 February 2024
Published 1 March 2024 Volume 2024:17 Pages 1051—1068
DOI https://doi.org/10.2147/DMSO.S453543
Checked for plagiarism Yes
Review by Single anonymous peer review
Peer reviewer comments 4
Editor who approved publication: Prof. Dr. Juei-Tang Cheng
Chunxia Jiang,1– 4,* Xiumei Ma,1– 4,* Jiao Chen,2– 5,* Yan Zeng,1– 4 Man Guo,2– 4 Xiaozhen Tan,2– 4 Yuping Wang,1,6 Peng Wang,1 Pijun Yan,2– 4 Yi Lei,1– 4 Yang Long,2– 4 Betty Yuen Kwan Law,1 Yong Xu1– 4
1Dr. Neher’s Biophysics Laboratory for Innovative Drug Discovery, State Key Laboratory of Quality Research in Chinese Medicine, Faculty of Chinese Medicine, Macau University of Science and Technology, Macao, People’s Republic of China; 2Department of Endocrinology and Metabolism, The Affiliated Hospital of Southwest Medical University, Luzhou, Sichuan, People’s Republic of China; 3Metabolic Vascular Disease Key Laboratory of Sichuan Province, The Affiliated Hospital of Southwest Medical University, Luzhou, Sichuan, People’s Republic of China; 4Sichuan Clinical Research Center for Nephropathy, The Affiliated Hospital of Southwest Medical University, Luzhou, Sichuan, People’s Republic of China; 5Department of Endocrinology, The Third’s Hospital of Mianyang, Sichuan Mental Health Center, Mianyang, Sichuan, People’s Republic of China; 6Department of Breast, Thyroid and Vascular Surgery, Traditional Chinese Medicine Hospital Affiliated to Southwest Medical University, Luzhou, Sichuan, People’s Republic of China
*These authors contributed equally to this work
Correspondence: Betty Yuen Kwan Law, Dr. Neher’s Biophysics Laboratory for Innovative Drug Discovery, State Key Laboratory of Quality Research in Chinese Medicine, Faculty of Chinese Medicine, Macau University of Science and Technology, Macao, 999078, People’s Republic of China, Email [email protected] Yong Xu, Department of Endocrinology and Metabolism, The Affiliated Hospital of Southwest Medical University, Luzhou, 646000, People’s Republic of China, Email [email protected]
Purpose: To establish nomograms integrating serum lactate levels and traditional risk factors for predicting diabetic kidney disease (DKD) in type 2 diabetes mellitus (T2DM) patients.
Patients and methods: A total of 570 T2DM patients and 100 healthy subjects were enrolled. T2DM patients were categorized into normal and high lactate groups. Univariate and multivariate logistic regression analyses were employed to identify independent predictors for DKD. Then, nomograms for predicting DKD were established, and the model performance was evaluated using the area under the receiver operating characteristic curve (AUC), calibration, and decision curve analysis (DCA).
Results: T2DM patients exhibited higher lactate levels compared to those in healthy subjects. Glucose, platelet, uric acid, creatinine, and hypertension were independent factors for DKD in T2DM patients with normal lactate levels, while diabetes duration, creatinine, total cholesterol, and hypertension were indicators in high lactate levels group (P< 0.05). The AUC values were 0.834 (95% CI, 0.776 to 0.891) and 0.741 (95% CI, 0.688 to 0.795) for nomograms in both normal lactate and high lactate groups, respectively. The calibration curve demonstrated excellent agreement of fit. Furthermore, the DCA revealed that the threshold probability and highest Net Yield were 17– 99% and 0.36, and 24– 99% and 0.24 for the models in normal lactate and high lactate groups, respectively.
Conclusion: The serum lactate level-based nomogram models, combined with traditional risk factors, offer an effective tool for predicting DKD probability in T2DM patients. This approach holds promise for early risk assessment and tailored intervention strategies.
Keywords: serum lactate, diabetic kidney disease, nomograms, prediction model, risk factors
Introduction
Diabetic kidney disease represents a significant and severe microvascular complication of diabetes mellitus (DM), which is characterized by elevated urine protein and reduced glomerular filtration rate (GFR).1,2 With a global estimate of around 537 million adult diabetic patients in 2021 released by the International Diabetes Federation (IDF).3 It is concerning that approximately 20–40% of diabetic patients will develop DKD, which stands as a contributor to chronic kidney disease and end-stage kidney disease (ESKD).4,5 Advanced patients need dialysis or kidney transplantation to maintain life, greatly elevating the risk of cardiovascular morbidity and mortality.6 Particularly, patients experiencing albuminuria and reduced GFR of DKD have greater risk for mortality (HR: 2.08, 95% CI: 1.88–2.30).7 Thus, there is a pressing need for enhanced predictive tools and markers to identify and manage DKD in its early stage.
While DKD diagnosis is established through criteria set by organizations such as the National Kidney Foundation Kidney Disease Outcomes Quality Initiative (NKF-KDOQI) (2007)8 and Kidney Disease: Improving Global Outcomes (KDIGO) (2022) guidelines,9 which incorporate estimated glomerular filtration rate (eGFR), urine albumin-to-creatinine ratio (UACR), and renal biopsy, which is the gold standard. While it is important to recognize the variability and fluctuations in GFR and UACR in diabetes patients over time, the evidence suggests a decrease in albuminuria prevalence with time and a reduced eGFR increased, indicating non-classical courses of DKD including non-albuminuric DKD.4 Current management strategies for DKD encompass lifestyle modifications, self-management practices, first-line drug therapies like metformin and sodium-glucose cotransporter-2 inhibitors (SGLT2i), as well as additional risk factors control.9 However, the risk for ESKD increased in T2DM (HR: 2.32, 95% CI 2.30–2.35) and in type 1 diabetes mellitus (T1DM) (HR: 10.92, 95% CI 10.15–11.75) for a failure to achieve target levels of these risk factors.10 Therefore, measurements of eGFR and UACR commonly used to predict progression to the advanced stages of DKD are proving inadequate. It has become imperative to develop more novel effective predictive tools to accurately gauge the progression of DKD.
Current studies have shown that advanced age, prolonged diabetes duration, and elevated blood pressure, lipids, body mass index (BMI), and glycosylated hemoglobin are risk factors for DKD.10,11 With the development of metabolomics, more and more biomarkers of DKD have been explored.12,13 Lactate, a metabolite associated with glucose metabolism and energy supply under anaerobic conditions, has recently gained attention for its potential role as a biomarker. It is becoming increasingly clear that lactate, previously considered a metabolic waste, is also involved in cell signaling, gene expression, and disease occurrence.14 Multiple biological processes are involved in the occurrence of DKD, especially the glycolytic pathway, confirming that lactate is one of the most important biomarkers for non-invasive early diagnosis of DKD.15 Therefore, evaluating the level of lactate in patients with T2DM, and exploring the prediction of DKD risk from the perspective of lactate levels may provide a new direction for the diagnosis and treatment of DKD.
Nomogram is a method to quantitatively evaluate whether multiple variables are involved in the occurrence of a certain disease, which displays the functional relationship between multiple variables in plane coordinates, draws multiple line segments at a specific proportion according to the regression results, and visualizes the results of the regression equation, so that the individual’s disease risk or survival probability can be easily calculated.16 Previous studies have shown the application of nomogram in DKD,17,18 but did not separately explain the risk factors of DKD under different lactate levels and the establishment of prediction models. To address the need for more accurate prediction models, this study sought to assess serum lactate levels in healthy individuals and T2DM patients. We explored the high-risk factors of DKD, and established risk prediction models for DKD based on serum lactate levels, employing the nomogram technique. It provides a simple, low-cost, and highly sensitive tool for the prediction of DKD, and provides new ideas for the clinical diagnosis and treatment of DKD.
Methods
Study Design and Participant Characteristics
This retrospective study collected data from patients with T2DM admitted to the Department of Endocrinology and Metabolism of the Affiliated Hospital of Southwest Medical University and healthy subjects (no history of disease and abnormal physical examination) from the physical examination center between September 2018 and March 2023. The study cohort consisted of 100 healthy individuals, and a total of 570 patients among the 1100 patients with T2DM, including 305 males (53.5%), and 248 patients with DKD among diabetes patients, as per criteria established by WHO,19 NKF-KDOQI (2007),8 and (KDIGO) (2022) guidelines,9 DKD was diagnosed as eGFR <60 mL/min/1.73m2 and/or UACR >30 mg/g for ≥3 months caused by diabetes. Hyperlactatemia is defined as the serum lactate level greater than 2.5 mmol/L, without acute infection, surgery, trauma, and other stressful situations. Inclusion criteria: patients over 18 years old diagnosed with T2DM. Exclusion criteria: patients with severe visceral diseases, recent acute complications of diabetes, recent infection, chronic infectious diseases, pregnancy, malignant tumors, renal function damage caused by other clearly diagnosed renal diseases, acute renal injury, patients with lactic acidosis, unwilling collaborator. All protocols followed the ethical guidelines of Declaration of Helsinki, the study has been approved by the Ethics Committee of the Affiliated Hospital of Southwest Medical University (license number: KY2023142). When we retrospectively collected the data of previous cases, written informed consent was waived due to the retrospective nature and low risk of the study. We obtained informed consent when collecting blood and urine from healthy people.
Data Collection and Clinical Variables
Patient data encompassed hospitalization number, sex, age, duration of diabetes, anthropometric data of height (cm), body weight (BW, Kg), systolic blood pressure (SBP, mmHg), diastolic blood pressure (DBP, mmHg), heart rate (HR, bpm), lifestyle habits (smoking, drinking), comorbidities, and hypoglycemic drug use, BMI was calculated as weight (kg)/(height (m))2. Blood cell composition (white blood cell count (WBC, 10^9/L), neutrophil cell rate (NEU-R, %), lymphocyte rate (LYM-R, %), monocyte rate (MONO-R, %), red blood cell count (RBC, 10^12/L), hemoglobin (HGB, g/L), platelet count (PLT, 10^9/L)), biochemical analyses (Liver function (alanine aminotransferase (ALT, U/L), aspartate aminotransferase (AST, U/L)), renal function (urea (mmol/L), uric acid (UA, μmol/L), creatinine (Crea, μmol/L)), fasting blood glucose (FBG, mmol/L) and blood lipid profile (total cholesterol (TC, mmol/L), triglyceride (TG, mmol/L), high-density lipoprotein cholesterol (HDL-C, mmol/L), low-density lipoprotein cholesterol (LDL-C, mmol/L))) were performed using automatic hematology analyzer (sysmex18932) and automatic biochemical analyzer (Mindray BS-2000M). Blood glucose, lactate (mmol/L), albumin in urine (ALBU, mg/L), and creatinine were measured by hexokinase method, lactate oxidase method, immune transmission turbidimetric method, and sarcosine oxidase method, respectively. EGFR (mL/min) is calculated using the CKD-EPI formula.
Establishment of Prediction Model and Statistical Analysis
Statistical analysis was conducted using IBM SPSS Statistics 19 and R software (R version 4.2.1). Normality of data distribution was assessed using the Shapiro–Wilk test. Descriptive statistics included mean ± standard for normal distribution continuous variables, median (95% confidence interval (CI)) for non-normal distribution variables, and n (%) for categorical variables. The differences between groups of continuous variables were evaluated by Student’s t-test, while categorical variables were assessed with chi-square test. According to the concentrations of lactate in serum, patients with T2DM were categorized into normal lactate (≤2.5 mmol/L, n = 202) and high lactate (>2.5 mmol/L, n = 368) groups. Univariate and multivariate logistic regression analyses were employed using the R language rms package to identify DKD risk factors for each lactate group. With optimal predictive factors selected, the features were considered to be odds ratios (OR) and a P value with 95% CI, the statistical significance levels were all two-sided. Furthermore, we developed DKD prediction models using independent risk factors identified from the multivariate logistic regression analysis using the R language rms package. For the normal lactate level group, DKD linear_predictors = 0.106 * glucose + 0.007 * PLT + 0.005 * UA + 0.023 * Crea + 1.048 (hypertension yes) – 6.871. Similarly, for the high lactate level group, DKD linear_predictors = 0.065 * duration + 0.019 * Crea + 0.304 * TC + 0.830 (hypertension yes) – 4.269. DKD predicted_probability = \frac{1}{1 + e^ {-linear_predictor}}. These formulas were used to develop nomograms for individualized risk assessment. The discrimination and prediction ability of the models were assessed using the C-index called area under the receiver operating characteristic (ROC) curve (AUC) operated by R language pROC package. The consistency between predicted results and observed results was evaluated using the Hosmer–Lemeshow goodness-of-fit test and calibration curve (operated by R language rms package). We utilized the R language’s nricens package to perform DCA for assessing the clinical applicability of the nomograms. Using the probability threshold as the X-axis and the net benefit as the Y-axis, DCA evaluated the utility of the nomograms across different thresholds. This analysis aided in determining the effectiveness of the nomograms in guiding clinical decision-making.
Results
Participant Characteristics
A total of 570 patients with T2DM and 100 healthy subjects participated in the study. Of the patients with T2DM, 322 were diagnosed as T2DM without DKD (176 males and 146 females), and 248 were diagnosed with DKD (129 males and 119 females) by physicians, resulting in a DKD prevalence of 43.5%. Patients with T2DM exhibited higher age, BW, BMI, SBP, DBP, glucose levels, lactate levels, TG, Urea, UA, Crea, ALBU, UACR, ALT, AST, WBC, NEU-R, MONO-R, and lower levels of HR, HDL-C, eGFR, LYM-R, PLT compared with healthy controls, with statistically significant differences (Supplement Table 1). Notably, serum lactate levels were higher in T2DM patients compared to healthy subjects, with average concentrations of 2.48 mmol/L in healthy subjects, 2.93 mmol/L in T2DM patients without DKD, and 2.84 mmol/L in T2DM patients with DKD (Figure 1).
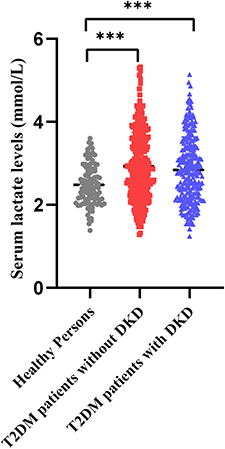 |
Figure 1 Serum lactate levels in subjects with healthy persons, T2DM patients without DKD, and DKD patients. Serum lactate levels were higher in T2DM patients with DKD and those without than in healthy controls. ***p<0.001. |
Participant Stratification and Risk Factors
Based on serum lactate levels, all patients with T2DM were categorized into two groups: a normal lactate group and a high lactate group. Each group of patients was divided into T2DM patients with DKD and those without. Analysis of the differences between DKD and T2DM patients without DKD within the normal and high lactate groups was summarized (Tables 1 and 2). In the normal lactate group, patients with DKD exhibited a longer duration of diabetes, higher levels of glucose, WBC, NEU-R, PLT, Urea, UA, Crea, TG, ALBU, UACR, and a higher prevalence of hypertension as well as insulin therapy, but the levels of LYM-R, RBC, and HGB were lower than patients without DKD (P < 0.05). Among T2DM patients with hyperlactatemia, compared with patients without DKD, DKD patients were older, had a longer duration of diabetes, higher levels of Urea, Crea, TC, LDL-C, ALBU, and UACR, lower levels of RBC, HGB, along with a higher prevalence of hypertension and insulin therapy (P < 0.05). Univariate logistic analysis revealed that duration of diabetes, levels of glucose, WBC, NEU-R, LYM-R, HGB, PLT, Urea, UA, Crea, TG, and comorbid conditions such as hypertension, cerebral infarction, and insulin therapy were influencing factors of DKD in T2DM patients with normal lactate level. Among T2DM patients with hyperlactatemia, significant influencing factors for DKD included age, duration of diabetes, levels of Urea, LYM-R, MONO-R, RBC, HGB, Urea, Crea, TC, LDL-C, and comorbid conditions such as hypertension, fatty liver, and insulin therapy. Variables with P < 0.1 in univariate logistic regression analysis were considered independent variables, and multivariate logistic regression analysis identified glucose, PLT, UA, Crea, and hypertension as independent risk factors for DKD in the normal lactate group. In the high lactate group, duration of diabetes, Crea, TC, and hypertension were determined to be independent risk factors for DKD (Tables 3 and 4).
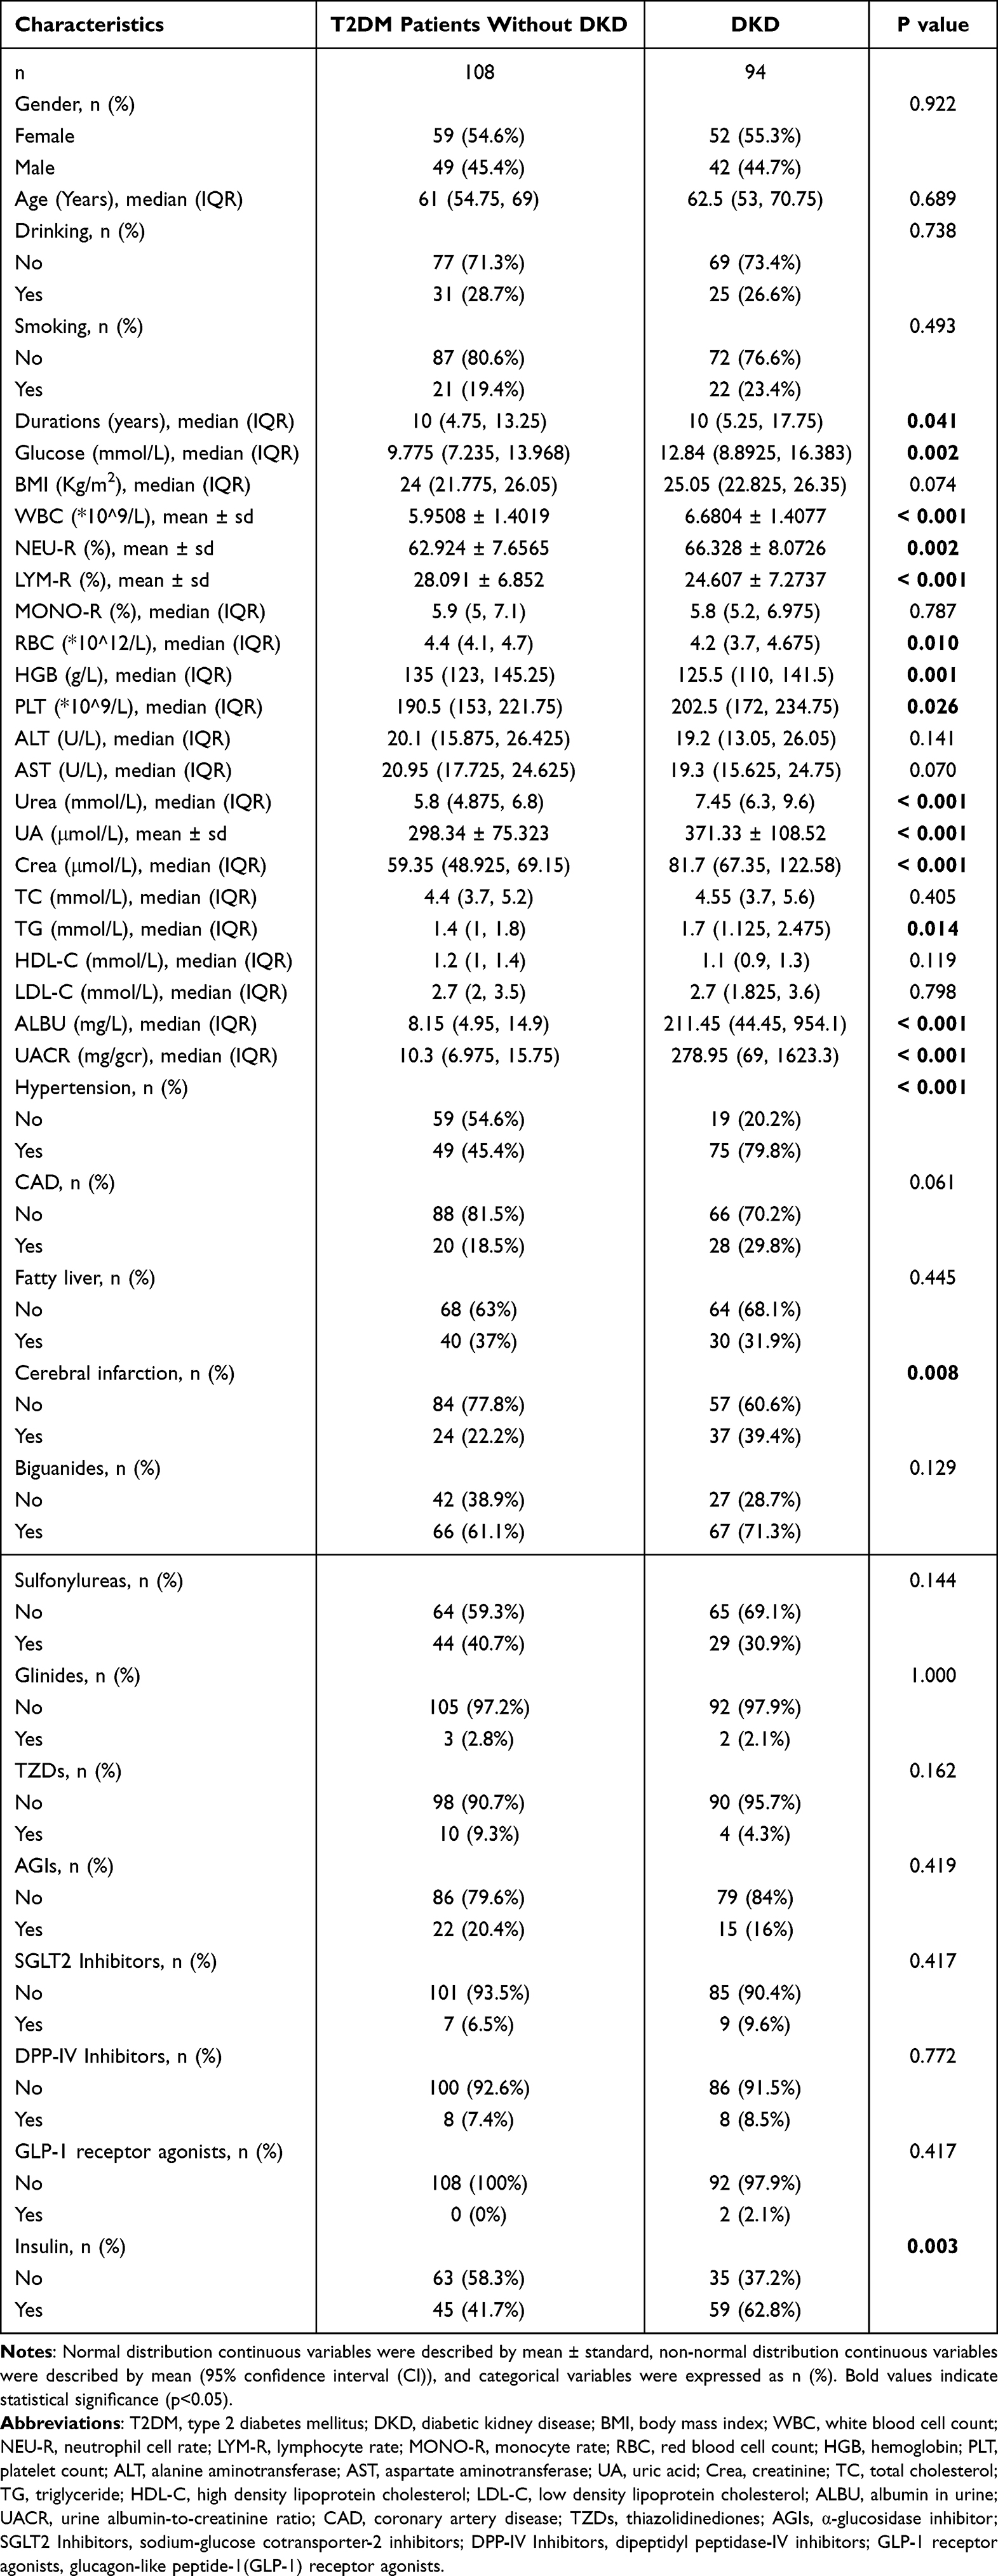 |
Table 1 Baseline Characteristics of T2DM Patients Without or with DKD with Normal Levels of Serum Lactate |
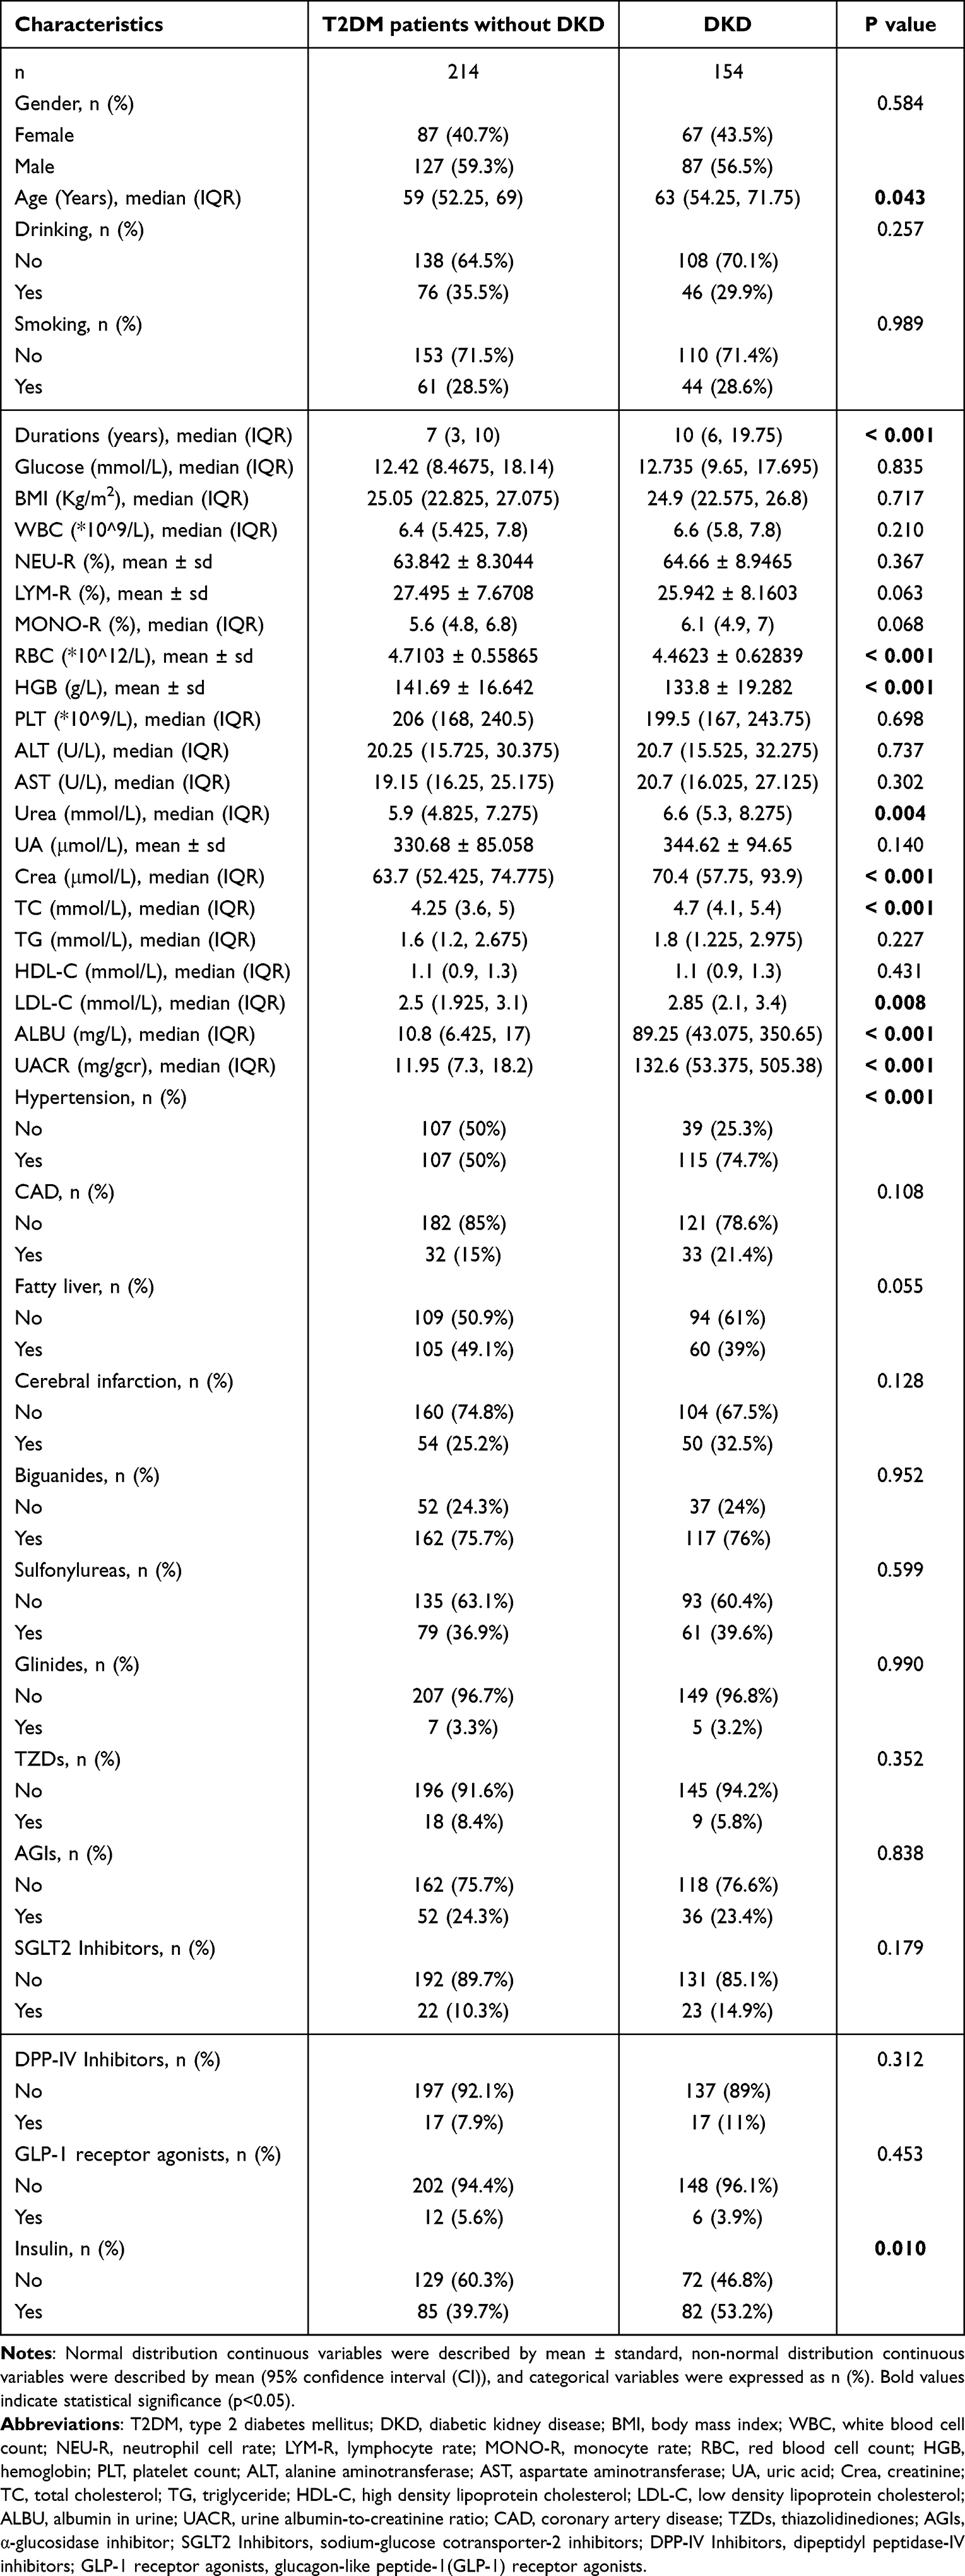 |
Table 2 Baseline Characteristics of T2DM Patients Without or with DKD with High Levels of Serum Lactate |
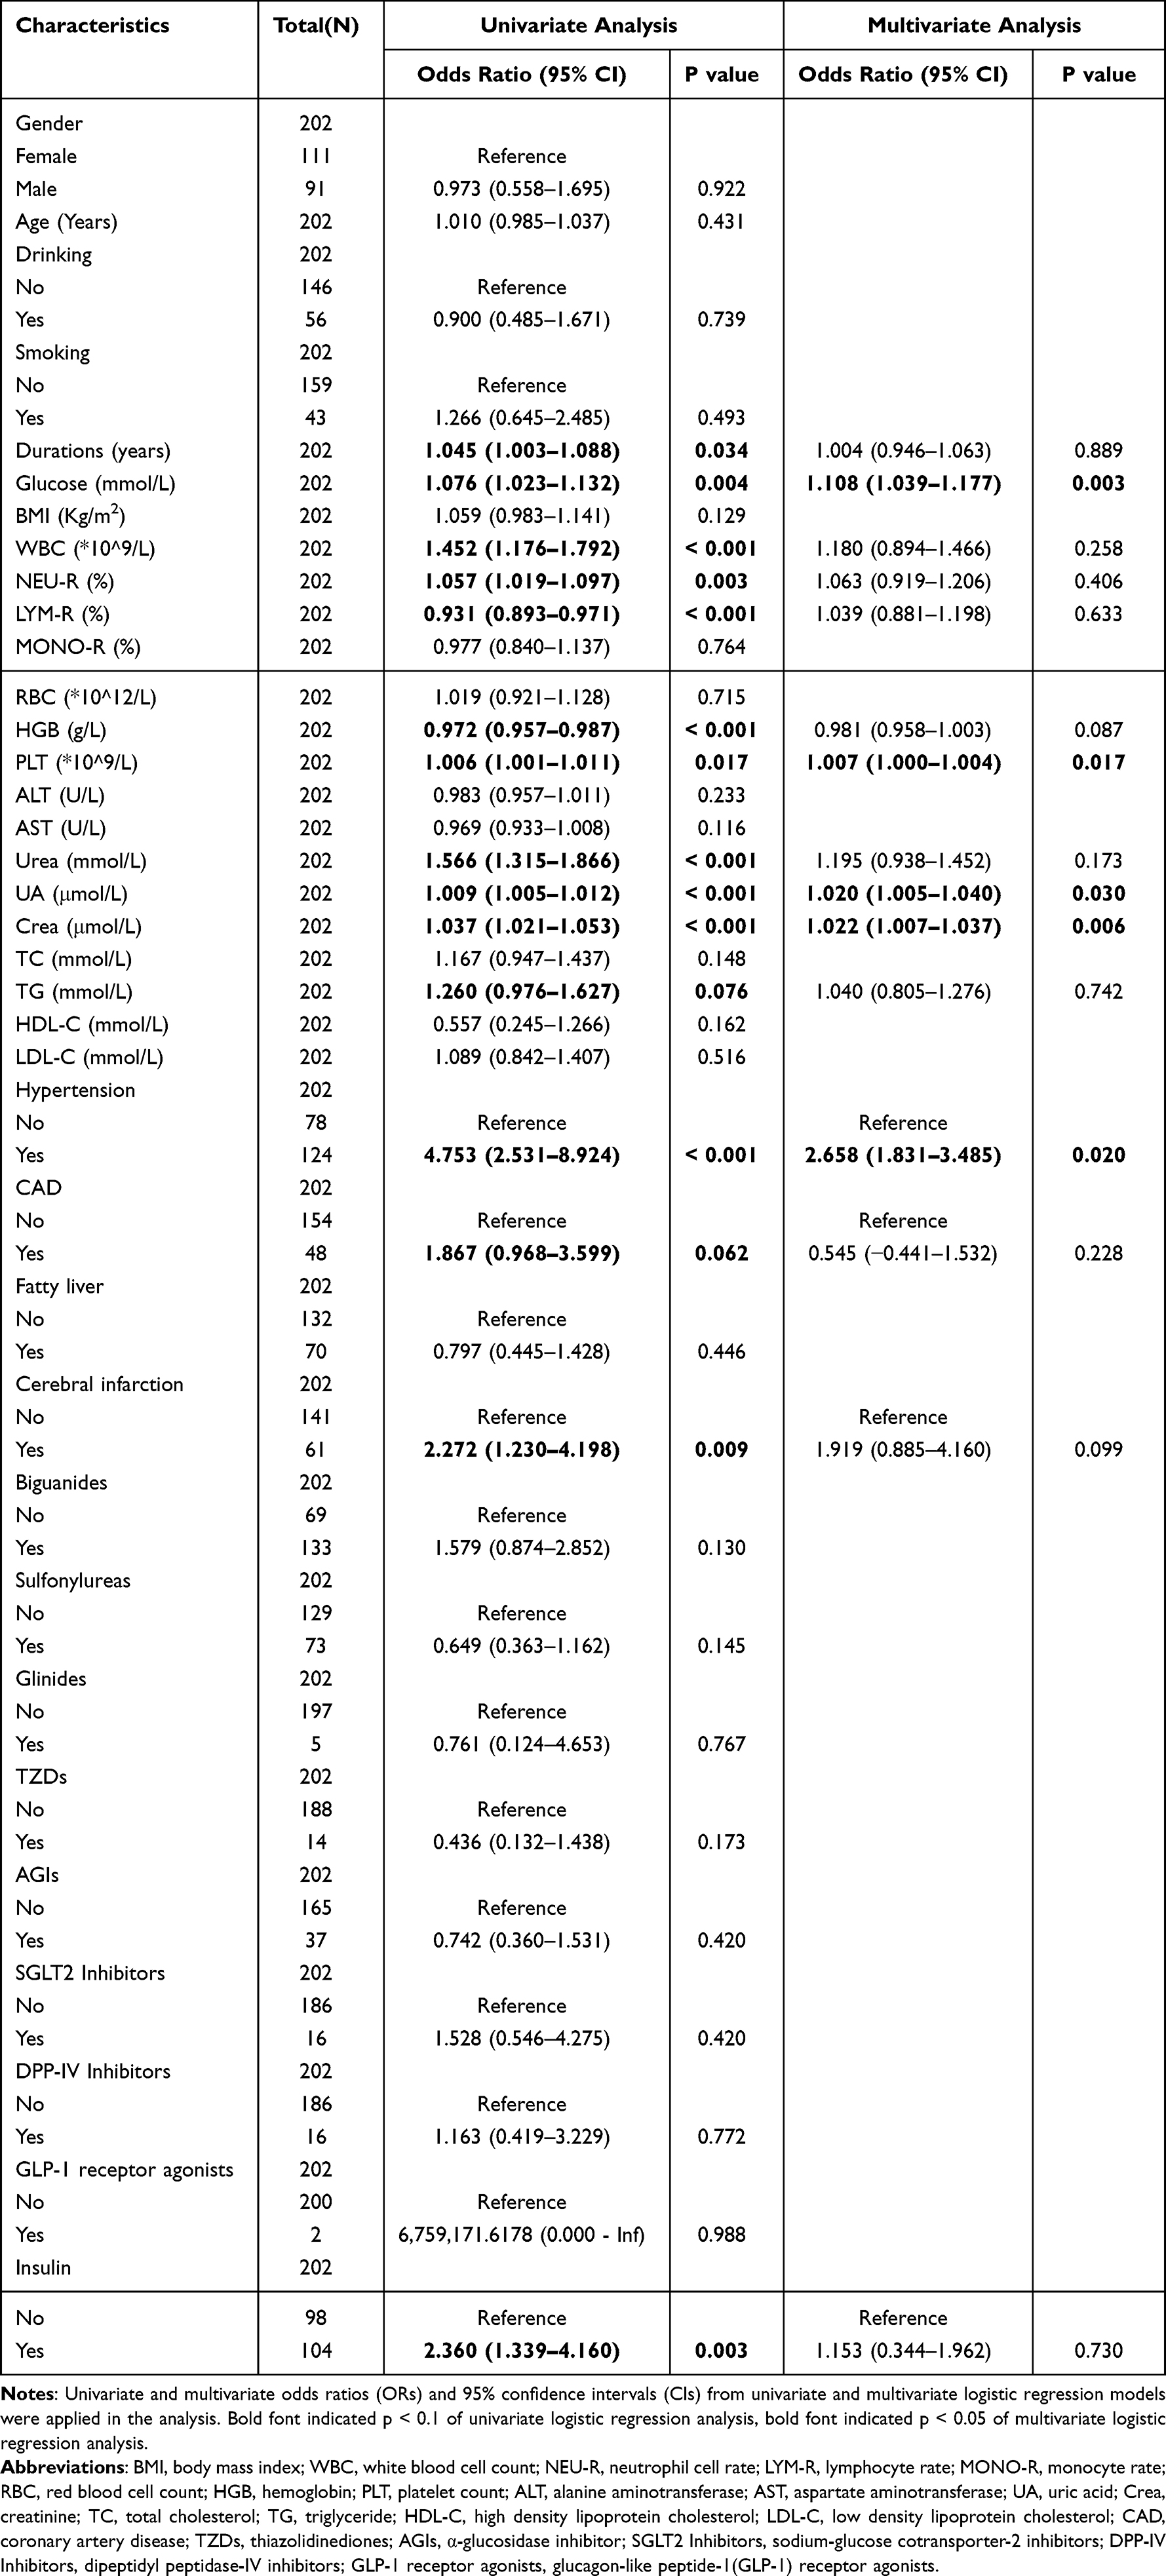 |
Table 3 Univariate and Multivariate Logistic Regression Analysis of DKD Risk in T2DM Patients with Normal Levels of Serum Lactate |
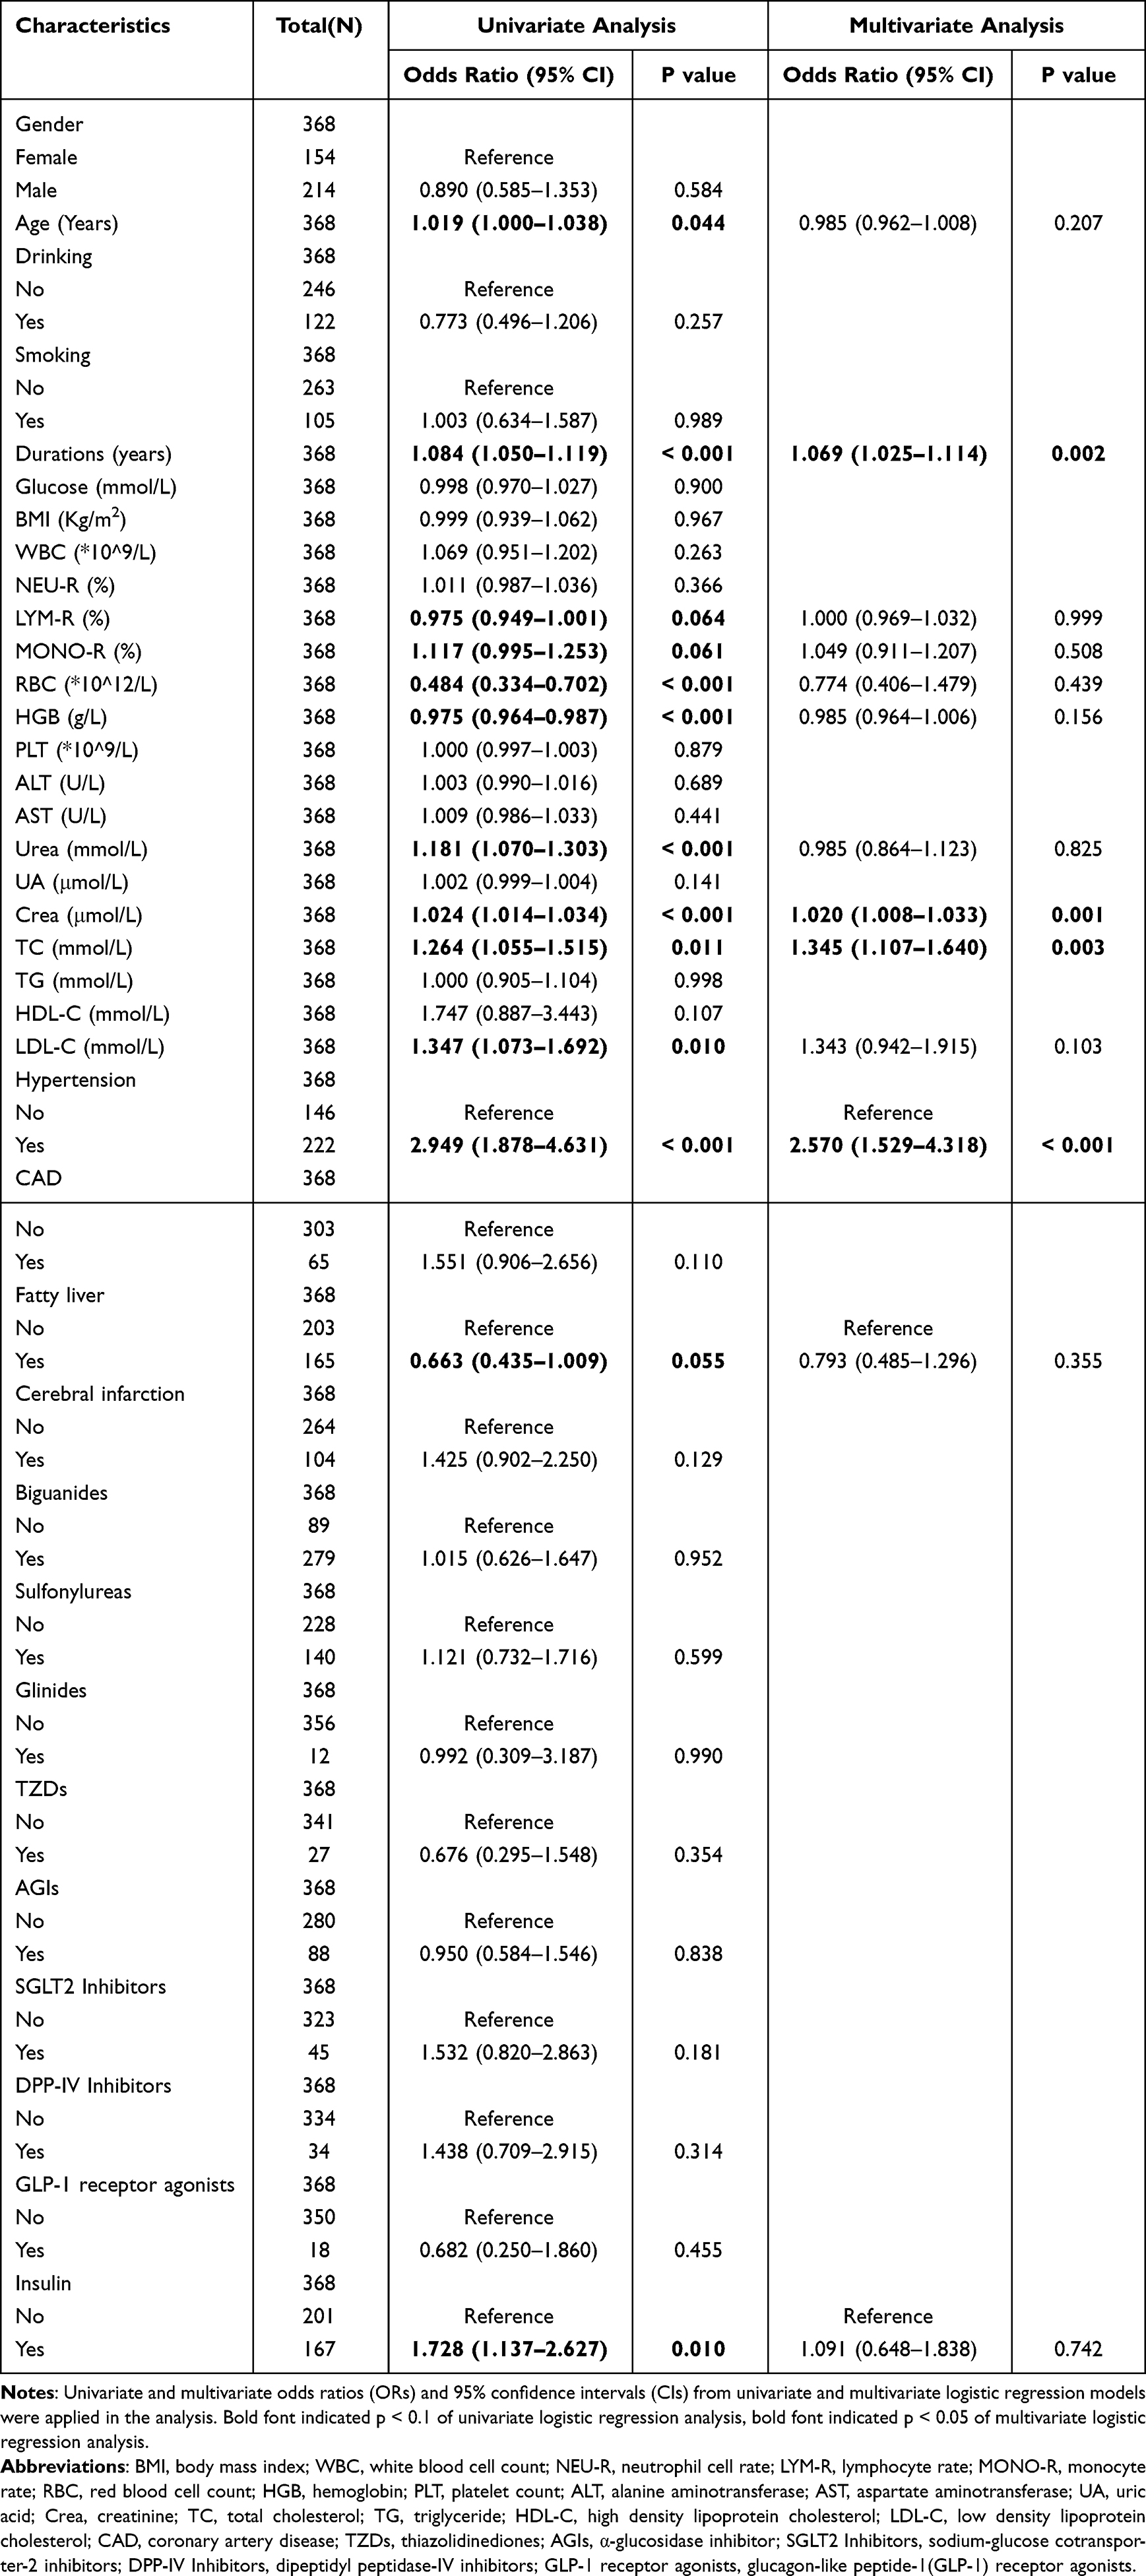 |
Table 4 Univariate and Multivariate Logistic Regression Analysis of DKD Risk in T2DM Patients with High Levels of Serum Lactate |
Predictive Nomogram Models
The five variables of glucose, PLT, UA, Crea, and hypertension were integrated into the predictive model for DKD risk in T2DM patients with normal lactate levels. Similarly, duration of diabetes, Crea, TC, and hypertension were included in the predictive model for DKD risk in T2DM patients with high lactate levels. Multivariate logistic regression analysis of these variables was illustrated in the forest plot (Figure 2), and the features were described by OR and a P value with 95% CI. Using the R language to establish nomogram models, which were developed to quantitatively predict the probability of DKD occurrence in T2DM patients with normal levels of lactate (Figure 3A) and high levels of lactate (Figure 3B). According to the degree of influence of each independent variable in the nomogram on the outcome of DKD, we scored the different levels of each variable, corresponding to the scores on the points in the figure, and then added the scores of each variable to obtain the total score. The score corresponds to the value on the linear predictor, so as to calculate the probability of DKD occurrence. For instance, in the normal lactate group, a T2DM patient with glucose levels of 13.2 mmol/L, PLT of 205 * 109/L, UA of 273 μmol/L, Crea of 61.8 μmol/L, and comorbid hypertension, would have an estimated DKD probability of 44.3%. Similarly, in the high lactate group, a patient with T2DM with a diabetes duration of 10 years, Crea of 91.8 μmol/L, TC of 3.6 mmol/L, and comorbid hypertension, would have an estimated DKD probability of 52.0%.
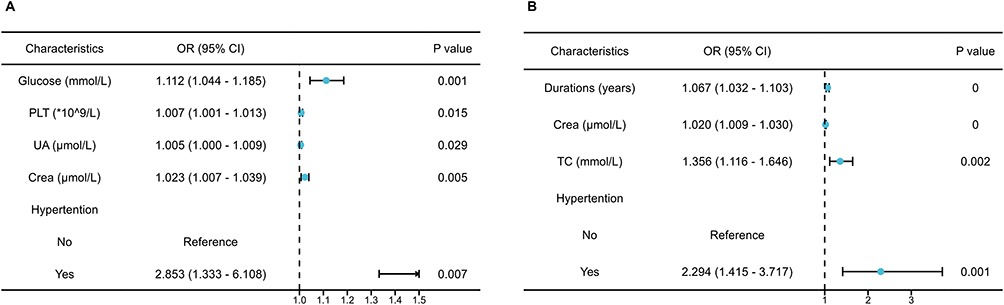 |
Figure 2 The forest plots of predictors of DKD in T2DM patients classified by lactate levels. The OR and a p value with 95% CI of the selected risk factors for DKD risk in T2DM patients with normal (A) and high (B) serum lactate levels are shown. |
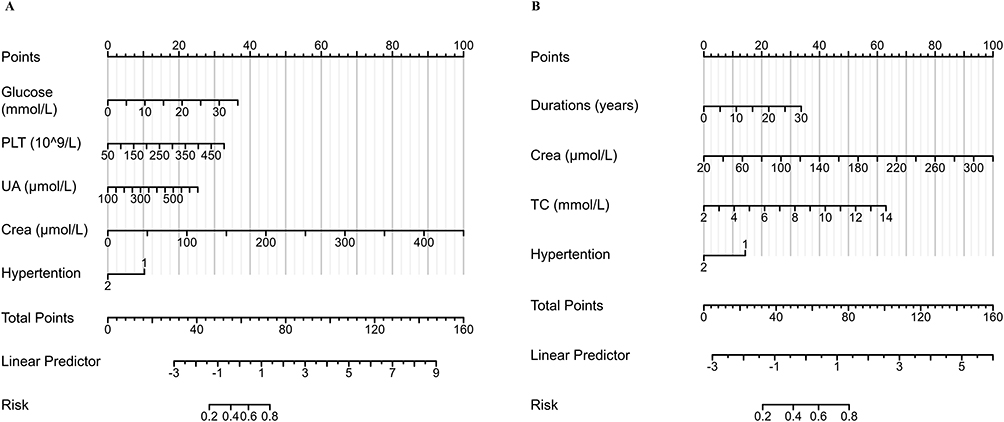 |
Figure 3 The nomograms to quantitatively predict probability of DKD in T2DM patients classified by lactate levels. (A): the nomogram for DKD prediction in T2DM patients with normal lactate levels. (B): the nomogram for DKD prediction in T2DM patients with high lactate levels. Each variable’s influence is quantified by assigning scores, which are then summed to calculate the total score, the score corresponds to the value on the linear predictor, so as to provides the probability of DKD. |
Prediction Model Performance
The C-index was utilized to assess the discrimination and performance of the prediction models. The ROC curves of different DKD risk prediction models for T2DM patients with normal and high lactate levels were depicted (Figure 4A and B, respectively). The AUC for DKD risk screening models in both normal lactate and high lactate groups indicated good discrimination, with values of 0.834 (95% CI, 0.776 to 0.891) and 0.741 (95% CI, 0.688 to 0.795), respectively. Sensitivity and specificity values were 0.691 and 0.870, 0.597 and 0.804 for normal lactate and high lactate groups, respectively. The calibration of the models was evaluated using the Hosmer–Lemeshow goodness-of-fit test and calibration curve, showing excellent agreement between the predicted and actual DKD risk in both normal group (χ² = 3.4565, P = 0.9025) and high lactate group (χ² = 14.723, P = 0.0648). The calibration curve for the nomogram models to predict DKD risk demonstrated a robust degree of fit in normal lactate and high lactate group (Figure 4C and D, respectively). Furthermore, the DCA revealed that the threshold probability and highest net yield for the models in normal lactate and high lactate groups were 17–99% and 0.36, and 24–99% and 0.24, respectively (Figure 4E and F), which suggested that the DKD risk prediction models could provide more beneficial outcomes than the diagnosing-all-patients scheme within this threshold probability range.
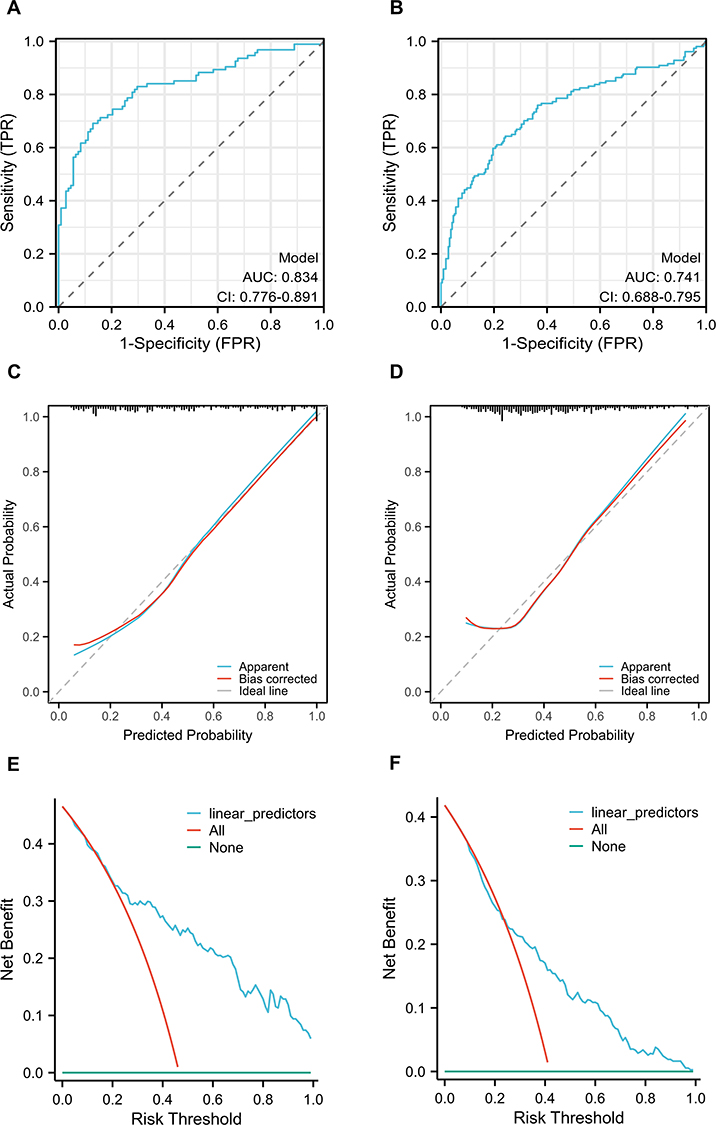 |
Figure 4 The performance of predictive models for DKD in T2DM patients classified by lactate levels. (A): ROC curves of DKD prediction model in T2DM patients with normal lactate levels. (B): ROC curves of DKD prediction model in T2DM patients with high lactate levels. The y-axis and x-axis represent the true and false-positive rate of the risk prediction, respectively. The blue line represents the performance of the nomogram of DKD risk in patients with T2DM with normal (A) and high (B) levels of serum lactate. (C): calibration curves of DKD prediction model in T2DM patients with normal lactate levels. (D): calibration curves of DKD prediction model in T2DM patients with high lactate levels. The y-axis represents actual diagnosed cases of DKD, the x-axis represents the predicted risk of DKD. The diagonal dotted line represents a perfect prediction by an ideal model, the red line represents the performance of the nomogram, of which a closer fit to the diagonal dotted line represents a better prediction. (E): the DCA of DKD prediction model in T2DM patients with normal lactate levels. (F): the DCA of DKD prediction model in T2DM patients with high lactate levels. The y-axis measures the net benefit and the x-axis measures the risk threshold. The blue line represents the DKD incidence risk nomogram. The red line represents the assumption that all patients are diagnosed as DKD. The green line represents the assumption that no patients are diagnosed as DKD. The DCA showed that if the threshold probability of a patient is from 17 to 99% in T2DM patients with normal levels of serum lactate and from 24 to 99% in high levels of serum lactate, using the nomogram to predict DKD incidence risk adds more benefit than the diagnosing-all-patients scheme. |
Discussion
Despite ongoing research, the pathogenesis of DKD remains incompletely understood, and current treatments have limitations.20–22 Standard clinical markers like eGFR and UACR commonly reflect the advanced stages of DKD, because albuminuria was reported to follow a remission/regression trajectory, and eGFR decline was insufficient to predict disease progression in the early stages.4 Consequently, early non-invasive and straightforward screening is crucial for the prevention and treatment of DKD. Better markers and predictive tools are needed for early diagnosis of DKD. A nomogram, a visual representation of a prediction model, intuitively depicts the prediction probability of outcomes by calculating the functional relationship between multiple variables.16 In the present study, we analyzed the clinical data of T2DM patients using univariate and multivariate logistic regression analyses. Our findings revealed that glucose, PLT, UA, Crea, and hypertension were independent factors for DKD in T2DM patients with normal lactate levels, while duration of diabetes, Crea, TC, and hypertension were indicators in high lactate levels group. We constructed a DKD risk evaluation model, aiding clinicians in making individualized diagnosis and treatment of DKD at the earliest stages on various factors and lactate levels in T2DM patients. The ROC, calibration, and DCA curves demonstrated favorable model performance.
Traditional factors such as longer duration of T2DM, hypertension, and metabolic perturbations (eg, chronic hyperglycemia, hyperuricemia, high triglyceride levels) are well-known risk factors for DKD occurrence.23,24 With the advent of metabolomics, different metabolic substrates and products are detected, facilitating the identification of key biomarkers characterizing metabolic diseases.25,26 Consequently, new biomarkers aiding in the diagnosis and evaluation of therapeutic effects of DKD have been widely developed.27 Enrichment analyses confirmed the involvement of several biological pathways in DKD pathogenesis, such as the urea cycle, tricarboxylic acid cycle, glycolysis, and amino acid metabolisms.13,28,29 Higher level of lactate, a metabolite produced under anaerobic conditions during the glycolysis for energy, has been observed in T2DM and DKD patients.14,30,31 Similarly, in the present study, we found that serum lactate levels were higher in T2DM patients with DKD and those without than in healthy controls. Previously, a meta-analysis indicated that increased lactic acid in urine and kidney tissue served as an early diagnostic biomarker for DKD.15 Studies have confirmed that long-term hyperglycemia and mitochondrial damage in DKD patients led to increased oxygen demand and relative hypoxia in the kidneys, enhancing glycolysis and increasing lactate production.32,33 The pathogenesis of DKD was linked to renal lactate dehydrogenase A (LDHA)-mediated lactic acidosis, which led to fibrosis and mitochondrial abnormalities.34 The condition of DKD patients was improved when LDHA was used as a therapeutic target.31,35 However, serum lactate levels in DKD patients are higher than those in healthy controls, which may be affected by the use of drugs, like ARB drugs.31 This suggests the necessity for larger sample and multicenter studies to detect serum lactate levels, while also paying attention to the effects of drugs on lactate metabolism.
Several studies have identified hyperglycemia, serum uric acid (SUA), and platelets as risk factors for DKD in DM patients, associating them with increased risk of microalbuminuria, rapid eGFR decline, and progression to end-stage renal disease (ESRD).36–39 Our findings in the normal lactate level group corroborated these observations, demonstrating significantly higher blood glucose, SUA, and platelet levels of DKD patients compared to those in T2DM patients without DKD, establishing them as independent risk factors for DKD. Current studies have suggested that hyperglycemia triggers oxidative stress and inflammation through activation of signaling pathways such as NF-κB, PI3K/Akt, and MAPK/ERK, ultimately contributing to DKD pathogenesis.40 Hyperuricemia was postulated to induce and promote renal fibrosis via activation of the transforming growth factor-β 1/Smad2/3 pathway.41 Platelet activation, characterized by pro-inflammatory factor secretion, platelet–leukocyte interaction, and pro-fibrotic responses, was thought to exacerbate renal function decline.42 Conversely, interventions like intensive glucose control, SUA levels reduction, and antiplatelet therapy have demonstrated efficacy in improving renal function, reducing UACR, and slowing DKD progression.42–44 Collectively, these findings underscore the critical role of managing hyperglycemia, SUA levels, and platelet activity in both DKD prevention and treatment strategies.
Risk factors associated with DKD in T2DM patients with elevated lactate levels were identified in the present study, which included diabetes duration, total cholesterol, creatinine, and hypertension, while these findings corroborate existing literature.23,45–47 Emerging evidence suggested potential links: A study found that the media fold change of urinary lactate and creatinine revealed a trend corresponding to stages of DKD and gradually increased.48 DM patients with longer durations (>20 years) exhibited higher LDH levels compared to those with shorter durations (<5 years).49 Furthermore, DKD patients with elevated LDH displayed worse renal function (lower eGFR, higher creatinine and ACR), more severe pathology, and a higher risk of ESRD progression.50 Obese adolescents with higher D-lactate levels also had higher total cholesterol/HDL-C ratios, supporting a potential link between lactate and lipid metabolism.51 Similar observations were made in DKD patients, where higher LDH levels correlated with elevated total cholesterol.50 Increased serum lactate in high-fat and high-cholesterol (HFHC) fed monkeys served as a potential predictor for impaired glucose tolerance and insulin resistance, suggesting its possible role in prediabetic states.52 Higher lactate quartiles were associated with increased hypertension prevalence, and hypertensive individuals exhibited significantly higher LDH levels compared to normotensives.53,54 In a spontaneous hypertension animal model, high lactate concentrations induced and exacerbated renal fibrosis through TRPV4-TGFβ1-SMAD2/3-CTGF-mediated pathways.55 These findings highlight the importance of considering, beyond the established factors of diabetes duration, creatinine, blood lipids, and blood pressure, the potential impact of elevated LDH and lactate associated with glucose metabolism disturbances in DM patients on DKD progression. While further research is needed to elucidate the precise relationships and mechanisms involved in lactate and DKD, these initial observations warrant further investigation.
Our study provided a novel perspective on DKD prediction by demonstrating that risk factors vary based on serum lactate levels in T2DM patients. While traditional prediction factors of nomograms like those reported in previous studies remained relevant,17,18 we identified distinct predictors for DKD in patients with normal and high lactate levels. By incorporating these lactate-related factors into easy-to-use nomograms, we empowered clinicians to make personalized and early DKD predictions, facilitating timely intervention and potentially delaying the progression to end-stage renal disease. Despite the significance of our findings, the study has limitations. Being a retrospective cross-sectional study, causal relationships among lactate levels, risk factors, and DKD require further exploration through cohort and mechanism studies. Additionally, our analysis was based on available cohort data and may not encompass all DKD risk factors, necessitating inclusion of more biomarkers in future studies. Moreover, as a single-center study, our findings may not be universally applicable, urging inclusion of patients from multiple centers to enhance model accuracy and practicality.
Conclusions
In conclusion, the serum lactate level-based nomogram models, combined with conventional risk factors, offer an effective tool for predicting DKD probability in T2DM patients. This approach holds promise for early risk assessment and tailored intervention strategies.
Data Sharing Statement
The datasets used and/or analysed during the current study are available from the corresponding author (Yong Xu) on reasonable request.
Ethics Approval and Consent to Participate
All protocols followed the ethical guidelines of the Declaration of Helsinki, and the study has been approved by the Ethics Committee of the Affiliated Hospital of Southwest Medical University (license number: KY2023142). When we retrospectively collected the data of previous cases, written informed consent was waived due to the retrospective nature and low risk of the study. We obtained informed consent when collecting blood and urine from healthy people.
Acknowledgments
The authors thank anyone who contributed to the article.
Author Contributions
All authors made a significant contribution to the work reported as follows: whether that is in the conception, design, and execution of the study; acquisition, analysis and interpretation of data; participated in drafting, revising or critically reviewing the article; have agreed on the journal to which the article has been submitted; gave final approval of all the versions to be published; and agree to be accountable for all aspects of the work.
Funding
This work was supported by the Sichuan Science and Technology Program (NO.2022YFS0617), the grants from Luzhou-Southwest Medical University cooperation project (NO.2021LZXNYD-P02), Key Research and Development Program of Science and Technology Department of Sichuan Province (2022YFS0612), the grants from Luzhou-Southwest Medical University project (2021ZKQN080).
Disclosure
The authors declare that they have no competing interests.
References
1. Tuttle KR, Bakris GL, Bilous RW., et al. Diabetic kidney disease: a report from an ADA consensus conference. Am J Kidney Dis. 2014;64(4):510–533. doi:10.1053/j.ajkd.2014.08.001
2. Sever B, Altıntop MD, Demir Y, Akalın Çiftçi G, Beydemir Ş, Özdemir A. Design, synthesis, in vitro and in silico investigation of aldose reductase inhibitory effects of new thiazole-based compounds. Bioorg Chem. 2020;102:104110. doi:10.1016/j.bioorg.2020.104110
3. International Diabetes Federation. IDF Diabetes Atlas, 10th edition; 2021. Available from: https://www.diabetesatlas.org.
4. Afkarian M, Zelnick LR, Hall YN, et al. Clinical manifestations of kidney disease among US adults with diabetes, 1988–2014. JAMA. 2016;316(6):602–610. doi:10.1001/jama.2016.10924
5. Sever B, Altıntop MD, Demir Y, et al. Identification of a new class of potent aldose reductase inhibitors: design, microwave-assisted synthesis, in vitro and in silico evaluation of 2-pyrazolines. Chem Biol Interact. 2021;345:109576. doi:10.1016/j.cbi.2021.109576
6. Buyadaa O, Magliano DJ, Salim A, Koye DN, Shaw JE. Risk of rapid kidney function decline, all-cause mortality, and major cardiovascular events in nonalbuminuric chronic kidney disease in type 2 diabetes. Diabetes Care. 2020;43(1):122–129. doi:10.2337/dc19-1438
7. Penno G, Solini A, Orsi E, et al. Non-albuminuric renal impairment is a strong predictor of mortality in individuals with type 2 diabetes: the Renal Insufficiency And Cardiovascular Events (RIACE) Italian multicentre study. Diabetologia. 2018;61(11):2277–2289. doi:10.1007/s00125-018-4691-2
8. KDOQI. KDOQI clinical practice guidelines and clinical practice recommendations for diabetes and chronic kidney disease. Am J Kidney Dis. 2007;49(2 Suppl):S12–S154. doi:10.1053/j.ajkd.2006.12.005
9. Kidney Disease: Improving Global Outcomes (KDIGO) Diabetes Work Group. KDIGO 2022 clinical practice guideline for diabetes management in chronic kidney disease. Kidney Int. 2022;102(5S):S1–s127. doi:10.1016/j.kint.2022.06.008
10. Halminen J, Sattar N, Rawshani A, et al. Range of risk factor levels, risk control, and temporal trends for nephropathy and end-stage kidney disease in patients with type 1 and type 2 diabetes. Diabetes Care. 2022;45(10):2326–2335. doi:10.2337/dc22-0926
11. An L, Yu Q, Tang H, et al. The prevalence, progress and risk factor control of chronic kidney disease in Chinese adults with type 2 diabetes mellitus in primary care. Front Endocrinol. 2022;13:859266. doi:10.3389/fendo.2022.859266
12. Das S, Devi Rajeswari V, Venkatraman G, Elumalai R, Dhanasekaran S, Ramanathan G. Current updates on metabolites and its interlinked pathways as biomarkers for diabetic kidney disease: a systematic review. Transl Res. 2024;265:71–87. doi:10.1016/j.trsl.2023.11.002
13. Pereira PR, Carrageta DF, Oliveira PF, Rodrigues A, Alves MG, Monteiro MP. Metabolomics as a tool for the early diagnosis and prognosis of diabetic kidney disease. Med Res Rev. 2022;42(4):1518–1544. doi:10.1002/med.21883
14. Li X, Yang Y, Zhang B, et al. Lactate metabolism in human health and disease. Signal Trans Tar Ther. 2022;7(1):305. doi:10.1038/s41392-022-01151-3
15. Roointan A, Gheisari Y, Hudkins KL, Gholaminejad A. Non-invasive metabolic biomarkers for early diagnosis of diabetic nephropathy: meta-analysis of profiling metabolomics studies. Nutr Metab Cardiovasc Dis. 2021;31(8):2253–2272. doi:10.1016/j.numecd.2021.04.021
16. Wang X, Lu J, Song Z, Zhou Y, Liu T, Zhang D. From past to future: bibliometric analysis of global research productivity on nomogram (2000–2021). Front Public Health. 2022;10:997713. doi:10.3389/fpubh.2022.997713
17. Wang G, Wang B, Qiao G, et al. Screening tools based on nomogram for diabetic kidney diseases in Chinese type 2 diabetes mellitus patients. Diabet Metabol J. 2021;45(5):708–718. doi:10.4093/dmj.2020.0117
18. Hu Y, Shi R, Mo R, Hu F. Nomogram for the prediction of diabetic nephropathy risk among patients with type 2 diabetes mellitus based on a questionnaire and biochemical indicators: a retrospective study. Aging. 2020;12(11):10317–10336. doi:10.18632/aging.103259
19. Alberti KG, Zimmet PZ. Definition, diagnosis and classification of diabetes mellitus and its complications. Part 1: diagnosis and classification of diabetes mellitus provisional report of a WHO consultation. Diabetic Med. 1998;15(7):539–553. doi:10.1002/(SICI)1096-9136(199807)15:7<539::AID-DIA668>3.0.CO;2-S
20. Danta CC, Boa AN, Bhandari S, Sathyapalan T, Xu SZ. Recent advances in drug discovery for diabetic kidney disease. Expert Opin Drug Discov. 2021;16(4):447–461. doi:10.1080/17460441.2021.1832077
21. Tokalı FS, Demir Y, Türkeş C, Dinçer B, Beydemir Ş. Novel acetic acid derivatives containing quinazolin-4(3H)-one ring: synthesis, in vitro, and in silico evaluation of potent aldose reductase inhibitors. Drug Dev Res. 2023;84(2):275–295. doi:10.1002/ddr.22031
22. Cheng HT, Xu X, Lim PS, Hung KY. Worldwide epidemiology of diabetes-related end-stage renal disease, 2000–2015. Diabetes Care. 2021;44(1):89–97. doi:10.2337/dc20-1913
23. Siddiqui K, George TP, Joy SS, Alfadda AA. Risk factors of chronic kidney disease among type 2 diabetic patients with longer duration of diabetes. Front Endocrinol. 2022;13:1079725. doi:10.3389/fendo.2022.1079725
24. Bjornstad P, El Ghormli L, Hughan KS; TODAY Study Group. Effects of Metabolic factors, race-ethnicity, and sex on the development of nephropathy in adolescents and young adults with type 2 diabetes: results from the today study. Diabetes Care. 2021;45(5):1056–1064. doi:10.2337/dc21-1085
25. Hernandez-Baixauli J, Quesada-Vázquez S, Mariné-Casadó R, et al. Detection of early disease risk factors associated with metabolic syndrome: a new era with the NMR metabolomics assessment. Nutrients. 2020;12(3):806. doi:10.3390/nu12030806
26. Monnerie S, Comte B, Ziegler D, Morais JA, Pujos-Guillot E, Gaudreau P. Metabolomic and lipidomic signatures of metabolic syndrome and its physiological components in adults: a systematic review. Sci Rep. 2020;10(1):669. doi:10.1038/s41598-019-56909-7
27. Papadopoulou-Marketou N, Kanaka-Gantenbein C, Marketos N, Chrousos GP, Papassotiriou I. Biomarkers of diabetic nephropathy: a 2017 update. Crit Rev Clin Lab Sci. 2017;54(5):326–342. doi:10.1080/10408363.2017.1377682
28. Cordero-Pérez P, Sánchez-Martínez C, García-Hernández PA, Saucedo AL. Metabolomics of the diabetic nephropathy: behind the fingerprint of development and progression indicators. Nefrologia. 2020;40(6):585–596. doi:10.1016/j.nefro.2020.07.002
29. Özaslan MS, Sağlamtaş R, Demir Y, Genç Y, Saraçoğlu İ, Gülçin İ. Isolation of some phenolic compounds from plantago subulata L. and Determination of their antidiabetic, anticholinesterase, antiepileptic and antioxidant activity. Chem. Biodivers. 2022;19(8):e202200280. doi:10.1002/cbdv.202200280
30. Scheijen JL, Hanssen NM, van de Waarenburg MP, Jonkers DM, Stehouwer CD, Schalkwijk CG. L(+) and D(-) lactate are increased in plasma and urine samples of type 2 diabetes as measured by a simultaneous quantification of L(+) and D(-) lactate by reversed-phase liquid chromatography tandem mass spectrometry. Exp Diabetes Res. 2012;2012:234812. doi:10.1155/2012/234812
31. Azushima K, Kovalik JP, Yamaji T, et al. Abnormal lactate metabolism is linked to albuminuria and kidney injury in diabetic nephropathy. Kidney Int. 2023;104(6):1135–1149. doi:10.1016/j.kint.2023.08.006
32. Forbes JM, Thorburn DR. Mitochondrial dysfunction in diabetic kidney disease. Nat Rev Nephrol. 2018;14(5):291–312. doi:10.1038/nrneph.2018.9
33. Zhang G, Darshi M, Sharma K. The Warburg effect in diabetic kidney disease. Semin Nephrol. 2018;38(2):111–120. doi:10.1016/j.semnephrol.2018.01.002
34. Lee DY, Kim JY, Ahn E, et al. Associations between local acidosis induced by renal LDHA and renal fibrosis and mitochondrial abnormalities in patients with diabetic kidney disease. Transl Res. 2022;249:88–109. doi:10.1016/j.trsl.2022.06.015
35. Fu X, Zhang J, Huang X, et al. Curcumin antagonizes glucose fluctuation-induced renal injury by inhibiting aerobic glycolysis via the miR-489/LDHA pathway. Mediators Inflammation. 2021;2021:6104529. doi:10.1155/2021/6104529
36. Liang R, Feng X, Shi D, et al. The global burden of disease attributable to high fasting plasma glucose in 204 countries and territories, 1990–2019: an updated analysis for the Global Burden of Disease Study 2019. Diabetes Metab Res Rev. 2022;38(8):e3572. doi:10.1002/dmrr.3572
37. Bjornstad P, Laffel L, Lynch J, et al. Elevated serum uric acid is associated with greater risk for hypertension and diabetic kidney diseases in obese adolescents with type 2 diabetes: an observational analysis from the treatment options for type 2 diabetes in adolescents and youth (TODAY) study. Diabetes Care. 2019;42(6):1120–1128. doi:10.2337/dc18-2147
38. Ji P, Zhu J, Feng J, et al. Serum uric acid levels and diabetic kidney disease in patients with type 2 diabetes mellitus: a dose-response meta-analysis. Prim Care Diabetes. 2022;16(3):457–465. doi:10.1016/j.pcd.2022.03.003
39. Hui D, Zhang F, Lu Y, et al. A multifactorial risk score system for the prediction of diabetic kidney disease in patients with type 2 diabetes mellitus. Diabetes Metabol Syndrome Obesity. 2023;16:385–395. doi:10.2147/DMSO.S391781
40. Wu XQ, Zhang DD, Wang YN, Tan YQ, Yu XY, Zhao YY. AGE/RAGE in diabetic kidney disease and ageing kidney. Free Radic Biol Med. 2021;171:260–271. doi:10.1016/j.freeradbiomed.2021.05.025
41. Zhang M, Cui R, Zhou Y, et al. Accumulation of renal fibrosis in hyperuricemia rats is attributed to the recruitment of mast cells, activation of the TGF-β1/Smad2/3 pathway, and aggravation of oxidative stress. Int J Mol Sci. 2023;24(13):10839. doi:10.3390/ijms241310839
42. Rustiasari UJ, Roelofs JJ. The role of platelets in diabetic kidney disease. Int J Mol Sci. 2022;23(15):8270. doi:10.3390/ijms23158270
43. Zoungas S, Arima H, Gerstein HC, et al. Effects of intensive glucose control on microvascular outcomes in patients with type 2 diabetes: a meta-analysis of individual participant data from randomised controlled trials. Lancet Diabetes Endocrinol. 2017;5(6):431–437. doi:10.1016/S2213-8587(17)30104-3
44. Bakris GL, Mikami H, Hirata M, Nakajima A, Cressman MD. A non-purine xanthine oxidoreductase inhibitor reduces albuminuria in patients with dkd: a randomized controlled trial. Kidney360. 2021;2(8):1240–1250. doi:10.34067/KID.0001672021
45. Yang Y, Xu P, Liu Y, Chen X, He Y, Feng J. Vascular inflammation, atherosclerosis, and lipid metabolism and the occurrence of non-high albuminuria diabetic kidney disease: a cross-sectional study. Diabetes Vasc Dis Res. 2021;18(1):1479164121992524. doi:10.1177/1479164121992524
46. Jin Q, Luk AO, Lau ESH, et al. Nonalbuminuric diabetic kidney disease and risk of all-cause mortality and cardiovascular and kidney outcomes in type 2 diabetes: findings from the hong kong diabetes biobank. Am J Kidney Dis. 2022;80(2):196–206.e1. doi:10.1053/j.ajkd.2021.11.011
47. Lin C, Zhu X, Jiao R, et al. Population attributable fractions of modifiable risk factors for microvascular complications of type 2 diabetes in China: an analysis using national cross-sectional data. Diabetes Obesity Metab. 2023;25(Suppl 1):5–12. doi:10.1111/dom.15029
48. Kwon S, Hyeon JS, Jung Y, et al. Urine myo-inositol as a novel prognostic biomarker for diabetic kidney disease: a targeted metabolomics study using nuclear magnetic resonance. Kidney Res Clin Pract. 2023;42(4):445–459. doi:10.23876/j.krcp.22.152
49. Huang EJ, Kuo WW, Chen YJ, et al. Homocysteine and other biochemical parameters in Type 2 diabetes mellitus with different diabetic duration or diabetic retinopathy. Clin Chim Acta. 2006;366(1–2):293–298. doi:10.1016/j.cca.2005.10.025
50. Xiao X, Zhang J, Lang Y, et al. Associations of lactate dehydrogenase with risk of renal outcomes and cardiovascular mortality in individuals with diabetic kidney disease. Diabetes Res Clin Pract. 2023;203:110838. doi:10.1016/j.diabres.2023.110838
51. Rodríguez-Mortera R, Luevano-Contreras C, Solorio-Meza S, et al. Higher D-lactate levels are associated with higher prevalence of small dense low-density lipoprotein in obese adolescents. Clin Chem Lab Med. 2018;56(7):1100–1108. doi:10.1515/cclm-2017-0733
52. Li X, Chen Y, Liu J, et al. Serum metabolic variables associated with impaired glucose tolerance induced by high-fat-high-cholesterol diet in Macaca mulatta. Exp. Biol. Med. 2012;237(11):1310–1321. doi:10.1258/ebm.2012.012157
53. Juraschek SP, Shantha GP, Chu AY, et al. Lactate and risk of incident diabetes in a case-cohort of the atherosclerosis risk in communities (ARIC) study. PLoS One. 2013;8(1):e55113. doi:10.1371/journal.pone.0055113
54. Cai X, Wang T, Xie L. Lactate dehydrogenase is associated with flow-mediated dilation in hypertensive patients. Sci Rep. 2023;13(1):768. doi:10.1038/s41598-023-27614-3
55. Zhao B, Xu Y, Chen Y, et al. Activation of TRPV4 by lactate as a critical mediator of renal fibrosis in spontaneously hypertensive rats after moderate- and high-intensity exercise. Front Physiol. 2022;13:927078. doi:10.3389/fphys.2022.927078
 © 2024 The Author(s). This work is published and licensed by Dove Medical Press Limited. The
full terms of this license are available at https://www.dovepress.com/terms
and incorporate the Creative Commons Attribution
- Non Commercial (unported, 3.0) License.
By accessing the work you hereby accept the Terms. Non-commercial uses of the work are permitted
without any further permission from Dove Medical Press Limited, provided the work is properly
attributed. For permission for commercial use of this work, please see paragraphs 4.2 and 5 of our Terms.
© 2024 The Author(s). This work is published and licensed by Dove Medical Press Limited. The
full terms of this license are available at https://www.dovepress.com/terms
and incorporate the Creative Commons Attribution
- Non Commercial (unported, 3.0) License.
By accessing the work you hereby accept the Terms. Non-commercial uses of the work are permitted
without any further permission from Dove Medical Press Limited, provided the work is properly
attributed. For permission for commercial use of this work, please see paragraphs 4.2 and 5 of our Terms.
Recommended articles
Using Machine Learning Algorithms to Predict High-Risk Factors for Postoperative Delirium in Elderly Patients
Liu Y, Shen W, Tian Z
Clinical Interventions in Aging 2023, 18:157-168
Published Date: 8 February 2023
A Multifactorial Risk Score System for the Prediction of Diabetic Kidney Disease in Patients with Type 2 Diabetes Mellitus
Hui D, Zhang F, Lu Y, Hao H, Tian S, Fan X, Liu Y, Zhou X, Li R
Diabetes, Metabolic Syndrome and Obesity 2023, 16:385-395
Published Date: 10 February 2023
Validation of a Disease-Free Survival Prediction Model Using UBE2C and Clinical Indicators in Breast Cancer Patients
Shen J, Yan H, Yang C, Lin H, Li F, Zhou J
Breast Cancer: Targets and Therapy 2023, 15:295-310
Published Date: 25 April 2023
Ten-Year Multicenter Retrospective Study Utilizing Machine Learning Algorithms to Identify Patients at High Risk of Venous Thromboembolism After Radical Gastrectomy
Liu Y, Song C, Tian Z, Shen W
International Journal of General Medicine 2023, 16:1909-1925
Published Date: 18 May 2023
Risk Factors for Granulomatous Mastitis and Establishment and Validation of a Clinical Prediction Model (Nomogram)
Zeng Y, Zhang D, Fu N, Zhao W, Huang Q, Cui J, Chen Y, Liu Z, Zhang X, Zhang S, Mansoor KM
Risk Management and Healthcare Policy 2023, 16:2209-2222
Published Date: 20 October 2023