Back to Journals » Journal of Inflammation Research » Volume 16
Development of Prognostic Nomogram Based on Lipid Metabolic Markers and Lactate Dehydrogenase in Non-Metastatic Nasopharyngeal Carcinoma
Authors Huang R, Chen K, Jiang Y ![]() , Li L, Zhu X
, Li L, Zhu X ![]()
Received 12 April 2023
Accepted for publication 11 July 2023
Published 24 July 2023 Volume 2023:16 Pages 3093—3107
DOI https://doi.org/10.2147/JIR.S416801
Checked for plagiarism Yes
Review by Single anonymous peer review
Peer reviewer comments 2
Editor who approved publication: Dr Tara Strutt
Rong Huang,1 Kaihua Chen,1 Yuting Jiang,1 Ling Li,1 Xiaodong Zhu1– 3
1Department of Radiation Oncology, Guangxi Medical University Cancer Hospital, Nanning, People’s Republic of China; 2Department of Oncology, Affiliated Wu-Ming Hospital of Guangxi Medical University, Nanning, People’s Republic of China; 3Key Laboratory of Early Prevention and Treatment for Regional High Frequency Tumor (Guangxi Medical University), Ministry of Education/Guangxi Key Laboratory of Early Prevention and Treatment for Regional High Frequency Tumor, Nanning, People’s Republic of China
Correspondence: Xiaodong Zhu, Department of Radiation Oncology, Guangxi Medical University Cancer Hospital, 71 He-Di Road, Nanning, 530021, People’s Republic of China, Tel +86 15778028340, Email [email protected]
Purpose: To establish and verify a comprehensive prognostic nomogram for predicting survival outcomes and improving the prognosis for non-metastatic nasopharyngeal carcinoma (NPC).
Patients and Methods: Our retrospective study screened 613 cases of non-metastatic NPC who received radiotherapy from July 2012 to December 2016. A reliable nomogram was formulated for predicting overall survival (OS) and progression-free survival (PFS) using all independent predictors selected by Cox regression analysis. A comparison is conducted between the current staging and the predictive performance of the nomogram. Internal validation was performed in a single center using the validation cohort to assess predictive accuracy and discrimination.
Results: High-density lipoprotein cholesterol, Epstein–Barr virus DNA and lactate dehydrogenase were determined to be valuable predictive indicators for predicting OS and PFS. Triglycerides were a valuable predictive indicator for predicting OS. Calibration curves demonstrated that the nomogram had remarkable correspondence between the prediction outcomes and the actual observations. Receiver operating characteristic curves showed that the nomogram had greater area under the curve and more satisfactory discrimination capability than the current TNM staging. Decision curve analysis revealed that the nomogram had high net clinical benefits. Significant differences were observed when low- and high-risk groups were stratified via Kaplan–Meier curves.
Conclusion: Our proposed nomogram combining lipid metabolic markers and lactate dehydrogenase could assist clinicians in the accurate prognostic prediction of non-metastatic NPC patients and provide personalized treatment recommendations.
Keywords: nomogram, lipid metabolic markers, nasopharyngeal carcinoma, lactate dehydrogenase, triglycerides
Introduction
Nasopharyngeal carcinoma (NPC) is an insidious cancer of the head and neck, with the most frequent occurrence in East and South Asia, commonly arising in the pharyngeal recess.1 Worldwide, about 133,000 newly diagnosed cases of NPC and 80,000 deaths occur annually from the latest statistical data in 2020.2 Radiotherapy (RT) with or without chemoradiotherapy is the mainstay of treatment for NPC due to its radiosensitive and chemosensitive nature.3 In recent years, the rate of locoregional recurrence control has increased considerably since the incorporation of intensity-modulated radiotherapy (IMRT) and chemotherapy.4 However, despite receiving IMRT, the 5-year overall survival (OS) remains 80%–87%, with recurrence and distant failure occurring at an incidence of 5%–15% and 15%–30%, respectively.5–7 Hence, the treatment of NPC remains a massive challenge until now. The development of an effective tool for determining whether patients are at high risk of mortality and progression is urgently needed.
At present, the prognosis prediction and clinical treatment strategy formulation are determined by the tumor–node–metastasis (TNM) staging. Because the TNM staging solely describes the anatomical range of tumors, there may be diversity in survival outcomes among patients who have identical stages and receive similar treatment regimens. This phenomenon reveals that the traditional TNM classification ignores other variables contributing to disease progression and prognostic ability still requires enhancement. To improve the prediction of NPC patients, various hematological biomarkers have emerged as promising prognostic factors, including inflammatory biomarkers, lipid metabolism markers and plasma Epstein–Barr virus (EBV) DNA. Specifically, plasma EBV DNA is considered a particularly valuable biomarker in clinical practice, with high reliability in predicting prognosis.8 However, differences in equipment and reagents may influence plasma EBV DNA detection results.9 Therefore, it is highly desirable to explore other hematological biomarkers that are easy to detect and can withstand validation.
Recently, the concept of nasopharyngeal cancer ecology has been proposed, considering cancer as an ecological evolutionary process. The growth of caner cells depends on substances in the tumor microenvironment (TME), both of which exchange substances to achieve mutualism and co-evolve, while the progression of malignancy is regarded as ecological invasion.10 To adapt to the new TME, the metabolism of cancer cells is reprogrammed to support malignant proliferation.11 In particular, lipid metabolism contributes to the thriving of cancer cells, providing advantages for metastasis.12 Accumulating evidence confirms that lipid metabolism and inflammation are closely relevant to tumor survival, migration, invasion and metastasis.13–16 To date, lipid metabolism markers, such as total cholesterol (TC), triglycerides (TG), high-density lipoprotein cholesterol (HDL-C), low-density lipoprotein cholesterol (LDL-C), apolipoprotein A1 (Apo A1) and apolipoprotein B (Apo B), have been found to be associated with prevalence and prognosis in many malignancies, including breast cancer, colorectal neoplasms, esophageal squamous cell carcinoma, and non-small cell lung cancer.17–20 Some retrospective studies correlate levels of TG to the progression of NPC.21,22 HDL-C has been illustrated as a potential prognostic indicator for NPC, with low levels associated with a worse outcome.23 Additionally, many inflammatory biomarkers are proven to supply effective prediction guidance for NPC patients, such as lactate dehydrogenase (LDH), platelet-to-lymphocyte ratio (PLR), neutrophil-to-lymphocyte ratio (NLR) and lymphocyte–monocyte ratio (LMR).24–26 However, the connection between lipid metabolism markers and prognosis in NPC patients has been investigated in few studies. Only one or two markers were examined without combining inflammatory biomarker. Thus, in this study, we integrated lipid metabolism markers and inflammatory index to establish a nomogram with more accurate prediction of survival events than current TNM staging systems for non-metastatic NPC.
Methods
Patients
Patients treated at Guangxi Medical University Cancer Hospital from July 2012 to December 2016 were reviewed in our retrospective observational research. In order to explore early-, middle- and advanced-stage patients more comprehensively, we selected patients with non-metastatic NPC as the study population. The eligibility criteria included (1) histologically confirmed stage I–IVa NPC by the 8th edition TNM staging system; (2) adequate clinical information and follow-up data; (3) no prior other malignancies; (4) receiving IMRT. Exclusion criteria included (1) taking lipid-modulating medicine regularly before treatment; (2) receiving anticancer treatment in the past; (3) lack of serum lipid data. Overall, we randomly assigned 613 patients who met the criteria to the training cohort (429 patients) and validation cohort (184 patients) in a 7:3 ratio. The study was approved by the Ethics Committee of Guangxi Medical University Cancer Hospital in China (IRB approval number: LW2023023) and complied with the Declaration of Helsinki. Informed consent was waived for this study because of its retrospective nature. All patient data were anonymized.
Baseline Data Collection
Before initiation of treatment, we collected the baseline clinical information from the electronic medical records system, including age, gender, height, weight, smoking status, TNM stage, and therapeutic regimen. The following laboratory data were acquired within 2 weeks pre-treatment: plasma EBV DNA load, albumin (ALB), hemoglobin (HGB), inflammatory biomarkers (LDH, PLR, NLR and LMR), lipid metabolism markers (TC, TG, HDL-C, LDL-C, Apo A1 and Apo B). PLR was calculated as dividing the absolute platelet count by the absolute lymphocyte count. Dividing the absolute neutrophil count by the absolute lymphocyte count to calculate NLR. The absolute lymphocyte count divided by the absolute monocyte count is LMR.
Treatment
All eligible patients finished IMRT with a total dose of 70–74.6Gy/30-33 fractions to the primary gross tumor volume as established radiotherapy schedule, while the cervical metastatic lymph node was given 60–72.6Gy/30-33 fractions, 5 times per week. The high-risk clinical target volume and the low-risk clinical target volume were irradiated with 60–62.7Gy/30-33 fractions and 52–56.1Gy/30-33 fractions, respectively. Treatment regimens of NPC patients were RT alone for stage I, RT alone or concurrent chemoradiotherapy (CCRT) for stage II, and CCRT or induction chemotherapy (IC) + CCRT or CCRT + adjuvant chemotherapy (AC) for stage III–IVA. Patients received 1–3 cycles of cisplatin as CCRT regimen every 21 days. Patients received IC and AC regimens including GP regimen (1000 mg/m2 of gemcitabine on days 1 and 8, 80 mg/m2 of cisplatin on day 1), TPF (60 mg/m2 of docetaxel on day 1, 60 mg/m2 cisplatin on day 1, 3000 mg/m2 of 5-fluorouracil on days 1–5), TP (75 mg/m2 of docetaxel on day 1, 75 mg/m2 of cisplatin on day 1), or PF (80 mg/m2 of cisplatin on day 1, 750 mg/m2 of 5-fluorouracil on days 1–5) for 1–3 cycles every 21 days. Patients who could not tolerate cisplatin were given carboplatin, nedaplatin or loplatin.
Follow-Up and End Point
Patients returned to the outpatient department for reexamination every 3 months for the first 2 years, every 6 months for the next 3 years, and once a year after 5 years after treatment. The contents of the reexamination included physical examination, hematology examination, nasopharyngeal fiberscope, computerized tomography of the chest and abdomen, magnetic resonance imaging of the head and neck, and bone emission computed tomography if necessary. Telephone follow-up was used for patients who did not return as planned. The primary endpoint in our study was OS, which was calculated from the time from diagnosis on to death or last follow-up. The secondary endpoint was progression-free survival (PFS), which was calculated from the time from diagnosis to death, the occurrence of treatment failure or last follow-up.
Statistical Analysis
Differences between continuous variables were assessed using Mann–Whitney U-tests, while differences between categorical variables were evaluated using chi-square tests. In the training cohort, continuous variables applied the function offered in the R package “survminer” to obtain the optimal cut-off values, which were converted to categorical variables based on the calculated cut-off values. Independent prognostic factors were acquired by multivariate Cox regression analysis (P < 0.05) based on those factors that showed P < 0.05 in univariate analysis. The nomogram was formulated to predict survival events of patients based on all included independent prognostic factors using R package “rms”. The actual OS and PFS were compared with the predicted OS and PFS to plot a calibration curve to evaluate the accuracy of the nomogram. The concordance index (C-index) and receiver operating characteristic (ROC) curve were performed to compare the predictive ability of the 8th edition TNM staging and nomogram. The clinical effectiveness of prediction model was estimated by decision curve analysis (DCA). In the training cohort, the scores for each prognostic factor were summed to obtain the total risk scores for our model to determine the optimal cut-off value via “survminer”, which was applied to classify all patients into two different risk groups. The Kaplan–Meier curves were plotted for two groups by the nomogram stratification and differences in survival were compared using Log rank test. All related statistical analysis and model building were performed in R software (Version 4.1.2) and SPSS (version 25.0). Statistical significance was considered by P < 0.05 for all results.
Results
Participant Characteristics
The clinical characteristics are described in Table 1 for all eligible non-metastatic NPC patients, without statistically significant differences found between the training and validation cohorts (p = 0.1090–0.9776). Of the 613 patients, the mean age at pathologically confirmed non-metastatic NPC diagnosis was 48 years (range 16–78 years), 442 (72.10%) were male, and 171 (27.90%) were female. Most patients were treated with CCRT (300 [48.94%]) or IC + CCRT (203 [33.12%]), while a few patients received RT alone (66 [10.77%]) or CCRT + AC (44 [7.18%]). The patients were classified into the following categories based on the TNM staging: stage I were 13 (2.12%), stage II were 140 (22.84%), stage III were 258 (42.09%), stage IVa were 202 (32.95%). The median follow-up time for the study population was 67 months (range 2–141 months). In the whole cohort, the 3- and 5-year OS rates were 88.6% and 81.9%, respectively, while the 3- and 5-year PFS rates were 80.7% and 74.6%, respectively. In the training cohort, the 3- and 5-year OS rates were 87.7% and 81.4%, respectively, while the 3- and 5-year PFS rates were 81.5% and 75.7%, respectively. In the validation cohort, the 3- and 5-year OS rates were 90.6% and 83.0%, respectively, while the 3- and 5-year PFS rates were 79.0% and 72.2%, respectively. The median values of HGB, LDH, TC, TG, HDL-C, LDL-C, Apo A1, Apo B, PLR, NLR and LMR were 140.00 g/L (interquartile range [IQR] 126.00–149.00 g/L), 176.00 g/L (IQR 153.00–203.00 g/L), 5.01 mmol/L (IQR 4.38–5.79 mmol/L), 1.25 mmol/L (IQR 0.93–1.90 mmol/L), 1.26 mmol/L (IQR 1.12–1.44 mmol/L), 3.27 mmol/L (IQR 2.74–3.93 mmol/L), 1.24g/L (IQR 1.09–1.42 g/L), 0.97 g/L (IQR 0.82–1.14 g/L), 147.23 (IQR 117.02–192.14), 2.20 (IQR 1.70–3.01) and 4.15 (IQR 3.16–5.28), respectively.
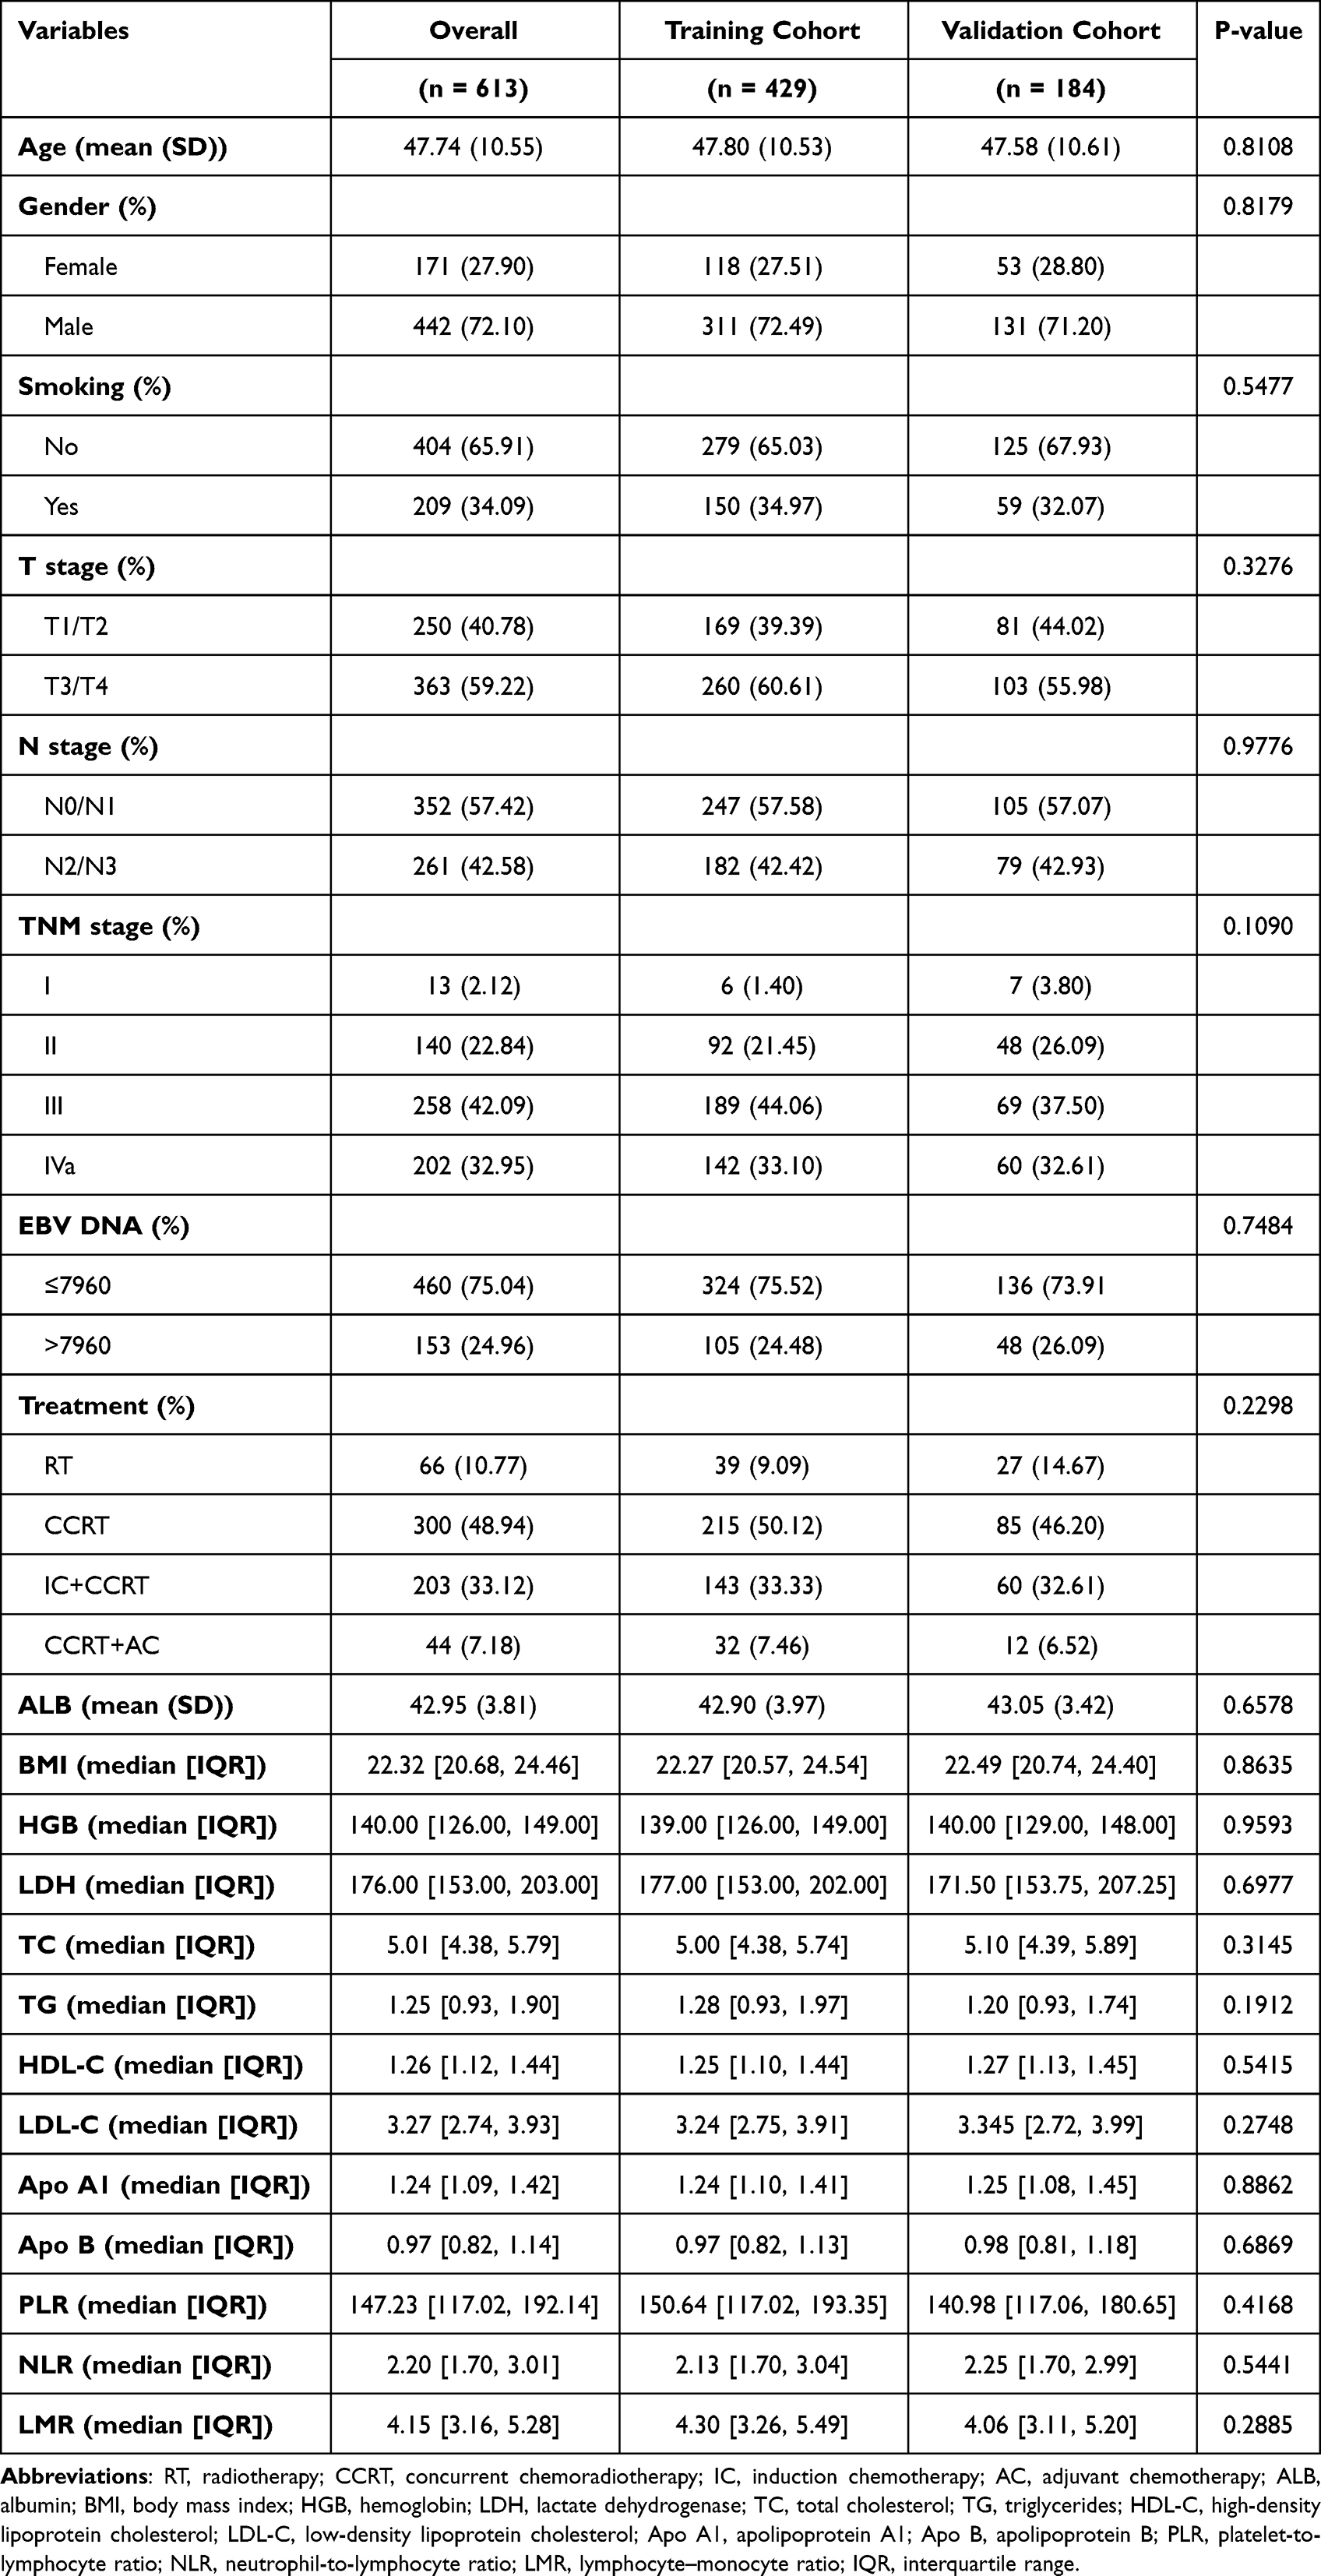 |
Table 1 Characteristics of All Eligible Study Population |
Independent Risk Factors
The optimal cut-off values for age, BMI, EBV DNA, HGB, ALB, TC, TG, HDL-C, LDL-C, Apo A1, Apo B, LDH, PLR, NLR and LMR determined by R package “survminer” were 61 years, 22.65 kg/m2, 7960 copies/mL, 121 g/L, 38.6 g/L, 5.17 mmol/L, 1.56 mmol/L, 0.98 mmol/L, 4.09 mmol/L, 1.07 g/L, 1.18 g/L, 195 U/L, 165.00, 2.85 and 2.48, respectively. Univariate analysis demonstrated statistically significant risk factors with poorer OS in the training cohort including age >61 years (P = 0.004), T stage = T3 or T4 (P = 0.009), N stage = N2 or N3 (P = 0.001), EBV DNA >7960 (P = 0.001), ALB ≤38.6 (P = 0.040), LDH >195 (P < 0.001), TG >1.56 (P = 0.042), HDL-C ≤0.98 (P = 0.001), NLR >2.85 (P = 0.005) and LMR ≤2.48 (P = 0.005). Univariate analysis demonstrated statistically significant risk factors with worse PFS in the training cohort including T stage = T3 or T4 (P = 0.006), N stage = N2 or N3 (P < 0.001), EBV DNA >7960 (P < 0.001), LDH >195 (P < 0.001), HDL-C ≤0.98 (P = 0.003), NLR >2.85 (P = 0.011) and LMR ≤2.48 (P = 0.003) (Table 2). The multivariate analysis identified that independent predictors were related to OS with P < 0.05 based on univariate analysis as follows: age, T stage, EBV DNA, LDH, TG and HDL-C. The multivariate analysis identified that independent predictors were related to PFS with P < 0.05 based on univariate analysis as follows: T stage, N stage, LDH, EBV DNA and HDL-C (Table 3).
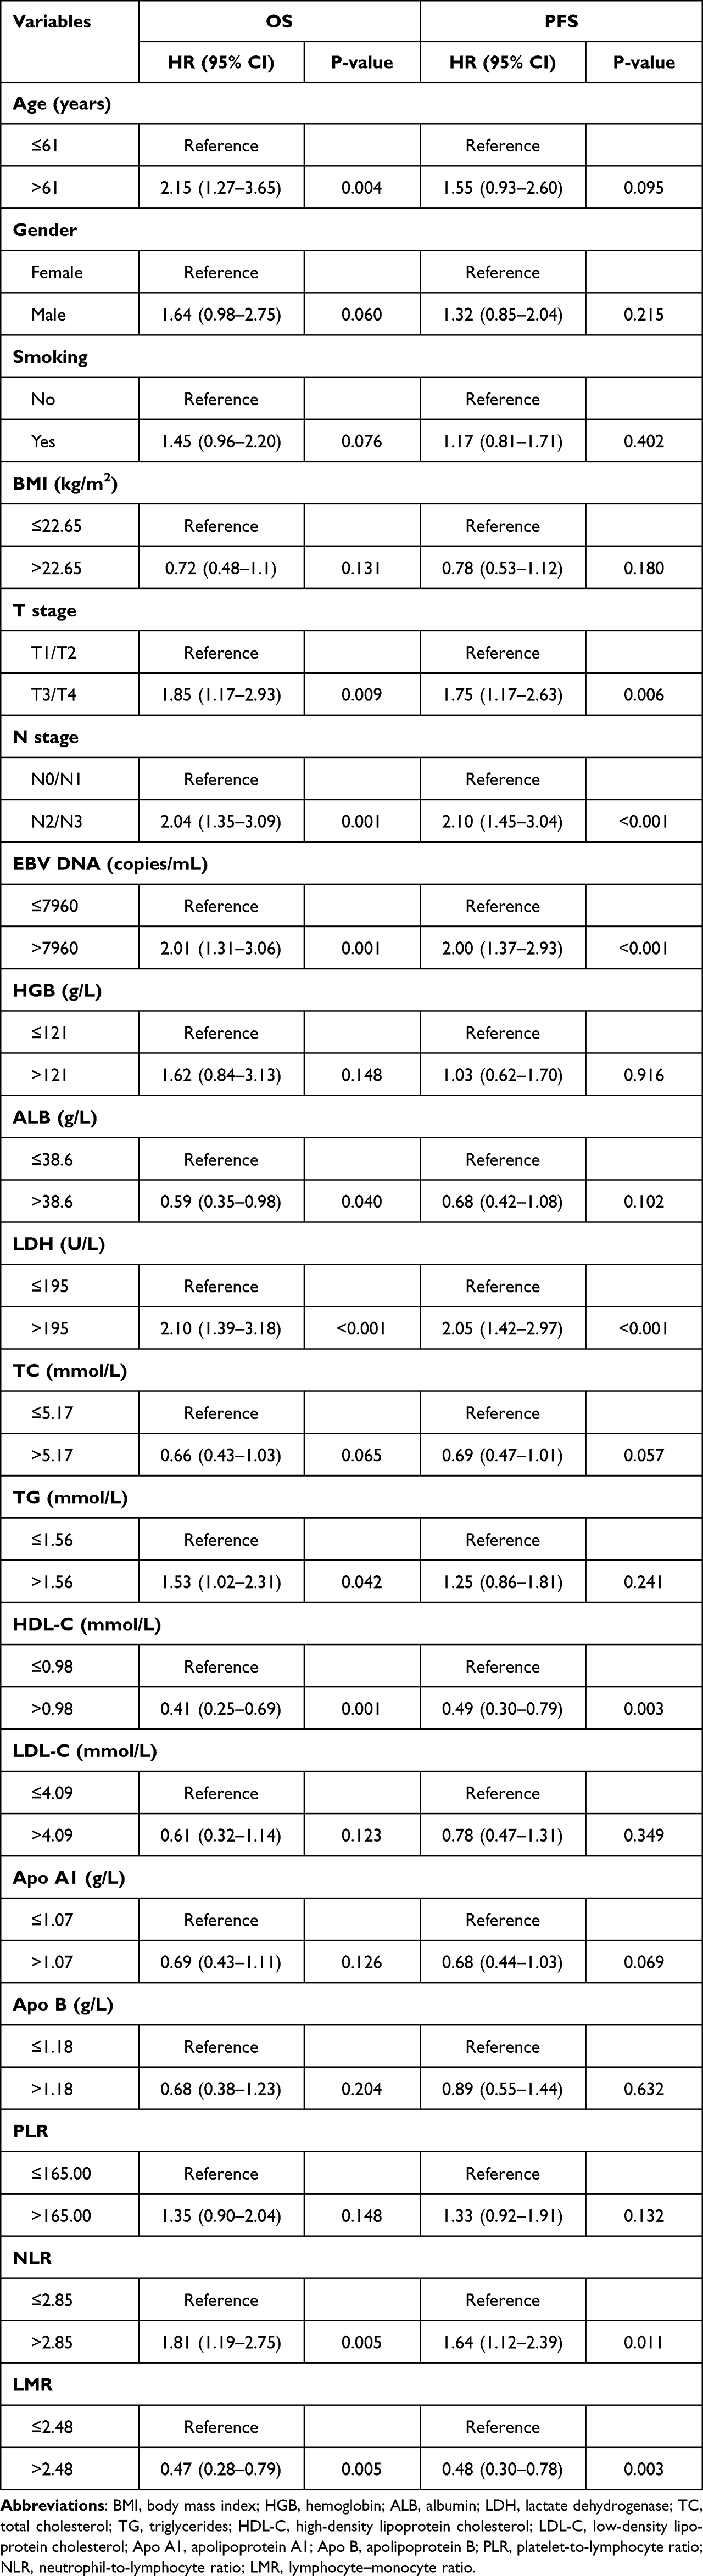 |
Table 2 Summarization of Univariate Analysis for 613 Cases Non-Metastatic NPC |
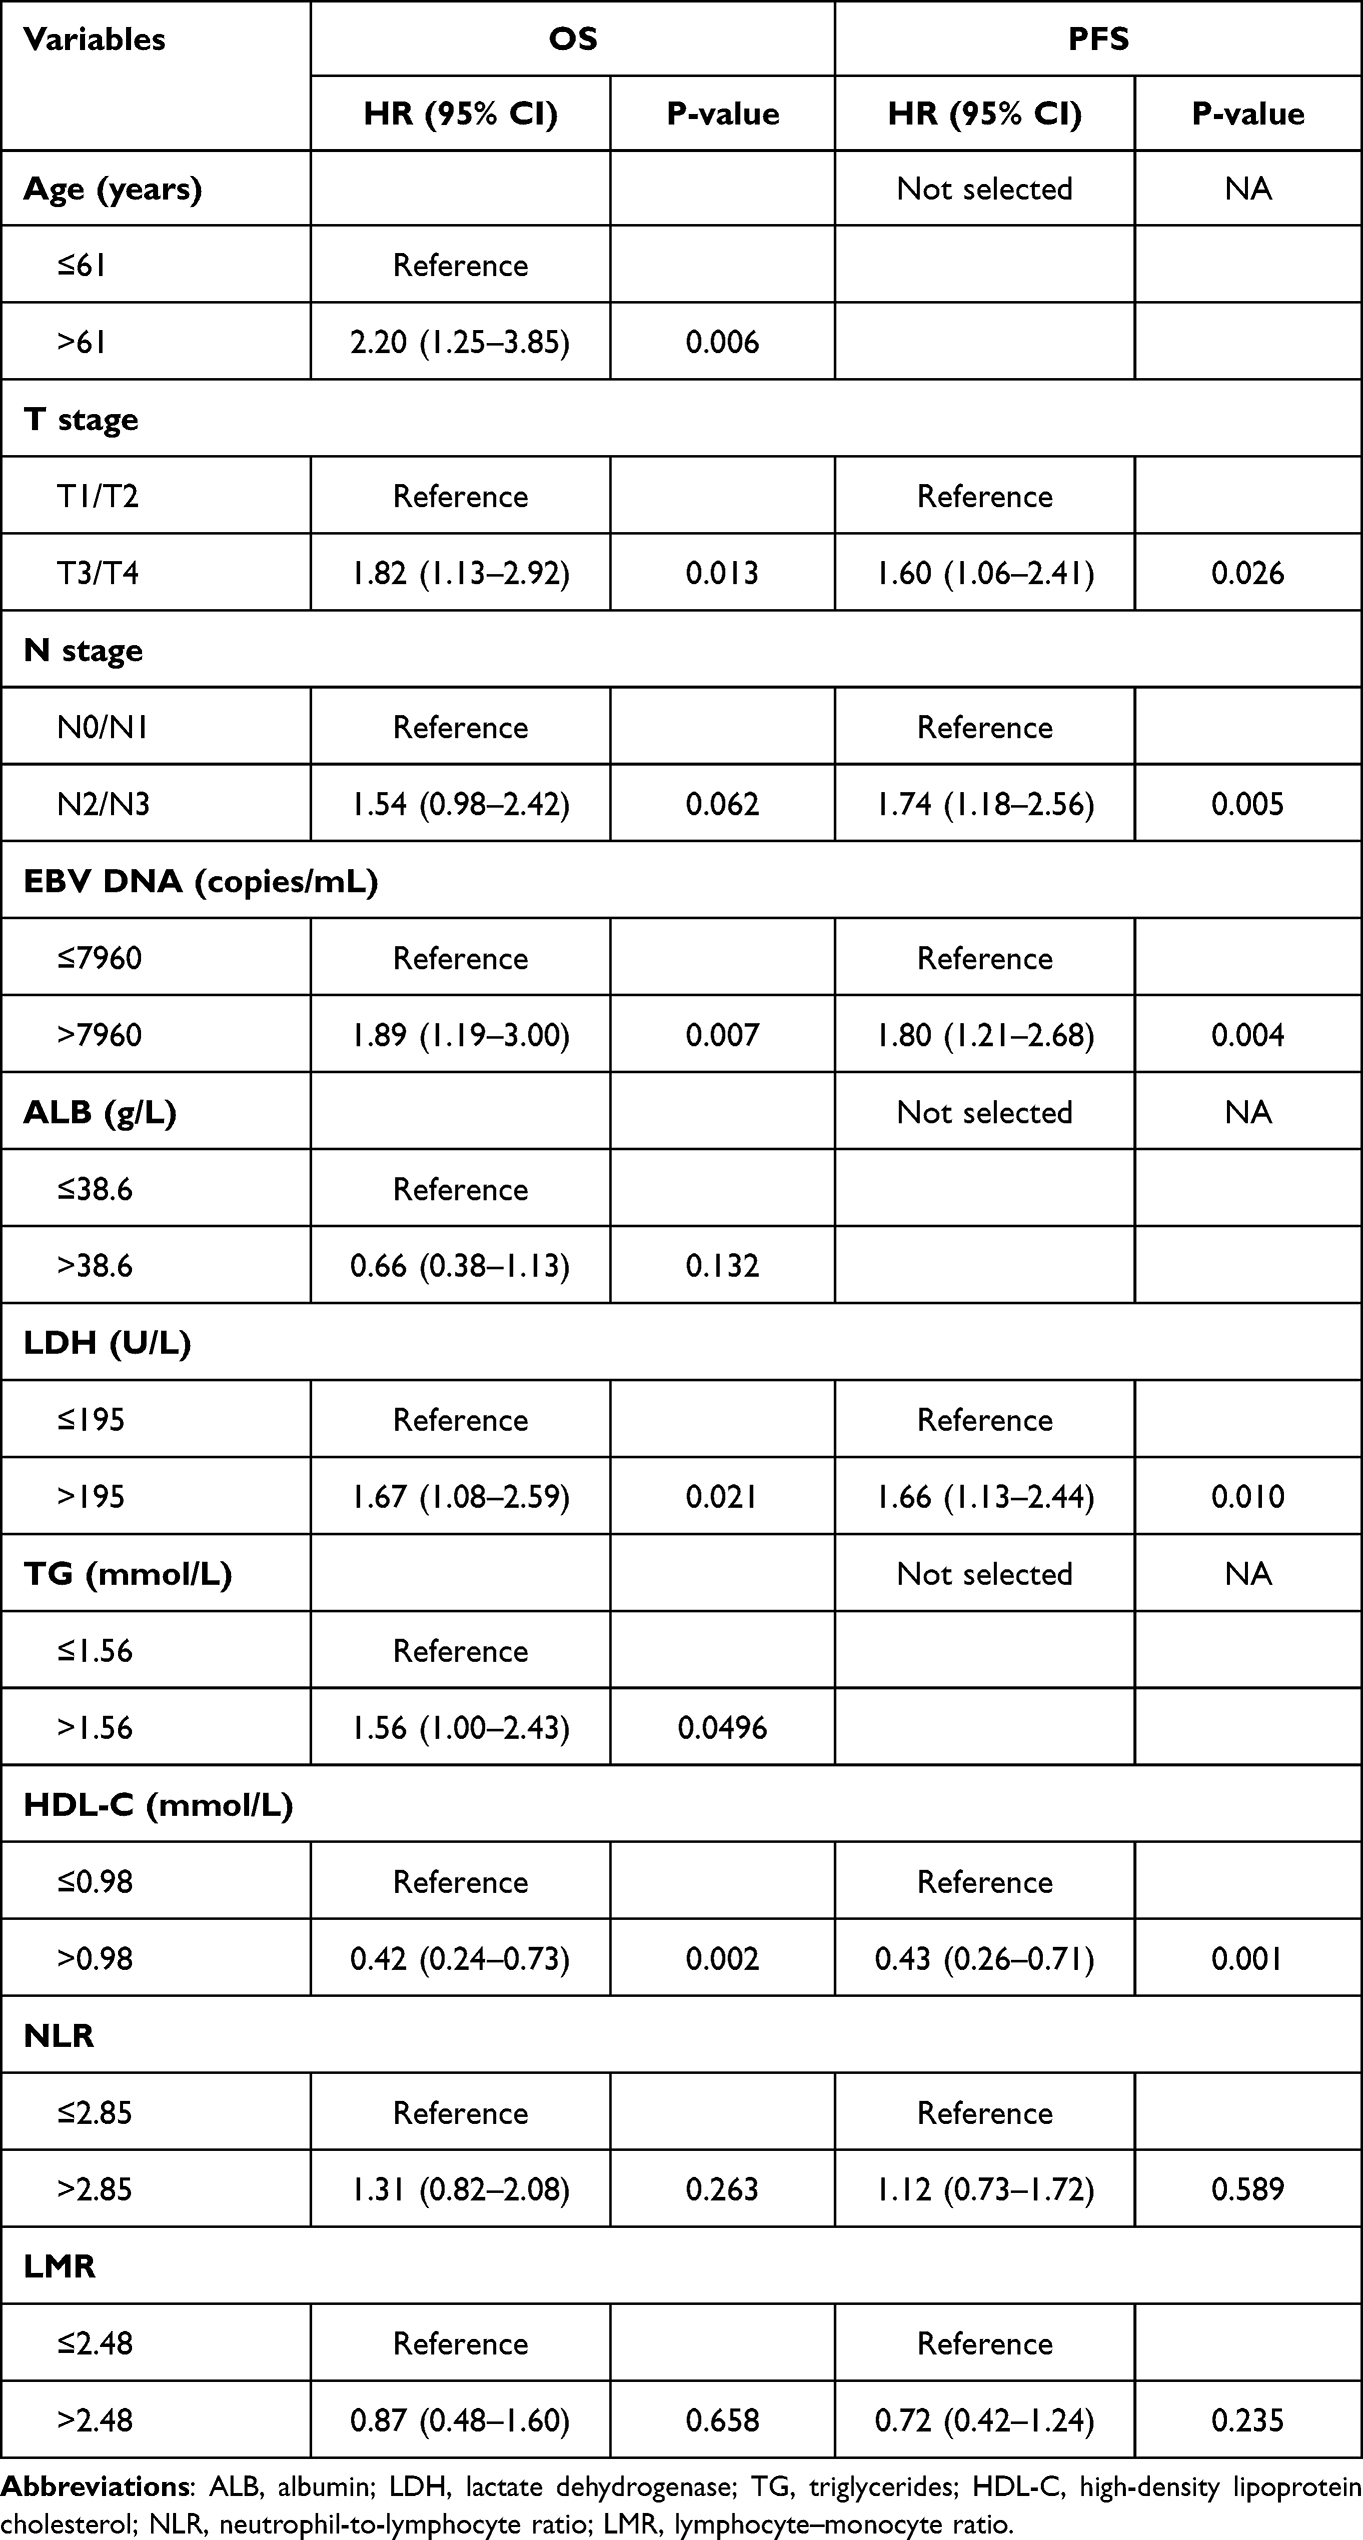 |
Table 3 Summarization of Multivariate Analysis for 613 Cases Non-Metastatic NPC |
Nomogram Construction and Validation
As displayed in Figure 1, the nomogram was constructed for predicting OS and PFS at 3- and 5-year, including the independent predictors selected in the multivariate analysis. OS nomogram indicated that age and HDL-C had a more significant effect on OS, and PFS nomogram indicated that HDL-C had the most excellent effect on PFS. It can be seen from the calibration curves of OS and PFS that the nomogram had remarkable correspondence between the prediction outcomes and the actual observations in the two cohorts (Figure 2). According to the results presented in Table 4, the C-indexes for our proposed nomogram to predict OS and PFS were over 0.650, which was considerably greater than the 8th TNM staging in the training and validation cohorts. Similarly, the ROC curves demonstrated that the nomogram had greater AUC areas and more satisfactory discrimination capability than the current TNM staging, both in the training and validation cohorts (Figure 3). Furthermore, the DCA curves revealed that the nomogram had a broader range of threshold probabilities to predict OS and PFS compared with TNM staging, resulting in higher net clinical benefits (Figure 4).
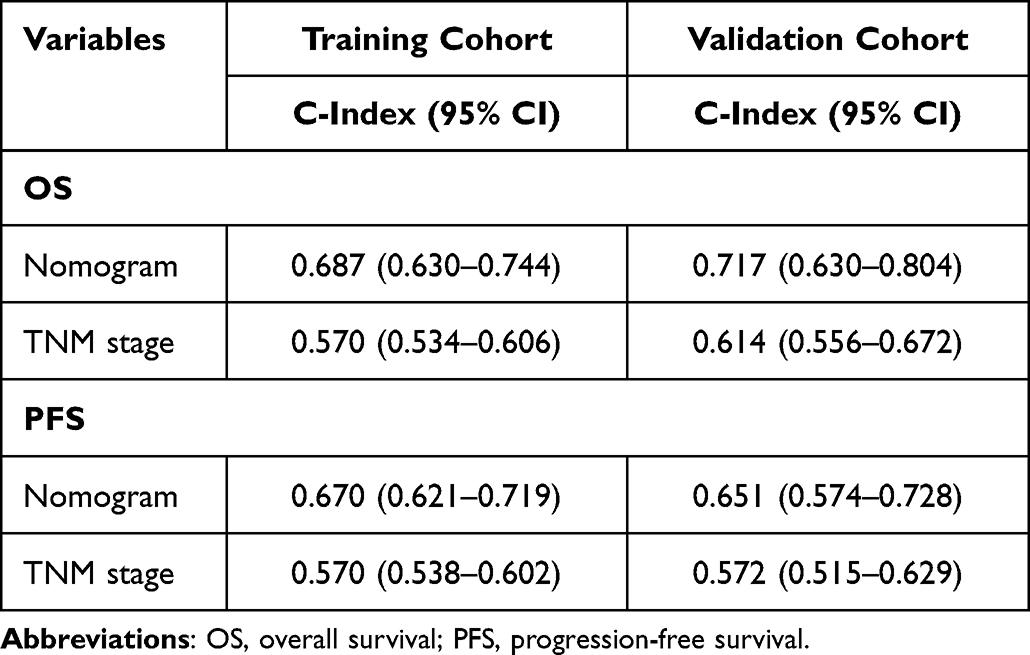 |
Table 4 C-Indexes of Nomogram Compared with TNM Staging |
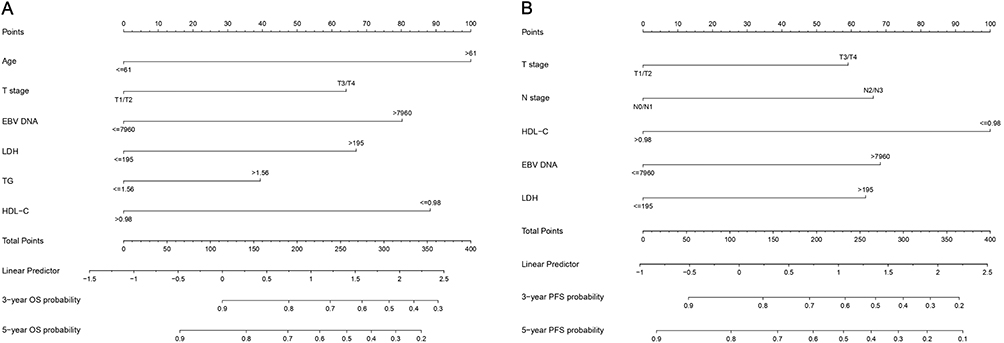 |
Figure 1 OS nomogram (A), including age, T stage, EBV DNA, TG, HDL-C and LDH. PFS nomogram (B), including T stage, N stage, EBV DNA, HDL-C and LDH. Abbreviations: TG, triglycerides; HDL-C, high-density lipoprotein cholesterol; LDH, lactate dehydrogenase; OS, overall survival; PFS, progression-free survival. |
 |
Figure 2 Calibration curves for predicting OS (A and B) and PFS (C and D) in the training and validation cohorts. Abbreviations: OS, overall survival; PFS, progression-free survival. |
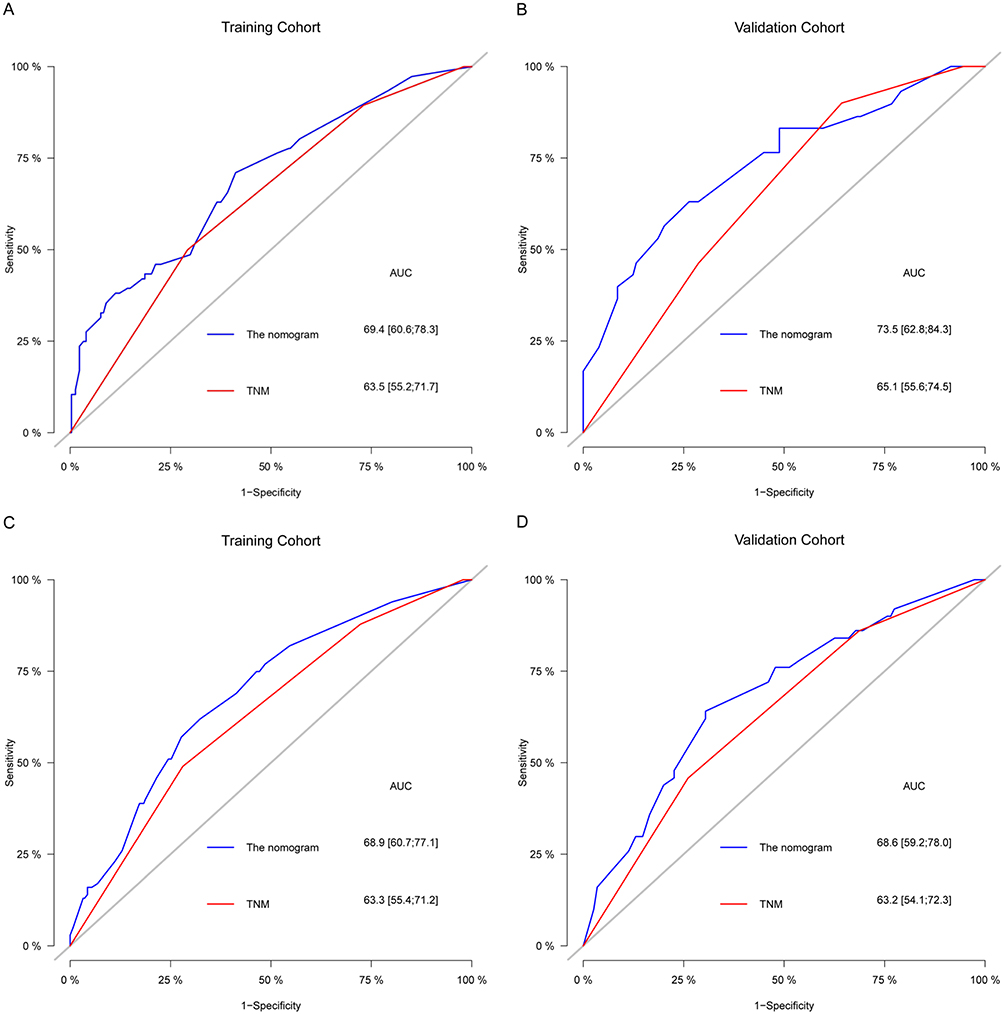 |
Figure 3 ROC curves to predict OS (A and B) and PFS (C and D) at 5 years to compare with TNM staging. |
 |
Figure 4 Decision curve analysis of 5 years OS (A and B) and PFS (C and D) in the training and validation cohorts. |
Nomograms for Risk Stratification
206 and 125 were the respective cut-off values for OS and PFS nomograms, obtained from the total scores for the constructed nomogram. For estimating the risk stratification capability of nomogram, all patients were classified as a low- (total scores of OS: ≤206; total scores of PFS: ≤125) and high-risk group (total scores of OS: >206; total scores of PFS: >125). As clearly seen in the Kaplan–Meier curves (Figure 5), patients with low risk revealed better-predicted outcomes than those with high risk in the training cohort. Different risk groups showed considerable differences (all P < 0.05), which was also verified in the validation cohort.
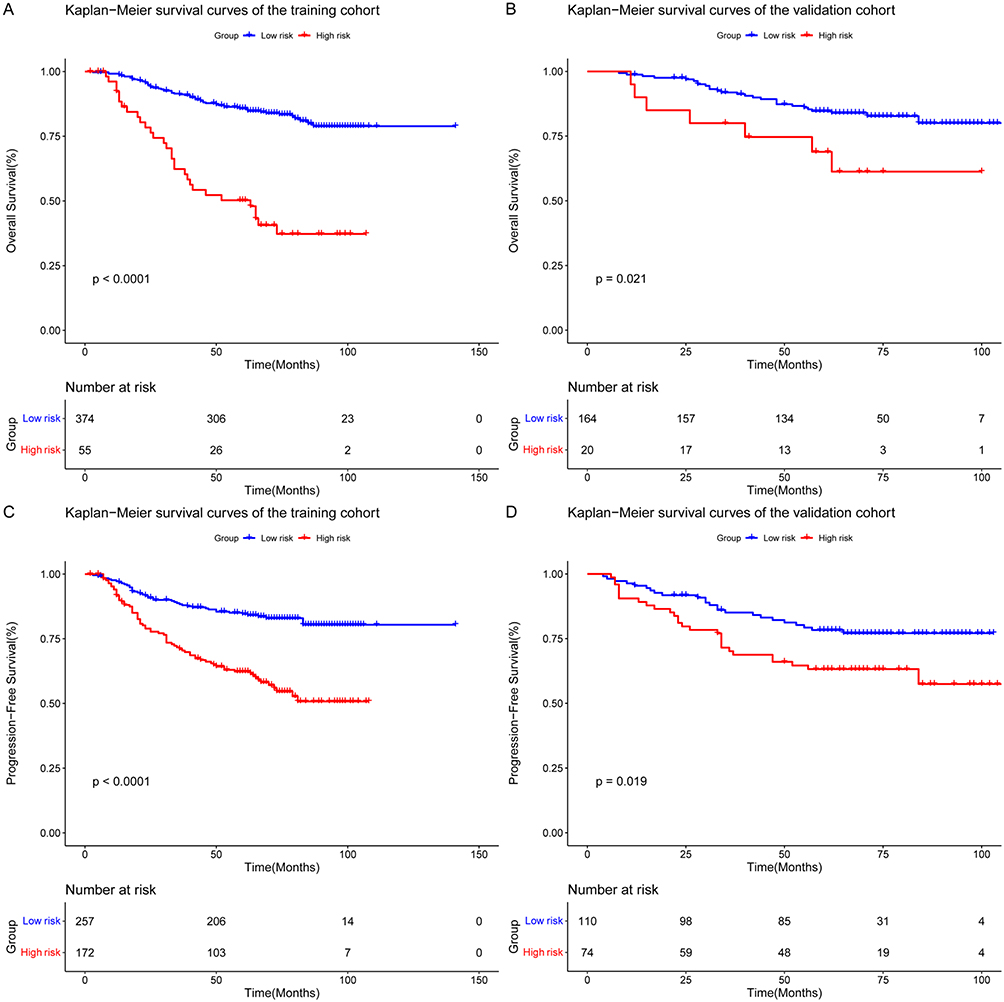 |
Figure 5 Kaplan–Meier plots for two different risk groups according to OS (A and B) and PFS (C and D) nomogram in the training and validation cohorts. |
Discussion
From what we know, this is the first research to characterize the establishment and verification of a nomogram incorporating lipid metabolism markers and inflammatory biomarker to predict OS and PFS for non-metastatic NPC. Our nomogram demonstrated superior predictive power over the 8th edition TNM staging, which would help clinicians determine whether patients are at high risk for poorer prognosis and develop individualized therapeutic regimens.
Currently, the 8th edition TNM staging is the most extensively acknowledged gold standard to predict prognosis and guide decision-making on treatment in clinical practice. However, there is still a significant difference in the prognosis among patients with identical staging, even after receiving comparable therapy.27 The comprehensive prediction capability of the TNM staging system is insufficient without considering the importance of other risk factors, resulting in this phenomenon. Thus, we explore a reliable tool to complement the TNM staging that accurately recognizes the potential patients at high risk of needing intensive treatment to obtain more clinical benefits.
Hematologic markers are economical and easy to detect to act as potential prognostic variables for NPC. Previous research shows that plasma EBV DNA plays a well-defined role in predicting and monitoring the possibility of recurrence, metastasis and death during the whole treatment period of NPC.8,28,29 It can reflect tumor load and serve as a biomarker to complement TNM staging and improve the prognosis of patients.30,31 Similarly, our results supported the favorable effect of plasma EBV DNA in prediction. In addition, our study combined indicators reflecting lipid metabolism and inflammation status of patients in the same prognostic model. A large amount of evidence has shown that tumors satisfy the need to grow rapidly and progress aggressively by regulating lipid metabolism during development.13–15,32 TG, as one of the energy sources for tumor cells, enhances tumor cell proliferation and growth under hypoxic and hypoperfusion environment, as well as exerts protective effects.33,34 There is a close correlation between a poor prognosis and high TG levels in malignancies including breast cancer, prostate cancer and non-small cell lung cancer.20,35,36 Increased TG was observed to be beneficial for adverse prognostic outcome occurrences in NPC patients by Peng et al.21
Observations to date have proven that systemic inflammation is involved in the occurrence and development of malignancies.16 As is well known, several properties of HDL have been discovered to be anti-inflammatory, anti-oxidative and anti-atherosclerotic.37 Under the stimulation of inflammatory environment, HDL is responsible for inhibiting inflammation-driven tumor angiogenesis by exerting its anti-inflammatory properties.38 Meanwhile, HDL participates in regulating the cholesterol efflux mechanism to maintain the balance of cholesterol that contributes to its anti-tumor role.39 Li et al40 illustrated that high HDL-C levels were significantly correlated with improved OS for NPC patients. As shown in the study by Wang et al,23 HDL-C was a reliable prognostic indicator for risk stratification of NPC. Our findings demonstrated that TG and HDL-C were independent predictors for NPC after treatment with IMRT, which is consistent with previous studies. A number of inflammatory biomarkers were examined considering the importance of inflammation in tumor development, including LDH, PLR, NLR and LMR. LDH was the only independent risk prognostic factor identified by multivariate analysis. Wan et al24 analyzed that LDH was an adverse prognostic indicator for NPC reflecting inflammatory status. LDH is a key enzyme for maintaining cancer cell survival in a hypoxic environment by facilitating the conversion of pyruvate to lactate.41
Recently, molecular markers such as long noncoding RNA42 and microRNAs43 have been confirmed to be significant in predicting the prognosis of NPC. However, molecular markers were not included in the nomogram because they were expensive and not routinely tested in our hospital. In contrast, three advantages can be found in the predictive model we established: first, lipid metabolism markers are more economical, objective, and easily measurable compared to plasma EBV DNA detection, and they are a common test for hospital admission. Second, the predictive and integration capabilities of nomogram are superior to traditional TNM staging, allowing for more accurate risk stratification and intensive therapies. Third, all of the prognostic factors contained in the nomogram are readily available, enabling them to be widely used even in primary medical institutions, providing practical assistance to clinicians in their medical work.
To be honest, our study has some limitations that cannot be neglected. First, the sample size of our study needs to be larger, and it is only sourced from areas where NPC is endemic, which may not be applicable for generalizing to other non-endemic areas. Second, the data for all patients are from the same hospital, and there needs to be more data from multiple centers to perform external validation of our results. Third, no authoritative, unified standards for the detection of plasma EVB DNA have been published.
Conclusion
In summary, our proposed nomogram containing TG, HDL-C and LDH was established and verified for predicting OS and PFS in non-metastatic NPC patients. Compared to the TNM staging, our nomogram can determine whether patients are at high risk for poorer prognosis accurately and early, which provides a strong foundation for clinicians to select appropriate intensive treatment. The combination of lipid metabolic markers and inflammatory index in nomogram is economical, objective, and easily measurable, facilitating its widespread use in clinical practice.
Acknowledgments
We would like to thank all authors who contributed to this study.
Funding
This study was supported by grants from the Key Research and Development Program Project of Guangxi Zhuang Autonomous Region (GuikeAB23026020), Natural Science Foundation of Guangxi Zhuang Autonomous Region (2023GXNSFBA026012) and the Independent Project of Key Laboratory of Early Prevention & Treatment for Regional High-Incidence-Tumor (GKE-ZZ202230).
Disclosure
The authors report no conflicts of interest in this work.
References
1. Chen YP, Chan ATC, Le QT, Blanchard P, Sun Y, Ma J. Nasopharyngeal carcinoma. Lancet. 2019;394(10192):64–80. doi:10.1016/S0140-6736(19)30956-0
2. Sung H, Ferlay J, Siegel RL, et al. Global cancer statistics 2020: GLOBOCAN estimates of Incidence and mortality worldwide for 36 cancers in 185 countries. CA Cancer J Clin. 2021;71(3):209–249. doi:10.3322/caac.21660
3. Blanchard P, Lee A, Marguet S, et al. Chemotherapy and radiotherapy in nasopharyngeal carcinoma: an update of the MAC-NPC meta-analysis. Lancet Oncol. 2015;16(6):645–655. doi:10.1016/S1470-2045(15)70126-9
4. Sun XS, Liu SL, Luo MJ, et al. The association between the development of radiation therapy, image technology, and chemotherapy, and the survival of patients with nasopharyngeal carcinoma: a cohort study from 1990 to 2012. Int J Radiat Oncol. 2019;105(3):581–590. doi:10.1016/j.ijrobp.2019.06.2549
5. Zhang MX, Li J, Shen GP, et al. Intensity-modulated radiotherapy prolongs the survival of patients with nasopharyngeal carcinoma compared with conventional two-dimensional radiotherapy: a 10-year experience with a large cohort and long follow-up. Eur J Cancer. 2015;51(17):2587–2595. doi:10.1016/j.ejca.2015.08.006
6. Lee AWM, Ng WT, Chan LLK, et al. Evolution of treatment for nasopharyngeal cancer – success and setback in the intensity-modulated radiotherapy era. Radiother Oncol. 2014;110(3):377–384. doi:10.1016/j.radonc.2014.02.003
7. Lee AWM, Ng WT, Chan ATC. Management of nasopharyngeal carcinoma: current practice and future perspective. J Clin Oncol. 2015;33(29):3356–3364. doi:10.1200/JCO.2015.60.9347
8. Lam WKJ, Chan KCA. Plasma Epstein–Barr virus DNA as an archetypal circulating tumour DNA marker. J Pathol. 2019;247(5):641–649. doi:10.1002/path.5249
9. Le QT, Zhang Q, Cao H, et al. An international collaboration to harmonize the quantitative plasma Epstein-Barr Virus DNA assay for future biomarker-guided trials in nasopharyngeal carcinoma. Clin Cancer Res. 2013;19(8):2208–2215. doi:10.1158/1078-0432.CCR-12-3702
10. Luo W. Nasopharyngeal carcinoma ecology theory: cancer as multidimensional spatiotemporal “unity of ecology and evolution” pathological ecosystem. Theranostics. 2023;13(5):1607–1631. doi:10.7150/thno.82690
11. Muluh TA, Sheng SX, Ying Y. Targeting cancer metabolic vulnerabilities for advanced therapeutic efficacy. Biomed Pharmacother. 2023;162:114658. doi:10.1016/j.biopha.2023.114658
12. Corn KC, Windham MA, Rafat M. Lipids in the tumor microenvironment: from cancer progression to treatment. Prog Lipid Res. 2020;80:101055. doi:10.1016/j.plipres.2020.101055
13. Bian X, Liu R, Meng Y, Xing D, Xu D, Lu Z. Lipid metabolism and cancer. J Exp Med. 2021;218(1):e20201606. doi:10.1084/jem.20201606
14. Luo X, Cheng C, Tan Z, et al. Emerging roles of lipid metabolism in cancer metastasis. Mol Cancer. 2017;16(1):76. doi:10.1186/s12943-017-0646-3
15. Cheng C, Geng F, Cheng X, Guo D. Lipid metabolism reprogramming and its potential targets in cancer. Cancer Commun. 2018;38(1):27. doi:10.1186/s40880-018-0301-4
16. Coussens LM, Werb Z. Inflammation and cancer. Nature. 2002;420(6917):860–867. doi:10.1038/nature01322
17. His M, Zelek L, Deschasaux M, et al. Prospective associations between serum biomarkers of lipid metabolism and overall, breast and prostate cancer risk. Eur J Epidemiol. 2014;29(2):119–132. doi:10.1007/s10654-014-9884-5
18. Yang MH, Rampal S, Sung J, et al. The association of serum lipids with colorectal adenomas. Am J Gastroenterol. 2013;108(5):833–841. doi:10.1038/ajg.2013.64
19. Lyu J, Yang N, Guan W, et al. Post-treatment serum triglyceride: an effective biomarker for body fat mass and overall survival in esophageal squamous cell cancer patients treated with chemoradiotherapy. Front Nutr. 2022;9:1050643. doi:10.3389/fnut.2022.1050643
20. Ma C, Wang X, Guo J, Liu P. Prognostic significance of preoperative serum triglycerides and high-density lipoproteins cholesterol in patients with non-small cell lung cancer: a retrospective study. Lipids Health Dis. 2021;20(1):69. doi:10.1186/s12944-021-01492-y
21. Peng H, Chen L, Zhang Y, et al. Prognostic value of diabetes in patients with nasopharyngeal carcinoma treated with intensity-modulated radiation Therapy. Sci Rep. 2016;6(1):22200. doi:10.1038/srep22200
22. Xie Z, Shao Y. The predictive value of serum lipids for eye metastases in male nasopharyngeal carcinoma patients. Biosci Rep. 2020;40(6):BSR20201082. doi:10.1042/BSR20201082
23. Wang CT, Chen MY, Guo X, et al. Association between pretreatment serum high-density lipoprotein cholesterol and treatment outcomes in patients with locoregionally advanced nasopharyngeal carcinoma treated with chemoradiotherapy: findings from a randomised trial. J Cancer. 2019;10(16):3618–3623. doi:10.7150/jca.32621
24. Wan XB, Wei L, Li H, et al. High pretreatment serum lactate dehydrogenase level correlates with disease relapse and predicts an inferior outcome in locally advanced nasopharyngeal carcinoma. Eur J Cancer. 2013;49(10):2356–2364. doi:10.1016/j.ejca.2013.03.008
25. Li XH, Chang H, Xu BQ, et al. An inflammatory biomarker-based nomogram to predict prognosis of patients with nasopharyngeal carcinoma: an analysis of a prospective study. Cancer Med. 2017;6(1):310–319. doi:10.1002/cam4.947
26. Zhao R, Liang Z, Chen K, Zhu X. Nomogram based on inflammatory biomarkers and nutritional indicators for predicting overall survival in locoregionally advanced nasopharyngeal carcinoma. J Inflamm Res. 2022;15:2971–2981. doi:10.2147/JIR.S366299
27. Guo R, Wang S, Hu Y, et al. New parameters of the 8th edition AJCC/UICC T category in nasopharyngeal carcinoma: cervical vertebrae invasion and parotid gland invasion. Clin Transl Med. 2020;10(7). doi:10.1002/ctm2.202
28. Hui EP, Li WF, Ma BB, et al. Integrating postradiotherapy plasma Epstein–Barr virus DNA and TNM stage for risk stratification of nasopharyngeal carcinoma to adjuvant therapy. Ann Oncol. 2020;31(6):769–779. doi:10.1016/j.annonc.2020.03.289
29. Gihbid A, Benzeid R, Faouzi A, et al. The dynamic change in plasma Epstein–Barr Virus DNA load over a long-term follow-up period predicts prognosis in nasopharyngeal carcinoma. Viruses. 2023;15:66.
30. Tan R, Phua SKA, Soong YL, et al. Clinical utility of Epstein‐Barr virus DNA and other liquid biopsy markers in nasopharyngeal carcinoma. Cancer Commun. 2020;40(11):564–585. doi:10.1002/cac2.12100
31. Guo R, Tang LL, Mao YP, et al. Proposed modifications and incorporation of plasma Epstein-Barr virus DNA improve the TNM staging system for Epstein-Barr virus-related nasopharyngeal carcinoma: refined TNM Staging for EBV-Related NPC. Cancer. 2019;125(1):79–89. doi:10.1002/cncr.31741
32. Cao Y. Adipocyte and lipid metabolism in cancer drug resistance. J Clin Invest. 2019;129(8):65.
33. Ackerman D, Tumanov S, Qiu B, et al. Triglycerides promote lipid homeostasis during hypoxic stress by balancing fatty acid saturation. Cell Rep. 2018;24(10):2596–2605.e5. doi:10.1016/j.celrep.2018.08.015
34. Snaebjornsson MT, Janaki-Raman S, Schulze A. Greasing the wheels of the cancer Machine: the role of lipid metabolism in cancer. Cell Metab. 2020;31(1):62–76. doi:10.1016/j.cmet.2019.11.010
35. Berrino F, Villarini A, Traina A, et al. Metabolic syndrome and breast cancer prognosis. Breast Cancer Res Treat. 2014;147(1):159–165. doi:10.1007/s10549-014-3076-6
36. Allott EH, Howard LE, Cooperberg MR, et al. Serum lipid profile and risk of prostate cancer recurrence: results from the SEARCH Database. Cancer Epidemiol Biomarkers Prev. 2014;23(11):2349–2356. doi:10.1158/1055-9965.EPI-14-0458
37. Tan JTM, Bursill CA. The role of high-density lipoproteins in the regulation of angiogenesis. Cardiovasc Res. 2015;106(2):184–193. doi:10.1093/cvr/cvv104
38. Zhao T, Zhu N, Shi Y, et al. Targeting HDL in tumor microenvironment: new hope for cancer therapy. J Cell Physiol. 2021;236(11):7853–7873. doi:10.1002/jcp.30412
39. Ganjali S, Ricciuti B, Pirro M, et al. High-Density lipoprotein components and functionality in cancer: state-of-the-Art. Trends in Endocrinol Metab. 2019;30(1):12–24. doi:10.1016/j.tem.2018.10.004
40. Li J, Chen S, Peng S, et al. Prognostic nomogram for patients with nasopharyngeal carcinoma incorporating hematological biomarkers and clinical characteristics. Int J Biol Sci. 2018;14.
41. Forkasiewicz A, Dorociak M, Stach K, Szelachowski P, Tabola R, Augoff K. The usefulness of lactate dehydrogenase measurements in current oncological practice. Cell Mol Biol Lett. 2020;25(1):35. doi:10.1186/s11658-020-00228-7
42. Liang YL, Zhang Y, Tan XR, et al. A lncRNA signature associated with tumor immune heterogeneity predicts distant metastasis in locoregionally advanced nasopharyngeal carcinoma. Nat Commun. 2022;13(1):2996. doi:10.1038/s41467-022-30709-6
43. Yang S, Li Y. MicroRNAs: novel factors in clinical diagnosis and prognosis for nasopharyngeal carcinoma. Acta Pharmacol Sin. 2012;33(8):981–982. doi:10.1038/aps.2012.98
 © 2023 The Author(s). This work is published and licensed by Dove Medical Press Limited. The
full terms of this license are available at https://www.dovepress.com/terms
and incorporate the Creative Commons Attribution
- Non Commercial (unported, 3.0) License.
By accessing the work you hereby accept the Terms. Non-commercial uses of the work are permitted
without any further permission from Dove Medical Press Limited, provided the work is properly
attributed. For permission for commercial use of this work, please see paragraphs 4.2 and 5 of our Terms.
© 2023 The Author(s). This work is published and licensed by Dove Medical Press Limited. The
full terms of this license are available at https://www.dovepress.com/terms
and incorporate the Creative Commons Attribution
- Non Commercial (unported, 3.0) License.
By accessing the work you hereby accept the Terms. Non-commercial uses of the work are permitted
without any further permission from Dove Medical Press Limited, provided the work is properly
attributed. For permission for commercial use of this work, please see paragraphs 4.2 and 5 of our Terms.
Recommended articles
A Nomogram to Identify the Optimal Candidates for Induction Chemotherapy in Advanced N-Stage Nasopharyngeal Carcinoma
Jiang YT, Chen KH, Liang ZG, Yang J, Qu S, Li L, Zhu XD
Cancer Management and Research 2022, 14:2583-2596
Published Date: 31 August 2022
Evaluation of Lactate Dehydrogenase and Alkaline Phosphatase as Predictive Biomarkers in the Prognosis of Hepatocellular Carcinoma and Development of a New Nomogram
Su K, Huang W, Li X, Xu K, Gu T, Liu Y, Song J, Qian K, Xu Y, Zeng H, Yang Y, Guo L, Han Y
Journal of Hepatocellular Carcinoma 2023, 10:69-79
Published Date: 14 January 2023
Prognostic Significance of Circulating Immune Subset Counts in Nasopharyngeal Carcinoma
Xie H, Zhang L, Chen L, Zhou W, Zhang L, Su Y, Li B, Ding P, Xiao Y, Lu T, Gong X, Li J
ImmunoTargets and Therapy 2025, 14:577-587
Published Date: 17 June 2025
A Real-Time Online Nomogram Integrating Systemic Inflammatory Response Index and Lactate Dehydrogenase to Predict Pathological Response in Gastric Cancer Patients Receiving Neoadjuvant Chemoimmunotherapy
Li L, Cai W, Han H, Chen S, Long B, Zhang G, Jiang X, Zhou H, Qin L, Yu Z, Jiao Z
Cancer Management and Research 2026, 18:559532
Published Date: 21 January 2026
Construction and Validation of a Nomogram Prediction Model for Individualized Prediction of the Risk of Oral Infection in Patients with Nasopharyngeal Carcinoma Undergoing Radiotherapy and Chemotherapy
Wang J, Ye Q, Liu C, Zhong K, Zhou W
Cancer Management and Research 2026, 18:603294
Published Date: 10 July 2026