Back to Journals » Journal of Hepatocellular Carcinoma » Volume 8
Development of Prognostic Evaluation Model to Predict the Overall Survival and Early Recurrence of Hepatocellular Carcinoma
Authors Zhong Y ![]() , Yang Y, He L, Zhou Y, Cheng N, Chen G, Zhao B
, Yang Y, He L, Zhou Y, Cheng N, Chen G, Zhao B ![]() , Wang Y
, Wang Y ![]() , Wang G, Liu X
, Wang G, Liu X
Received 22 January 2021
Accepted for publication 25 March 2021
Published 29 April 2021 Volume 2021:8 Pages 301—312
DOI https://doi.org/10.2147/JHC.S303330
Checked for plagiarism Yes
Review by Single anonymous peer review
Peer reviewer comments 2
Editor who approved publication: Dr Ahmed Kaseb
Yue Zhong,1– 3 Yong Yang,2,4 Lei He,2,4 Yang Zhou,2 Niangmei Cheng,2 Geng Chen,2,4 Bixing Zhao,2,4 Yingchao Wang,2,4 Gaoxiong Wang,5,6 Xiaolong Liu2– 4
1College of Life Science, Fujian Agriculture and Forestry University, Fuzhou, Fujian, 350002, People’s Republic of China; 2The United Innovation of Mengchao Hepatobiliary Technology Key Laboratory of Fujian Province, Mengchao Hepatobiliary Hospital of Fujian Medical University, Fuzhou, Fujian, 350025, People’s Republic of China; 3Fujian Institute of Research on the Structure of Matter, Chinese Academy of Sciences, Fuzhou, Fujian, 350002, People’s Republic of China; 4College of Biological Science and Engineering and Mengchao Med-X Center, Fuzhou University, Fuzhou, Fujian, 350116, People’s Republic of China; 5Department of Hepatobiliary Surgery, The Second Affiliated Hospital of Fujian Medical University, Quanzhou, Fujian, 362001, People’s Republic of China; 6Quanzhou Maternal and Child Health Hospital, Children’s Hospital, Quanzhou, Fujian, 362017, People’s Republic of China
Correspondence: Yingchao Wang
The United Innovation of Mengchao Hepatobiliary Technology Key Laboratory of Fujian Province, Mengchao, Hepatobiliary Hospital of Fujian Medical University, Fuzhou, 350025, People’s Republic of China
Email [email protected]
Gaoxiong Wang
Department of Hepatobiliary Surgery, The Second Affiliated Hospital of Fujian Medical University, Quanzhou, 362001, People’s Republic of China
Email [email protected]
Background: The aberrant expressions of lncRNAs have been frequently demonstrated to be closely associated with the prognosis of patients in many cancer types including hepatocellular carcinoma (HCC). Integration of these lncRNAs might provide accurate evaluation of HCC. Therefore, this study aims to develop a novel prognostic evaluation model based on the expression of lncRNAs to predict the survival of HCC patients, postoperatively.
Patients and Methods: RNA sequencing (RNA-seq) analysis was performed for 61 HCC patients (training cohort) to screen prognosis-associated lncRNAs with univariate Cox regression and Log rank test analyses. Multivariate Cox regression analysis was then applied to establish the final model, which was further verified in a validation cohort (n=191). Moreover, performance of the mode was assessed with time-dependent receiver operating characteristic curve (tdROC), Harrell’s c-index, and Gönen & Heller’s K.
Results: After a serial statistical computation, a novel risk scoring model consisting of four lncRNAs and TNM staging was established, which could successfully divide the HCC patients into low-risk and high-risk groups with significantly different OS and RFS in both training and validation cohorts. tdROC analysis showed that this model achieved a high performance in predicting OS and 2-year RFS in both cohorts. Gene Set Enrichment Analysis revealed that HCC tumor tissues with high-risk score have stronger capacities in immune escape and resistance to treatment.
Conclusion: We successfully established a novel prognostic evaluation model, which exhibited reliable capacity in predicting the OS and early recurrence of HCC patients with relatively higher accuracy.
Keywords: hepatocellular carcinoma, long noncoding RNA, risk score, prognosis, survival
Introduction
Hepatocellular carcinoma is one of the most common malignancies and one of the most frequent causes of cancer-related death worldwide,1 especially in China, where more than 50% of global new cases and HCC-associated mortalities is estimated to occurred annually.2 It is reported that the postoperative median survival time of HCC patients is only 23 months in Chinese mainland, which is dramatically less than that in Chinese Taiwan and Japan (more than 60 months in both areas).3 Lack of regular surveillance is considered as the predominant reason causing the poor prognosis of HCC patients in Chinese mainland.
Recurrence and metastasis frequently occur in HCC patients after surgical resection. It is reported that around 50% of HCC patients are subject to recurrence within 2 years4–6 which is widely considered as the cut-off to classify the recurrence into early and late stages.7 However, patients with early HCC are more likely to receive curative treatment and harvested more satisfactory 5-year survival (50–75%) than those of late-stage HCC.8,9 Therefore, it is critical to find a robust method to more accurately predict early recurrence and postoperative survival to further improve the prognosis of HCC patients.
Recently, many staging systems, such as the Barcelona Clinic Liver Cancer staging system and TNM staging system,10 have been developed to guide the clinical practice, which are also deemed as important prognostic factors of HCC. However, it is still difficult to accurately assess the prognosis of HCC patients completely based on these staging systems. Therefore, many prognostic signatures have been established to distinguish HCC patients with high risk or low risk, which are helpful for both postoperative management and clinical decision‐making in the treatment of HCC patients.
With the development of high-throughput sequencing, many publicly available datasets have been constructed, such as TCGA and GEO, which provided ideal platforms for the establishment of prognostic signatures. On the basis of the CGA database, we and other groups have identified some novel signatures for prognosis prediction of hepatocellular carcinoma.11–13 However, individuals sequenced in TCGA datasets were mostly North American patients. And it is well known that geographic differences result in differences of the cause of HCC. For examples, HCC is frequently induced by HCV infection in North America, but is predominately induced by HBV infection in East Asia. Additionally, there are also differences in ethnicity, lifestyle, and diet related to HCC between Asians and Americans. Some important prognostic factors in HBV-induced HCC might be ignored during the establishment of prognostic signatures within the TCGA dataset, such as HBx-E214 and RP11-439L8.3 (identified in this study). Hence, although many signatures based on the TCGA dataset exert well outcomes, even in Asians, they may still not be ideal models to evaluate the prognosis of HCC patients in Asia.
In this study, we constructed a risk scoring model consisting of four lncRNAs and TNM staging. HCC patients with low-risk scores usually showed better overall survival (OS) and recurrence free survival (RFS) than those with high-risk scores, which was further verified by an enlarged validation cohort. Together, this novel four-lncRNAs-TNM model is a well prognostic predictor for OS and 2-year RFS of HCC patients.
Patients and Methods
Samples Selection and Collection
The design of this study is shown in Figure 1. The enrolled HCC patients had to meet the following criteria: 1) patients were pathologically diagnosed by two experienced pathologists who did not take part in the rest of data analysis; 2) patients did not receive any other antitumor treatment before surgery; 3) patients did not die of non-liver disease or accidents; and 4) patients did not suffer from recurrence within 1 month. Following the criteria, a total of 231 HCC patients were enrolled from November 2013 to July 2016 at Mengchao Hepatobiliary Hospital of Fujian Medical University and distributed into the training cohort (n=61) and the validation cohort (n=191). Among recruited patients, 70% of them have the background of HBV infection (Table 1). The median follow-up periods were 42 and 51.1 months in the training and the validation cohorts, respectively. The follow-up survey was performed every 6 months. The tissue samples were collected and preserved as previously described.11 The study protocol and the usages of clinical samples were approved by the Institution Review Board of Mengchao Hepatobiliary Hospital of Fujian Medical University. All patients had signed the informed consents. The whole study was conducted in accordance with the Declaration of Helsinki.
 |
Figure 1 The design of this study. A total of 231 HCC patients from Mengchao Hepatobiliary Hospital of Fujian Medical University were collected and distributed into the training cohort (n=61) and the validation cohort (n=191). Among these recruited patients, 21 patients were shared by both of the cohorts. HCC and non-tumor tissues from the training cohort were analyzed by RNA sequencing, and applied to establish the prognostic model. Another batch of samples from the validation cohort were measured by qRT-PCR to confirm the expressions of prognostic evaluation lncRNAs and assess the performance of the model. |
 |
Table 1 Clinical Characteristics of HCC Patients in Two Cohorts |
Construction of RNA Sequencing Dataset and Differentially Expressed lncRNA Screening in the Training Cohort
The HCC and their paired adjacent non-tumor tissues derived from 61 HCC patients in the training cohort were used for transcriptome sequencing (RNA-seq) on Illumina HiSeq X10 platform (paired end, 150 bp) by Annoroad Gene Tech. (Beijing) Co., Ltd. The differentially expressed lncRNAs (DE-LncRNAs) between tumor and their paired non-tumor samples were identified according to the following criteria: 1) the threshold was set as |log10(fold change) | >3.32 and the adjusted p<1.3*10−5; 2) the upregulation or downregulation of lncRNAs occurred in more than 50% of HCC tissues.
Establishment of Predictive Model in the Training Cohort
To further narrow the potentially prognostic factors, univariate Cox regression and Log rank test analysis were performed by SPSS software (SPSS, Inc., Chicago, IL). In univariate Cox regression analysis, lncRNAs with a p-value less than 0.1 and clinical parameters with a p-value less than 0.05 were considered as prognostic candidates, which were subsequently subject to Log rank test. As for results, eleven lncRNAs and nine clinical parameters with p<0.05 in Log rank test analysis were selected as prognostic factors and incorporated into multivariate Cox regression analysis. Finally, a novel risk scoring formula consisting of four lncRNAs and TNM staging (all p<0.05) were developed as follows:

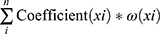
Here, ep is the natural exponential value of p, and p is the sum of the product of coefficient (xi) and ω (xi). The coefficient (xi) refers to multivariate Cox regression coefficient of each lncRNA or TNM staging, while ω (xi) represents the relative expression value of lncRNAs (z‐score normalized) or TNM staging.
Risk Stratification and Performance Evaluation of Predictive Model
The risk score of HCC patients in both of the training and validation cohorts were respectively calculated according to the aforementioned risk scoring formula. And the patients in the training cohort were further distributed into low-risk and high-risk groups according to the median risk score. Kaplan-Meier analysis was conducted to analyze the survival differences between low- and high-risk groups with Prism 8 software (San Diego, CA, USA). To assess the sensitivity and specificity of our newly established model for predicting the prognosis of HCC patients, the area under time-dependent receiver operating characteristic (tdROC), the curve (tdAUC) was calculated with “tdROC” package of R software (4.0.3). Meanwhile, the optimum cutoff value of risk score was also confirmed by tdROC analysis according to the maximal Youden index, which was used for separating the HCC patients into low-risk and high-risk groups in the validation cohort. In addition, model discrimination was also assessed by the Harrell’s c-index and Gönen & Heller’s K, with “survival” and “CPE” packages of R software, respectively, as previously described.4
RNA Extraction and Real-Time Quantitative PCR Analysis of the Samples in the Validation Cohort
Total RNA of HCC tissue samples in the validation cohort was extracted using TransZol Up Plus RNA kit (TransGen Biotech Ltd., Beijing, China) and quantified. Afterwards, 1 μg of total RNA was revise-transcribed into cDNA using the Transcriptor First Strand cDNA Synthesis Kit (Roche Ltd., Basel, Switzerland). The qPCR assay was then performed as previously described.11 The primer sequences of target genes are shown in Supplementary Table S1.
Functional Enrichment Analysis
Gene Set Enrichment Analysis (GSEA) was applied to characterize the concordant differences between low-risk and high-risk groups using the “clusterProfiler” package of R software. A gene set with enrichment p<0.01 and p. adjust<0. 05 was considered as statistically significant.
Results
Clinical Characteristics of HCC Patients in Both Cohorts
In this study, a total of 231 HCC patients were recruited and constituted the training cohort (n=61) and the validation cohort (n=191) according to the inclusion criteria, whose clinical characteristics are listed in Table 1. HCC and non-tumor tissues collected from HCC patients in the training cohort were subject to RNA-seq analysis, while tumor tissues from HCC patients in the validation cohort were subjected to validate the clinical significance of our established model by qRT-PCR assay. Both cohorts presented significant differences in several clinical characteristics including age (p=0.026), tumor size (p=0.030), tumor envelope (p=0.002), Edmondson classification (p=0.001), and TNM staging classification (p=0.003). Notably, 21 patients were shared in the training and the validation cohorts, which were applied to verify the consistency between the results in RNA-seq and qRT-PCR.
Identification of Prognostic lncRNAs in the Training Cohort
To filter the potential lncRNAs associated with the prognosis of HCC patients, we adopted a strict screening strategy in the whole process of the model establishment, which was presented in the Materials and Methods section. In the comparisons between HCC and non-tumor tissues in the training cohorts, a total of 395 lncRNAs (368 upregulation and 27 downregulation) were identified as Differentially Expressed lncRNAs (DE-LncRNAs, Figure 2). These significantly dysregulated lncRNAs, together with 41 clinical parameters, including TNM staging and BCLC staging, were analyzed by univariate Cox regression and Log rank tests. And eleven lncRNAs and nine clinical parameters were identified as candidates significantly associated with OS in the training cohort and were taken into further analysis of downstream multivariate Cox regression.
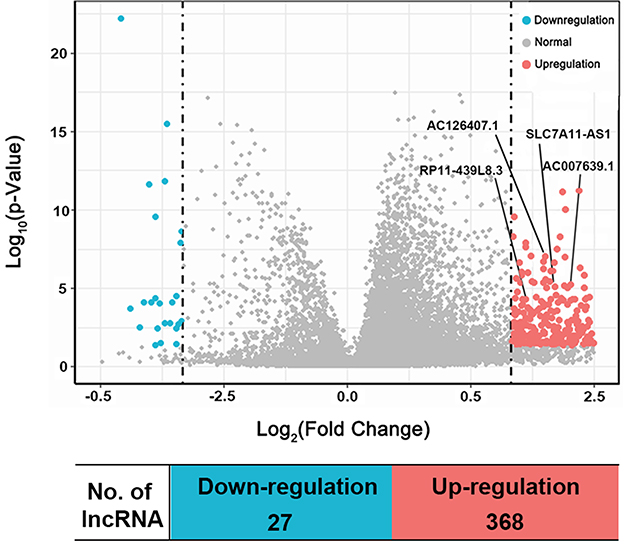 |
Figure 2 Volcano plot showing the distribution of DE-LncRNAs. Red dots represent upregulated lncRNAs and green dots represent downregulated lncRNAs in HCC compared to non-tumor tissues. |
Establishment and Validation of Predictive Model in the Training Cohort
The multivariate Cox regression identified five prognostic evaluation factors including AC007639.1, AC126407.1, SLC7A11-AS1, RP11-439L8.3, and TNM staging (Table 2). The expressions of these lncRNAs in the training cohort are shown in Supplementary Figure S1, whose expressions in the TCGA dataset well supported our results except for lncRNA RP11-439L8.3, which is not found in the TCGA dataset. Depending on these prognostic evaluation factors, a risk scoring formula was established as follows:
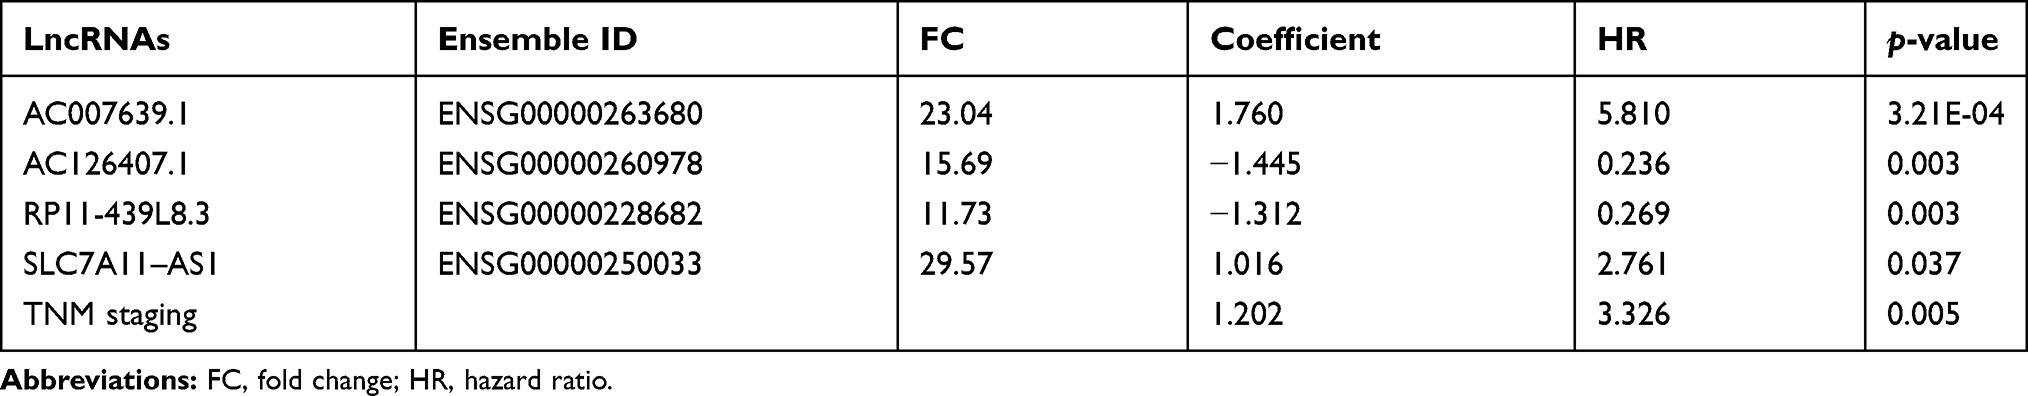 |
Table 2 The Details of Four lncRNAs and TNM Staging Screened Picked Up by Multivariate Cox Regression Analysis |
Risk score =  , p = 1.760*(AC007639.1) + 1.016*(SLC7A11-AS1) - 1.445*(AC126407.1) - 1.312*(RP11-439L8.3) + 1.202*(TNM staging)
In addition, the expressions of these lncRNAs were also investigated by qRT-PCR in HCC tissues in the validation cohort. The consistency analysis with 21 shared HCC samples showed that qRT-PCR results were significantly correlated with that in RNA-seq data (p<0.05, Supplementary Figure S2), which supported the reliability of our methods. To standardize the data obtained from qRT-PCR, z-score normalization was performed. Afterwards, the risk score was calculated from all recruited HCC patients with this newly-established model. The patients were further divided into low-risk and high-risk groups using the median risk score (0.590) as cut-off in the training cohort and an optimum cut-off value of risk score at 0.615 is identified by tdROC analysis in the training cohort and used to divide the low-risk patients with the high-risk patients in the validation cohort. The Kaplan-Meier curves were plotted to examine the survival differences of the HCC patients by Log rank tests. The results indicated that patients with high-risk score usually suffered from shorter OS time than those with the low-risk score in the training cohort (median OS time: 25 vs 50 months, p=6.5548E-8, Figure 3A), which was well supported by the results in the validation cohort (median OS time: 19 vs 54 months, p=4.4563E-8, Figure 3B). Similarly, the RFS time of patients in the high-risk group was significantly shorter than those in the low-risk group in the training cohort (median RFS time: 5 vs 37 months, p=5.0259E-7, Figure 3C). The consistent results were also obtained in the validation cohort (median RFS time: 4 vs 28 months, p=0.000735, Figure 3D). The distribution of risk score and OS time in the training and validation cohorts are presented in Figure 3E and F.
 |
Figure 3 Survival curves and distributions plot of HCC patients in training or validation cohorts. (A and B) Kaplan-Meier survival curve of OS between high-risk and low-risk groups in the training cohort (A) and in the validation cohort (B). (C and D) Kaplan-Meier survival curve of RFS between high-risk and low-risk groups in the training cohort (C) and in the validation cohort (D). (E and F) The distributions of HCC patients according to the risk score and survival status in the training cohort (E) and in the validation cohort (F). The patients in the training cohort were divided into low-risk group and high-risk group depending on the median score. However, optimum cut-off calculated by tdROC curve was used for distributing the patients from the validation cohort into low-risk and high-risk groups. |
Assessing Model Performance in the Training and Validation Cohorts
Next, to further assess the prognostic power of our model, tdROC curve analysis was performed in the training and validation cohorts. The results showed that the model can accurately discriminate high-risk patients from low-risk patients, whose tdAUC (area under the curve) were 0.82 (95% CI=0.691–0.917) and 0.79 (95% CI=0.718–0.854) in the training cohort (Figure 4A) and the validation cohort (Figure 4B), respectively. Moreover, the tdAUC of this model were higher than that of any single factor, especially TNM staging, in both training and validation cohorts (Supplementary Table S2), which indicated that four lncRNAs and TNM staging are indispensable to efficiently predict the OS of HCC. Based on the tdROC analysis of the data from the training cohort, the optimum cut-off value (value=0.615) was identified with a specificity of 82.76% (95% CI=64.23– 94.15%) and a sensitivity of 84.38% (95% CI=67.21–94.72%), which was subsequently applied to divide the patients in the validation cohort. Besides tdROC, the Harrell’s c–index and Gönen & Heller’s K methods were also applied to assess the performance of this model, as previously described.4 As shown in Figure 4E, good performance in predicting OS of HCC patients were observed in both cohorts. Meanwhile, multivariate Cox regression analysis was performed in the validation cohort once more to evaluate the clinical significance of our model along with clinical parameters. The results indicated that the risk score was an independent prognostic factor in predicting OS and RFS of HCC patients (Supplementary Figure S3).
 |
Figure 4 Performance assessment of prognostic evaluation model for predicting OS and RFS in the training and the validation cohorts. (A and B) Time-dependent receiver operating characteristic (tdROC) curves of the prognostic evaluation model in predicting OS in the training cohort (A) or in the validation cohort (B). (C and D) tdROC curves of the prognostic evaluation model in predicting RFS in the training cohort (C) or in the validation cohort (D), (E) Harrell’s c-index and Gönen & Heller’s K analysis of the prognostic evaluation model in predicting OS and RFS in both of the cohorts. Abbreviations: AUC, area under curve; OS, overall survival; RFS, recurrence-free survival. |
Although the tdAUC achieved relatively good performance in the training cohort (tdAUC=0.79; 95% CI=0.679–0.888, Figure 4C), the value was only 0.59 (95% CI=0.492–0.679) when this model was used for predicting the RFS of HCC patients in the validation cohort (Figure 4D). And the values of Harrell’s c-index and Gönen & Heller’s K analyses were relatively low. Because this model was constructed according to the OS, it was not surprising that this model might be less accurate in predicting the RFS of HCC patients.
Association Analysis of the Prognostic Evaluation Model with Clinical Parameters in the Validation Cohort
The results of correlation analysis showed that risk scores were significantly associated with age (p=0.007), tumor size (p=3.15E-8), tumor embolus (p=2.77E-4), vascular invasion (p=3.54E-7), AFP (p=8.38E-8), aspartate aminotransferase (AST, p=0.018), Edmondson grading (p=0.031), BCLC staging (p=1.33E-7), and TNM staging (p=1.03E-30), which indicated that this model was also an important factor reflecting patients’ disease status, like TNM staging and BCLC staging (Table 3). Furthermore, HCC patients with unfavorable clinical outcomes including vascular invasion, tumor embolus, bigger tumor size (p=1.11E-4), higher level of AFP (p=0.0001), or advanced BCLC stage (p=0.0001) always had significantly higher risk scores, except for Edmondson grading (p=0.0581), as shown in Figure 5A–F. Additionally, the HCC patients with lower risk scores usually had longer OS time, regardless of the presence or absence of vascular invasion, tumor embolus, or high-grade BCLC stage (all p<0.05, Figure 5G–I). Therefore, these results further demonstrated that the risk score calculated by our prognostic evaluation model indeed served as a reliable independent prognosis predictor of HCC patients.
 |
Table 3 Comparison of Clinical Variables between HCC Patients with Low and High Prognostic Value in Testing Cohort |
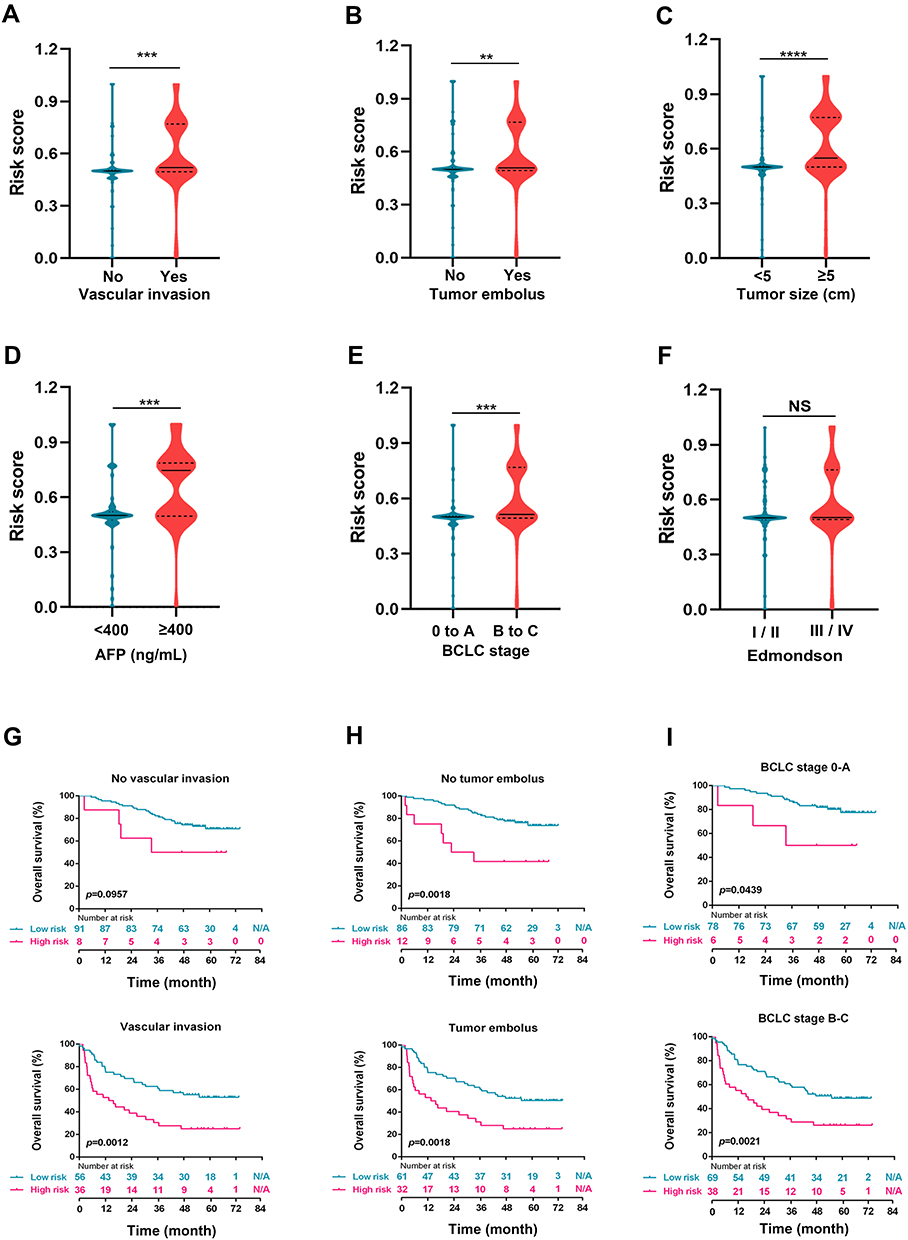 |
Figure 5 Correlation analysis of risk score, clinicopathological features, and survival. (A–F) HCC tissues with vascular invasion (A), tumor embolus (B), bigger tumor size (≥5cm) (C), higher AFP level (≥400 ng/mL) (D), more advanced BCLC grading (stage B or stage C) (E), but not Edmondson classification (F), displayed significantly higher risk score, **p<0.01, ***p<0.001, ****p<0.0001, NS, non-significant. (G–I) Kaplan–Meier curves for overall survival between HCC patients with high-risk score and low-risk score in the validation cohort, according to different clinical features: vascular invasion (G), tumor embolus (H), and BCLC staging (I), all p<0.05. Abbreviation: NS, non-significant. |
Functional Enrichment Analysis in the Training Cohort
To further understand the molecular signatures of high-risk and low-risk groups, GSEA analysis was performed with the entire RNA-seq dataset grouped by the risk score. The results showed that the co-expressed genes in the high-risk group compared to the low-risk group were mainly enriched in “Regulation of innate immune response”, “Negative regulation of immune system process”, “autophagy”, and “Response to radiation” (Figure 6A–D). It is widely accepted that chemotherapy, radiotherapy, and even immunotherapy are the main treatment approaches besides surgical resection. Thus, these results indicated that HCC tissues of patients with high-risk score seemingly exhibited stronger capacities at immune escape and resistance to the treatment of cancer.
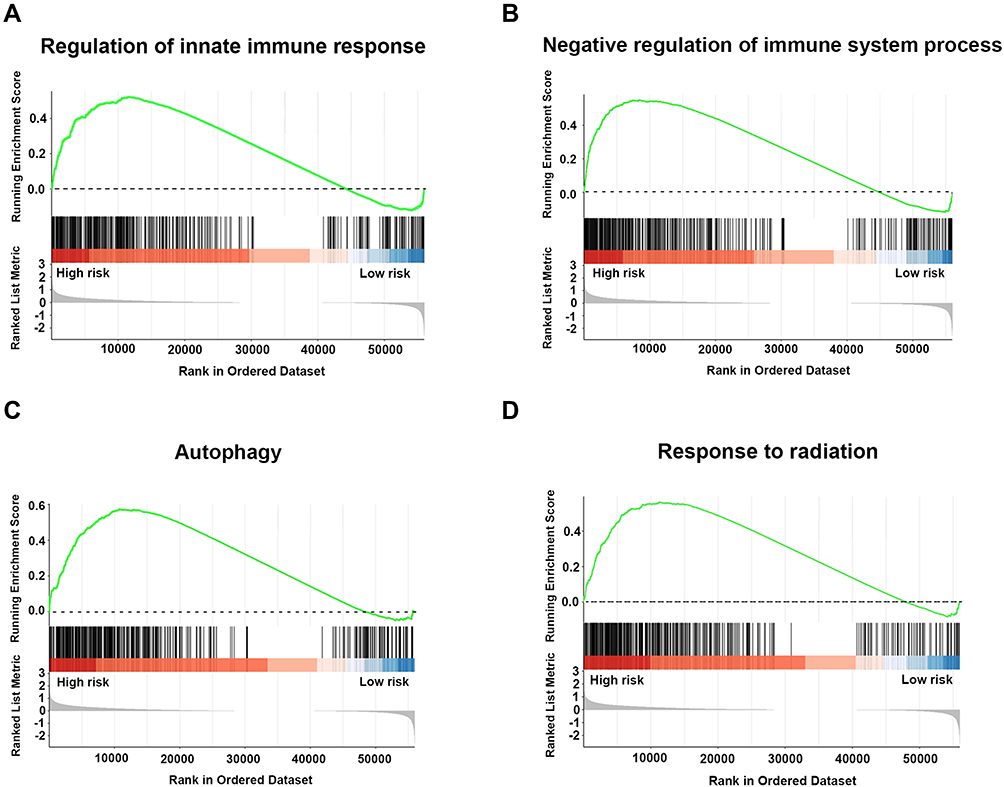 |
Figure 6 GSEA analysis of significantly enriched genes sets in the comparison between high-risk and low-risk groups in the training cohort. Differentially expressed gene sets in the comparison between high-risk and low-risk groups were enriched in regulation of innate immune response (A), negative regulation of immune system process (B), autophagy (C), and response to radiation (D). All p<0.01 and adjusted p<0.05. Abbreviation: GSEA, Gene Set Enrichment Analysis. |
Discussion
In this study, we successfully established a novel prognostic evaluation model by a new RNA-seq dataset of Chinese HCC patients, which exhibited reliable capacity in predicting the OS of HCC patients. Additionally, survival curves revealed that the HCC patients with high-risk score usually suffered from worse RFS than those with low-risk score, although the accuracy for predicting RFS of HCC patients is not satisfactory. However, we found that this model was suitable to predict early recurrence (within 2 years of resection). The tdAUC values were, respectively, 0.894 (95% CI=0.693–0.951) and 0.717 (95% CI=0.58–0.78) in the training and the validation cohorts (Figure 7), a similar level as a previous report,4 which further expanded the potential application scope of this model in the clinic.
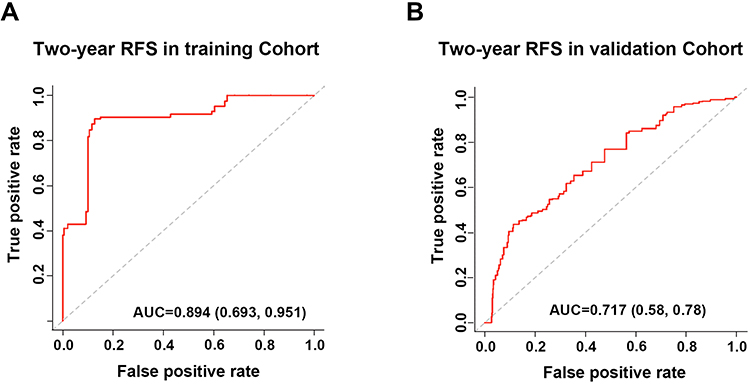 |
Figure 7 tdROC curves of the prognostic evaluation model in predicting 2-year RFS in the training and validation cohorts. (A) tdROC curve of 2-year RFS in the training cohort. (B) tdROC curve of 2-year RFS in the validation cohort. Abbreviations: AUC, area under curve; RFS, recurrence-free survival. |
Using computational methods, four significantly dysregulated lncRNAs (AC007639.1, AC126407.1, SLC7A11-AS1, RP11-439L8.3) and TNM staging were identified as prognosis-associated factors. It is well known that LncRNA is widely accepted as a type of cancer biomarker and plays extensive roles in regulating the formation and development of tumors in many cancer types.15–17 Furthermore, lncRNAs has already been utilized in the development of multiple models for pre-warning of some clinical events including recurrence,4 drug-resistance, 18 and survival.19 Therefore, it is no suprising that four lncRNAs, namely AC007639.1, AC126407.1, SLC7A11-AS1, RP11-439L8.3, were identified as prognostic biomarker candidates in this study. However, the in-deepth study on their biofunctions should be further explored in future.
In clinical practice, TNM staging is an essential parameter involved in developing treatment strategy and assessing the prognosis of HCC patients. To maximize the accuracy, we hence took all risk factors (including lncRNAs and clinical parameters) to establish the model. Our results demonstrated that the inclusion of TNM staging could promote the reliability and clinical significance of this model. Furthermore, our newly established model is also superior to the TNM staging alone (Supplementary Table S2) in predicting the prognosis of HCC patients.
Although our model has shown good performance in predicting OS and early recurrence of HCC patients, this prognostic evaluation is performed postoperatively, which make its prognosis prediction remains less ideally timely. The ideal diagnosis or prognostic assessment should be carried out before the patient receives any treatment in a non-invasive and non-interventional manner. However, the identification of biomarkers in tumor tissue could still greatly benefit the selection of potential candidates for a non-invasive strategy such as liquid biopsy. Indeed, integrating our results with other non-invasive methods could mean a further step into the future of clinical application.
Conclusions
In summary, a novel prognostic evaluation model developed by lncRNAs and clinical parameters provided a promising strategy to predict the OS and early recurrence of HCC patients with a relative higher accuracy. qPCR determination of these four lncRNAs combined with imaging examination (CT or MRI) could provide a simple and quick method for its clinical application. However, a further verification with an enlarged sample set in multiple centers is still required prior to clinical usage.
Data Sharing Statement
The analyzed data sets generated during the study are available from the corresponding author, Yingchao Wang.
Acknowledgments
We thank Biobank in Mengchao Hepatobiliary Hospital of Fujian Medical University for providing clinical specimens. We also thank all the participants for their involvement in the study.
Funding
This project was supported by the National Natural Science Foundation of China (Grant No. 81602102); the Medical innovation project of Fujian Province (Grant No. 2018-CX-35); the Natural Science Foundation of Fujian Province (Grant No. 2020J011164); the Scientific Foundation of Quanzhou City (Grant No. 2018Z133); and the Young and Middle-aged Talent Training Project of Fujian provincial health and Family Planning Commission (Grant No. 2018-ZQN-76).
Disclosure
The authors declare that they have no competing interests.
References
1. Bray F, Ferlay J, Soerjomataram I, Siegel RL, Torre LA, Jemal A. Global cancer statistics 2018: GLOBOCAN estimates of incidence and mortality worldwide for 36 cancers in 185 countries. CA Cancer J Clin. 2018;68(6):394–424. doi:10.3322/caac.21492
2. Tang A, Hallouch O, Chernyak V, Kamaya A, Sirlin CB. Epidemiology of hepatocellular carcinoma: target population for surveillance and diagnosis. Abdom Radiol (NY). 2018;43(1):13–25. doi:10.1007/s00261-017-1209-1
3. Yang JD, Hainaut P, Gores GJ, Amadou A, Plymoth A, Roberts LR. A global view of hepatocellular carcinoma: trends, risk, prevention and management. Nat Rev Gastroenterol Hepatol. 2019;16(10):589–604. doi:10.1038/s41575-019-0186-y
4. Chan AWH, Zhong J, Berhane S, et al. Development of pre and post-operative models to predict early recurrence of hepatocellular carcinoma after surgical resection. J Hepatol. 2018;69(6):1284–1293. doi:10.1016/j.jhep.2018.08.027
5. Li ZL, Han J, Liu K, et al. Association of family history with long-term prognosis in patients undergoing liver resection of HBV-related hepatocellular carcinoma. Hepatobiliary Surg Nutr. 2019;8(2):88–100. doi:10.21037/hbsn.2018.11.20
6. Torzilli G, Belghiti J, Kokudo N, et al. A snapshot of the effective indications and results of surgery for hepatocellular carcinoma in tertiary referral centers: is it adherent to the EASL/AASLD recommendations? An observational study of the HCC East-West study group. Ann Surg. 2013;257(5):929–937. doi:10.1097/SLA.0b013e31828329b8
7. Cucchetti A, Piscaglia F, Caturelli E, et al. Comparison of recurrence of hepatocellular carcinoma after resection in patients with cirrhosis to its occurrence in a surveilled cirrhotic population. Ann Surg Oncol. 2009;16(2):413–422. doi:10.1245/s10434-008-0232-4
8. Lersritwimanmaen P, Nimanong S. Hepatocellular carcinoma surveillance: benefit of serum alfa-fetoprotein in real-world practice. Euroasian J Hepatogastroenterol. 2018;8(1):83–87. doi:10.5005/jp-journals-10018-1268
9. Kanwal F, Singal AG. Surveillance for hepatocellular carcinoma: current best practice and future direction. Gastroenterology. 2019;157(1):54–64. doi:10.1053/j.gastro.2019.02.049
10. Amin MB, Greene FL, Edge SB, et al. The eighth edition AJCC cancer staging manual: continuing to build a bridge from a population-based to a more “personalized” approach to cancer staging. CA Cancer J Clin. 2017;67(2):93–99. doi:10.3322/caac.21388
11. Ke K, Chen G, Cai Z, et al. Evaluation and prediction of hepatocellular carcinoma prognosis based on molecular classification. Cancer Manag Res. 2018;10:5291–5302. doi:10.2147/CMAR.S178579
12. Shi YM, Li YY, Lin JY, Zheng L, Zhu YM, Huang J. The discovery of a novel eight-mRNA-lncRNA signature predicting survival of hepatocellular carcinoma patients. J Cell Biochem. 2018. doi:10.1002/jcb.28028
13. Fang SS, Guo JC, Zhang JH, et al. A P53-related microRNA model for predicting the prognosis of hepatocellular carcinoma patients. J Cell Physiol. 2020;235(4):3569–3578. doi:10.1002/jcp.29245
14. Feng RM, Zong YN, Cao SM, Xu RH. Current cancer situation in China: good or bad news from the 2018 global cancer statistics? Cancer Commun (Lond). 2019;39(1):22. doi:10.1186/s40880-019-0368-6
15. Zhao B, Ke K, Wang Y, et al. HIF-1alpha and HDAC1 mediated regulation of FAM99A-miR92a signaling contributes to hypoxia induced HCC metastasis. Signal Transduct Target Ther. 2020;5(1):118. doi:10.1038/s41392-020-00223-6
16. Lim LJ, Wong SYS, Huang F, et al. Roles and regulation of long noncoding RNAs in hepatocellular carcinoma. Cancer Res. 2019;79(20):5131–5139. doi:10.1158/0008-5472.CAN-19-0255
17. Wong CM, Tsang FH, Ng IO. Non-coding RNAs in hepatocellular carcinoma: molecular functions and pathological implications. Nat Rev Gastroenterol Hepatol. 2018;15(3):137–151. doi:10.1038/nrgastro.2017.169
18. Wang Y, Wang Z, Xu J, et al. Systematic identification of non-coding pharmacogenomic landscape in cancer. Nat Commun. 2018;9(1):3192. doi:10.1038/s41467-018-05495-9
19. Zhu X, Tian X, Yu C, et al. A long non-coding RNA signature to improve prognosis prediction of gastric cancer. Mol Cancer. 2016;15(1):60. doi:10.1186/s12943-016-0544-0
 © 2021 The Author(s). This work is published and licensed by Dove Medical Press Limited. The
full terms of this license are available at https://www.dovepress.com/terms
and incorporate the Creative Commons Attribution
- Non Commercial (unported, 3.0) License.
By accessing the work you hereby accept the Terms. Non-commercial uses of the work are permitted
without any further permission from Dove Medical Press Limited, provided the work is properly
attributed. For permission for commercial use of this work, please see paragraphs 4.2 and 5 of our Terms.
© 2021 The Author(s). This work is published and licensed by Dove Medical Press Limited. The
full terms of this license are available at https://www.dovepress.com/terms
and incorporate the Creative Commons Attribution
- Non Commercial (unported, 3.0) License.
By accessing the work you hereby accept the Terms. Non-commercial uses of the work are permitted
without any further permission from Dove Medical Press Limited, provided the work is properly
attributed. For permission for commercial use of this work, please see paragraphs 4.2 and 5 of our Terms.