Back to Journals » International Journal of General Medicine » Volume 14
Development of Potential Prognostic Biomarkers Based on DNA Methylation-Driven Genes for Patients with Endometrial Cancer
Authors Lu Y, Tang W, Wang X, Kang X, You J, Chen L
Received 18 November 2021
Accepted for publication 20 December 2021
Published 31 December 2021 Volume 2021:14 Pages 10541—10555
DOI https://doi.org/10.2147/IJGM.S341771
Checked for plagiarism Yes
Review by Single anonymous peer review
Peer reviewer comments 2
Editor who approved publication: Dr Scott Fraser
Yiling Lu,1,* Weichun Tang,2,3,* Xiaoyu Wang,1 Xinyi Kang,1 Jun You,1 Liping Chen1
1Department of Obstetrics and Gynecology, Nantong First People’s Hospital, Nantong, Jiangsu, 226001, People’s Republic of China; 2NHC Key Laboratory of Antibody Technique, Nanjing Medical University, Nanjing, Jiangsu, 211166, People’s Republic of China; 3Department of Gynecology and Obstetrics, The Second Affiliated Hospital of Nantong University, Nantong, Jiangsu, 226001, People’s Republic of China
*These authors contributed equally to this work
Correspondence: Liping Chen
Department of Gynecology and Obstetrics, Nantong First People’s Hospital, Nantong, Jiangsu, 226001, People’s Republic of China
Email [email protected]
Background: Endometrial cancer (EC) is a multifactorial disease, and its progression may be driven by abnormal genetic methylation. To clarify the underlying molecular mechanisms and sensitive biomarkers for EC, this study used an integrated bioinformatic analysis to explore the methylation-driven genes of EC.
Methods: The mRNA expression data, methylation data and corresponding clinical information of EC samples were downloaded from The Cancer Genome Atlas (TCGA) database. MethylMix algorithm was used to screen out methylation-driven genes in EC. Functional and pathway enrichment analysis and the protein–protein interaction (PPI) analysis were conducted to demonstrate the functions and interactions between these genes. Then, prognosis-related methylated genes were screened out by using univariate and multivariate Cox analyses, and a prognostic risk assessment model for EC was constructed. The methylation sites and expression profiles of candidate genes were further investigated.
Results: A total of 127 methylated genes were identified in EC. Four genes (RP11-968O1.5, DCAF12L1, MSX1 and ALS2CR11) were selected as candidate genes to construct a reliable prognostic risk model. The univariate and multivariate Cox proportional hazards regression analyses showed that the risk score based on four genes was an independent prognostic indicator for OS among EC patients. A nomogram was established and the calibration plot analysis indicated the good performance and clinical utility of the nomogram. In addition, the methylation and expression of MSX1 and DCAF12L1 were significantly associated with EC survival rate. The joint ROC analysis revealed that the AUC of DCAF12L1-MSX1 was 0.867, which suggested both have a good EC-diagnosing efficiency. We then coped DCAF12L1 and MSX1 with GESA analysis, finding both were mainly associated with the KRAS signaling pathway.
Conclusion: This bioinformatic study combs the methylated genes involved in EC development for the first time, finding that MSX1 and DCAF12L1 could serve as EC prognostic markers and drug targets.
Keywords: endometrial cancer, methylation-driven genes, integrated bioinformatic analysis, prognosis, biomarkers
Introduction
Endometrial cancer (EC) is a common and lethal gynecologic malignancy in the world, as evidenced by the 320,000 new cases and 72,000 deaths reported in 20121 (EC is histopathologically classified into two types. Type I EC, attacking more than 70% of all cases, has generally a low grade and association with unopposed estrogen exposure. Type II EC has a high grade and often develops into papillary serous or clear cell cancer highly prone to relapse and metastasize. The first-line treatment is surgery if the patient shows indicative histopathology (tumor type, grade and stage). Chemotherapy, targeted drugs and hormone therapy are also used to increase survival and decrease recurrence, radiation therapy is another option for patients surgically inoperable. The application of these drugs delayed the progress of the disease and prolonged the survival of patients to a certain extent.2 However, limited curative effect, serious toxic and side effects and easy to produce drug resistance led to poor prognosis of patients with advanced or recurrent EC, which is far from changing the current situation of EC treatment. With the deepening of the research on the molecular mechanism of EC, a series of new targets such as VEGF, PARP, PD-1/PD-L1 have been found, which brought hope to EC patients.3 For early-stage EC patients, initial primary surgical resection brings a good prognosis, the five-year survival rate up to 70%, but for advanced-stage patients, this rate falls to 20%.4 So, early diagnosis and management of EC as well as effective targeted drugs are necessary.
Malignancy is backed by complicate molecular mechanisms. DNA methylation is essential to the initiation and progression of malignancies.5 Current microarray and high-throughput sequencing technologies allow us to observe the expression and methylation levels of thousands of human genes simultaneously. Meanwhile, bioinformatic analysis offers an insight into the molecular mechanism of cancers on the whole genomic level. The Cancer Genome Atlas (TCGA) database (http://cancergenome.nih.gov/publications/ publication guide lines) is an open database that provides cancer genetic and epigenetic profiles. MethylMix, an algorithm in R, can be used to screen out specific methylation-driven genes based on a β-mixed model.6 In the present study, the mRNA expression and methylation data of EC patients were downloaded from the TCGA database, and the methylation-driven genes were extracted by using the MethylMix algorithm. On genome level, we explored the correlation between the oncogenesis and DNA aberrant methylation in EC by MethylMix algorithm for the first time. The two key methylation-driven genes in EC can be used for new target drugs.
Materials and Methods
Data Collection and Analysis
The mRNA expression data of 587 samples (552 EC samples and 35 normal samples), methylation data of 485 samples (439 EC samples and 46 normal samples), and all their corresponding clinical information were downloaded from the TCGA database. The mRNA expression data and methylation data were normalized and analyzed in LIMMA package to obtain differentially expressed and aberrantly methylated genes.7 Then, we calculated the correlation between gene expression and gene methylation level by using MethylMix algorithm in R. After constructing a β-mixed model, we identified differentially expressed genes (DEGs) in EC and the EC-specific methylation-driven genes.
Functional Annotations for Methylation-Driven Genes
The functional annotations and related pathways of identified EC-specific methylation-driven genes were investigated. Gene Ontology (GO) analysis of methylation-driven genes covered three aspects, including molecular function (MF), biological processes (BP) and cellular composition (CC) were analysed in Database for Annotation, Visualization and Integrated Discovery (DAVID) v6.8 (http://david.abcc.ncifc rf.gov/).8 The results of GO enrichment analysis were plotted in the GOplot R package (https://cran.r-project.org/web/packages/GOplot/).9 In addition, Kyoto Encyclopedia of Genes and Genomes (KEGG) pathway enrichment analysis was performed in ConsensusPathDB (http://cpdb.molgen.mpg.de) online software.10 The P-value <0.05 was set as the cutoff criterion in GO and KEGG analyses.
Construction of Protein–Protein Interaction (PPI) Network
To evaluate the interrelations between the products coded by these methylation-driven genes, these genes were uploaded to the Search Tool for the Retrieval of Interacting Genes (STRING) database (http://string-db.org/).11
Risk Assessment Model and Risk Scoring
To screen out candidate methylation-driven genes with EC prognostic value, we constructed a linear risk assessment model by univariate and multivariate Cox analyses.12 Firstly, the univariate Cox proportional hazards regression analysis was performed to investigate the overall-survival-associated driver genes. Those showing significant association were selected as candidate variables and then coped with multivariate Cox proportional hazards regression analysis. The prognostic index calculating formula was shown as follows:
Prognostic Index = expRNA1*βRNA1+expRNA2*βRNA2+expRNA3*βRNA3+ … expRNAn*βRNAn (expRNA was the expression level of each gene, and βRNA was the regression coefficient calculated by the multivariate Cox regression analysis).
According to the median prognostic value, EC samples were divided into high- and low-risk groups, and the overall survival rates of the low-risk group and high-risk group were calculated by Kaplan–Meier curve analysis in Survival R package, with the log-rank P < 0.05 was considered statistically significant. In addition, a time-dependent receiver operating characteristic (ROC) curve was plotted to estimate the predictive efficiency of the prognosis risk assessment model. Few expression profiling, sequencing, or array data have been published for different prognostic outcomes with EC. Therefore, according to the different expression levels of various subtypes, we identified data with different clinical subtypes to verify the key genes.
Survival Analysis and Mapping of Methylation Sites of Candidate Driver Genes
To identify key prognosis-associated genes in EC, the methylation level and methylation-expression levels of candidate driver genes in the risk assessment model were further analyzed via Survival R package. Moreover, we extracted relevant methylation sites of key genes from the downloaded EC methylation data. The correlation between the methylation and expression was determined, using |Cor| >0.35 as a cutoff criterion. Then, a joint time-dependent ROC curve was plotted to validate the predictive power of these candidate methylation-driven genes. Gene set enrichment analysis (GSEA) was introduced. In TCGA set validation, 546 EC samples were divided into two groups according to the median expression level of the candidate driver genes. To identify the potential function of these genes, GSEA (http://software.broadinstitute.org/gsea/index.jsp) was employed to determine the differentially expressed gene between the two groups.13 Annotated gene sets of HALLMARK in Molecular Signatures Database (MSigDB, http://software.broadinstitute.org/gsea/msigdb/index.jsp) were chosen as the reference.14 The P-value <0.05 was set as the cutoff criterion. “joyplot” and “dotplot” functions in “Cytoscape” software were used to visualize the distribution.
Building the Nomogram
A nomogram and calibration curve was built by the “rms” package on R. The correctness was examined to check the consistency index between actual observation frequency and predicted probability. Then, we presented the predicted and observed results in the calibration curve to visualize the performance of the nomogram.
Results
Data of Methylation‑Driven Genes
The gene expression data of 587 samples (552 EC samples and 35 normal samples) and the methylation data of 485 samples (439 EC samples and 46 normal samples) extracted from TCGA database were put in the LIMMA software package. As a result, 127 methylation-driven genes of EC were screened out (|log Fold change (FC)| >0, adjusted-P < 0.05, |Cor| >0.45). The heatmaps of these aberrant methylation-driven genes are shown in Figure 1.
 |
Figure 1 Heatmaps of EC-related aberrant methylation-driven genes. (The color from green to red shows a progression from hypomethylation to hypermethylation). |
Biofunctions of Driver Genes
As to the 127 identified driver genes, the results of GO analysis showed that those in BP group were mainly involved in “Regulation of transcription, DNA-templated and Transcription, DNA-templated”; those in MF group in “Transcription factor activity, sequence-specific DNA binding, Metal ion binding, Nucleic acid binding and DNA binding”; those in CC group in “Intracellular” (Figure 2). The KEGG Pathway analysis revealed that these 127 methylation-driven genes were mainly enriched in “Generic Transcription Pathway, Gene expression (Transcription), RNA Polymerase II Transcription” (Figure 3).
 |
Figure 2 Results of GO enrichment analysis of 144 methylation-driven genes. (A) GO analysis divided methylation-driven genes into three functional groups: MF, BP, and CC; (B) GO enrichment significance items of methylation-driven genes in different functional groups; (C) distribution of methylation-driven genes for different GO-enriched functions. |
 |
Figure 3 The significant enriched pathways of methylation-driven gene. Notes: Node size: the number of genes; node color: P-value; edge width: percentage of shared genes; Edge color: genes from input. |
PPI Network of Methylation-Driven Genes
The PPI network obtained from STRING is shown in Supporting Figure 1. A total of 101 nodes and 21 edges formed in the network of 127 methylation driver genes.
Prognosis-Related Genes Pinpointed by Risk Assessment Model
By performing univariate and multivariate Cox regression analyses, we screened out prognosis-related methylation-driven genes of EC and constructed a linear risk assessment model (Supporting Table 1). As a result, the top ten significant genes (MSX1, ERMN, RP11-968O1.5, DCAF12L1, ALS2CR11, PDCL2, AQP5, SIT1, ZNF354C, RPS6KA6 and RP11-760D2.5) were screened out in the univariate Cox proportional hazards regression analysis. These genes were further coped with multivariate Cox proportional hazards regression analysis, and four genes (RP11-968O1.5, DCAF12L1, MSX1 and ALS2CR11) were identified as candidate prognosis-related genes in EC. Next, the risk assessment model was constructed using each of the four candidate genes as an independent indicator. The prognostic index = (0.162*RP11-968O1.5)+ (0.074*DCAF12L1) + (−0.104*MSX1) + (0.085*ALS2CR11) (Supporting Figure 2). According to the median prognostic value, expression data of 534 EC samples and their corresponding clinical information were divided into a high-risk group contained 267 samples and a low-risk group contained 267 samples, respectively. The results of Kaplan–Meier survival curve analysis showed that the overall survival rate of the high-risk group was significantly lower than that in the low-risk group (Figure 4A). The five-year overall survival ROC curve showed the area under curve (AUC) of the four-gene prognostic risk assessment model was 0.719 (Figure 4B), suggestive of its predictive power for the five-year overall survival of EC patients. The distribution of risk score, survival status, and the expression levels of four genes in each patient were also analyzed (Figure 4C-E). In addition, we analyzed the relationship between the clinical parameters of each patient and the risk score of the four genes. The univariate and multivariate Cox proportional hazards regression showed that the age, tumor status and risk score were independent prognostic indicators of EC (Supporting Figure 3). The heatmap showed the expression levels of the four genes in high- and low-risk groups based on the TCGA dataset. We observed significant between-group differences in tumor status, grade, histological type, age and stage (P < 0.001) (Supporting Figure 4).
 |
Figure 4 A linear risk model based on four candidate methylation-driven genes. (A) Kaplan–Meier survival curve of overall survival between high‐risk group and low‐risk group; (B) five-year survival time dependent ROC curve; (C–E) the distributions of the four-gene signature, survival status, and expression profiles of the four genes of patients in the training data set. |
Key Genes in Different Subtypes
There was a significant difference in the expression of the key genes in different subtypes based on TCGA data, using one-way analysis of variance (ANOVA). Among the 4 grade subtypes, MSX1 had the highest expression level compared with the RP11-968O1.5, DCAF12L1, ALS2CR11 (Figure 5A). The consistent trend was displayed in 4 different stage subtypes and 3 different histological type subtypes (Figure 5B and C).
 |
Figure 5 Expression levels of Candidate biomarkers in different subtypes. (A) in different grade subtypes; (B) in different stage subtypes; (C) in different histological type subtypes. **P < 0.01, ***P < 0.001, ns, not significant. |
Stratification Analysis of Hub Genes and Clinical Features
The stratification analysis was performed according to histological type, grade, age, tumor status and stage. Patients were stratified into endometrioid subgroups, grade G3&G4 subgroup, stage I & stage II subgroup, stage III & stage IV subgroup, with tumor and tumor-free subgroup, age >60 subgroup and age ≤60 subgroup. For the patients in endometrioid subgroup, the survival time of patients in the high-risk group was significantly shorter than that of patients in the low-risk group (Figure 6A), consistent with the trends for the mix and serous subgroups, the grade G3&G4 subgroup, stage I & stage II subgroup, stage III & stage IV subgroup, with tumor subgroup, age >60 subgroup and age ≤60 subgroup (Figure 6B-H).
 |
Figure 6 Survival time of patients in high-risk and low-risk group of different subgroups. (A) Endometrioid subgroup, (B) mix and serous subgroup, (C) grade G3&G4 subgroup, (D) stage I & stage II subgroup stage, (E) stage III & stage IV subgroup, (F) with tumor subgroup, (G) age >60 subgroup, (H) age ≤60 subgroup. |
Building Predictive Nomogram
To achieve the goal of establishing a clinical method to predict the survival probability with EC patients, a nomogram was created using TCGA cohort so as to assess the probability of the 1-, 3‐ and 5‐year OS. The predictors of the nomogram contained 6 independent prognostic factors including stage, age, histological type, grade, tumor status and risk score (Figure 7A). The 45° line represented the best prediction. Calibration plots suggested that the nomogram performed well (Figure 7B). ROC curve analysis showed that the risk score AUC value of the 1-, 3‐ and 5‐year model was 0.632, 0.650 and 0.655. The clinical factors AUC value of the 1-, 3‐ and 5‐year model was 0.603, 0.651 and 0.640. Combining risk score and clinical factors, the AUC value of the 1-, 3‐ and 5‐year model was 0.628, 0.685, and 0.674 (Figure 7C).
 |
Figure 7 The nomogram to predict 1-, 3‐ or 5‐year OS and prognostic value of hub genes. (A) The nomogram for predicting proportion of patients with 1-, 3‐ or 5‐year OS. (B) The calibration plots for predicting patient 1-, 3‐ or 5‐ year OS. Nomogram‐predicted probability of survival is plotted on the x‐axis; actual survival is plotted on the y‐axis. (C) 1-, 3‐ or 5‐ year ROC curve analysis of the hub genes according to risk score and clinical factors. |
Reciprocity Between Methylation and Expression of Driver Genes
Kaplan–Meier survival analysis further illustrated that the methylation levels and joint methylation-expression levels of DCAF12L1 and MSX1 were associated with the overall survival rate of EC patients. Hypermethylated (or hypermethylated and lowly expressed) DCAF12L1 linked with a higher survival rate, and hypomethylated (or hypomethylated and highly expressed) MSX1 linked with a higher survival rate (Figure 8). In addition, the methylated sites and the gene expression of DCAF12L1 and MSX1 are shown in Figure 9. According to the results of five-year dependent ROC analysis, the AUC of DCAF12L1 and MSX1 was 0.704 and 0.73, respectively. The joint ROC analysis revealed the AUC of DCAF12L1-MSX1 was 0.867, which suggested both have a good EC-diagnosing efficiency (Figure 10A). We then coped DCAF12L1 and MSX1 with GESA analysis (Figure 10B), finding both were mainly associated with the KRAS signaling pathway.
 |
Figure 8 The survival analysis of candidate methylation-driven genes. (A) The survival analysis of gene DCAF12L1 methylation; (B) the combination of gene DCAF12L1 methylation and expression; (C) the survival analysis of gene MSX1 methylation; (D) the combination of gene MSX1 methylation and expression. |
 |
Figure 9 (A–G) The correlation of methylation sites and gene DCAF12L1 expression; (H–M) the correlation of methylation sites and gene MSX1 expression. |
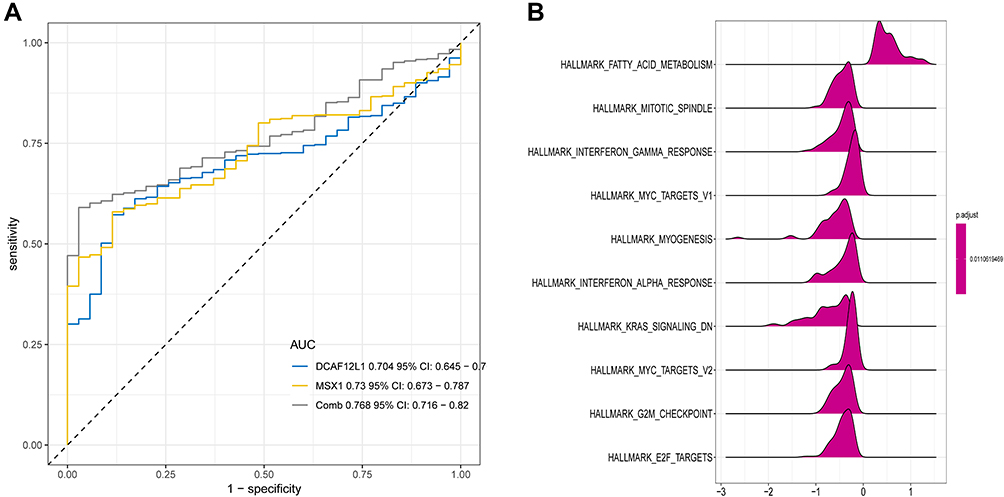 |
Figure 10 (A) The joint ROC analysis revealed the AUC of DCAF12L1-MSX1; (B) the GSEA analysis of genes DCAF12L1 and MSX1. |
Discussion
Cancer is a product of multiple factors, such as somatic, genetic, epigenetic, and endocrine aberrations. It has been proved that DNA methylation can alter gene expression in various diseases, including malignancies (Kulis and Esteller 2010). Thus, the abnormal methylation in cancer-associated genes has been investigated for teasing out sensitive biomarkers and effective therapeutic targets of cancers.15,16 In the present study, we identified 127 methylation-driven genes possibly regulating the initiation and development of EC. GO analysis showed the top three enriched terms were “Regulation of transcription, DNA-templated, Transcription factor activity, sequence-specific DNA binding, and Transcription, DNA-templated”, suggesting that these driver genes may be key components in the transcription associated process and function. The abnormal methylation and expression levels of these genes can dysregulate transcription of oncogenes or anti-oncogenes. Moreover, GO analysis also revealed that these driver genes were enriched in terms “Metal ion binding, Nucleic acid binding and DNA binding” in MF group, indicating that products coded by these genes might associate with the function of metal ion, nucleic acid and DNA binding, which can provoke mutations and may lead to cancer reversibly (eg, conformational changes) or irreversibly (eg, cleavage).17 As the results of KEGG pathways showed, the genes were mainly enriched in “Generic transcription pathway, Gene expression (Transcription) and RNA polymerase II transcription” pathways. These findings indicated that most of these driver genes might play in EC-associated as gene regulators, such as the transcription factors and cofactors. The mutations and epigenetic modification of these regulators can trigger tumorigenesis.18 In addition, the PPI network also verified the interactions between these driver genes.
Our univariate and multivariate Cox analyses identified four candidate methylation-driven genes (RP11-968O1.5, DCAF12L1, MSX1 and ALS2CR11) that were used to construct an EC-prognostic risk assessment model. The EC samples were divided into high-risk and low-risk groups based on the prognostic values calculated by this model. Survival analysis showed significant difference in overall survival rate between the two groups. The AUC of five-year overall survival ROC of these four driver genes was 0.719. These findings suggest that the four-gene risk prognosis model can predict the overall survival rate of EC patients. However, further studies are needed to validate the efficiency of this risk model in clinical applications.
We found that the methylation levels and joint methylation-expression levels of DCAF12L1 and MSX1 were associated with the prognosis. Patients with hypermethylated DCAF12L1, or hypermethylated and lowly expressed DCAF12L1, displayed a higher survival rate. This finding suggests that DCAF12L1 can act as a tumor suppressor in EC, and the hypermethylation and down-regulation of this gene may suppress tumorigenesis of EC. DCAF12L1, also known as KIAA1892L or WDR40B, is a member of Ddb1- and Cul4-associated factors (DCAFs). DCAFs can regulate DNA replication in cell cycle.19 Meanwhile, we found patients with hypomethylated (or hypomethylated and highly expressed) MSX1 showed worse prognosis, indicating that gene MSX1 can play as a tumor promoter, and raising the methylation and expression of MSX1 may curb the tumor development. MSX1 has been widely considered as a tumor suppressor. Tao et al found that MSX1 suppressed glioblastoma cell migration and invasion by inhibiting the Wnt/β-catenin signaling pathway.19,20 Yue et al demonstrated that methylation of MSX1 promoter down-regulated MSX1 expression, triggering oncogenesis by mediating Notch signaling in cervical cancer cell lines.21 However, up to date, the expressions and functions of two genes in EC have not been validated. Our study suggests that the two genes can serve as diagnostic or prognostic biomarkers and potential therapeutic targets for EC.
Meanwhile, the ROC curve analysis further validated that DCAF12L1 and MSX1 were independent prognosis-related genes, and their combination showed a higher prognostic value. The GSEA analysis found that KRAS signaling pathway was significantly activated in high-expressed groups KRAS is a RAS protein that can activate RAF family by binding to GTP to promote cell proliferation.22 Thus, mutation, overexpression and amplification of RAS proteins are key steps in the development of cancer. RAS mutation appears in around 20% of human tumors, most frequently in KRAS (85%).23
Conclusion
In conclusion, four candidate methylation-driven genes (RP11-968O1.5, DCAF12L1, MSX1 and ALS2CR11) were identified as EC-prognosis-related. DCAF12L1 and MSX1 can serve as EC prognostic markers and drug targets. However, their role in EC development should be clarified with future experimental evidences.
Abbreviations
TCGA, The Cancer Genome Atlas; GO, Gene Ontology; MF, molecular function; BP, biological processes; CC, cellular composition.; EC, endometrial cancer; ROC, receiver operating characteristic; HR, hazard ratio; CI, confidence interval; AUC, area under curve; GSEA, gene set enrichment analysis.
Data Sharing Statement
All data generated or analysed during this study are available in the TCGA (https://portal.gdc.cancer.gov).
Ethics Approval and Consent to Participate
TCGA belong to public databases. The patients involved in the database have obtained ethical approval. Users can download relevant data for free for research and publish relevant articles. Our study is based on open source data, so there are no ethical issues and other conflicts of interest. The need for further ethics approval was waived by The Nantong First People’s Hospital.
Consent for Publication
All members agree to the publication of this manuscript.
Author Contributions
YL.L. and LP.C. conceived of the presented idea. WC.T carried out the analysis.XY.W and XY.K. contributed to data collection. J.Y. assisted with all the statistical analysis. YL.L. and WC.T. wrote the manuscript in consultation with LP.C. All authors made a significant contribution to the work reported, whether that is in the conception, study design, execution, acquisition of data, analysis and interpretation, or in all these areas; took part in drafting, revising or critically reviewing the article; gave final approval of the version to be published; have agreed on the journal to which the article has been submitted; and agree to be accountable for all aspects of the work.
Funding
Nantong Municipal Health Commission General Program B (Grant No:MB2021017). The Research project of Jiangsu Provincial Health Committee (Grant No:F202037). The Research project of Jiangsu Maternal and child Health Care Association (Grant No:FYX202029). The Research project of Nantong Health Committee (Grant No:QA2020003).
Disclosure
The authors declare that they have no competing interests.
References
1. Ferlay J, Soerjomataram I, Dikshit R, et al. Cancer incidence and mortality worldwide: sources, methods and major patterns in GLOBOCAN 2012. Int J Cancer. 2015;136(5):E359–386. doi:10.1002/ijc.29210
2. Colombo N, Creutzberg C, Amant F, et al. ESMO-ESGO-ESTRO Consensus Conference on Endometrial Cancer: diagnosis, treatment and follow-up. Ann Oncol. 2016;27(1):16–41. doi:10.1093/annonc/mdv484
3. Oaknin A, Tinker AV, Gilbert L, et al. Clinical activity and safety of the anti-programmed death 1 monoclonal antibody dostarlimab for patients with recurrent or advanced mismatch repair-deficient endometrial cancer: a nonrandomized Phase 1 clinical trial. JAMA Oncol. 2020;6(11):1766–1772. doi:10.1001/jamaoncol.2020.4515
4. Eritja N, Yeramian A, Chen BJ, et al. Endometrial carcinoma: specific targeted pathways. Adv Exp Med Biol. 2017;943:149–207. doi:10.1007/978-3-319-43139-0_6
5. Van Tongelen A, Loriot A, De Smet C. Oncogenic roles of DNA hypomethylation through the activation of cancer-germline genes. Cancer Lett. 2017;396:130–137. doi:10.1016/j.canlet.2017.03.029
6. Gevaert O. MethylMix: an R package for identifying DNA methylation-driven genes. Bioinformatics (Oxford, England). 2015;31(11):1839–1841. doi:10.1093/bioinformatics/btv020
7. Ritchie ME, Phipson B, Wu D, et al. limma powers differential expression analyses for RNA-sequencing and microarray studies. Nucleic Acids Res. 2015;43(7):e47. doi:10.1093/nar/gkv007
8. Huang DW, Sherman BT, Tan Q, et al. DAVID Bioinformatics Resources: expanded annotation database and novel algorithms to better extract biology from large gene lists. Nucleic Acids Res. 2007;35(Web Server issue):W169–175. doi:10.1093/nar/gkm415
9. Walter W, Sánchez-Cabo F, Ricote M. GOplot: an R package for visually combining expression data with functional analysis. Bioinformatics (Oxford, England). 2015;31(17):2912–2914. doi:10.1093/bioinformatics/btv300
10. Kamburov A, Pentchev K, Galicka H, Wierling C, Lehrach H, Herwig R. ConsensusPathDB: toward a more complete picture of cell biology. Nucleic Acids Res. 2011;39(Database issue):D712–717. doi:10.1093/nar/gkq1156
11. Szklarczyk D, Morris JH, Cook H, et al. The STRING database in 2017: quality-controlled protein-protein association networks, made broadly accessible. Nucleic Acids Res. 2017;45(D1):D362–d368. doi:10.1093/nar/gkw937
12. Pan Y, Song Y, Cheng L, Xu H, Liu J. Analysis of methylation-driven genes for predicting the prognosis of patients with head and neck squamous cell carcinoma. J Cell Biochem. 2019;120(12):19482–19495. doi:10.1002/jcb.29252
13. Subramanian A, Tamayo P, Mootha VK, et al. Gene set enrichment analysis: a knowledge-based approach for interpreting genome-wide expression profiles. Proc Natl Acad Sci U S A. 2005;102(43):15545–15550. doi:10.1073/pnas.0506580102
14. Liberzon A, Birger C, Thorvaldsdóttir H, Ghandi M, Mesirov JP, Tamayo P. The Molecular Signatures Database (MSigDB) hallmark gene set collection. Cell Syst. 2015;1(6):417–425. doi:10.1016/j.cels.2015.12.004
15. Micevic G, Theodosakis N, Bosenberg M. Aberrant DNA methylation in melanoma: biomarker and therapeutic opportunities. Clin Epigenetics. 2017;9:34. doi:10.1186/s13148-017-0332-8
16. Pan Y, Liu G, Zhou F, Su B, Li Y. DNA methylation profiles in cancer diagnosis and therapeutics. Clin Exp Med. 2018;18(1):1–14. doi:10.1007/s10238-017-0467-0
17. Turel I, Kljun J. Interactions of metal ions with DNA, its constituents and derivatives, which may be relevant for anticancer research. Curr Top Med Chem. 2011;11(21):2661–2687. doi:10.2174/156802611798040787
18. Lee TI, Young RA. Transcriptional regulation and its misregulation in disease. Cell. 2013;152(6):1237–1251. doi:10.1016/j.cell.2013.02.014
19. Jin J, Arias EE, Chen J, Harper JW, Walter JC. A family of diverse Cul4-Ddb1-interacting proteins includes Cdt2, which is required for S phase destruction of the replication factor Cdt1. Mol Cell. 2006;23(5):709–721. doi:10.1016/j.molcel.2006.08.010
20. Tao H, Guo L, Chen L, et al. MSX1 inhibits cell migration and invasion through regulating the Wnt/β-catenin pathway in glioblastoma. Tumour Biol. 2016;37(1):1097–1104. doi:10.1007/s13277-015-3892-2
21. Yue Y, Zhou K, Li J, Jiang S, Li C, Men H. MSX1 induces G0/G1 arrest and apoptosis by suppressing Notch signaling and is frequently methylated in cervical cancer. Onco Targets Ther. 2018;11:4769–4780. doi:10.2147/OTT.S165144
22. Cicenas J, Tamosaitis L, Kvederaviciute K, et al. NRAS and BRAF mutations in colorectal cancer and melanoma. Med Oncol. 2017;34(2):26. doi:10.1007/s12032-016-0879-9
23. Davies H, Bignell GR, Cox C, et al. Mutations of the BRAF gene in human cancer. Nature. 2002;417(6892):949–954. doi:10.1038/nature00766
 © 2021 The Author(s). This work is published and licensed by Dove Medical Press Limited. The
full terms of this license are available at https://www.dovepress.com/terms
and incorporate the Creative Commons Attribution
- Non Commercial (unported, 3.0) License.
By accessing the work you hereby accept the Terms. Non-commercial uses of the work are permitted
without any further permission from Dove Medical Press Limited, provided the work is properly
attributed. For permission for commercial use of this work, please see paragraphs 4.2 and 5 of our Terms.
© 2021 The Author(s). This work is published and licensed by Dove Medical Press Limited. The
full terms of this license are available at https://www.dovepress.com/terms
and incorporate the Creative Commons Attribution
- Non Commercial (unported, 3.0) License.
By accessing the work you hereby accept the Terms. Non-commercial uses of the work are permitted
without any further permission from Dove Medical Press Limited, provided the work is properly
attributed. For permission for commercial use of this work, please see paragraphs 4.2 and 5 of our Terms.