Back to Journals » Journal of Inflammation Research » Volume 16
Development of Nomogram Models Based on Peripheral Blood Score and Clinicopathological Parameters to Predict Preoperative Advanced Stage and Prognosis for Epithelial Ovarian Cancer Patients
Authors Bai G, Zhou Y, Rong Q, Qiao S, Mao H, Liu P ![]()
Received 14 December 2022
Accepted for publication 2 March 2023
Published 23 March 2023 Volume 2023:16 Pages 1227—1241
DOI https://doi.org/10.2147/JIR.S401451
Checked for plagiarism Yes
Review by Single anonymous peer review
Peer reviewer comments 2
Editor who approved publication: Professor Ning Quan
Gaigai Bai,1,2 Yue Zhou,1,2 Qing Rong,1,2 Sijing Qiao,1,2 Hongluan Mao,1,2,* Peishu Liu1,2,*
1Department of Obstetrics and Gynecology, Qilu Hospital of Shandong University, Jinan, People’s Republic of China; 2Shandong Engineering Laboratory for Urogynecology, Qilu Hospital of Shandong University, Jinan, People’s Republic of China
*These authors contributed equally to this work
Correspondence: Hongluan Mao; Peishu Liu, Department of Obstetrics and Gynecology, Qilu Hospital of Shandong University, 107 Wenhua Xi Road, Jinan, Shandong, People’s Republic of China, Tel +86-18560081988 ; +86-18560082027, Email [email protected]; [email protected]
Purpose: Nutritional and inflammatory states are crucial in cancer development. The purpose of this study is to construct a scoring system grounded on peripheral blood parameters associated with nutrition and inflammation and explore its value in stage, overall survival (OS), and progression-free survival (PFS) prediction for epithelial ovarian cancer (EOC) patients.
Patients and Methods: Four hundred and fifty-three EOC patients were retrospectively identified and their clinical data and relevant peripheral blood parameters were collected. The ratio of neutrophil to lymphocyte, lymphocyte to monocyte, fibrinogen to lymphocyte, total cholesterol to lymphocyte and albumin level were calculated and dichotomized. A scoring system named peripheral blood score (PBS) was constructed. Univariate and multivariate Logistic or Cox regression analyses were used to select independent factors; these factors were then used to develop nomogram models of advanced stage and OS, PFS, respectively. The internal validation and DCA analysis were performed to evaluate models.
Results: Lower PBS indicated a better prognosis and higher PBS indicated inferior. High PBS is associated with advanced stage, high CA125, serous histological type, poor differentiation, and accompanied ascites. The logistic regression showed age, CA125, and PBS were independent factors for the FIGO III–IV stage. The nomogram models for advanced FIGO stage based on these factors showed good efficiency. FIGO stage, residual disease, and PBS were independent factors affecting OS and PFS, the nomogram models composed of these factors had good performance. DCA curves revealed the models augmented net benefits.
Conclusion: PBS can be a noninvasive biomarker for EOC patients’ prognosis. The related nomogram models could be powerful, cost-effective tools to provide information of advanced stage, OS, and PFS for EOC patients.
Keywords: inflammation, nutrition, ovarian cancer, predict model, peripheral blood
Introduction
The second most common cause of gynecologic cancer death is ovarian cancer with a survival rate 47% five years after diagnosis.1 Each year, there are 239,000 new diagnosed ovarian cancer patients and 152,000 death cases reported.2 About 90% of ovarian cancers are epithelial ovarian cancers (EOC).3 The early stage of the EOC has a relatively better prognosis of 5 years overall survival rate 61–87%, while for the advanced stage is 14–38%.4 Lack of early, specific signs and effective screening methods leads to a diagnostic delay and further worse prognosis. Unfortunately, over 75% of EOC patients are diagnosed at advanced stage. Therefore, predictive methods of advanced stage and prognosis are needed to help making an appropriate treatment plan.
Chronic inflammation is a significant part of cancer development.5 The assessment of patients’ systemic inflammatory response can be achieved by relevant indicators in peripheral blood. Nutritional status is also a factor associated with postoperative complications and cancer prognosis.6–8 The levels of albumin and total cholesterol can be used to evaluate the nutritional status of body, studies showed they are related to postoperative complications and prognosis.6,9 Some inflammation and nutrition related scoring systems such as Onodera’s prognostic nutritional index (ONI), lymphocyte-to-monocyte ratio (LMR), systemic inflammation score (SIS), systemic immune-inflammation index (SII), neutrophil-to-lymphocyte ratio (NLR), and COUNT have been proved had clinical significance in gynecological cancer.9–16 Furthermore, a meta-analysis showed the level of fibrinogen is a prognostic predictor with better performance than the level of CA125, NLR and the ratio of platelet to lymphocyte, elevated levels of fibrinogen may be related to unfavorable prognosis.13 Although the inflammatory and nutritional markers are economical and available in clinical practice, the wide use of them is limited by inconsistent cutoff values, relatively low prediction accuracy, and small, weak studies. Few studies have built clinical nomogram models that use clinicopathological factors and peripheral blood parameters to predict EOC prognosis. The models based on clinicopathological factors are common and available for individuals. With the development of sequencing technology and precision medicine, predict models based on molecule or genomic sequence has been well established, but they are not convenient for every patient. Most people can only afford routine treatment and get general data. These all provide insights into constructing a new scoring system with peripheral blood parameters and further exploring its clinical significance.
Good staging methods, and predictive methods of prognosis can help doctors and patients have a better understanding of disease and choose appropriate therapeutic plans. Therefore, we first created a more practical scoring system consisting of peripheral blood parameters. Then, based on the system, we developed nomogram models to predict the patients’ advanced stage before surgery, overall survival (OS) and progression-free survival (PFS) after primary surgery.
Materials and Methods
Patients Selection
It is a single-center retrospective study. We screened patients who were diagnosed with ovarian cancer and underwent primary surgery at Qilu Hospital from January 2014 to December 2018. Patients in these cases were excluded: non-epithelial, recurrent or metastatic ovarian cancer, neoadjuvant chemotherapy, infectious disease 15 days before surgery, malignant disease of other system, disease affecting immune or nutritional status such as hepatitis, systemic lupus erythematosus and so on. Patients in pregnancy or lactation, and underwent secondary surgery or only exploratory surgery were also excluded. Without loss of generality, those without complete clinical data or following-up data were excluded.
Data Collection
We got patients’ clinical information such as age, menopausal state, pathological pattern, histological grade, Federation International of Gynecology and Obstetrics (FIGO) stage, chemotherapy, and comorbidities from electronic medical records. Laboratory examinations including routine blood tests, CA-125 (U/mL), serum albumin (g/L), and plasma total cholesterol (mmol/L) and fibrinogen (g/L) levels of patients were obtained within 15 days before surgery.
The following formulas were used to calculate Onodera’s prognostic nutritional index (ONI), neutrophil-to-lymphocyte ratio (NLR), total cholesterol-to-lymphocyte ratio (TCLR), lymphocyte-to-monocyte ratio (LMR), and fibrinogen-to-lymphocyte ratio (FLR):
ONI = 10× serum albumin (g/dL) + 0.005 × total lymphocyte number (/μL);
NLR = neutrophil number (109/L)/lymphocyte number (109/L);
TCLR = total cholesterol (mmol/L)/lymphocyte number (109/L);
LMR = lymphocyte number (109/L)/monocyte number (109/L);
FLR = fibrinogen (g/L)/lymphocyte number (109/L);
The calculation of the systemic immune-inflammation index (SII), systemic inflammation score (SIS), and COUNT score were described in previous researches.12,17,18
Follow-Up
These patients were followed up every year after surgery until death or May 31, 2021, whichever came first. The endpoints of this study were OS and PFS. OS and PFS were the time distance from surgery to death/the final follow-up and from surgery to disease progression/the final follow-up, respectively.
Statistical Analysis
The continuous variables of the normal distribution and non-normal distribution are presented as means±SD and medians plus interquartile, respectively. Categorical variables are presented as absolute counts and percentages. We use Fisher’s exact test/Chi-square and Kruskal–Wallis test to handle categorical and continuous variables, respectively.
The optimal cutoff points of ALB, NLR, LMR, FLR, and TCLR were calculated based on OS with the R package “survminer”. Then the obtained cutoff values were used to dichotomize patients into two groups (high and low). We developed a scoring system named peripheral blood score (PBS) based on these five parameters: For each parameter, patient with a better prognosis gets 0 point, and patient with a worse prognosis gets 1 point. Then, add them up to get a total score. The survival outcomes were delineated by Kaplan–Meier curves, and Log rank test was used to compare the differences between the two groups, respectively. We created time-dependent receiver operating characteristic (ROC) curves and calculated the areas under the curve (AUC) to compare the discriminatory ability among the scoring systems.
We used univariate and multivariate binary logistic regression analyses to select associated factors of the FIGO III–IV stage. The independent factors were used to construct a nomogram model via “rms” package and internal validation was conducted. To demonstrate the consistency between observed probabilities and predicted probabilities, we delineated calibration plots performed with bootstrapping (1000 resamples). The P value of Hosmer-Lemeshow test >0.05 indicated good consistency. Then we plotted ROC curve with “pROC” package to assess the predictive accuracy. To evaluate the clinical practicality, we performed decision curve analysis (DCA) with the “ggDCA” package.
Univariate and multivariate Cox proportional hazards regression was used to select independent factors of OS and PFS. A LASSO regression was used to reduce data dimensionality and select variables, accompanied by 10 rounds of cross-validation. The selected variables were used to construct the nomograms via the “rms” R package. Then the models’ performance was assessed by internal validation. The AUC of ROC curves and concordance index (C-index) curves were performed to assess the prognostic accuracy. Calibration plots for 1, 3, 5 years after surgery were performed with bootstrapping (1000 bootstrap resamples). C‐index was used to assess the models’ discrimination, and it was calculated with 1000 bootstrapping techniques. DCA was conducted to assess the clinical benefit of models. The R package “glmnet”, “survival”, “survivalROC” and “ggDCA” were used to analyze the related dataset.
Note. SPSS 21.0 (IBM Corporation, Armonk, NY, USA) and R (version 4.2.0) were used to analyze the data.
Results
Patients Characteristics
Table 1 summarizes the clinical characteristics of 453 EOC patients. They were 54.66±11.46 years old in average and 209 (46.1%) patients were postmenopausal. Most of them had serous ovarian cancer (75.5%) and poor differentiation (74.8%). The FIGO stage of patients was stage I–II in 137 (30.2%) cases, stage III–IV in 316 (69.8%) cases; 401 (88.5%) were known to have undergone chemotherapy. Two hundred and seventy-nine (61.6%) patients had residual disease <1cm while 174 (38.4%) had residual disease ≥1cm. Nearly half of the patients had CA125 levels ≥500 (U/mL), and 285 (62.9%) patients had ascites. Among the included 453 patients, 162 (35.8%) patients were classified into PBS group 0 (PBS 0 or 1), 216 (47.7%) into group 1 (PBS 2 or 3), and 75 (16.5%) into group 2 (PBS 4 or 5).
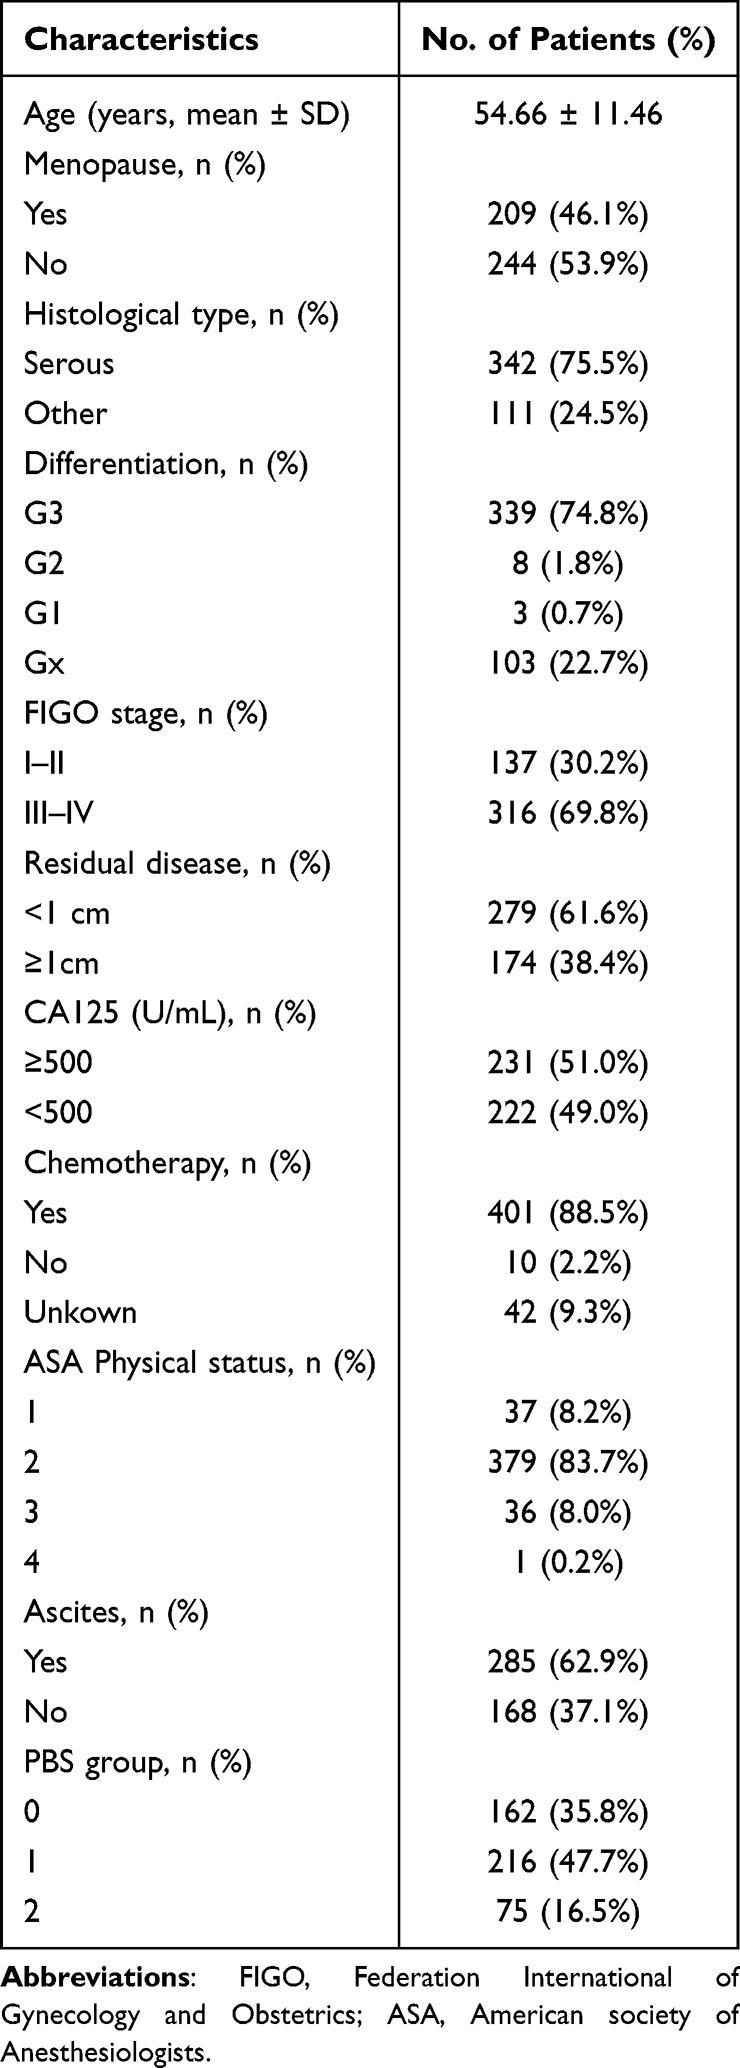 |
Table 1 Baseline Characteristics of Patients |
Survival Outcomes
The median follow-up was 36 months and 193 (42.6%) patients died during follow-up. The median OS and PFS were 63 and 40 months; the OS and PFS rates for 1 year were 76% and 69%, for 3 years were 59% and 45%, for 5 years were 45% and 25%, respectively. The cutoff points of each peripheral blood marker variables are shown in Table 2. Higher serum albumin, and LMR indicated favorable OS, whereas higher NLR, FLR, and TCLR indicated inferior OS (all P < 0.001, Table 2 and Figure 1A–E).
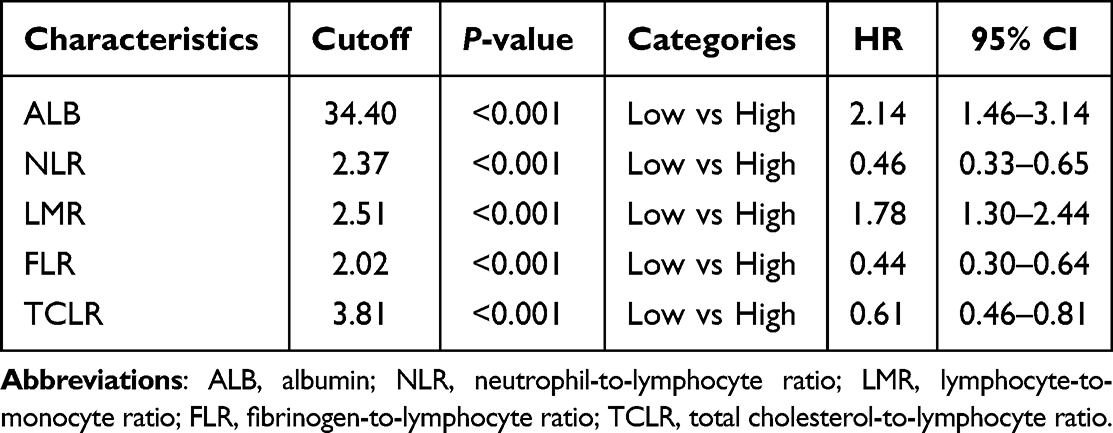 |
Table 2 Univariate Cox Analyses for OS of Peripheral Blood Factors |
 |
Figure 1 Construction of peripheral blood score (PBS). Survival analysis of albumin (A), NLR (B), FLR (C), LMR (D), TCLR (E), and PBS (F) based on overall survival. (G) Calculation of the peripheral blood score (PBS). (H and I) Analysis of the predictive accuracy of the different score systems through the months of follow-up, computed by the AUC of time-dependent ROC. |
Peripheral Blood Score (PBS) Construction
The following 5 parameters was used to construct PBS: serum albumin (better prognosis: ≥34.4 (g/L)), NLR (better prognosis: <2.37), LMR (better prognosis: ≥2.51), FLR (better prognosis: <2.02 (g/109)) and TCLR (better prognosis: <3.81 (mmol/109)). Patients were divided into three groups: the patients had worse prognosis values for four or five parameters were classified as PBS 2, those with worse prognosis values for two or three parameters were assigned to PBS 1, and other patients were assigned to PBS 0 (Figure 1G). The survival analysis of three PBS groups showed significantly different (P < 0.001, Figure 1F). The relationships between clinicopathological characteristics and PBS were analyzed (Table 3). Among the three groups, the distribution of histological type, differentiation, FIGO stage, residual disease after surgery, CA125 levels, and ascites before surgery was very different (P = 0.021, P = 0.013, P < 0.001, P < 0.001, P < 0.001, P < 0.001).
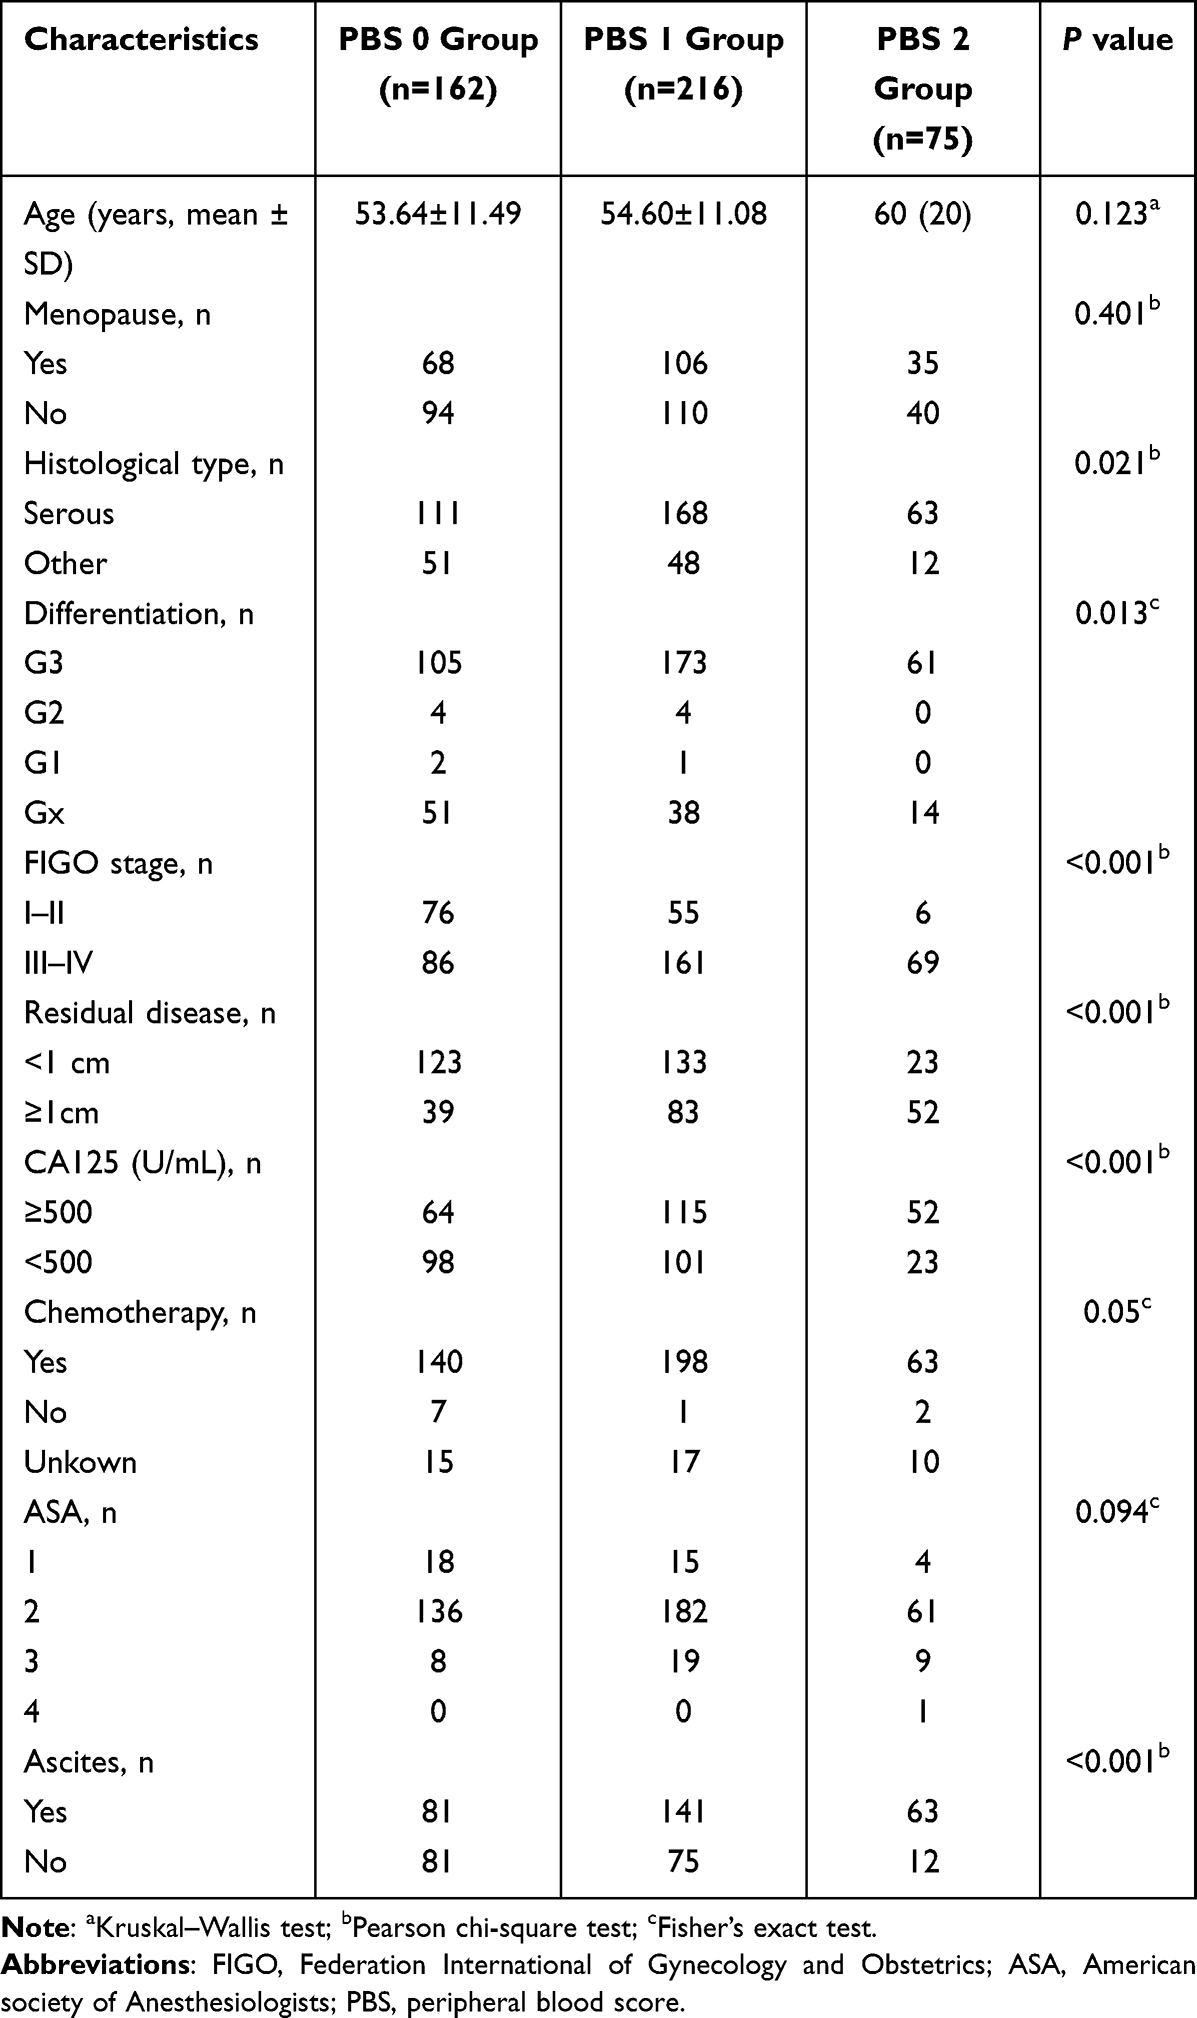 |
Table 3 Correlation Between the PBS and Clinicopathological Characteristics |
The time-dependent ROC curves with estimated AUC for each scoring system revealed that PBS consistently outperformed the other scoring systems (Figure 1H). Also, compared with the constituent part, the PBS was shown to be the system with higher AUC values (Figure 1I).
Independent Risk Factors for FIGO III-IV Stage in EOC Patients
Baseline clinical characteristics and clinicopathological features including peripheral blood parameters were analyzed by univariate and multivariate logistic regression. In the univariate logistic regression analysis, age, levels of CA125, NLR, FLR, ALB, TCLR, SII, COUNT, SIS, ONI, and PBS were associated with FIGO III–IV stage (all P < 0.1, Table 4). Then, these factors entered into the multivariate analysis. It showed age, level of CA125, and PBS were independent risk factors for the FIGO III–IV stage (OR = 1.03, 95CI%: 1.01–1.05; OR = 4.89, 95CI%: 2.98–8.03; OR = 1.68, 95CI%: 1.20–2.36, respectively, Table 4).
 |
Table 4 Univariate and Multivariate Logistic Regression Analyses for FIGO III–IV |
Nomogram Model for Predicting FIGO III-IV Stage
A nomogram for the FIGO III–IV stage was created based on the independent predictors selected in the logistic regression. It provided a method to quantify the probabilities (Figure 2A). Then, we use ROC curves and calibration plots to assess the nomogram’s predictive accuracy. The ROC curve analysis showed the model’s good efficiency in diagnosing FIGO III–IV stage of EOC patients (AUC = 0.782, Figure 2B). The calibration plots (Figure 2C) showed that the actual and the predicted probabilities had a good consistency (P = 0.986). DCA revealed that the model is beneficial to clinical practice (Figure 2D).
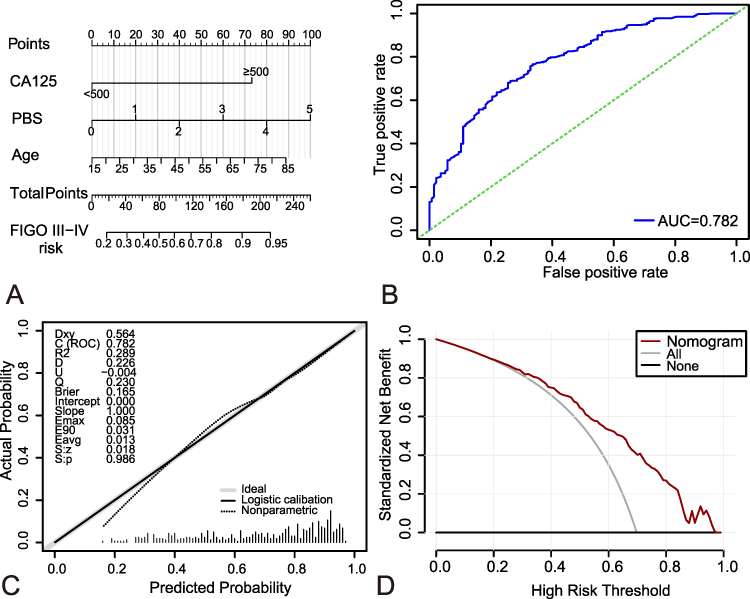 |
Figure 2 Nomogram model predicting advanced stage of EOC patients. (A) The nomogram for predicting advanced stage with CA125, PBS, and age. (B) The ROC curve for the nomogram. (C) The calibration plots for the nomogram. (D) Decision curve analyses of the nomogram. |
Univariate and Multivariate Cox Analyses for OS and PFS
We selected the independent risk factors for OS and PFS by univariate and multivariate Cox analyses (Table 5 and Table 6). Univariate analysis showed that CA125 levels and ascites before surgery, FIGO stage, age, PBS, histological type, differentiation, and residual disease after surgery were the factors associated with OS and PFS (all P < 0.05). In multivariate analysis, we found that FIGO stage, residual disease after surgery, and PBS were independent factors affecting OS (HR = 4.54, 95CI%: 2.54–8.09; HR = 0.69, 95CI%: 0.50–0.96; HR = 1.19, 95CI%: 1.07–1.33, respectively, Table 5) and PFS (HR = 3.47, 95CI%: 2.21–5.44; HR = 0.76, 95CI%: 0.58–1; HR = 1.16, 95CI%: 1.06–1.27, respectively, Table 6).
 |
Table 5 Univariate and Multivariate Cox Regression Analyses for OS |
 |
Table 6 Univariate and Multivariate Cox Regression Analyses for PFS |
Nomogram Models for Predicting OS and PFS
To identify the most correlated factors of OS and PFS, we performed Lasso Cox analysis and 10 rounds of cross-validation (Figure 3). The values corresponding to the lambda 1se were chosen. Finally, FIGO stage, residual disease after surgery, and PBS were selected in both OS and PFS analysis, which were also independent factors of OS and PFS (Table 5 and Table 6). Then, prognostic nomogram models were developed based on the selected factors (Figure 4A and B). The AUC values and their corresponding 95% CIs of 1-, 3-, and 5-year OS were 74% (95% CI: 68–81%), 73% (95% CI: 68–79%), 73% (95% CI: 66–80%) for the OS nomogram model. For the PFS nomogram model, the AUC values for 1-, 3-, and 5-year PFS were 72% (95% CI: 65–79%), 73% (95% CI: 68–78%), and 70% (95% CI: 63–77%), respectively (Figure 4C and F). The calibration curves for different years (1-, 3-, 5-year) of OS and PFS rates were delineated with 1000 bootstrap samples and well overlapped with their reference lines (Figure 4D and G). Wider threshold probability ranges were demonstrated in the prediction of 5-year OS and PFS rates using DCA curves, which showed that the nomogram models increase net benefit (Figure 4E and H). The AUC of time-dependent ROC and time-dependent C-index curves were delineated in Figure 5. For the OS nomogram model, the C-index was 0.68 (95% CI: 0.64–0.72), and for the PFS nomogram model, it was 0.66 (95% CI: 0.63–0.70) after 1000 bootstrap samples to measure discrimination.
 |
Figure 3 The LASSO regression was used to select elements of nomogram models. (A and C) LASSO coefficients of the whole factors were included in OS (A) and PFS (C) analysis. (B and D) Tenfold cross-validation for LASSO model parameter adjustment using 1-SE criteria for OS model (B) and PFS model (D). |
 |
Figure 4 Nomogram models predicting prognosis of EOC patients. (A and B) The nomogram model predicting OS (A) and PFS (B) probability with FIGO stage, residual disease, and PBS. (C and F) The receiver operating characteristic (ROC) curve analyses showed the accuracy of 1-year, 3-year, and 5-year OS (C) and PFS (F). (D and G) Calibration curves showed the prediction ability of the nomogram models for OS and PFS. (E and H) The decision curve analysis of developed nomogram models for 1-year, 3-year, and 5-year OS (E) and PFS (H). |
 |
Figure 5 The performance of nomogram models predicting prognosis. (A and C) Time-dependent AUC of ROC for OS (A) and PFS (C). (B and D) Time-dependent C-index for the models predicting OS (B) and PFS (D). |
The Application of Nomogram Models
For each element of the nomograms, patients can get point according to their actual values by comparing the visualized models (Figure 2A, Figure 4A and B). Total points were calculated by adding each elementary point. The relevant risks can be obtained by making a vertical line perpendicular to the total score point.
Discussion
In the present study, we constructed a scoring system, PBS based on some peripheral blood parameters (the neutrophil counts, lymphocyte counts, monocyte counts, the levels of albumin, total cholesterol, and fibrinogen) and explored its relevance to the stage and prognosis of EOC patients. We proved PBS was an independent factor for FIGO III–IV stage, OS, and PFS. Then, we built the nomogram models based on the independent variables to predict the stage and the prognosis. Finally, the discrimination, calibration, and decision curve analyses indicated the models’ good predictive ability and clinical practicability.
Studies have showed that inflammatory cells are crucial in cancer immunity, as they play both protumor and anti-tumor roles.5 It has been found inflammatory cells, such as neutrophils, macrophages, and lymphocytes, are usually present in tumor tissues.19 Neutrophils can help tumor cells invade, proliferate, metastasize and escape from immune surveillance. Various molecules are released from neutrophils’ granules and cytoplasm, then they act on cancer and stroma cells in tumor microenvironment.20 Lymphocytes can inhibit tumor cell’s proliferation and metastasis, and induce their death, which plays a basic role in cancer defense.21 Monocytes can directly infiltrate tumors or differentiate into tumor-associated macrophages and further play a part in cancer development.22 Fibrinogen, also known as coagulation factor I, is essential for thrombosis. It also functions as an inflammatory regulator linked to the development of inflammatory microenvironment, tumor cell invasion, metastasis, and growth.23 NLR has been proven to be associated with clinicopathological parameters, OS, PFS, and reaction to chemotherapy in EOC patients, a higher NLR predicts pessimistic results.11,16,24–28 Studies have shown LMR is associated with CA125 levels, ascites, histological grade, lymph node metastasis, and FIGO stage, a lower LMR means shorter OS and PFS.29 Combining LMR and CA125 levels can improve the predictive accuracy of prognosis.30 Wankyu Eo et al found preoperative LMR is an independent predictor of suboptimal cytoreduction.31 Elevated fibrinogen also can play roles of predicting EOC patients’ survival outcome.13 We got similar results, but the cutoff values of NLR, LMR, and FLR were different from the studies. In our study, the cutoff values were 2.37, 2.51, and 2.02 for NLR, LMR, and FLR, respectively.
Levels of albumin usually represent malnutrition or cachexia in cancer patients with advanced stage. Recently, it has been found albumin has a guiding role in the prediction of complications and prognosis in EOC. Low albumin level means poor prognosis. D de Jong et al's research showed albumin can play a role in predicting suboptimal cytoreduction.32 It can also predict chemotherapy sensitivity when combined with D-dimer.33 Cholesterol is important for cell membrane maintenance and energy metabolism, which is also closely linked to tumors’ occurrence. Growing research links hypercholesterolemia to increased ovarian cancer risk.34,35 Composed of cholesterol level, albumin level, and lymphocyte count, CONUT score is related to ovarian cancer prognosis in retrospective studies.9,36
We think the composite of the inflammatory and nutritional status may represent a condition, in which patients and cancer interact with each other. These all indicate inflammatory and nutritional parameters have essential value in the prediction of EOC patients’ prognosis. The application is limited by their low sensitivity and specificity with AUC varies 0.63–0.709, although many scoring systems have been constructed to increase their availability.9–11,14,30,33,36 In our study, we constructed a scoring system named PBS, by dichotomizing the variables and value assignment. PBS had a better performance in predicting OS in EOC patients compared with existing scoring systems and single indicators. Patients with higher PBS often had more probability to have advanced FIGO stage, residual disease ≥1cm, ascites, and higher CA125 levels. High PBS indicated a worse prognosis. This convenient score can be used in patient counseling. But PBS is composed of five parameters, which makes it seem a little complicated. We still need more prospective studies to explore its application. The final objective is to put PBS into clinical use like ROMA (Risk of Ovarian Malignancy Algorithm),37 doctors and patients can get it easily from the output of instrument, whether it is complicated or not. Besides the prognostic value, the inflammatory nutritional parameters also have role in differential diagnosis. Relevant researches have proved the significant difference of NLR, LMR, fibrinogen between ovarian cancer group and control group. The AUC varies from 0.683 to 0.954, and the combination of CA125 can improve diagnostic efficacy.38–41 We will put devote part of our work on exploring the potential use of PBS in differential diagnosis in future.
There are many different types of models based on clinicopathological parameters, imaging characteristics, or genetic signature to predict the stage, pathologic types, surgical outcomes, and reaction to chemotherapy, OS, or PFS,42–48 but their practicability is limited partly owing to the expensive and redundant examination such as molecular diagnosis or genomic sequence. We urgently need models grounded on clinical variables with superior convenience. We performed univariable and multivariable analyses and confirmed FIGO stage, residual disease, and PBS were associated with OS and PFS, which is consistent with previous studies.49,50 However, CA125 and chemotherapy were not independent factors, which disagreed with some studies.51,52 This phenomenon can be attributed to the most included EOC patients having a high level of CA125 and experiencing chemotherapy, and we had limited information about chemotherapy regime, cycles and response. Then, we constructed models which had good practicability and visualized them with the simple nomogram. The nomogram model for advanced stage of EOC patients had an AUC value of 0.782, the models for OS and PFS had AUC values of different years of OS and PFS rates >0.7, which means a good discrimination. We also proved the models’ accuracy and clinical practicability. Those features all indicate that our models are accurate and feasible tools.
The study had some limitations. First, it was a single-center retrospective cohort. Second, we got this scoring system and these three models based on our data. Both PBS and nomogram models should be rigorously validated externally. Then, in the multivariable analyses, there were limited patients in some subgroups, which resulted in a wide range of confidence intervals (CIs). Last, we had limited data about chemotherapy, and the postoperative therapies of patients have some heterogeneity. These factors may cause bias of study. Further studies with larger sample size, good homogeneity and external validations are needed for the validation and generalization of our conclusions.
In summary, we constructed a scoring system and developed convenient and reliable tools. The tools included the peripheral blood parameters and clinicopathological parameters, it can be used to estimate the stage and prognosis of EOC patients and help doctors choose an optimal therapeutic schedule. It was proved that the models had a strong discriminatory ability, accuracy, and clinical practicability, which means they had a good predictive ability for advanced stage, OS, and PFS, respectively. The nomogram models could be convenient clinical tools for preoperative counseling, risk stratification, evaluating prognosis as well as recommending a sensible and individualized therapy approach.
Data Sharing Statement
Relevant data are available from the corresponding authors.
Ethics Statement
This study was approved by the ethics committee of Qilu Hospital, Shandong University (KYLL-202208-033). Patient informed consent was waived because the study collected patients’ information retrospectively and did not provide information that can be used to identify individuals. The study was performed in accordance with the Declaration of Helsinki.
Author Contributions
All authors made a significant contribution to the work reported, whether that is in the conception and design, data acquisition, or data analysis and interpretation, participated in the drafting of the article or critically revising it for important intellectual content, agreed to submit to the current journal, gave final approval for the version to be published, and agreed to be accountable for all aspects of the work.
Funding
This work was supported by China Postdoctoral Science Fund (21510077311145 and 21300076311047), Natural Science Foundation of Shandong Province (ZR2020MH272).
Disclosure
The authors report no conflicts of interest in this work.
References
1. Lheureux S, Braunstein M, Oza AM. Epithelial ovarian cancer: evolution of management in the era of precision medicine. CA Cancer J Clin. 2019;69(4):280–304. doi:10.3322/caac.21559
2. Bray F, Ferlay J, Soerjomataram I, Siegel RL, Torre LA, Jemal A. Global cancer statistics 2018: GLOBOCAN estimates of incidence and mortality worldwide for 36 cancers in 185 countries. CA Cancer J Clin. 2018;68(6):394–424. doi:10.3322/caac.21492
3. Torre LA, Trabert B, DeSantis CE, et al. Ovarian cancer statistics, 2018. CA Cancer J Clin. 2018;68(4):284–296. doi:10.3322/caac.21456
4. Rosendahl M, Høgdall CK, Mosgaard BJ. Restaging and survival analysis of 4036 ovarian cancer patients according to the 2013 FIGO classification for ovarian, fallopian tube, and primary peritoneal cancer. Int J Gynecol Cancer off J Int Gynecol Cancer Soc. 2016;26(4):680–687. doi:10.1097/IGC.0000000000000675
5. Gonzalez H, Hagerling C, Werb Z. Roles of the immune system in cancer: from tumor initiation to metastatic progression. Genes Dev. 2018;32(19–20):1267–1284. doi:10.1101/gad.314617.118
6. Ataseven B, Du Bois A, Reinthaller A, et al. Pre-operative serum albumin is associated with post-operative complication rate and overall survival in patients with epithelial ovarian cancer undergoing cytoreductive surgery. Gynecol Oncol. 2015;138(3):560–565. doi:10.1016/j.ygyno.2015.07.005
7. Goins EC, Weber JM, Truong T, et al. Malnutrition as a risk factor for post-operative morbidity in gynecologic cancer: analysis using a national surgical outcomes database. Gynecol Oncol. 2022;165(2):309–316. doi:10.1016/j.ygyno.2022.01.030
8. Xie H, Ruan G, Wei L, et al. Comprehensive comparison of the prognostic value of systemic inflammation biomarkers for cancer cachexia: a multicenter prospective study. Inflamm Res off J Eur Histamine Res Soc Al. 2022;2022:1. doi:10.1007/s00011-022-01626-7
9. Li Y, Zhang C, Ji R, et al. Prognostic significance of the controlling nutritional status (CONUT) score in epithelial ovarian cancer. Int J Gynecol Cancer off J Int Gynecol Cancer Soc. 2020;30(1):74–82. doi:10.1136/ijgc-2019-000865
10. Yoshikawa N, Yoshida K, Tamauchi S, et al. The preoperative prognostic nutritional index for the prediction of outcomes in patients with early-stage ovarian clear cell carcinoma. Sci Rep. 2020;10(1):7135. doi:10.1038/s41598-020-64171-5
11. Farolfi A, Scarpi E, Greco F, et al. Inflammatory indexes as predictive factors for platinum sensitivity and as prognostic factors in recurrent epithelial ovarian cancer patients: a MITO24 retrospective study. Sci Rep. 2020;10(1):18190. doi:10.1038/s41598-020-75316-x
12. Lei H, Xu S, Mao X, et al. Systemic immune-inflammatory index as a predictor of lymph node metastasis in endometrial cancer. J Inflamm Res. 2021;14:7131–7142. doi:10.2147/JIR.S345790
13. Luo Y, Kim HS, Kim M, Lee M, Song YS. Elevated plasma fibrinogen levels and prognosis of epithelial ovarian cancer: a cohort study and meta-analysis. J Gynecol Oncol. 2017;28(3):e36. doi:10.3802/jgo.2017.28.e36
14. Nie D, Gong H, Mao X, Li Z. Systemic immune-inflammation index predicts prognosis in patients with epithelial ovarian cancer: a retrospective study. Gynecol Oncol. 2019;152(2):259–264. doi:10.1016/j.ygyno.2018.11.034
15. Xiang J, Zhou L, Li X, et al. Preoperative monocyte-to-lymphocyte ratio in peripheral blood predicts stages, metastasis, and histological grades in patients with ovarian cancer. Transl Oncol. 2017;10(1):33–39. doi:10.1016/j.tranon.2016.10.006
16. Williams KA, Labidi-Galy SI, Terry KL, et al. Prognostic significance and predictors of the neutrophil-to-lymphocyte ratio in ovarian cancer. Gynecol Oncol. 2014;132(3):542–550. doi:10.1016/j.ygyno.2014.01.026
17. Iseki Y, Shibutani M, Maeda K, et al. Impact of the preoperative controlling nutritional status (CONUT) score on the survival after curative surgery for colorectal cancer. PLoS One. 2015;10(7):e0132488. doi:10.1371/journal.pone.0132488
18. Suzuki Y, Okabayashi K, Hasegawa H, et al. Comparison of preoperative inflammation-based prognostic scores in patients with colorectal cancer. Ann Surg. 2018;267(3):527–531. doi:10.1097/SLA.0000000000002115
19. Greten FR, Grivennikov SI. Inflammation and cancer: triggers, mechanisms, and consequences. Immunity. 2019;51(1):27–41. doi:10.1016/j.immuni.2019.06.025
20. Cassatella MA, Östberg NK, Tamassia N, Soehnlein O. Biological roles of neutrophil-derived granule proteins and cytokines. Trends Immunol. 2019;40(7):648–664. doi:10.1016/j.it.2019.05.003
21. Si G, Fr G. Immunity, inflammation, and cancer. Cell. 2010;140:6. doi:10.1016/j.cell.2010.01.025
22. Kiss M, Caro AA, Raes G, Laoui D. Systemic reprogramming of monocytes in cancer. Front Oncol. 2020;10:1399. doi:10.3389/fonc.2020.01399
23. Perisanidis C, Psyrri A, Cohen EE, et al. Prognostic role of pretreatment plasma fibrinogen in patients with solid tumors: a systematic review and meta-analysis. Cancer Treat Rev. 2015;41(10):960–970. doi:10.1016/j.ctrv.2015.10.002
24. Zhao Z, Zhao X, Lu J, Xue J, Liu P, Mao H. Prognostic roles of neutrophil to lymphocyte ratio and platelet to lymphocyte ratio in ovarian cancer: a meta-analysis of retrospective studies. Arch Gynecol Obstet. 2018;297(4):849–857. doi:10.1007/s00404-018-4678-8
25. Baert T, Van Camp J, Vanbrabant L, et al. Influence of CA125, platelet count and neutrophil to lymphocyte ratio on the immune system of ovarian cancer patients. Gynecol Oncol. 2018;150(1):31–37. doi:10.1016/j.ygyno.2018.05.004
26. Miao Y, Yan Q, Li S, Li B, Feng Y. Neutrophil to lymphocyte ratio and platelet to lymphocyte ratio are predictive of chemotherapeutic response and prognosis in epithelial ovarian cancer patients treated with platinum-based chemotherapy. Cancer Biomark Sect Dis Markers. 2016;17(1):33–40. doi:10.3233/CBM-160614
27. Marchetti C, D’Indinosante M, Bottoni C, et al. NLR and BRCA mutational status in patients with high grade serous advanced ovarian cancer. Sci Rep. 2021;11(1):11125. doi:10.1038/s41598-021-90361-w
28. Sanna E, Tanca L, Cherchi C, et al. Decrease in neutrophil-to-lymphocyte ratio during neoadjuvant chemotherapy as a predictive and prognostic marker in advanced ovarian cancer. Diagn Basel Switz. 2021;11(7):1298. doi:10.3390/diagnostics11071298
29. Gong J, Jiang H, Shu C, et al. Prognostic value of lymphocyte-to-monocyte ratio in ovarian cancer: a meta-analysis. J Ovarian Res. 2019;12(1):51. doi:10.1186/s13048-019-0527-z
30. Tang Y, Hu H, Tang F, et al. Combined preoperative LMR and CA125 for prognostic assessment of ovarian cancer. J Cancer. 2020;11(11):3165–3171. doi:10.7150/jca.42477
31. Eo W, Kim HB, Lee YJ, Suh DS, Kim KH, Kim H. Preoperative lymphocyte-monocyte ratio is a predictor of suboptimal cytoreduction in stage III-IV epithelial ovarian cancer. J Cancer. 2016;7(13):1772–1779. doi:10.7150/jca.15724
32. de Jong D, Eijkemans MJ, Lie Fong S, et al. Preoperative predictors for residual tumor after surgery in patients with ovarian carcinoma. Oncology. 2007;72(5–6):293–301. doi:10.1159/000113051
33. Chen W, Zhong S, Shan B, et al. Serum D-dimer, albumin and systemic inflammatory response markers in ovarian clear cell carcinoma and their prognostic implications. J Ovarian Res. 2020;13(1):89. doi:10.1186/s13048-020-00693-w
34. Zhang D, Xi Y, Feng Y. Ovarian cancer risk in relation to blood lipid levels and hyperlipidemia: a systematic review and meta-analysis of observational epidemiologic studies. Eur J Cancer Prev off J Eur Cancer Prev Organ ECP. 2021;30(2):161–170. doi:10.1097/CEJ.0000000000000597
35. Onwuka JU, Okekunle AP, Olutola OM, Akpa OM, Feng R. Lipid profile and risk of ovarian tumours: a meta-analysis. BMC Cancer. 2020;20(1):200. doi:10.1186/s12885-020-6679-9
36. Karakaş S, Demirayak G, Önder AB, et al. The association between the preoperative prognostic nutritional index and the controlling nutritional status score on tumor stage, chemotherapeutic response and overall survival in ovarian cancer. Nutr Cancer. 2022;74(5):1770–1779. doi:10.1080/01635581.2021.2022170
37. Van Gorp T, Cadron I, Despierre E, et al. HE4 and CA125 as a diagnostic test in ovarian cancer: prospective validation of the risk of ovarian malignancy algorithm. Br J Cancer. 2011;104(5):863–870. doi:10.1038/sj.bjc.6606092
38. Hefler-Frischmuth K, Lafleur J, Hefler L, et al. Plasma fibrinogen levels in patients with benign and malignant ovarian tumors. Gynecol Oncol. 2015;136(3):567–570. doi:10.1016/j.ygyno.2014.12.041
39. Li L, Tian J, Zhang L, et al. Utility of preoperative inflammatory markers to distinguish epithelial ovarian cancer from benign ovarian masses. J Cancer. 2021;12(9):2687–2693. doi:10.7150/jca.51642
40. Yun TH, Jeong YY, Lee SJ, Choi YS, Ryu JM. Neutrophil–lymphocyte and platelet–lymphocyte ratios in preoperative differential diagnosis of benign, borderline, and malignant ovarian tumors. J Clin Med. 2022;11(5):1355. doi:10.3390/jcm11051355
41. Huang K, Xu S, Wang J, Ge L, Xu J, Jia X. Combined use of CA125, neutrophil/lymphocyte ratio and platelet/lymphocyte ratio for the diagnosis of borderline and malignant epithelial ovarian tumors. J Ovarian Res. 2023;16:37. doi:10.1186/s13048-023-01106-4
42. Chen S, Wu Y, Wang S, Wu J, Wu X, Zheng Z. A risk model of gene signatures for predicting platinum response and survival in ovarian cancer. J Ovarian Res. 2022;15(1):39. doi:10.1186/s13048-022-00969-3
43. Zheng J, Guo J, Zhu L, Zhou Y, Tong J. Comprehensive analyses of glycolysis-related lncRNAs for ovarian cancer patients. J Ovarian Res. 2021;14(1):124. doi:10.1186/s13048-021-00881-2
44. Cardillo N, Devor EJ, Pedra Nobre S, et al. Integrated clinical and genomic models to predict optimal cytoreduction in high-grade serous ovarian cancer. Cancers. 2022;14(14):3554. doi:10.3390/cancers14143554
45. Qian L, Ren J, Liu A, et al. MR imaging of epithelial ovarian cancer: a combined model to predict histologic subtypes. Eur Radiol. 2020;30(11):5815–5825. doi:10.1007/s00330-020-06993-5
46. Yao F, Ding J, Lin F, et al. Nomogram based on ultrasound radiomics score and clinical variables for predicting histologic subtypes of epithelial ovarian cancer. Br J Radiol. 2022;95(1136):20211332. doi:10.1259/bjr.20211332
47. Kumar A, Janco JM, Mariani A, et al. Risk-prediction model of severe postoperative complications after primary debulking surgery for advanced ovarian cancer. Gynecol Oncol. 2016;140(1):15–21. doi:10.1016/j.ygyno.2015.10.025
48. Zhang Z, Bast RC, Yu Y, et al. Three biomarkers identified from serum proteomic analysis for the detection of early stage ovarian cancer. Cancer Res. 2004;64(16):5882–5890. doi:10.1158/0008-5472.CAN-04-0746
49. Chi DS, Eisenhauer EL, Zivanovic O, et al. Improved progression-free and overall survival in advanced ovarian cancer as a result of a change in surgical paradigm. Gynecol Oncol. 2009;114(1):26–31. doi:10.1016/j.ygyno.2009.03.018
50. Winter WE, Maxwell GL, Tian C, et al. Prognostic factors for stage III epithelial ovarian cancer: a gynecologic oncology group study. J Clin Oncol off J Am Soc Clin Oncol. 2007;25(24):3621–3627. doi:10.1200/JCO.2006.10.2517
51. Wang Q, Feng X, Liu X, Zhu S. Prognostic value of elevated pre-treatment serum CA-125 in epithelial ovarian cancer: a meta-analysis. Front Oncol. 2022;12:868061. doi:10.3389/fonc.2022.868061
52. Pignata S, Cannella L, Leopardo D, Pisano C, Bruni GS, Facchini G. Chemotherapy in epithelial ovarian cancer. Cancer Lett. 2011;303(2):73–83. doi:10.1016/j.canlet.2011.01.026
 © 2023 The Author(s). This work is published and licensed by Dove Medical Press Limited. The
full terms of this license are available at https://www.dovepress.com/terms
and incorporate the Creative Commons Attribution
- Non Commercial (unported, 3.0) License.
By accessing the work you hereby accept the Terms. Non-commercial uses of the work are permitted
without any further permission from Dove Medical Press Limited, provided the work is properly
attributed. For permission for commercial use of this work, please see paragraphs 4.2 and 5 of our Terms.
© 2023 The Author(s). This work is published and licensed by Dove Medical Press Limited. The
full terms of this license are available at https://www.dovepress.com/terms
and incorporate the Creative Commons Attribution
- Non Commercial (unported, 3.0) License.
By accessing the work you hereby accept the Terms. Non-commercial uses of the work are permitted
without any further permission from Dove Medical Press Limited, provided the work is properly
attributed. For permission for commercial use of this work, please see paragraphs 4.2 and 5 of our Terms.
Recommended articles
Prognostic Roles of Inflammation- and Nutrition-Based Indicators for Female Patients with Cancer
Yang M, Zhang Q, Ge Y, Tang M, Hu C, Wang Z, Zhang X, Song M, Ruan G, Zhang X, Liu T, Xie H, Zhang H, Zhang K, Li Q, Li X, Liu X, Lin S, Shi H
Journal of Inflammation Research 2022, 15:3573-3586
Published Date: 17 June 2022
Anorexia of Aging: Metabolic Changes and Biomarker Discovery
Picca A, Calvani R, Coelho-Júnior HJ, Landi F, Marzetti E
Clinical Interventions in Aging 2022, 17:1761-1767
Published Date: 2 December 2022
Lipocalin 2 (LCN2) Knockdown Regulates Treg/Th17 Balance to Improve Asthma in Mice
Xu L, Shi M
Journal of Asthma and Allergy 2023, 16:1323-1332
Published Date: 14 December 2023
Construction and Validation of a Novel Nomogram Predicting Recurrence in Alpha-Fetoprotein-Negative Hepatocellular Carcinoma Post-Surgery Using an Innovative Liver Function-Nutrition-Inflammation-Immune (LFNII) Score: A Bicentric Investigation
Zhang BL, Liu J, Diao G, Chang J, Xue J, Huang Z, Zhao H, Yu L, Cai J
Journal of Hepatocellular Carcinoma 2024, 11:489-508
Published Date: 6 March 2024
Non-Pharmacological Strategies for Managing Sarcopenia in Chronic Diseases
Hu J, Wang Y, Ji X, Zhang Y, Li K, Huang F
Clinical Interventions in Aging 2024, 19:827-841
Published Date: 15 May 2024