Back to Journals » Cancer Management and Research » Volume 12
Development of Mobile Application for Dynamically Monitoring the Risk of Prostate Cancer and Clinicopathology
Authors Wang H ![]() , Chen L
, Chen L ![]() , Zhou J, Tai S, Liang C
, Zhou J, Tai S, Liang C
Received 28 June 2020
Accepted for publication 15 October 2020
Published 26 November 2020 Volume 2020:12 Pages 12175—12184
DOI https://doi.org/10.2147/CMAR.S269783
Checked for plagiarism Yes
Review by Single anonymous peer review
Peer reviewer comments 2
Editor who approved publication: Dr Sanjeev K. Srivastava
Hui Wang,1– 3,* Lidong Chen,1– 3,* Jun Zhou,1,2 Sheng Tai,1,2 Chaozhao Liang1– 3
1Department of Urology, The First Affiliated Hospital of Anhui Medical University, Hefei, People’s Republic of China; 2The Institute of Urology, Anhui Medical University, Hefei, People’s Republic of China; 3Anhui Province Key Laboratory of Genitourinary Diseases, Anhui Medical University, Hefei, People’s Republic of China
*These authors contributed equally to this work
Correspondence: Chaozhao Liang; Sheng Tai
Department of Urology, The First Affiliated Hospital of Anhui Medical University, No. 218 Jixi Road, Hefei 230022, Anhui, People’s Republic of China
Tel +86 551 6292 3440
; +86 551 6292 2240
Fax +86 551 6363 3742
Email [email protected]; [email protected]
Objective: To develop an application dynamically monitoring the prostate cancer (PCa) risk for patients to assess their own progression of PCa risk at home.
Methods: Between January 2010 and December 2019, all of the 1697 patients underwent transrectal ultrasound prostate biopsy at the cancer center, which is one of the Chinese Prostate Cancer Consortium. Patients’ clinical parameters from January 2010 to May 2018 were used to establish models that consisted of several risk factors with P value < 0.1 in univariate analysis and with P value < 0.05 in multivariate analysis (n=1113), including model 1 (predicting PCa), model 2 (predicting PCa with high Gleason scores (7 or higher)) and model 3 (predicting PCa with the high clinical stage (T2b or higher)). Other patients from June 2018 to December 2019 were used to validate models (n=440). Patients with a lack of sufficient data were eventually excluded (n=144).
Results: A total of 1553 patients were involved in this study, and an application was used to perform the models. The predictive cut-off value and area under the curves (AUCs) of model 1, 2 and 3 were, respectively, calculated (cut-off: 0.53, 0.38 and 0.40, AUCs: 0.88, 0.89 and 0.89). Using a cut-off value of 10%, three models obtained a high sensitivity (> 95%). Besides, more patients can be correctly reclassified via our models (42.9 to 55.5%). Decision curve analyses revealed a decent net benefit in any probability for models. These results were well verified in the validation cohort.
Conclusion: This application showed decent performance in predicting the risk of PCa and clinicopathology, which was available and convenient for patients to self-assess the progress of PCa risks so that being better to participate in disease management.
Keywords: early detection of cancer, mobile applications, prostate cancer
Introduction
Prostate cancer (PCa) has attracted more and more attention due to its increasing morbidity and mortality.1 The consensus from urologists on the high-risk PCa declared that detection, intervention and treatment should be conducted as early as possible.2 At present, for the men at the risk of PCa, total prostate-specific antigen (TPSA), free-PSA (FPSA), PSA density (PSAD) and magnetic resonance imaging (MRI) are the main predictive indicators. Although these indicators could enhance the positive rate and reduce the mortality in predicting prostate cancer, it also brought several questions including over-treatment and over-diagnosis.3
D’Amico et al had put forward the classification of PCa risk.4 Based on the level of PSA in the serum, pathology (Gleason score) and the clinical stage, patients with PCa were positioned at three levels, including low-risk PCa (L-PCa), intermediate-risk PCa (I-PCa) and high-risk PCa (H-PCa). With the associated studies increasing, more evidence has shown that patients with L-PCa became clinically relevant events within 8 years when he left untreated, around accounting for 1%.5 Meanwhile, patients will receive great benefit from the active surveillance and the risk of recurrence is less than 25% at 5 years post-treatment. Of course, patients’ wishes must also be valued at the same time. Therefore, the performance of screening measure not only can correctly forecast PCa but also can accurately identify the L-PCa from the crowd of PCa, which can reduce the over-treatment for the men with L-PCa.6,7
For patients with suspected PCa or low-risk PCa, active surveillance is very necessary. Active surveillance keeps track of the disease’s progress. Medical intervention can be taken in a timely manner when necessary. Therefore, active surveillance methods should be accurate and convenient, so that patients can easily participate in their own disease management. In this study, we developed some models that can predict PCa and clinicopathology risk. We used the software to allow the integration of data collection into an application (APP). Patients only need to input the test results into the APP to get the recommended results, which is convenient for the elderly to use.
Patients and Methods
Patient
Patients who underwent the transrectal ultrasound (TURS) guided 12+X-core prostate biopsy due to the abnormal results on the PSA, MRI or digital rectal examination (DRE) were retrospectively collected between January 2010 and December 2019 (n=1697). All patients were Chinese and had total PSA (TPSA) and free PSA (FPSA) assessment before digital rectal examination (DRE). Besides, DRE, prostate volume, weight, height and multi-parametric MRI (MP-MRI) were all collected as well. The clinical stage was evaluated by the eighth edition of the Tumor-Node-Metastasis (TNM) staging classification for PCa.8 After screening, 144 cases were eventually excluded due to the lack of sufficient data in these cases, the indicators and the corresponding number were shown as follows: MP-MRI (n=101), free-PSA (n=22), height (n=12) and the vague pathology (n=9). At last, a total of 1553 patients were involved and evaluated in the study. The Ethics Committees regarding Human Research approved this study with an approved number of PJ-20,201,718. All experiments were conducted according to the relevant guidelines and regulations.
Study Design
The patients were collected between January 2010 and May 2018, in which the data of patients were used to establish the model. The rest of the patients from June 2018 to December 2019 entered into the validation cohort. This research was aimed at three purposes. Objective Ⅰ (predicting PCa), all patients were allocated to two groups based on the outcomes of pathology including benign findings (no prostate cancer) and PCa. In this part, we aimed at finding the independent significant risks (ISRs) of predicting PCa, and these ISRs were used to establish model 1 to forecast the probabilities of suffering from PCa. Objective Ⅱ (predicting high-grade PCa (HG-PCa)), according to the Gleason score (GS), patients with HG-PCa (GS≥7) and patients with non-HG-PCa (benign findings or low-grade PCa (GS=<6)) were involved in this part. In the same way, the ISRs of predicting HG-PCa were founded and utilized to develop model 2 to diagnose the HG-PCa. Objective III (predicting PCa with high clinical stage, HCS-PCa), each patient was evaluated by TNM staging classification. The clinical stage with T2b or higher was regarded as HCS-PCa, and benign finding and low clinical stage (T2a or lower) were regarded as non-HCS-PCa. Similarly, the ISRs also were ascertained in this part and were employed to structure model 3 to forecast the HCS-PCa.
Date Collection and Statistical Analysis
Weight, height, BMI, TPSA, FPSA, F/TPSA (FPSA/TPSA), PSAD, prostate index (prostate weight/body weight), prostate weight (0.546*length*width*height of the prostate), prostate volume (0.52*length*width*height of the prostate) and MRI outcomes were involved in this study. Herein, the length, width and height of the prostate were measured by MRI. The predictive performance of MRI was quantified by prostate imaging reporting and data system version 2 (PI-RADS V2)
Univariate regression and multivariate stepwise regression analysis were performed to select the ISRs that were used to develop the models. The ISRs with P<0.10 in univariate regression entered into the analysis of multivariate logistic regression, and the ISRs with P<0.05 in multivariate regression were implemented to establish the models. The principle of establishing model was described as follows: ln (P/(1−P))=aX1+bX2+cX3+dX4+eX5+f where a, b, c, d, e and f are the coefficient obtained from the logistic regression analysis and variable from X1 to X5 all originated from ISRs and the probability of investigated outcomes (such as Pca, HG-PCa or HCS-PCa) was recorded as P. In order to know the probability of the investigated outcomes, the original formula is re-written as P=eaX1+bX2+cX3+dX4+eX5+f/(1+eaX1+bX2+cX3+dX4+eX5+f) where e is the natural constant in the exponential function.9 The optimal thresholds that distinguish the positive outcome and negative outcome was the value that can obtain the maximum sum of sensitivity and specificity.
An application was made by transferring this model to software called Microsoft Visual C# 2010. The application was called prostate cancer (PCa) and clinicopathology risk calculator (PCCRC), which was employed to predict the probability of suffering from PCa, HG-PCa and HCS-PCa by entering the value of indicators. Overall accuracy, receiver operating curves (ROC), Cox & Snell R Square and Nagelkerke R Square were utilized to assess the predictive accuracy. Decision curve analysis (DCA) was applied to identify the clinical net benefit stemmed from the employ of the model. Net reclassification index (NRI) was utilized to reveal the ability of correctly reclassifying the patients, and it was tested by Z Test. The extent of overestimation or underestimation of models was evaluated by calibration curves. Hosmer-Lemeshow goodness-of-fit test was applied to show the goodness of fit. Meanwhile, using the calibration with 400 bootstrap samples was a suitable way to minimize the over-fit bias. The statistical analysis was performed with SPSS version 23.0 and R package version 3.0. (https://www.r-project.org). If the P value is less than 0.05, it can be considered statistically significant.
Result
Characteristics and Biopsy Outcomes
Overall, there were 1697 collected cases, including 858 patients with benign findings and 839 patients with PCa. After filtering, only 1553 patients involved in this research, of which 440 patients entered the validation cohort and 1113 patients were drawn into the training cohort. For PCa patients, based on the GS and clinical stage, we, respectively, divided these patients into a group with high GS (GS>6, n=586) and a group with a high clinical stage (>T2a, n=533). The number of biopsy cores was 12.08 ± 1.34, and the positive cores were 3.09 ± 4.12. In addition, the different risk factors associated with PCa are exhibited in Table 1.
 |
Table 1 Patient Characteristics and Biopsy Findings of All |
Models and Application
As shown in Table 1, the risks of age, TPSA, FPSA, PI-RADS and prostate volume (PV) were the independent risk factors for PCa, which were used to develop model 1. The independent risk factors for HG-PCa and HCS-PCa were age, TPSA, F/TPSA, PI-RADS and PV, which were employed to construct model 2 and model 3, Table 2. The equation coefficients of these factors were calculated by regression analysis. The probability of PCa, HG-PCa and HCS-PCa that was calculated by combining the value of risk factors with each coefficient, such as P=eaX1+bX2+cX3+dX4+eX5+f/(1+eaX1+bX2+cX3+dX4+eX5+f). These three models were established (Supplement Table 1), and we transferred these models to software called Microsoft Visual C# 2010, which was called prostate cancer (PCa) and clinicopathology risk calculator (PCCRC). Users, including doctors and patients, only need to enter the value of each risk indicator into the calculator, and then they will obtain the probability of suffering from PCa, HG-PCa and HCS-PCa. Figure 1 illustrates the calculator interface and the demo results.
 |
Table 2 The Indicators Were Selected by Univariate Logistic Regression (ULR) and Multivariate Logistic Regression (MLR) to Predict PCa, HG-PCa and HCS-PCa |
 |
Figure 1 Demonstration and interface of Prostate Cancer (PCa) and Clinicopathology Risk Calculator (PCCRC). Normal people (A), patients with low stage clinicopathology (B), patients with high stage clinicopathology (C). The risk of PCa and clinicopathology change over time (D). The flow charts of dynamic monitoring patients using PCCRC (E). |
Cut-off Value and Performance
With the cut-off value of predicted probability increasing, we can obtain a series of values of sensitivity, specificity and the Youden’s index (the sum of sensitivity and specificity), Figure 2D. Based on the different objectives, we can adopt an appropriate cut-off value to increase the sensitivity and reduce the false positive. For the sake of getting the maximum Youden’s index, we calculated the optimal cut-off value of the predicted probability of model 1, model 2 and model 3, which, respectively, were 0.53, 0.38 and 0.40.
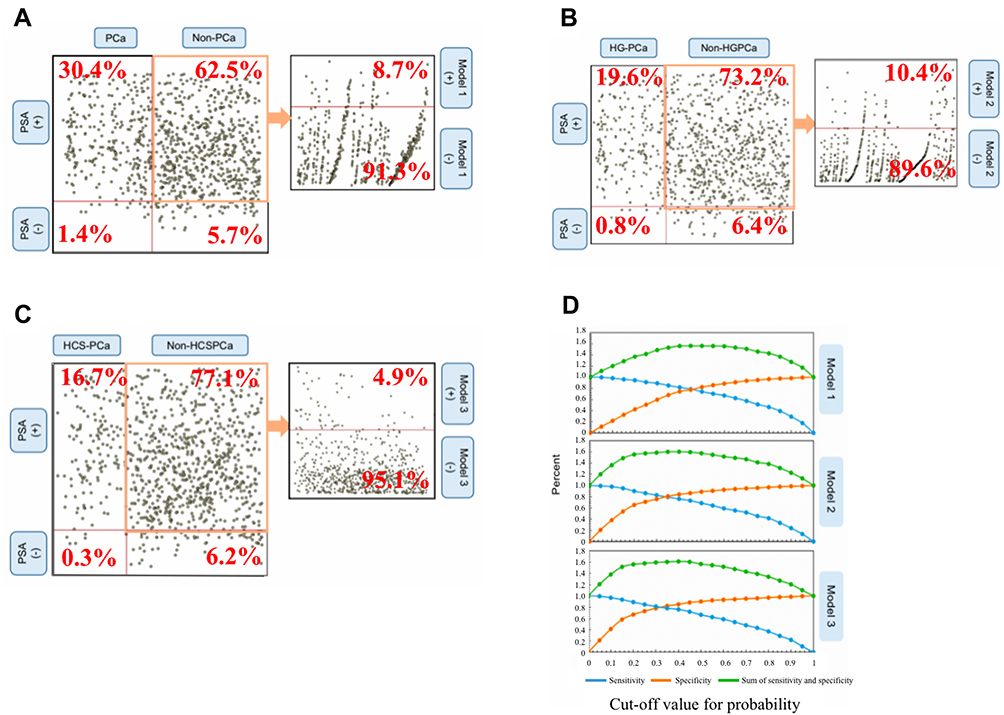 |
Figure 2 Distribution of patients with different clinicopathology in the test of PSA with 20 ng/mL or less and the distribution of patients with non-PCa (A), non-HGPCa (B) or non-HCSPCa (C) in predicted models, and the estimated sensitivity, specificity and the sum of sensitivity and specificity in different cut-off point for the predicted probability (D). |
We used the AUC and DCA to demonstrate the performance of predicting PCa, HG-PCa and HCS-PCa in the training cohort and validation cohort (Figure 3 and Table 3). Besides, NRI was employed to show the ability of correctly reclassifying the patients. Comparing to the PSA, model 1, model 2 and model3 can, respectively, make the 42.9%, 54.1% and 55.5% patients reclassified correctly, Table 3. Moreover, we used scatter plots to show the predicted model that can reduce the over-diagnosis associated with PSA screening, as shown in Figure 2.
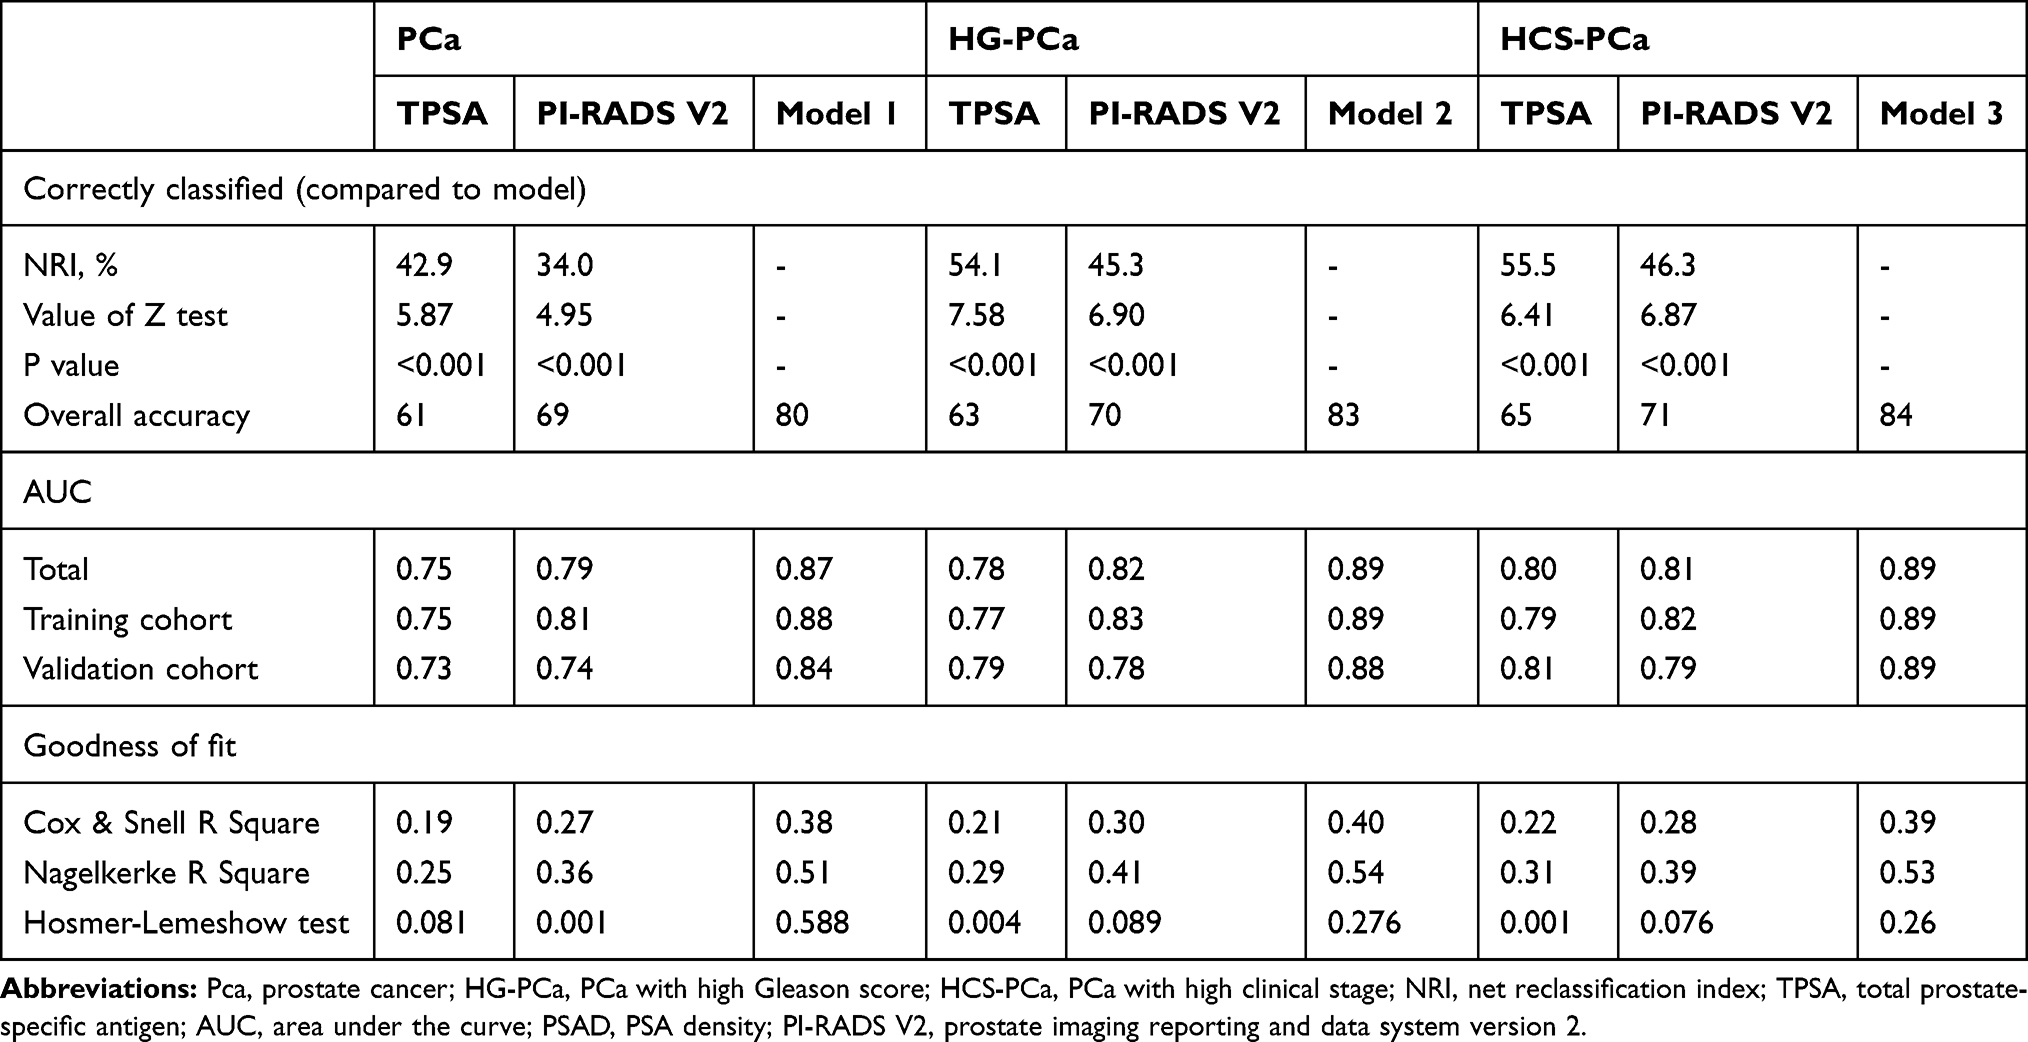 |
Table 3 Predicted Performance of Model for PCa, HG-PCa and HCS-PCa in Validation Cohort |
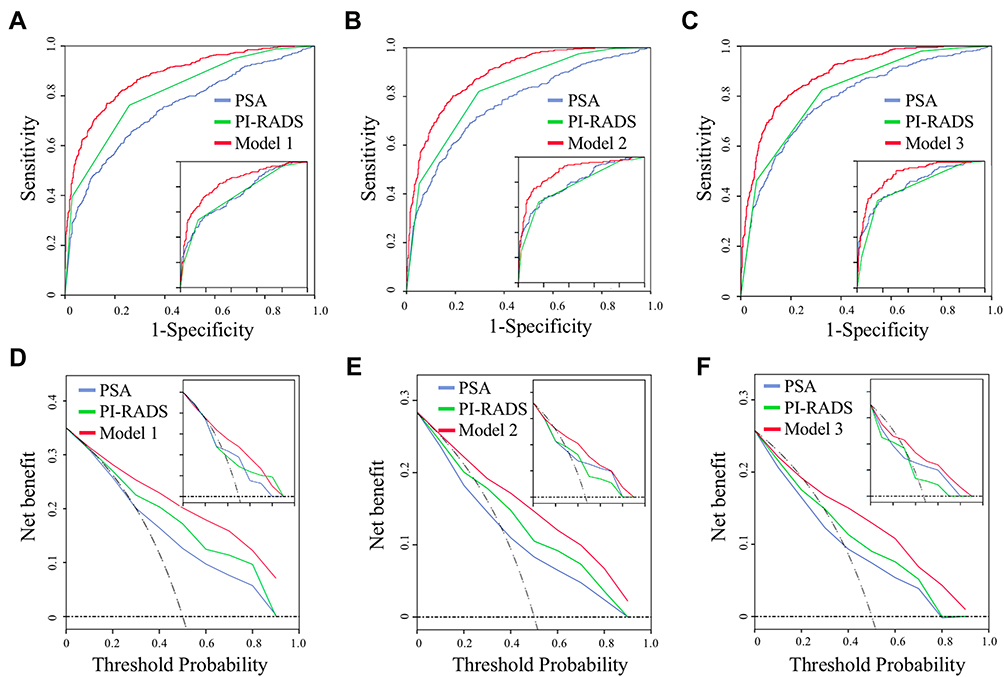 |
Figure 3 The area under the curve (AUC) of model 1 (A), model 2 (B) and model 3 (C) and the decision curve analysis of model 1 (D), model 2 (E) and model 3 (F) were used to show the predictive performance in the training cohort and validation cohort (at the bottom right or top right corner of the graphs). |
Goodness of Fit and Calibration
In order to know the predictive accuracy, we used the calibration curves to exhibit the gap between the actual risk and the predicted risk, and the distribution of patients in different predicted probabilities is shown in Figure 4. In addition, Cox & Snell R Square, Nagelkerke R Square and Hosmer-Lemeshow test were utilized to state the overall efficiency and goodness of fit, as shown in Table 3.
 |
Figure 4 Calibration curves for the predicted tools and the frequency of patients in different predicted probabilities was shown at the bottom of the graphs, separating those with (+) and without (−) PCa, HG-PCa or HCS-PCa. |
Discussion
Recently, PCa is getting more attention due to the high incidence and the prognosis greatly varies from the pathological characteristics.10–12 As the ceaseless increase of the researches about the clinical outcomes for the patients who had the same stage of pathology but received different treatment (active surveillance, radical prostatectomy and androgen deprivation therapy), urologists are gradually developing a consensus on the treatment for patients with different clinicopathological characteristics.13 There were studies that have demonstrated that the low-risk PCa (L-PCa) achieved the giant benefit from active surveillance and its incidence of recurrence was less than 25% at 5 years post treatment.5,14–17 Therefore, it is also quite important to rationally use this application for clinicopathological assessment prior to biopsy in patients with risk of PCa. However, at present, most studies only focused on the model of predicting PCa or HG-PCa. To our best knowledge, there were few developed models that can simultaneously provide the probability of PCa and HG-PCa. This calculator can solve the aforementioned issue with the method of assessing the risk of PCa with high clinical stage. As with other predictive models, such as Korean Prostate Cancer Risk Calculator (KPCRC), European Randomized Study for Screening of Prostate Cancer Risk Calculator (ERSPCRC) and Prostate Cancer Prevention Trial Risk Calculator (PCPT-RC), PCCRC can provide the probability of suffering from PCa. Besides, PCCRC also can evaluate the Gleason score and clinical stage that were the important component of D’Amico risk classification. If we can obtain information revealing the high risk of having PCa for a patient by using the PCCRC or other calculators, what advice can we give this patient? Undergoing the biopsy or following the active surveillance? At this time, the evaluation for the Gleason score and clinical stage obtained by PCCRC can give urologists some references to make an appropriate decision. For example, urologists, with full respect for the patient’s wishes, recommend active surveillance for patients with a high possibility of PCa (0.53 or higher) but with low possibility of HG-PCa (0.38 or lesser) and a low possibility of HCS-PCa (0.40 or lesser). As we know, the missed diagnosis of HG-PCa or HCS-PCa may have a more serious impact on prognosis. So, to reduce the rate of missed diagnosis of HG-PCa or HCS-PCa, we can appropriately decrease the cut-off value of model 2 and model 3 for patients with a high possibility of PCa. As shown in Figure 2D, with the cut-off value decreasing, the sensitivity was raising. The sensitivity can arrive at 90% when the cut-off value was 20% for model 2 and model 3.
Compared with other published predictive models, this calculator was important from both medical and patients’ standpoints, as not only can it promote the diagnostic performance but also can provide a dynamic observation platform for patients so that they can participate in the management of their disease. The investigation from America has stated that only 4–20% of patients that met the standards of active surveillance were willing to select the treatment of active surveillance, which due to the limitations of existent predictive methods and the patients’ uncertainty about their disease progression.15–18 Now, patients can use the PCCRC to self-assess the changes of PCa risk conveniently. During the follow-up, if the results of the self-assessment continue to worsen, he should go to the hospital for further assistant. In addition, some patients with benign findings in the first biopsy still have the abnormally tested results, such as PSA, FPSA and MRI. So these patients also can apply this calculator to evaluate the progress of PCa risk. Notably, if the results obtained from the calculator are getting worse, the second prostate biopsy should be further performed to avoid the false negative stemmed from the first biopsy.
For patients that were diagnosed as PCa by biopsy pathology, the presence or absence of bone metastasis that is usually diagnosed by radionuclide bone scans is an important reference to the development of the subsequent treatment plan.19 There were studies and guidelines recommended that PCa patients with PSA 20 ng/mL or greater, locally advanced disease, or Gleason score 8 or greater are at higher risk of bone metastases and should be considered for a bone scan to exclude the bone metastasis.19,20 However, the detection rates of bone metastasis in patients with PSA levels from 20 to 50 were 16.2% and in patients with Gleason score up to 8 or greater were 29.9%.21 Therefore, using Gleason scores rather than the PSA levels as a reference can reduce the over-diagnosis caused by bone scan. PCCRC can evaluate the risk of high Gleason scores and high clinical stage for patients with high PSA levels (more than 20ng/mL), which can offset the over-diagnosis caused by PSA.
Undeniably, the PSA, PSAD, F/TPSA, DRE and PI-RADS were still regarded as the initial measures to screen the patients at the risk of PCa. However, PCCRC was composed of six risk factors, including age, TPSA, FPSA, F/TPSA, PV and PI-RADS V2. The first use of PCCRC, which simultaneously requires the above six factors, to screen for PCa would entail a huge economic burden. Therefore, our application “PCCRC” was only used for people that were at the risk of PCa tested by PSA, F/TPSA, DRE or PI-RADS V2.
PSAD is an ideal and important index in forecasting the PCa, especially for the men with the PSA level from 4 to 10 ng/mL.22,23 However, PSAD was not included in PCCRC. Because PSAD was calculated by PSA and PV so that PSAD was strong covariates with PSA, which also was verified by multivariate analysis. Other studies in this field often selected one of these to participate in their models to reduce the structural error.
Admittedly, there are still several limitations in this study as follows. Firstly, the training cohort and validation cohort both stemmed from a single-center, which needs a multicenter study to further validate the performance. Besides, it was a retrospective study, and the conclusions and efficiency obtained in this research should be verified by a prospective study, which also is what we are going to prepare for. Additionally, the clinicopathology, including the Gleason score and clinical stage, was evaluated relying on MRI examination and pathology obtained by TRUS biopsy rather than post-prostatectomy pathology. So the limitations of the TRUS biopsy and MRI itself can also bias the results.24
Conclusion
Our findings demonstrated that PCCRC not only can predict the risk of PCa but also can evaluate the risk of HG-PCa and HCS-PCa, which can provide a dynamic observation platform for patients to enable them know the progress of PCa, so as to better participate in the management of their disease.
Ethical Statement
The authors are accountable for all aspects of the work in ensuring that questions related to the accuracy or integrity of any part of the work are appropriately investigated and resolved. The Ethics Committees regarding Human Research of the First Affiliated Hospital of Anhui Medical University approved this study, which approved number was PJ-20,170,906. The patient data in this study accessed complied with relevant data protection and privacy regulations. In addition, this study belonged to retrospective research, which just collected previous data from electronic system and exclude any tissue samples and other from human or animal so that it is not an application for the informed consent for study participation, which also was released from the ethics committee.
Acknowledgments
This work was financially supported by the National Natural Science Foundation of China (81630019, 81870519) and Scientific Research Foundation of the Institute for Translational Medicine of Anhui Province (2017ZHYX02).
Disclosure
All authors declared no competing interests.
References
1. Siegel RL, Miller KD, Jemal A. Cancer statistics, 2018. CA Cancer J Clin. 2018;60(1):7–30. doi:10.3322/caac.21442
2. Kato M, Kimura K, Hirakawa A, et al. Prognostic parameter for high risk prostate cancer patients at initial presentation. Prostate. 2018;78(1):11–16. doi:10.1002/pros.23438
3. Gershman B, Van Houten HK, Herrin J, et al. Impact of prostate-specific antigen (PSA) screening trials and revised PSA screening guidelines on rates of prostate biopsy and postbiopsy complications. Eur Urol. 2017;71(1):55–65. doi:10.1016/j.eururo.2016.03.015
4. Boorjian SA, Karnes RJ, Rangel LJ, et al. Mayo clinic validation of the D’amico risk group classification for predicting survival following radical prostatectomy. J Urol. 2008;179(4):1354–1361. doi:10.1016/j.juro.2007.11.061
5. Tosoian J, Mamawala M, Epstein J, et al. Intermediate and longer-term outcomes from a prospective active-surveillance program for favorable-risk prostate cancer. J Clin Oncol. 2015;33(30):3379–3385. doi:10.1200/JCO.2015.62.5764
6. Harlan SR, Cooperberg MR, Elkin EP, et al. Time trends and characteristics of men choosing watchful waiting for initial treatment of localized prostate cancer: results from CaPSURE. J Urol. 2003;170(5):1804–1807. doi:10.1097/01.ju.0000091641.34674.11
7. Cooperberg MR, Broering JM, Carroll PR. Time trends and local variation in primary treatment of localized prostate cancer. J Clin Oncol. 2010;28(7):1117–1123. doi:10.1200/JCO.2009.26.0133
8. Paner GP, Stadler WM, Hansel DE, et al. Updates in the eighth edition of the tumor-node-metastasis staging classification for urologic cancers. Eur Urol. 2018;73(4):560–569. doi:10.1016/j.eururo.2017.12.018
9. Hui W, Sheng T, Li Z, et al. Integrated formulas to forecast prostate cancer: the parameters of influencing the prostate specific antigen level as an adjunct to prostate specific antigen and multi-parametric MRI to predict prostate cancer before biopsy. Transl Cancer Res. 2017;6(6):1180–1187. doi:10.21037/tcr.2017.11.17
10. Egevad L, Granfors T, Karlberg L, et al. Prognostic value of the Gleason score in prostate cancer. BJU Int. 2002;89(6):538–542. doi:10.1046/j.1464-410X.2002.02669.x
11. Mai AH, Chen MH, Wu J, et al. Gleason score 3 + 5 or 5 + 3 versus 4 + 4 prostate cancer: the risk of death. Eur Urol. 2016;69(6):976–979. doi:10.1016/j.eururo.2015.08.054
12. Gu X, Gao X, Cui M, et al. Survival outcomes of radical prostatectomy and external beam radiotherapy in clinically localized high-risk prostate cancer: a population-based, propensity score matched study. Cancer Manag Res. 2018;10:1061–1067. doi:10.2147/CMAR.S157442
13. Zietman A, Smith J, Klein E, et al. Consensus guidelines for reporting prostate cancer gleason grade. BJU Int. 2016;118(3):179–180.
14. Hayes JH, Ollendorf DA, Pearson SD, et al. Active surveillance compared with initial treatment in men with low-risk prostate cancer: a decision analysis. JAMA. 2010;304(21):2373–2380. doi:10.1001/jama.2010.1720
15. Garisto JD, Klotz L. Active surveillance for prostate cancer: how to do it right. Oncology. 2017;31(5):333–345.
16. LaPpenberg B, Friedlander DF, Krasnova A, et al. Variation in the use of active surveillance for low-risk prostate cancer. Cancer. 2018;124(1):55–64. doi:10.1002/cncr.30983
17. Choyke PL, Loeb S. Active surveillance of prostate cancer. Oncology. 2017;31(1):67.
18. Womble PR, Montie JE, Ye Z, et al. Contemporary use of initial active surveillance among men in Michigan with low-risk prostate cancer. Eur Urol. 2015;67(1):44–50. doi:10.1016/j.eururo.2014.08.024
19. Brigantia A, Ferrari M, Capitanio U, et al. When to perform bone scan in patients with newly diagnosed prostate cancer: external validation of the currently available guidelines and proposal of a novel risk stratification tool. Eur Urol. 2010;57(4):551–558. doi:10.1016/j.eururo.2009.12.023
20. Shen G, Deng H, Hu S, et al. Comparison of choline-PET/CT, MRI, SPECT, and bone scintigraphy in the diagnosis of bone metastases in patients with prostate cancer: a meta-analysis. Skeletal Radiol. 2014;43(11):1503–1513. doi:10.1007/s00256-014-1903-9
21. Abuzallouf S, Dayes I, Lukka H. Baseline staging of newly diagnosed prostate cancer: a summary of the literature. J Urol. 2004;171(6Pt1):2122–2127. doi:10.1097/01.ju.0000123981.03084.06
22. Nordstrom T, Akre O, Aly M, et al. Prostate-specific antigen (PSA) density in the diagnostic algorithm of prostate cancer. Prostate Cancer Prostatic Dis. 2018;21(1):57–63. doi:10.1038/s41391-017-0024-7
23. Simaioforidis V, Mitsios K, Doumanis G, et al. S28 the prognostic role of PSA density in the detection of prostate cancer in men with PSA 4–10 ng/mL and negative both digital rectal examination and transrectal ultrasound. Eur Urol Suppl. 2009;8(8):616. doi:10.1016/S1569-9056(09)74909-7
24. Kvale R, Moller B. Concordance between Gleason scores of needle biopsies and radical prostatectomy specimens: a population―based study. BJU Int. 2010;103(12):1647–1654.
 © 2020 The Author(s). This work is published and licensed by Dove Medical Press Limited. The
full terms of this license are available at https://www.dovepress.com/terms
and incorporate the Creative Commons Attribution
- Non Commercial (unported, 3.0) License.
By accessing the work you hereby accept the Terms. Non-commercial uses of the work are permitted
without any further permission from Dove Medical Press Limited, provided the work is properly
attributed. For permission for commercial use of this work, please see paragraphs 4.2 and 5 of our Terms.
© 2020 The Author(s). This work is published and licensed by Dove Medical Press Limited. The
full terms of this license are available at https://www.dovepress.com/terms
and incorporate the Creative Commons Attribution
- Non Commercial (unported, 3.0) License.
By accessing the work you hereby accept the Terms. Non-commercial uses of the work are permitted
without any further permission from Dove Medical Press Limited, provided the work is properly
attributed. For permission for commercial use of this work, please see paragraphs 4.2 and 5 of our Terms.