Back to Journals » International Journal of General Medicine » Volume 14
Development of a Prognostic Nomogram for Acute Myeloid Leukemia on IGHD Gene Family
Authors Qiu Q ![]() , Zhang P, Zhang N
, Zhang P, Zhang N ![]() , Shen Y, Lou S, Deng J
, Shen Y, Lou S, Deng J
Received 29 April 2021
Accepted for publication 15 July 2021
Published 10 August 2021 Volume 2021:14 Pages 4303—4316
DOI https://doi.org/10.2147/IJGM.S317528
Checked for plagiarism Yes
Review by Single anonymous peer review
Peer reviewer comments 2
Editor who approved publication: Dr Scott Fraser
Qunxiang Qiu,1,* Ping Zhang,2,* Nan Zhang,1 Yan Shen,1 Shifeng Lou,1 Jianchuan Deng1
1Department of Hematology, The Second Affiliated Hospital of Chongqing Medical University, Chongqing, 400010, People’s Republic of China; 2Hematology Laboratory, The Second Affiliated Hospital of Chongqing Medical University, Chongqing, 400010, People’s Republic of China
*These authors contributed equally to this work
Correspondence: Jianchuan Deng
Department of Hematology, The Second Affiliated Hospital, Chongqing Medical University, 76 Linjiang Road, Chongqing, 400010, People’s Republic of China
Email [email protected]
Purpose: Acute myeloid leukaemia (AML) is a common haematological disease in adults. The overall survival (OS) remains unsatisfactory. It is critical to identify potential prognostic biomarkers and develop a nomogram that predicts overall survival in patients with AML.
Patients and Methods: We used gene expression dataset and clinical data from The Cancer Genome Atlas (TCGA) and Genotype-Tissue Expression (GTEx) to identify differential expression analysis, survival analysis, and prognostic value of IGHD gene family (IGHDs) in AML patients. A risk score model was built through Lasso analysis and multivariate Cox regression. We also developed a nomogram and evaluated its accuracy with Harrell’s Harmony Index (C-index) and calibration curve. Last, the Therapeutically Applicable Research to Generate Effective Treatments (TARGET) database was used for external validation.
Results: IGHD1-20 mRNA expression level was an independent prognostic factor for patients with AML by multivariate analysis. After Lasso analysis and multivariate Cox regression, we constructed a 3-gene model (IGHD1-1, IGHD1-20, IGHD3-16) associated with OS in AML. Risk score and age were validated as independent risk factors for prognosis and were used to build a nomogram. The C index and calibration curve results show that its ability to predict 1-year, 3-year and 5-year overall survival is accurate.
Conclusion: The mRNA level of IGHDs was increased in AML patients. IGHD1-20 was an independent risk factor for OS in AML patients. The IGHDs risk model (IGHD1-1, IGHD1-20, IGHD3-16) relates to the OS of AML patients. The nomogram, including risk score and age, can conveniently and effectively predict the overall survival rate of patients.
Keywords: acute myeloid leukaemia, IGHD gene family, IGHD1-20, prognosis
Introduction
Acute myeloid leukaemia (AML) is a malignant disease in which hematopoietic stem cells differentiate abnormally in the hematopoietic system, which leads to clonal expansion of primordial cells. Then abnormal primordial cells are accumulated at different stages of immaturity, which leads to the decrease of normal erythrocyte, leukocyte, and platelets, and then produces symptoms such as fatigue, dyspnea, infection, bleeding, and so on. AML can occur at different ages, but the elderly are the most common, and studies have shown that the median age at diagnosis is 68 years old.1,2 60% to 85% of adults aged 60 or under can get a complete response after effective treatment. However, in elderly patients over 60, the complete remission rate is only 40% to 60%. Furthermore, most AML patients are prone to relapse within three years after diagnosis.3 Studies have shown that acute myeloid leukaemia is a disease with significant genetic heterogeneity, which refers to the accumulation of somatic acquired genetic changes in hematopoietic progenitor cells in AML patients, which will affect the standard mechanisms of self-renewal, proliferation, and differentiation. Moreover, the characteristic of this gene change is the most important feature that affects the prognosis of patients.4–6 Therefore, it is crucial to weigh disease-related and patient-related prognostic factors in determining the intensity of treatment. Thus, it is critical to developing practical, accurate biomarkers to evaluate the diagnosis and prognosis of patients with AML.
Studies on the expression frequency and level of Immunoglobulin γHeavy Chain (IgG) in AML showed that IgG was expressed in AML cell lines and primary myeloblasts with high frequency and high level, but not in monocytes and neutrophils of non-hematopoietic tumour patients and healthy controls. In further studies, IgG VH DJH transcripts were detected in AML cell lines and selected primary myeloid cells, verifying that IgG expression was produced by AML cells. AML-derived IgG gene rearrangements demonstrate excessive somatic mutation of variable gene fragments, as well as the use of restricted (acute myeloid leukaemia cell lines) or biased (primary myeloid cell lines) gene fragments. Anti-human IgG can decrease the survival rate of AML cells and induce their apoptosis. Although the function of AML-derived antibodies remains unclear, these findings imply that AML-derived antibodies may be a novel AML-associated gene that is involved in the genesis and development of leukemia.7
The genes encoding the variable region of the H chain of human immunoglobulin molecule are recombined by variable genes (IGHV), diversity genes (IGHD), and linked genes (IGHJ), and each gene is selected from the ordered cluster of IGHV, IGHD, and IGHJ genes located on chromosome 14 (14q32.33).8 To some extent, antibody diversity results from combinatorial diversity, resulting from the many permutations that can occur when these genes recombine, a process that is often thought to involve essentially random rearrangement of the V, D, and D J genes. Some studies suggest that there are both random and genetic mechanisms for generating antibody lineages.9–11 Studies have shown that because the IGHDs provide a vital part of the antigen-binding loop in the Immunoglobulin, its role in determining antigen-binding specificity should not be underestimated has shown that its expression data in normal B cells is minimal. Due to the very short IGHDs fragments, their sizes vary from 11 to 37 nucleotides, coupled with exonuclease activity and point mutation, the correct identification of IGHDs becomes relatively tricky.12 The locus of IGHDs was fully described and published not long ago, but now the development of high-throughput sequencing technology accelerates the further study of the human Ig gene and makes it possible for us to understand further and explore the role of the IGHDs in diseases.8,13
Studies have shown that because the IGHDs supplies a vital section of the antigen-binding loop in the Immunoglobulin, its role in the essential region of determining antigen-binding specificity should not be underestimated, and studies have displayed that its expression data in normal B cells is minimal.12,14,15 Although some researchers have noticed the abnormal expression of immunoglobulin gamma heavy chain (IgG) in AML, the studies on human immunoglobulin heavy-chain IGHD gene repertoire abnormal expression and prognosis are still few. This study will retrospectively analyze and study the survival prediction value of the expression level of the IGHDs in AML based on the considerable sample information from the public database.
Patients and Methods
Transcriptome Data and Clinical Information
The workflow of the development of a prognostic nomogram for acute myeloid leukaemia on the IGHD gene family is shown in Figure 1. First, we downloaded the GTEx gene expression dataset, the TCGA acute leukaemia gene expression dataset, and the corresponding sample information from the University of California Santa Cruz (UCSC) genome database. Then, we extracted the gene expression data of normal bone marrow samples (70 samples) from the GTEx gene expression dataset and AML samples (151 samples) from the TCGA gene expression dataset. The LIMMA software package was used to merge the expression data of the two gene databases for standardized processing, and the expression of IGHDs was extracted for subsequent analysis.
 |
Figure 1 Workflow of the study. |
Differential Expression Analysis of IGHDs
Extracted from the transcriptome sequencing data, IGHDs quantity data, using R language limma packet analysis, identified the 32 family genes differentially expressed in AML and normal bone marrow. An absolute log2-fold change (|FC|) of > 1 and an adjusted P-value of < 0.05 were set as cut-off criteria. Clustering heat maps were drawn using the PHEATMAP software package in R language to show the expression of each gene in the sample.
Survival Analysis
Using R packet “Survminer” and “ Survival “, all IGHDs expression levels were stratified, and the patients were divided into high RNA expression levels groups and low RNA expression levels groups. Kaplan-Meier survival analysis was used to clarify the association between 5-year OS and IGHDs expression.
Build a Prognosis Model with IGHDs
The survival package was used to analyze the survival of IGHDs with differentially expressed genes (DEGs) in AML patients, and then the univariate Cox regression analysis was fitted, the P < 0.05 gene as a prognostic significance. The OS prognostic risk model was established by using Lasso-penalized and multivariate Cox regression analysis. A linear combination of regression coefficients obtained from multivariate Cox regression analysis multiplied by their model gene expression produced a prognostic risk score for all three genes.18,19 According to the median risk score (M), all patients were divided into high-risk and low-risk groups, and a risk heat map, risk curve, and survival status were drawn. Kaplan-Meier method was used to plot the survival curve of the IGHDs model, and the Log-Rank method was used to analyze the prognostic difference between the high-risk group and the low-risk group. Time-dependent receiver operating characteristic (ROC) curves were used to evaluate the ability of the IGHDs model to predict accuracy in 1 - year, 3 - year, and 5-year overall survival.
Independent Analysis of Risk Scores
After controlling for other confounding factors, gender, age, bone marrow blasts, haemoglobin, leukocyte, monocytes, and risk score of AML patients were included in univariate and multivariate Cox regression analysis to explore the effect of gender, age, bone marrow blasts, haemoglobin, leukocyte, monocytes, and risk score on prognosis.
Establishment and Evaluation of the Nomogram in the TCGA Dataset
We constructed the Nomograph based on the multivariate Cox regression analysis of the factors related to the significant prognosis of AML. We used the Hosmer-Lemeshow test to draw the calibration curve of the Nomograph to evaluate the prediction ability of the Nomograph in the queue. Harrell’s concordance index (C-index) was used to evaluate the discrimination performance of the Normogram quantitatively. The C-index is between 0. 5 and 1. The accuracy of the C-index between 0.50 and 0.70 is low, between 0.71 and 0.90 is medium accuracy, while higher than 0.90 is high accuracy.
Gene Ontology (GO) and the Kyoto Encyclopedia of Genes and Genomes (KEGG) Analysis
We performed gene ontology (GO) analysis of differentially expressed genes (DEGs) in patients with high-risk scores to evaluate the richness of biological process (BP), cellular component (CC), and molecular functional (MF) annotation. The Kyoto Encyclopedia of Genes and Genomes (KEGG) analysis is also used to annotate the signalling pathways associated with these genes. The “cluster profile” R software package was used for GO and KEGG enrichment, and the adjusted p-value less than 0.05 was regarded as the cutoff value. Use the “ggplot2” R software package to visualize the results of GO and KEGG analysis.
Correlation Analysis of Family Genes
We use R’s corrplot package to draw the correlation coefficient matrix of IGHDs obtained by calculating the correlation coefficient of family genes.
External Validation
We validate the nomogram via using expression data of the TARGET-AML gene expression dataset and the corresponding clinical information from the University of California Santa Cruz (UCSC) genome database.
Statistical Analyses
Data analysis and drawing are done by R3.6.1, GraphPadPrism 8.0.1, and SPSS software (version 23.0).
Results
Differential Expression of IGHDs in AML and Normal Bone Marrow
Download AML clinical information and calibrated AML gene expression data from the TCGA database. Moreover, normal bone marrow samples were from the GTEx. The expressions of IGHDs were extracted for differential analysis. The results indicated that all the 31 IGHDs were differentially expressed, and the expression was up-regulated in AML. Differential expression levels were visualized via a heatmap (pValue ≤ 0.05, Figure 2).
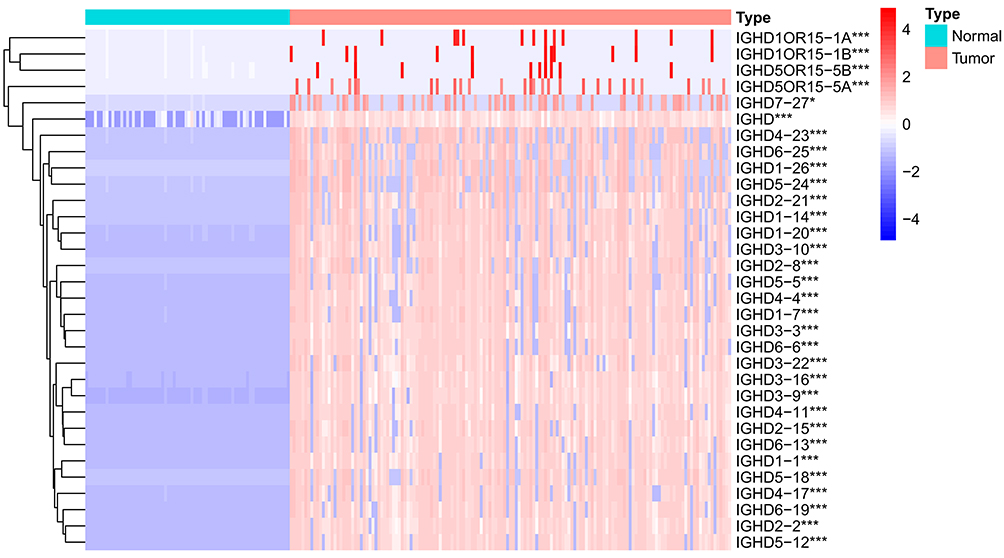 |
Figure 2 Heatmap of differential IGHDs. The blue, white, and red colors of the subject correspond to low, medium, and high expression. ***pValue <0.001; *pValue <0.05. |
The Effect of Abnormal IGHDs Expression on Survival in AML
All IGHDs expression levels were stratified, and the patients were divided into high RNA expression levels groups and low RNA expression levels groups according to the median value of IGHDs transcript expression. The median values of each IGHD family gene expression were shown as follows: IGHD1-1 4.99,IGHD1-20 4.36,IGHD2-2 4.12,IGHD2-15 3.98,IGHD3-3 5.64,IGHD3-10 4.39,IGHD3-16 5.49,IGHD6-19 5.03,IGHD2-8 3.75,IGHD2-21 2.84,IGHD3-9 4.99,IGHD3-22 3.45,IGHD6-25 3.28,IGHD4-17 4.51,IGHD5-12 5.17,IGHD6-13 4.75.
We next evaluate the prognostic effect of IGHDs expression on survival. By Kaplan-Meier analysis, patients with high IGHDs (IGHD1-1,IGHD1-20,IGHD2-2,IGHD2-15,IGHD3-3,IGHD3-10,IGHD3-16,IGHD6-19,IGHD2-8,IGHD2-21,IGHD3-9,IGHD3-22,IGHD6-25, IGHD4-17,IGHD5-12,IGHD6-13) expression showed high expression of IGHDs presented shorter OS than those with low expression of IGHDs among AML patients (pValue≤0.05, Figure 3). For other IGHDs transcripts, there was no difference in survival time between the high-expression and low-expression groups.
 |
Figure 3 Single-gene survival analysis of IGHD family members in AML patients. |
Analysis of Prognostic Value and Prognostic Model of IGHDs
The univariate Cox analysis of IGHDs was performed for these patients. The univariate analysis results showed that the effects of 13 differentially expressed IGHDs on the prognosis of patients with AML were statistically significant (pValue≤0.05), and these 13 genes were further analyzed as candidate genes. The multivariate analysis results displayed that IGHD1-20 was an independent influencing factor for patients with AML, and the prognosis of patients with high expression was worse (HR=1.47, 95% CI 1.03–2.11, pValue=0.035, Table 1). The 13 candidate genes selected by univariate Cox regression analysis were analyzed using the Lasso Cox selection method and multiple. Cox regression analysis (Figure 4A and B). As a result, the model was composed of three genes: IGHD1-1, IGHD1-20, and IGHD3-16. According to the regression coefficient of the prognostic model, the risk score formula of the IGHD gene family was obtained as follows: risk score = (0.565220138× IGHD1-20 expression) + (0.401795251× IGHD1-1 expression)-(0.695077172 × IGHD3-16 expression), as shown in Table 2. The risk score of each AML patient was computed in line with the risk score formula. All patients were separated into high-risk group (risk score≥M) and low-risk group (risk score ≤ M) with the median risk value (M= 1.160621935) as a cutoff value. The results of Log-Rank displayed that the prognosis of the high-risk group was worse than that of the low-risk group (pValue ≤0.05), as shown in Figure 4C, There was significant variance in the survival curve between the high-risk group and low-risk group, and survival was significantly higher in the low-risk group than in the high-risk group. From the Area Under Curve (AUC) value of the ROC curve, it can be seen that the prediction model has high prediction accuracy (Figure 4D–F). In the risk heat map, the expression of each model gene increases with the increase of patient risk score, indicating that all IGHDs model genes are high-risk genes (Figure 4G). Figure 4H and I reflect patients’ risk score distribution and survival status distribution in high and low-risk groups. In general, the risk score curve does an excellent job of distinguishing between high-risk and low-risk groups (Figure 4H). On the risk score curve, the patient’s risk score increased from left to right. Survival time decreased, and mortality increased with increased patient risk scores, as displayed in Figure 4I. Finally, the sex, age, bone marrow blast cell, haemoglobin, leukocyte, monocyte, and risk score of AML patients were involved for univariate and multivariate analysis. Univariate and Multivariate analysis displayed that age and risk score were independent risk factors for the prognosis of patients with AML, and the patients with high scores had a poor prognosis (pValue ≤ 0.05, Figure 5A and B).
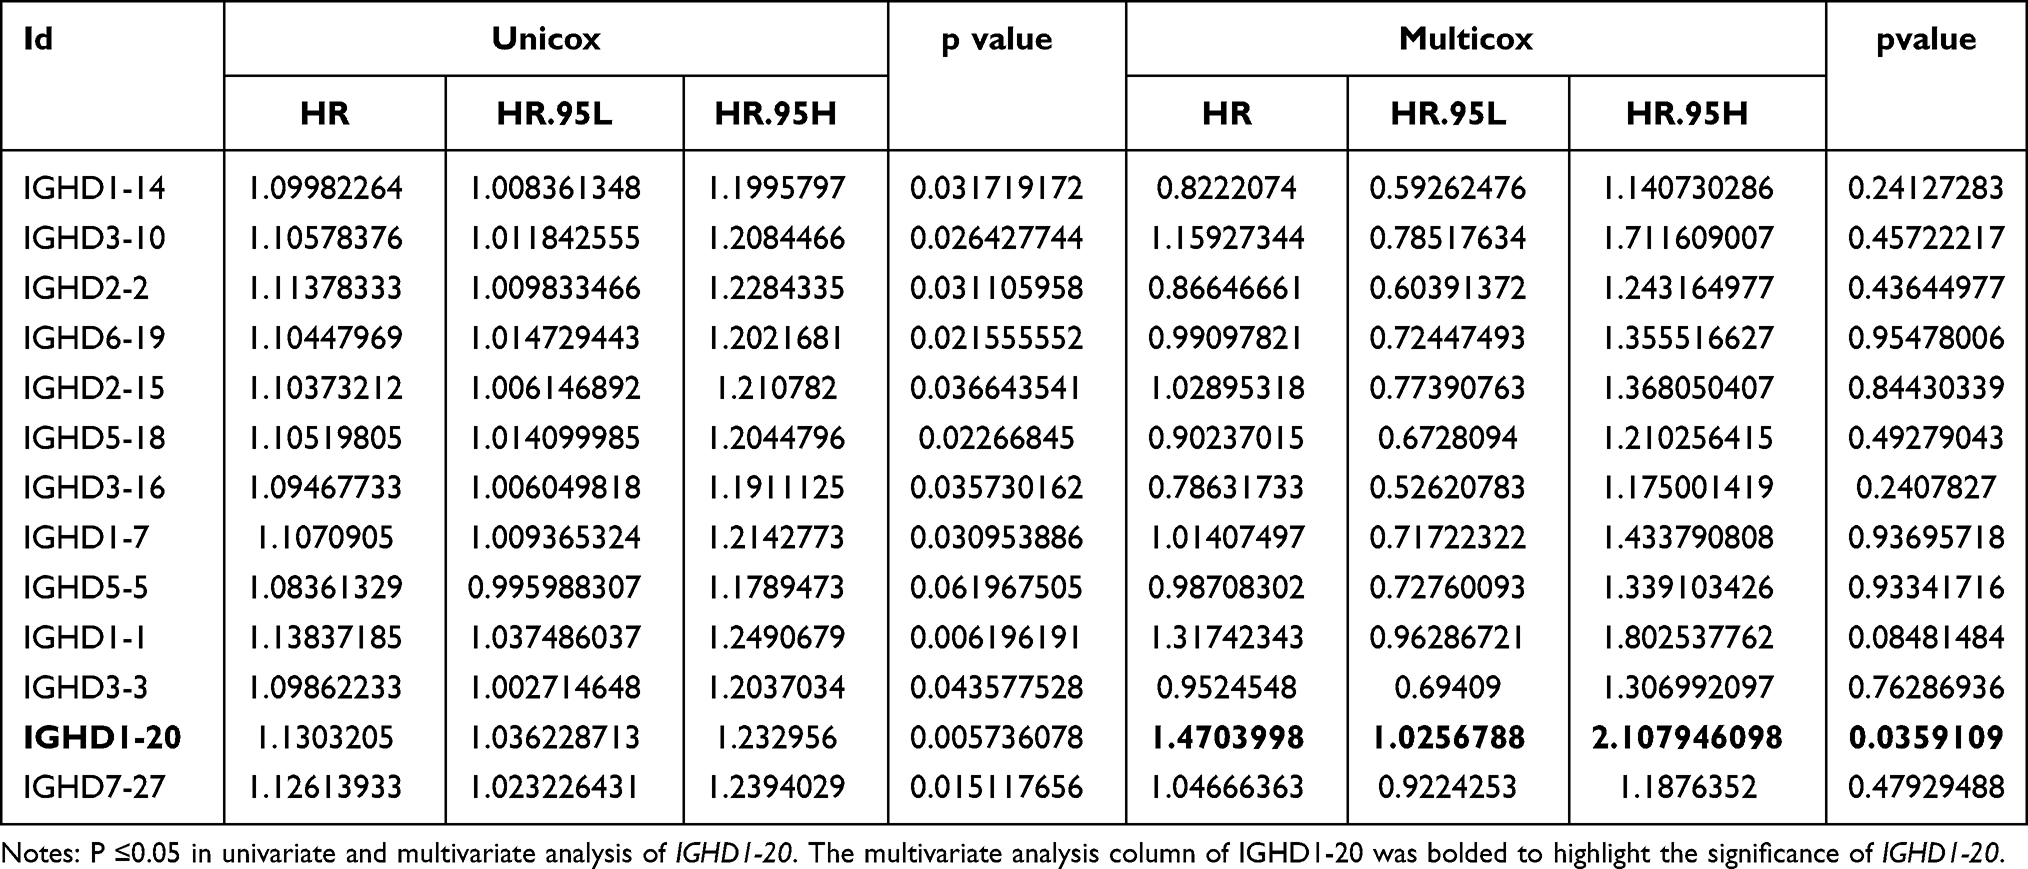 |
Table 1 Univariate and Multivariate Cox Regression Analysis Results of IGHDs |
 |
Table 2 Multiple Cox Regression Analysis of the Model Genes |
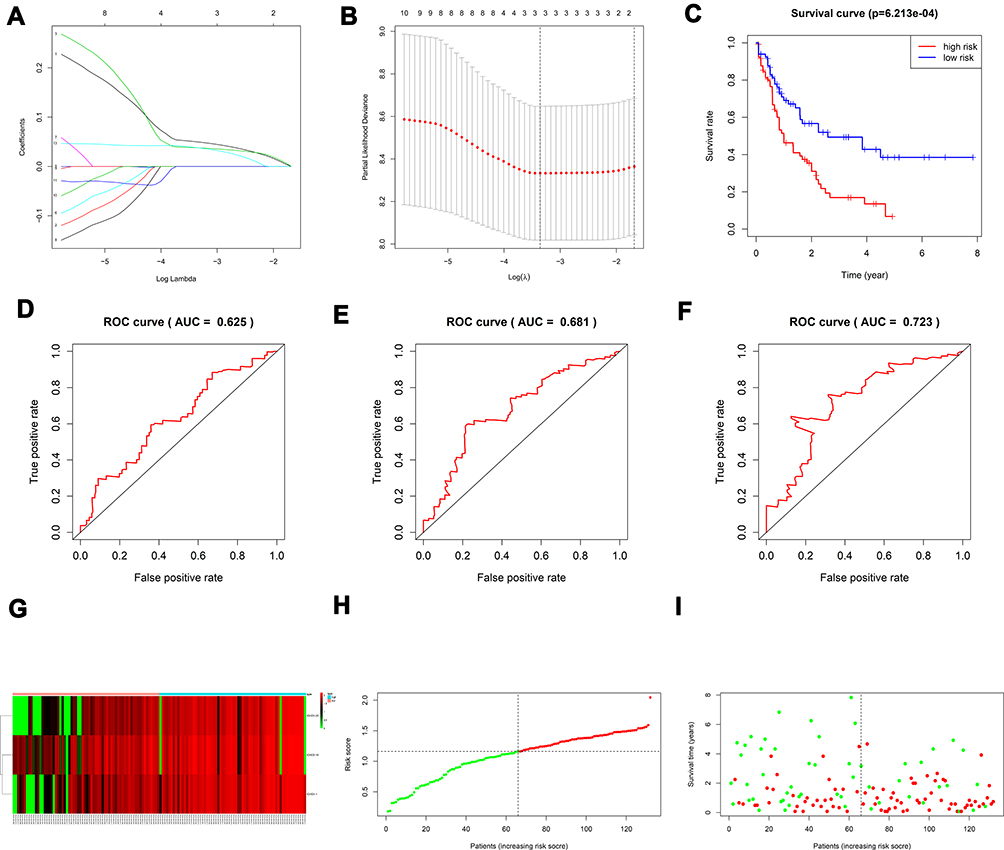 |
Figure 4 (A, B) Creation of the prognostic model based on LASSO algorithm; (C) the survival curve of patients in high and low risk groups; (D–F) the Area Under Curve (AUC) value of the ROC curve corresponding to 1 year, 3 years, and 5 years of IGHDs model; (G) risk heatmaps; (H) Risk score curves; (I) survival status figures. |
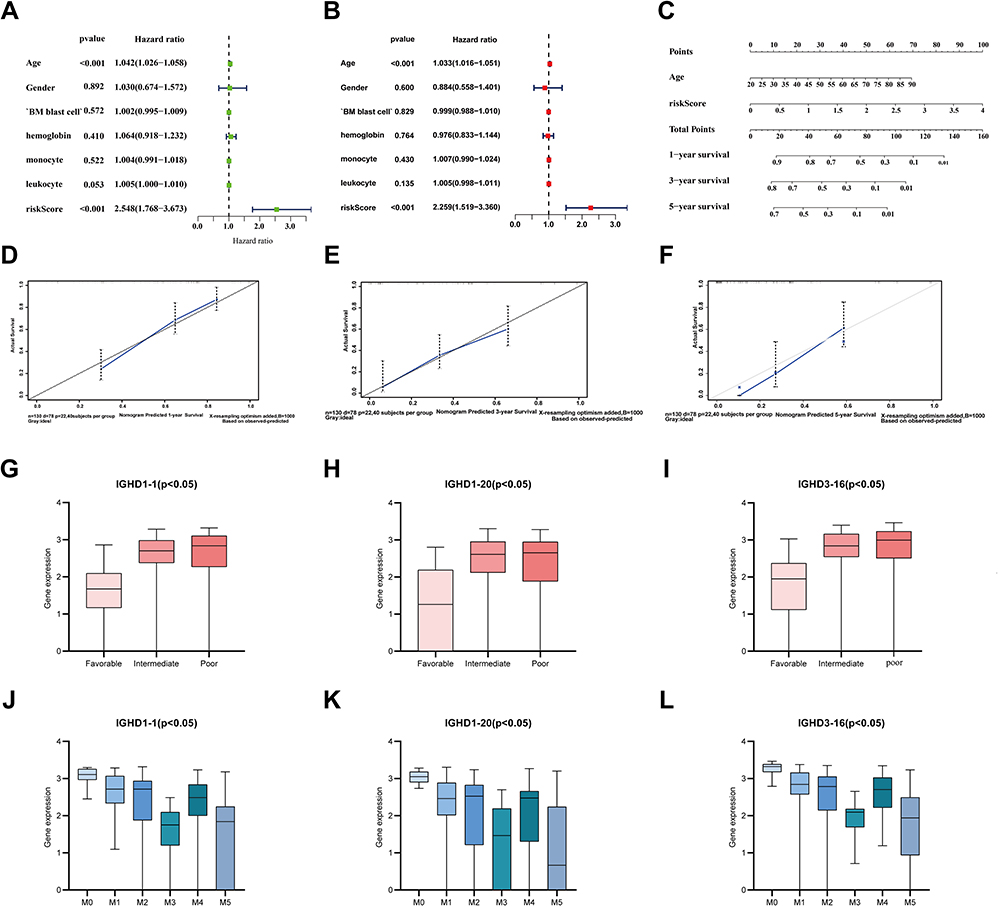 |
Figure 5 (A) Univariate prognostic analysis of TCGA-AML clinical indicators and risk scores (B) Multivariate prognostic analysis of TCGA-AML clinical indicators and risk scores. (C) Normogram for predicting 1-year, 3-year, and 5-year OS (D–F) Calibration curves of 1-year, 3-year and 5-year OS Black broken lines symbolizes the perfect predicted model, and the blue full line symbolizes the noticed model. (G–I) The expressions of model genes according to FAB classification in AML. (J–L) The expressions of IGHD1-1, IGHD1-20, IGHD3-16 between AML karyotype. |
Establishment and Evaluation of a Nomogram for OS Prediction in AML
Age and risk level were significant as critical predictive factors in univariate and multivariate regression analyses (Figure 5A and B). Considering all the essential predictors above, we have generated a comprehensive nomogram (Figure 5C). The C-index was 0.737. The calibration curve of the IGHDs model for the possibility of OS at 1 year, 3 years, and 5 years exhibited accurate predictive ability (Figure 5D–F).
Expression of Model Genes in Different Karyotypes
The European Leukemia Network divides patients into favourable, moderate, and risk groups in the stratification of acute leukaemia. We also analyzed the relationship between the IGHD1-1, IGHD1-20, IGHD3-16 expression and cytogenetic karyotype. The results displayed that patients in the favourable group had the lowest IGHD1-1, IGHD1-20, IGHD3-16 expression (pValue ≤0.05), and those in the poor group had the highest IGHD1-1, IGHD1-20, IGHD3-16 transcript expression (pValue ≤0.05, Figure 5G–I).
Expression of Model Genes in French-American and British (FAB) Subtypes of AML
We assayed the expression of model genes in the M0 to M5 FAB subtypes of 130 patients with acute myeloid leukaemia; only two patients with AML-M6 and only one patient with AML-M7 were not included in the analysis. We found that IGHD1-1, IGHD1-20, IGHD3-16 have higher expression in the AML-M0 subtype than in other subtypes.IGHD1-1 revealed that the lowest transcript expression was detected in AML-M3. IGHD1-20 transcripts showed lower expression of AML-M5 than other subtypes.AML-M3/M5 patients displayed a lower transcript expression of IGHD3-16 in contrast to that in other subtypes (Figure 5J–L).
Clinical Characteristics of IGHD1-20 in the High Expression Group and Low Expression Group
IGHD1-20 gene expression in AML patients can be regarded as an independent prognostic factor according to our multivariate regression analysis results. In order to compare the clinical characteristics of the IGHD1-20 high expression group and IGHD1-20 low expression group, All the clinical indicators, such as the age, bone marrow blast cell, peripheral leukocyte, peripheral monocyte, and haemoglobin of AML patients in the TCGA database, were segregated into IGHD1-20 high expression group and IGHD1-20 low expression group and analyzed by Nonparametric test. Fisher’s exact test was used to compare the differences in sex, FAB type, and karyotype between the high expression and low expression groups. In these patients, the age, haemoglobin, FAB type, and karyotype between the IGHD1-20 high expression group and IGHD1-20 low expression group were considerably different (pValue <0.05, Supplementary Table 1). However, the sex, bone marrow blast cell, peripheral leukocyte, or peripheral monocyte is not observed differences (pValue>0.05) of these patients with AML statistically.
Mutation Status of IGHDs and Their Correlation with Each Other
In order to evaluate the correlation between the IGHDs,we use R packet “ corrplot” to analyse. The result dispalyed that IGHD1-20 expression was related with IGHD1-14 (r = 0.91), IGHD1-1(r = 0.89). The expression of IGHD3-16 was discovered to be closely associated to that of IGHD1-1(r = 0.9), IGHD1-14(r = 0.92), IGHD1-20(r = 0.95), IGHD1-26(r = 0.82), IGHD1-7(r = 0.9), IGHD2-15(r = 0.92), IGHD2-2(r = 0.93), IGHD2-21(r = 0.86), IGHD2-8(r = 0.89) and IGHD3-10(r = 0.94) (Figure 6A).
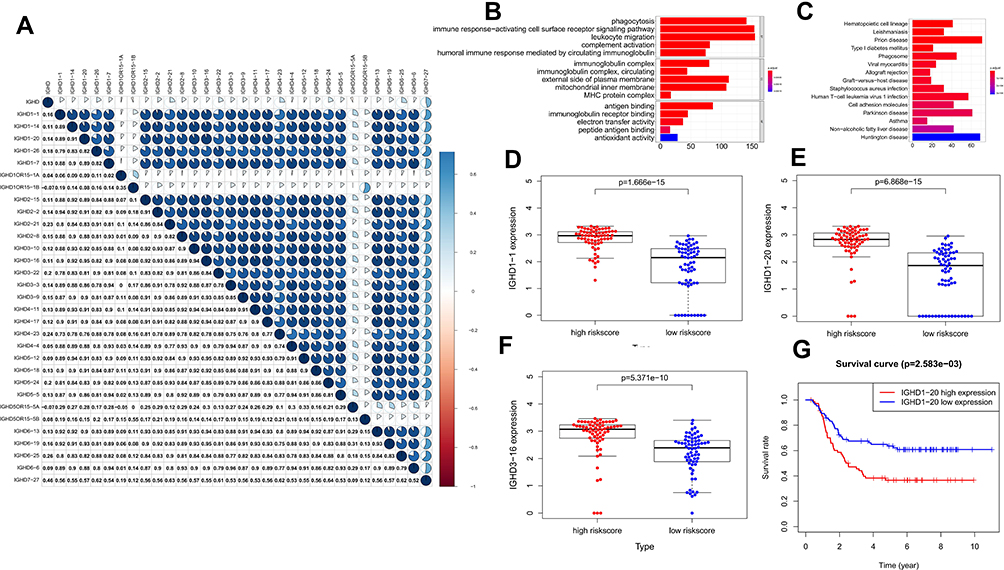 |
Figure 6 (A) The correlations of IGHDs with each other in AML. blue suggests positive correlation, Red suggests negative correlation, and the depth of color suggests the degree of correlation. Gene functional enrichment of differentially expressed in patients with high-risk scores. (B) Gene ontology analysis; (C) The top 15 most enriched KEGG pathways. (D–F) Boxplots for the difference confirmation of model genes. (G) Kaplan-Meier survival curve of IGHD1-20 in validation cohort using TARGET database. |
GO Analysis of DEGs in AML Patients with the High-Risk Score
GO analysis was used to investigate the functional characteristics of these DEGs in patients with high-risk scores, and they were sorted into the biological process (BP), cellular component (CC), and molecular functional (MF) annotation. As shown in Table 2, in the BP group, up-regulated genes were mainly enriched in phagocytosis (GO:0006909), immune response-activating cell surface receptor signalling pathway (GO:0002429), leukocyte migration (GO:0050900), complement activation (GO:0006956), and positive regulation of lymphocyte activation (GO:0051251). In the CC group, up-regulated genes were mainly enriched in immunoglobulin complex (GO:0019814, GO:0042571), external side of plasma membrane (GO:0009897), mitochondrial inner membrane (GO:0005743), and MHC protein complex (GO:0042611). In the MF group, up-regulated genes were mainly enriched in antigen binding (GO:0003823), immunoglobulin receptor binding (GO:0034987), electron transfer activity (GO:0009055), and peptide antigen binding (GO:0042605). These data imply that the identified DEGs in AML patients with the high-risk score are mainly enriched in immune response (Supplementary Table 2, Figure 6B).
Signaling Pathway Enrichment Analysis
We conducted a pathway enrichment analysis of AML patients with high-risk scores by KEGG further to understand the biological changes in the disease course. KEGG pathways enrichment analysis indicated that those DEGs were enriched in Hematopoietic cell lineage, Phagosome, Human T-cell leukaemia virus 1 infection, and Cell adhesion molecules (Supplementary Table 3, Figure 6C).
Multiple Validations of Model Genes
Boxplots of IGHD1-1, IGHD1-20, and IGHD3-16 were drawn to verify the expression differences of IGHD1-1, IGHD1-20, and IGHD3-16 between the high-risk score and low-risk score groups. Figure 6D–F reflect that the expression levels of IGHD1-1, IGHD1-20, and IGHD3-16 in the high-risk score group are higher than those in the low-risk score group. IGHD1-1, IGHD1-20, and IGHD3-16 are considerably highly expressed in the high-risk score group, which proves the inference that they are all high-risk genes to a certain extent.
The prognostic value of IGHDs and the IGHDs risk score model were confirmed using the TARGET database. The 278 patients with AML were selected from the TARGET database to explore the prognostic value of IGHDs and evaluate the IGHDs risk score model. By Kaplan-Meier analysis, patients with high IGHD1-20 expression had shorter OS than those with low expression of IGHD1-20 among AML patients (pValue≤0.05, Figure 6G). Univariate COX analysis showed that IGHD1-20 was a prognostic factor in patients with AML (pValue=0.002).We used the IGHDs risk score model (risk score = 0.565220138095178* IGHD1-20 + 0.401795250677606* IGHD1-1 - 0.695077172034113*IGHD3-16) created to compute the risk score of each AML patient. According to the median value, the risk score model could classify the patients in the TARGET database into high-risk groups and low-risk groups. Patients with high-risk groups had shorter OS than those with low-risk groups among AML patients (pValue≤0.05, Figure 7A). The nomogram calibration curves for the possibility of 1-year, 3-year, and 5-year OS exhibited apparent concordance between the forecast outcomes and observations in the TARGET database (Figure 7B–D). The validation results are similar to those in the TCGA queue.
 |
Figure 7 Validation of the prediction model. (A) the survival curve of patients in high and low risk groups. (B–D) Calibration curve for the risk score model using TARGET database. |
Discussion
In the past few decades, the high heterogeneity of AML has posed considerable challenges to risk stratification.20 The next-generation sequencing technology advanced in recent years adopts the whole genome sequencing method, which carries enormous benefits to multi-population data mining.21 As the second generation sequencing technology, such as the application of the molecular targets of AML, is becoming more and more and further lead to the speedy advancement of targeted drugs, not only that, the second-generation sequencing technology can be used to excavate potential biomarkers, and is used to predict the prognosis of patients with AML results, and select the appropriate treatment strategy, reduce the financial burden on patients and their families.22 Many studies using bioinformatics analysis have suggested the relationship between gene transcriptome characteristics and the prognosis of AML.23–30
There is growing evidence that Immunoglobulin (Ig) is expressed at a high level in cancer cells, and this type of Ig has been named cancer-derived Immunoglobulin. Cancer-derived immunoglobulin plays a profound pro-tumour role by promoting the malignant behaviour of cancer cells, mediating tumour immune escape, inducing inflammation, and other mechanisms. Importantly, cancer-derived immunoglobulins show potential applications as diagnostic and therapeutic targets for cancer patients.31 Studies have shown that AML-derived IgG may be related to the occurrence of leukaemia and the progression of AML.
We have proved that IgH rearrangement (VH-D, D-JH) is the core of antibody diversity. The recombination site largely determines the specificity of antibodies called the third complementary determining region (CDR3), Because the IGHD gene is involved in complementary determination region 3 (CDR3), CDR3 covers the connection between V, D and J genes.10,32,33 Most of the diversity seen in the third complementary determination region (CDR3) is caused by IGHD fragments and joints formed by changes injunctions and N fragments during D-JH and VH-D rearrangements. The mechanism of regulating rearrangement is considered to follow the rule of 12/23, in which D-D or VH-JH rearrangement is excluded. However, The V (DD) J recombination conjecture put forward in the study of Kurosawa and Tonegawa in 1982.34 Meek KD’s research reveals for the first time that D-D fusions do take place, either a direct rearrangement or an inverted rearrangement. The resulting fusion D segment may be fully capable of being carried out in subsequent D-JH and VH-D rearrangements. V (DD) J recombination integrates two IGHD genes into a super-long CDR3 (or tandem CDR3) with tandem fusion IGHD gene. Briney BS also proved that tandem CDR3s do exist.36 Our analysis showed that, except for IGHD4OR15-4A, and IGHD4OR15-4B, all IGHDs were up-regulated in patients with Acute Myeloid Leukemia compared with normal controls. The existence of the V (DD) J recombination phenomenon proves the rationality of the up-regulation of all IGHDs in our patients with acute myeloid leukaemia. We also found out that the expression of IGHD1-20 was considerably increased in AML. Compared with the low expression of IGHD1-20, the prognosis of high expression of IGHD1-20 was significantly worse, and IGHD1-20 was also an independent prognostic factor.
We found that the transcript expression of IGHD1-1, IGHD1-20, IGHD3-16 was considerably distinct in different AML subtypes. The expression of these three genes was the highest in AML-M0. The mechanism of this correlation needs further study. Besides, we evaluated the IGHDs model as a predictor of the risk of acute myeloid leukaemia. Risk stratification for age and genetic characteristics of AML was considered. The expression of IGHD1-1, IGHD1-20, and IGHD3-16 transcripts in the high-risk group was significantly higher than that in the low-risk group. Multivariate cox analysis showed that IGHD1-20, risk stratification were independent risk factors. Despite these results, few reports of associations exist between other IGHDs and AML prognostic genes, so this further study is warranted.
MohamedKhass studies have found that specific amino acids in core IGHD gene fragments greatly influence the absolute number of developing and mature B cell subsets, antibody production, epitope recognition, protection against pathogen attack, and sensitivity to the production of autoreactive antibodies.37 Our study also performed KEGG pathway enrichment analysis and GO analysis on the genes expressed in patients with the high-risk score. Some of the functions in the results of these analyses are consistent with the known functions of the IGHDs gene family, and their significant enrichment in high-risk patients coincides with the high expression of IGHDs genes in high-risk patients.
Research by Vale shows that murine IGHDs deletions increased susceptibility to infection.38 Some studies have found that changes in the IGHDs gene sequence also increase the likelihood of self-reactive antibodies.39 Concerning the clinical significance of IGHD3-3, most studies have focused on its non-mutation as a factor in the poor prognosis of chronic lymphocytic leukaemia.
Tschumperrc found that in a large sample of patients with low/moderate RAI risk and non-mutated chronic B-lymphoblaemia, patients expressing IGHD3-3 required treatment at an earlier time than other non-mutated chronic B-lymphoblaemia and showed that their prognosis was independent of the use of the IGHV and IGHJ genes.14 Boyd found deletions of IGHD1-7, IGHD2-8, IGHD3-3, IGHD4-4/4-11, and IGHD6-6 gene sequences in patients with aplastic anaemia whether the deletions of the role of these genes in pathogenesis remains to be studied.40
Considering its cost-effectiveness, our signature based on IGHDs is easy to exam routinely. There are also some shortcomings to this study. First, the prognostic model’s construction was based on a non-randomized, retrospective observational analysis using registry data, which would allow for the introduction of bias. Although its good performance in external validation indicates its potential, more extensive studies may be needed to validate our results further. Although the nomogram successfully predicted OS in AML patients by combining age and risk level, clinical characteristics were viewed as inadequate due to the restricted information in the study cohort. In the future, it will be essential to create a better prognosis nomogram from more centres, with complete clinical information and sequencing data. Secondly, the role of IGHDs in the appearance and advancement of AML and its complex mechanism needs to be further studied.
Conclusion
We first studied the role of IGHDs in the prognosis of acute myeloid leukaemia. We found that IGHD1-20 is an independent prognostic factor of acute myeloid leukaemia. We established a prognostic signature of IGHDs, constructed a nomogram based on the risk model, and evaluated the nomogram by C-index and calibration curve. Our study provides a new way further to evaluate the prognosis of patients with acute myeloid leukaemia.
Abbreviations
AML, acute myeloid leukemia; OS, overall survival; TCGA, The Cancer Genome Atlas; GTEx, Genotype-Tissue Expression; IGHDs, IGHD gene family; C-index, Harrell’s concordance index; TARGET, the Therapeutically Applicable Research to Generate Effective Treatments; DEGs, differentially expressed genes; IgG, Immunoglobulin γHeavy Chain; ROC curves, the time-dependent receiver operating characteristic curves; GO, gene ontology; KEGG, The Kyoto Encyclopedia of Genes and Genomes; AUC, the area under curve; Ig, immunoglobulin; FAB subtypes, French-American and British subtypes.
Acknowledgments
This study was supported by the Medical Research Foundation of Chongqing Health Bureau/Chongqing Science and Technology Commission (2020FYYX227). Besides, we are very grateful to the people who have contributed to The Cancer Genome Atlas, Genotype-Tissue Expression, the Therapeutically Applicable Research to Generate Effective Treatments, the University of California Santa Cruz genome database, The Gene Ontology (GO) project, and Kyoto Encyclopedia of Genes and Genomes for providing us with the data used in the research.
Disclosure
The authors report no conflicts of interest in this work.
References
1. Short NJ, Rytting ME, Cortes JE. Acute myeloid leukaemia. Lancet. 2018;392(10147):593–606.
2. Ferrara F, Schiffer CA. Acute myeloid leukaemia in adults. Lancet. 2013;381(9865):484–495.
3. Döhner H, Weisdorf DJ, Bloomfield CD. Acute myeloid leukemia. N Engl J Med. 2015;373(12):1136–1152.
4. Ley TJ, Miller C, Ding L, et al. Genomic and epigenomic landscapes of adult de novo acute myeloid leukemia. N Engl J Med. 2013;368(22):2059–2074.
5. Ding L, Ley TJ, Larson DE, et al. Clonal evolution in relapsed acute myeloid leukaemia revealed by whole-genome sequencing. Nature. 2012;481(7382):506–510.
6. Deschler B, Lübbert M. Acute myeloid leukemia: epidemiology and etiology. Cancer. 2006;107(9):2099–2107.
7. Qiu X, Sun X, He Z, et al. Immunoglobulin gamma heavy chain gene with somatic hypermutation is frequently expressed in acute myeloid leukemia. Leukemia. 2013;27(1):92–99.
8. Watson CT, Steinberg KM, Huddleston J, et al. Complete haplotype sequence of the human immunoglobulin heavy-chain variable, diversity, and joining genes and characterization of allelic and copy-number variation. Am J Hum Genet. 2013;92(4):530–546.
9. Croce CM, Shander M, Martinis J, et al. Chromosomal location of the genes for human immunoglobulin heavy chains. Proc Natl Acad Sci U S A. 1979;76(7):3416–3419.
10. Matthyssens G, Hozumi N, Tonegawa S. Somatic generation of antibody diversity. Ann Immunol (Paris). 1976;127(3–4):439–448.
11. Glanville J, Kuo TC, von Büdingen HC, et al. Naive antibody gene-segment frequencies are heritable and unaltered by chronic lymphocyte ablation. Proc Natl Acad Sci U S A. 2011;108(50):20066–20071.
12. Lee CE, Gaëta B, Malming HR, Bain ME, Sewell WA, Collins AM. Reconsidering the human immunoglobulin heavy-chain locus: 1. An evaluation of the expressed human IGHD gene repertoire. Immunogenetics. 2006;57(12):917–925.
13. Corbett SJ, Tomlinson IM, Sonnhammer EL, Buck D, Winter G. Sequence of the human immunoglobulin diversity (D) segment locus: a systematic analysis provides no evidence for the use of DIR segments, inverted D segments, “minor” D segments or D-D recombination. J Mol Biol. 1997;270(4):587–597.
14. Tschumper RC, Geyer SM, Campbell ME, et al. Immunoglobulin diversity gene usage predicts unfavorable outcome in a subset of chronic lymphocytic leukemia patients. J Clin Invest. 2008;118(1):306–315.
15. Raaphorst FM, Raman CS, Nall BT, Teale JM. Molecular mechanisms governing reading frame choice of immunoglobulin diversity genes. Immunol Today. 1997;18(1):37–43.
16. Haeussler M, Zweig AS, Tyner C, et al. The UCSC genome browser database: 2019 update. Nucleic Acids Res. 2019;47(D1):D853–D858.
17. Ritchie ME, Phipson B, Wu D, et al. limma powers differential expression analyses for RNA-sequencing and microarray studies. Nucleic Acids Res. 2015;43(7):e47.
18. Simon N, Friedman J, Hastie T, Tibshirani R. Regularization paths for cox’s proportional hazards model via coordinate descent. J Stat Softw. 2011;39(5):1–13.
19. Tibshirani R, Bien J, Friedman J, et al. Strong rules for discarding predictors in lasso-type problems. J R Stat Soc Series B Stat Methodol. 2012;74(2):245–266.
20. Li S, Garrett-Bakelman FE, Chung SS, et al. Distinct evolution and dynamics of epigenetic and genetic heterogeneity in acute myeloid leukemia. Nat Med. 2016;22(7):792–799.
21. Ohgami RS, Ma L, Merker JD, et al. Next-generation sequencing of acute myeloid leukemia identifies the significance of TP53, U2AF1, ASXL1, and TET2 mutations. Mod Pathol. 2015;28(5):706–714.
22. Yang F, Anekpuritanang T, Press RD. Clinical utility of next-generation sequencing in acute myeloid leukemia. Mol Diagn Ther. 2020;24(1):1–13.
23. Yin X, Huang S, Xu A, et al. Identification of distinctive long noncoding RNA competitive interactions and a six-methylated-gene prognostic signature in acute myeloid leukemia with −5/del(5q) or −7/del(7q). J Cell Biochem. 2020;121(2):1563–1574.
24. Lin SY, Miao YR, Hu FF, et al. A 6-Membrane Protein Gene score for prognostic prediction of cytogenetically normal acute myeloid leukemia in multiple cohorts. J Cancer. 2020;11(1):251–259.
25. Zeng H, Wu H, Yan M, Tang L, Guo X, Zhao X. Characterization of a 4 lncRNAs-based prognostic risk scoring system in adults with acute myeloid leukemia. Leuk Res. 2020;88:106261.
26. Zhang Y, Ma S, Wang M, Shi W, Hu Y. Comprehensive analysis of prognostic markers for acute myeloid leukemia based on four metabolic genes. Front Oncol. 2020;10:578933.
27. Lu C, Zhu J, Chen X, et al. Risk stratification in acute myeloid leukemia using CXCR gene signatures: a bioinformatics analysis. Front Oncol. 2020;10:584766.
28. Liu W, Zhu F, Yan J, et al. Identification and validation of STAT6 as a prognostic and predictive biomarker in acute myeloid leukemia. Onco Targets Ther. 2020;13:11165–11176.
29. Nguyen CH, Glüxam T, Schlerka A, et al. SOCS2 is part of a highly prognostic 4-gene signature in AML and promotes disease aggressiveness. Sci Rep. 2019;9(1):9139.
30. Yan H, Qu J, Cao W, et al. Identification of prognostic genes in the acute myeloid leukemia immune microenvironment based on TCGA data analysis. Cancer Immunol Immunother. 2019;68(12):1971–1978.
31. Cui M, Huang J, Zhang S, Liu Q, Liao Q, Qiu X. Immunoglobulin expression in cancer cells and its critical roles in tumorigenesis. Front Immunol. 2021;12:613530.
32. Safonova Y, Pevzner PA. De novo inference of diversity genes and analysis of non-canonical V(DD)J recombination in immunoglobulins. Front Immunol. 2019;10:987. doi:10.3389/fimmu.2019.00987
33. Schroeder HW
34. Kurosawa Y, Tonegawa S. Organization, structure, and assembly of Immunoglobulin heavy chain diversity DNA segments. J Exp Med. 1982;155(1):201–218. doi:10.1084/jem.155.1.201
35. Meek KD, Hasemann CA, Capra JD. Novel rearrangements at the immunoglobulin D locus. Inversions and fusions add to IgH somatic diversity. J Exp Med. 1989;170(1):39–57. doi:10.1084/jem.170.1.39
36. Briney BS, Willis JR, Hicar MD, et al. Frequency and genetic characterization of V(DD)J recombinants in the human peripheral blood antibody repertoire. Immunology. 2012;137(1):56–64. doi:10.1111/j.1365-2567.2012.03605.x
37. Khass M, Vale AM, Burrows PD, et al. The sequences encoded by immunoglobulin diversity (D(H)) gene segments play key roles in controlling B-cell development, antigen-binding site diversity, and antibody production. Immunol Rev. 2018;284(1):106–119. doi:10.1111/imr.12669
38. Vale AM, Kapoor P, Skibinski GA, et al. The link between antibodies to OxLDL and natural protection against pneumococci depends on D(H) gene conservation. J Exp Med. 2013;210(5):875–890.
39. Silva-Sanchez A, Liu CR, Vale AM, et al. Violation of an evolutionarily conserved immunoglobulin diversity gene sequence preference promotes production of dsDNA-specific IgG antibodies. PLoS One. 2015;10(2):e0118171.
40. Boyd SD, Gaëta BA, Jackson KJ, et al. Individual variation in the germline Ig gene repertoire inferred from variable region gene rearrangements. J Immunol. 2010;184(12):6986–6992.
 © 2021 The Author(s). This work is published and licensed by Dove Medical Press Limited. The
full terms of this license are available at https://www.dovepress.com/terms
and incorporate the Creative Commons Attribution
- Non Commercial (unported, 3.0) License.
By accessing the work you hereby accept the Terms. Non-commercial uses of the work are permitted
without any further permission from Dove Medical Press Limited, provided the work is properly
attributed. For permission for commercial use of this work, please see paragraphs 4.2 and 5 of our Terms.
© 2021 The Author(s). This work is published and licensed by Dove Medical Press Limited. The
full terms of this license are available at https://www.dovepress.com/terms
and incorporate the Creative Commons Attribution
- Non Commercial (unported, 3.0) License.
By accessing the work you hereby accept the Terms. Non-commercial uses of the work are permitted
without any further permission from Dove Medical Press Limited, provided the work is properly
attributed. For permission for commercial use of this work, please see paragraphs 4.2 and 5 of our Terms.