Back to Journals » Infection and Drug Resistance » Volume 16
Development of a Nomogram for Predicting Mortality Risk in Sepsis Patients During Hospitalization: A Retrospective Study
Authors Lu B, Pan X ![]() , Wang B, Jin C, Liu C, Wang M, Shi Y
, Wang B, Jin C, Liu C, Wang M, Shi Y
Received 5 February 2023
Accepted for publication 12 April 2023
Published 19 April 2023 Volume 2023:16 Pages 2311—2320
DOI https://doi.org/10.2147/IDR.S407202
Checked for plagiarism Yes
Review by Single anonymous peer review
Peer reviewer comments 3
Editor who approved publication: Prof. Dr. Héctor Mora-Montes
Bin Lu,1 Xinling Pan,2 Bin Wang,3 Chenyuan Jin,1 Chenxin Liu,1 Mengqi Wang,4 Yunzhen Shi1
1Department of Infectious Diseases, Affiliated Dongyang Hospital of Wenzhou Medical University, Dongyang, Zhejiang Province, People’s Republic of China; 2Department of Biomedical Sciences Laboratory, Affiliated Dongyang Hospital of Wenzhou Medical University, Dongyang, People’s Republic of China; 3Department of Emergency, Affiliated Dongyang Hospital of Wenzhou Medical University, Dongyang, Zhejiang Province, People’s Republic of China; 4Department of Neurology, Affiliated Dongyang Hospital of Wenzhou Medical University, Dongyang, Zhejiang Province, People’s Republic of China
Correspondence: Yunzhen Shi, Department of Infectious Diseases, Affiliated Dongyang Hospital of Wenzhou Medical University, No. 60 Wuningxi Road, Dongyang, People’s Republic of China, Email [email protected]
Purpose: We attempted to establish a model for predicting the mortality risk of sepsis patients during hospitalization.
Patients and Methods: Data on patients with sepsis were collected from a clinical record mining database, who were hospitalized at the Affiliated Dongyang Hospital of Wenzhou Medical University between January 2013 and August 2022. These included patients were divided into modeling and validation groups. In the modeling group, the independent risk factors of death during hospitalization were determined using univariate and multi-variate regression analyses. After stepwise regression analysis (both directions), a nomogram was drawn. The discrimination ability of the model was evaluated using the area under the curve (AUC) of the receiver operating characteristic (ROC) curve, and the GiViTI calibration chart assessed the model calibration. The Decline Curve Analysis (DCA) was performed to evaluate the clinical effectiveness of the prediction model. Among the validation group, the logistic regression model was compared to the models established by the SOFA scoring system, random forest method, and stacking method.
Results: A total of 1740 subjects were included in this study, 1218 in the modeling population and 522 in the validation population. The results revealed that serum cholinesterase, total bilirubin, respiratory failure, lactic acid, creatinine, and pro-brain natriuretic peptide were the independent risk factors of death. The AUC values in the modeling group and validation group were 0.847 and 0.826. The P values of calibration charts in the two population sets were 0.838 and 0.771. The DCA curves were above the two extreme curves. Moreover, the AUC values of the models established by the SOFA scoring system, random forest method, and stacking method in the validation group were 0.777, 0.827, and 0.832, respectively.
Conclusion: The nomogram model established by combining multiple risk factors could effectively predict the mortality risk of sepsis patients during hospitalization.
Keywords: severe sepsis, mortality risk prediction, nomogram, SOFA, random forest, stacking
Introduction
Sepsis is a severe and life-threatening disease that brings a tremendous public health burden. More than 1,700,000 cases are diagnosed annually across the United States.1 Its mortality increases when sepsis is further aggravated and progresses to septic shock. Previous studies have indicated that the mortality rate of inpatients with sepsis is about 17%.2 Septic shock is a subset of sepsis, with a mortality rate of more than 40%.3 Early diagnosis of patients with sepsis and active intervention measures can reduce the risk of progression to septic shock and mortality, indicating great clinical significance.
At present, the severity score and mortality estimation of sepsis patients are primarily dependent on the acute physiology and chronic health assessment (APACHE), systemic inflammatory response syndrome standard (SIRS), quick sequential organ failure assessment (qSOFA) and sequential organ failure assessment score (SOFA). These have certain deficiencies in assessing sepsis. The APACHE score established earlier can be utilized for all critically ill patients.4 Some studies have pointed out that the APACHE score underestimates the death risk of sepsis patients.5–8 The SIRS standard is mainly used to determine whether patients have systemic inflammatory responses based on the changes in white blood cell count, body temperature, heart rate, and respiratory rate. Due to poor differentiation, this standard cannot effectively predict the prognosis of sepsis.9 The qSOFA score is simple, easy to operate, and more specific than the SIRS standard in evaluating the prognosis of sepsis. However, it has the disadvantage of low sensitivity and, therefore, cannot be a suitable tool for predicting the prognosis of sepsis.10 The development of the SOFA score is primarily used to describe the occurrence of multiple organ dysfunction. Compared with qSOFA, SOFA score has a higher accuracy in determining the mortality of sepsis.11 However, the SOFA scoring system is not specifically developed to predict the mortality outcome of sepsis.12 Thus, the accuracy of the SOFA score in predicting the short-term mortality of sepsis patients is dissatisfactory.13
Without active intervention, sepsis will progress to septic shock, leading to higher mortality. Consequently, developing a tool to predict the short-term mortality of patients with sepsis is necessary. Nomogram is a very friendly visualization tool to present how much the involved variables contributed to the death risk, which is more applicable and convenient than the traditional scoring system.14 This study aims to establish a reliable and suitable model for predicting the death risk of hospitalized patients with sepsis. The variables involved in the prediction model were collected within 24h following hospitalization, which could identify the patients with high death risk at an early stage.
Materials and Methods
Patient Extraction from Medical Record Information Mining Database
The inpatients’ information was collected from the medical record information mining database based on the clinical records of patients who were admitted to Affiliated Dongyang Hospital of Wenzhou Medical University, Zhejiang Province, China. The technology for database construction was supported by Le9 Healthcare Technology Co. Ltd.15 The written informed consent of the enrolled patients or their relatives was obtained after hospitalization. The personalized identification information in medical records was removed, and their clinical information was uploaded to clinical record information mining database. This study was conducted using the principles of the Declaration of Helsinki and the subsequent amendments. The present study was approved by the Ethics Committee of Affiliated Dongyang Hospital of Wenzhou Medical University (Approval Number: 2022-YX-301).
The study duration was from January 2013 and August 2022. The patients with sepsis were collected from the database based on the diagnosed diseases when they were discharged. In detail, the diagnosis of severe sepsis was based on the sepsis-2 in 2013, which was recategorized as sepsis in sepsis-3 updated in 2016 by the Society of Critical Care Medicine and the European Society of Intensive Care Medicine.3,16 In addition, the enrolled patients were excluded with these criteria: less than 18 years; patients with advanced tumors, decompensated cirrhosis, leukemia, lymphoma, and advanced AIDS in diagnosed diseases (patients with advanced tumors often gave up treatment; patients with decompensated cirrhosis, leukemia, lymphoma and other patients indicated abnormal blood indicators; advanced AIDS patients had an abnormal immune function with multiple microbial infections). The terminal event for patients with sepsis was obtained from their clinical records at discharge: the patients were defined as alive if they recovered, or as dead if they could not survive during hospitalization.
Variables Extraction from Database
The following variables were retrospectively extracted from database based on the clinical records of hospitalized patients, including age, gender, and the levels of the following indicators collected from the first examination within 24 hours after admission: C-reactive protein, creatinine, lactic acid, prothrombin time, serum cholinesterase, procalcitonin, white blood cells, red blood cells, hemoglobin, hematocrit, platelet, pro-brain natriuretic peptide (pro-BNP), total bilirubin, albumin, alanine aminotransferase, aspartate aminotransferase, systolic blood pressure, diastolic blood pressure, mean arterial pressure, respiration rate and heart rate. Respiratory failure was defined based on partial oxygen pressure/oxygen concentration ≤300 mmHg, which was tested after admission.
Evaluating the Variables Included for Prediction Model
The R software (version 4.2.2) was used to process the data of the patients. The continuous variables were represented as the median (quartile), and the categorical variables were described by numbers (percentage). The variables with missing data more than 15% were excluded. The remaining variables with missing values ≤15% (Figure S1) were amended by multiple imputations in the “mice” function.17 The involved patients were divided into the modeling group and the verification group using the “createDataPartition” function in the cart package based on the 7:3 split ratio. The univariate analysis was conducted by the ‘twogrps’ function in the “CBCgrps” package, to evaluate the difference of baseline characteristics between the modeling and the validation groups. In the modeling group, the univariate analysis was conducted to screen the risk factors associated with death. Then, whether the death related continuous variables were linear to logitp was analyzed using the “boxTidwell” function in the “car” package. When continuous variables were not linear to logitp (P < 0.05), they were converted into categorical variables. The “VIF” function was conducted to test whether there were multiple collinearities among the included variables (VIF >5).18 Finally, a multivariate logistic regression and stepwise regression analyses (both directions) were performed to determine the independent risk factors for the final model (P < 0.05). The impact of individual variables on the death risk in the established model was presented as a nomogram by the “regplot” package.
Evaluation of the Established Prediction Model
The discrimination power of the prediction model was evaluated by the area under the curve (AUC) of the receiver-operating characteristic (ROC) curve. AUC >0.8 indicates the model with good discrimination ability.19 The calibration of the prediction model was assessed by establishing a calibration curve, and a P-value greater than 0.05 indicates excellent goodness of fit.20 DCA curve was used to evaluate the clinical effect of the established model.21 Finally, the effectiveness of the established model was compared with the SOFA scoring system and the machine learning models established by the random forest method22 and stacking method.23,24 The AUCs between the logistic regression model and other models were compared by “roc.test” function.
Results
Basic Data and Variable Screening of the Included Patients
A total of 1740 patients were included in this study, with 1015 females and 725 males. Among them, 421 died, with a mortality rate of 24.2% (421/1740). The population was divided into the modeling group (1218 patients with 294 deaths) and the validation group (522 patients with 127 deaths). No significant difference was observed in the baseline characteristics between the two groups (Table 1). In the modeling population, the univariate analysis demonstrated that gender, creatinine, lactic acid, serum cholinesterase, respiratory failure, total bilirubin, prothrombin time, pro-BNP, procalcitonin, and mean arterial pressure were associated with death (Table 2). The significant continuous variables in univariate analysis were linear to logitp (Table S1). Multiple collinearity tests showed that the VIF value of each variable was less than 5, so a further analysis can proceed (Table S2).
 |
Table 1 Baseline Characteristics of the Development Group and Validation Groupa |
 |
Table 2 Univariate Analysis Between Survivors and No Survivors in Modeling Groupa |
Variable Screening and Establishment of the Logistic Regression Model
The logistic regression results indicated that serum cholinesterase, total bilirubin, creatinine, lactic acid, pro-BNP and respiratory failure were independent risk factors for the death of patients with sepsis, and finally included in the modeling (Table 3, P < 0.05).
 |
Table 3 Stepwise Regression Analysis of Involved Variables |
Using the nomograph (Figure 1), a vertical line was drawn upward from each variable to the top scoring line, and the corresponding points were obtained. Then, the scores corresponding to each variable were summed up to determine the total score. Finally, the death prediction probability corresponding to the bottom of the nomograph was obtained based on the total score. For example, a patient with sepsis was admitted, and variables were collected within 24h as followed: creatinine (112 μmol/L), lactic acid (6.9 mmol/L), cholinesterase (2914 U/L), pro-BNP (17,960 pg/mL), total bilirubin (129.5 μmol/L) and with respiratory failure. The total score of this patient was 2.25, and the corresponding predicted probability of death was 0.67.
 |
Figure 1 The nomogram of established model for predicting mortality risk in sepsis patients after hospitalization. The enrolled variables were collected within 24h after admission. A patient was displayed as an example, with detailed enrolled variables labelled by red dots. The variables labelled of asterisk indicated significance in the model, *, P<0.05, **, P<0.01, ***, P<0.001. |
Discrimination Power, Fit Goodness, and Clinical Effectiveness of Prediction Model
The logistic regression based on the independent risk factors in the modeling population owned an AUC of 0.847 (95% CI: 0.821–0.872) (Figure 2A). At the threshold of 0.192, the model had a specificity of 72.8% and sensitivity of 81.6%, respectively. In the calibration chart (Figure 2B), the P-value was 0.838, with a Brier scale of 0.125, a calibration slope of 1.000, and R2 of 0.409, indicating a good fit. The DCA curve (Figure 2C) showed that the modeling curve (mod) was above the two extreme curves, depicting good clinical significance.
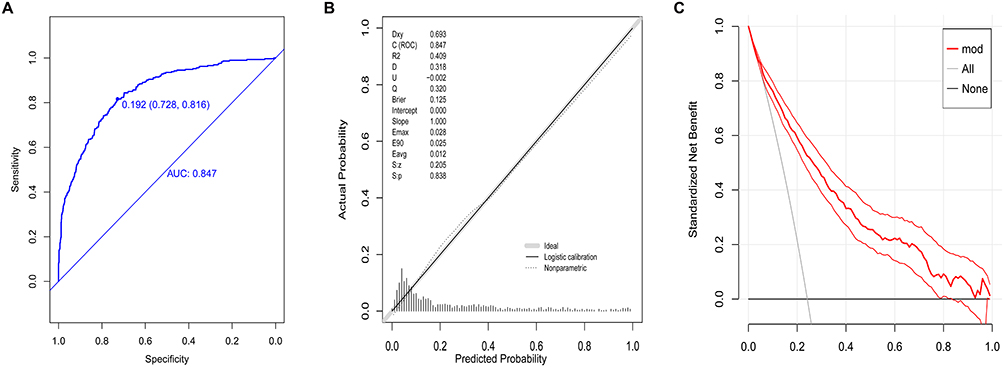 |
Figure 2 Evaluation of prediction model in modeling group. (A) the discrimination power of established model by ROC curves; (B) the agreement between predictions and observations of the predicted values by calibration chart; (C) the clinical net benefit of established model by DCA curves, red bold curve means the mean value, red curves mean 95% confidence interval. |
The AUC of logistic regression model in the validation population was 0.826 (95CI: 0.786–0.866), with a specificity of 74.7% and a sensitivity of 79.5% (at the threshold of 0.220, Figure 3A). The P-value of the calibration plot was 0.771, with a Brier scale of 0.136, calibration slope of 1.000, and R2 of 0.347 (Figure 3B). The DCA curve owned good clinical significance (Figure 3C).
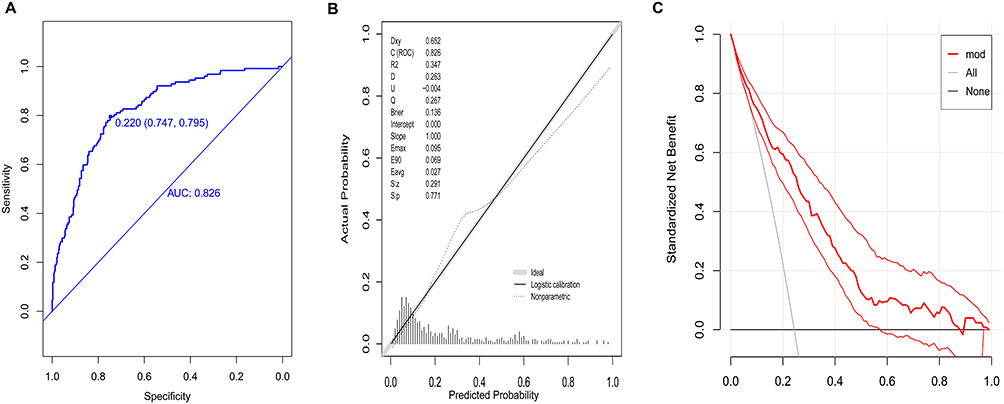 |
Figure 3 Validation of prediction model in validation group. (A) the discrimination power of established model by ROC curves; (B) the agreement between predictions and observations of the predicted values by calibration chart; (C) the clinical net benefit of established model by DCA curves, red bold curve means the mean value, red curves mean 95% confidence interval. |
Modeling with SOFA Scoring System, Random Forest Method, and Stacking Method in the Validation Population
The AUC of the model established by the SOFA scoring system in the validation group was 0.777 (95% CI: 0.729–0.825, Figure 4A), significantly lower than that of the logistic prediction model (P < 0.002, Table S3). For the model established using the random forest method in the validation group, its AUC was 0.827 (95% CI: 0.788–0.866, Figure 4A), similar to the logistic prediction model (P = 0.981, Table S3). Regarding the stacking method, SVM, C5.0, and XGboost were taken for ensemble modeling, and the AUC value of the final ensemble model within the validation group was 0.832 (95% CI: 0.793–0.87, Figure 4B).
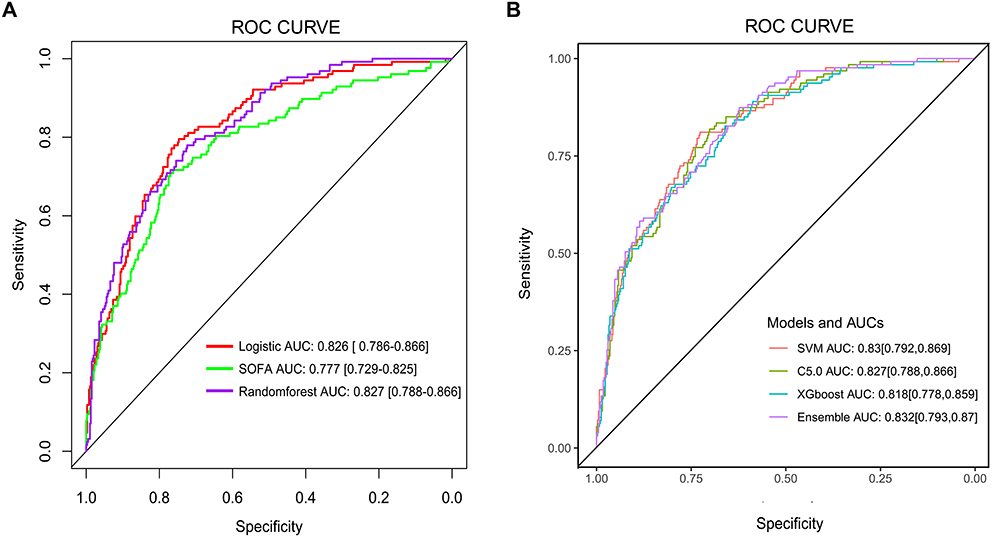 |
Figure 4 The discrimination powers of other models. (A) ROC curves of the models based on logistic regression, SOFA and random forest method (B) ROC curves of the models established by stacking method. |
Discussion
This study showed that reduced serum cholinesterase activity, elevated total bilirubin, lactic acid, creatinine, pro-BNP levels, and respiratory failure were the independent risk factors for the death of sepsis patients. The prediction model established in this study indicated good significance in discrimination, calibration, and clinical effectiveness, showing a significantly better prediction performance than the model developed by the SOFA scoring system. The machine learning models, such as random forest modeling and stacking modeling, had no apparent advantages in performance than the model in this study. The prediction model can help clinicians visually evaluate the death risk of patients with sepsis, thereby formulating better interventions to reduce the mortality risk.
The logistic regression model established in this study was helpful in discovering independent risk factors. The continuous decline of serum cholinesterase in liver function indicators and the elevation of total bilirubin level were directly related to the death of sepsis patients. Previous studies have revealed that lower serum cholinesterase is associated with increased mortality in sepsis patients. The possible reason was that serum cholinesterase, an indicator of cholinergic activity, reduced rapidly after inflammation.25,26 As a key indicator of a dysfunctional liver, hyper-bilirubin can also damage the bactericidal properties of neutrophils by antioxidation and stimulate the production of many inflammatory factors, leading to poor prognosis in sepsis patients.27 This study also discovered that the increase in pro-BNP was closely associated with death risk for patients with sepsis, which could be explained by the close relationship between pro-BNP and heart failure.28 Our study also observed that an increase in creatinine levels in the serum could help to predict the death risk of patients since sepsis causes acute renal injury. Previous studies have indicated that acute renal injury is related to the high mortality rate of sepsis.29 The increase in lactic acid concentration could be a substitute indicator for the severity of hypoperfusion and sepsis.30 Several studies on sepsis and septic shock have revealed that the increase in lactic acid significantly contributes to the mortality of patients,31,32 as confirmed by our study.
Procalcitonin and C-reactive protein help clinicians to judge the severity of sepsis and guide the course of antibacterial drug usage,33,34 in which procalcitonin is better than C-reactive protein.34 However, previous studies have indicated that levels of procalcitonin and C-reactive protein cannot predict the prognosis of patients with severe infection at an early stage.35 The ability of procalcitonin to stratify the death risk of sepsis was limited.36 This was consistent with our results that procalcitonin and C-reactive protein were not independent risk factors for the poor prognosis of sepsis. Abnormal coagulation function is also a risk factor for poor prognosis of sepsis.37 However, proper application of heparin sodium anticoagulation therapy can improve organ failure due to extensive micro-thrombosis and increased survival rate.38 This study revealed that the indexes for initial coagulation dysfunction were not an independent risk factor for poor short-term prognosis of sepsis patients. Thus, it may be associated with the early intervening correction of coagulation dysfunction. The continuous decrease in mean arterial pressure and significantly increased heart rate indicated that sepsis could progress to septic shock, increasing the mortality risk. However, such patients are given more active fluid rehydration, anti-infection, and other comprehensive treatments immediately after admission. Therefore, some studies revealthat the initial mean arterial pressure value and the heart rate of newly admitted patients could not predict mortality among sepsis patients,39,40 consistent with our study.
Over the years, many scoring tools have been used in clinical practice to predict the prognosis of sepsis patients, including the APACHE score, SIRS standard, qSOFA score, SOFA score, etc. However, they have defects in predicting the mortality of sepsis patients since these scoring systems are not specially developed for sepsis. The SOFA scoring system is the most widely used among these scoring systems, owning better prediction ability than SIRS and qSOFA as described previously.3,11 However, SOFA score showes fluctuating, prediction effectiveness when applied in certain circumstances.41–43 In this study, the overall accuracy of the SOFA score in predicting short-term mortality was not as good as the logistic regression model regarding the AUC. This phenomenon could be explained by the different variables enrolled in the SOFA score and the logistic regression model established in this study. For example, cholinesterase, pro-BNP and lactic acid were included in the logistic regression model but absent in the SOFA scoring system. Recent studies have found the role of pro-BNP and lactic acid in prognosis of patients with sepsis, supporting the displayed advantages of established models over SOFA score models.28,32 Three variables (respiratory failure, creatinine and total bilirubin) were commonly included in this established model and SOFA score, indicating their significance in death risk prediction in patients with sepsis.
The model for predicting the mortality of sepsis patients established through machine learning also demonstrated good effectiveness. However, the decision support provided by the machine learning model is usually difficult to explain. The development of a clinical prediction model is needed to conform to clinical practice, which is largely limited by the complex algorithms of machine learning models.44 In this study, the machine learning models using random forest method or stacking method had no significant advantages in convenience compared with logistic regression models. The impact of enrolled variables on the risk of death is presented as a nomogram, with advantages in clinical interpretation and application.14
The disadvantages of this study were : (1) It was a single-center study and there was lacked data for validation from other centers. (2) It was a retrospective study, and selection bias could not be avoided. During data collection of sepsis patients, the variables with missing data more than 15% were excluded, such as thrombocytocrit, prealbumin, serum phosphorus, and serum magnesium; only two statuses (recovered or dead) of patients at discharge were considered to define the terminal events in this study. Information on follow-up was unavailable for those patients recovered at discharge.
Conclusion
A prediction model is developed in this study based on the variables collected within 24h after admission and could assess the mortality risk during hospitalization among sepsis patients, thus assisting clinicians in the management of these patients. Another major advantage of the nomogram is also that it can pinpoint the variables with the highest impact on the outcome, which ultimately enables a more personalized medicine approach to each patient.
Disclosure
The authors report no conflicts of interest in this work.
References
1. Rhee C, Dantes R, Epstein L, et al. Incidence and trends of sepsis in US hospitals using clinical vs claims data, 2009–2014. JAMA. 2017;318(13):1241–1249. doi:10.1001/jama.2017.13836
2. Fleischmann C, Scherag A, Adhikari NK, et al. Assessment of global incidence and mortality of hospital-treated sepsis. Current estimates and limitations. Am J Respir Crit Care Med. 2016;193(3):259–272. doi:10.1164/rccm.201504-0781OC
3. Singer M, Deutschman CS, Seymour CW, et al. The third international consensus definitions for sepsis and septic shock (sepsis-3). JAMA. 2016;315(8):801–810. doi:10.1001/jama.2016.0287
4. Knaus WA, Draper EA, Wagner DP, Zimmerman JE. Prognosis in acute organ-system failure. Ann Surg. 1985;202(6):685–693. doi:10.1097/00000658-198512000-00004
5. Beck DH, Smith GB, Taylor BL. The impact of low-risk intensive care unit admissions on mortality probabilities by SAPS II, APACHE II and APACHE III. Anaesthesia. 2002;57(1):21–26. doi:10.1046/j.1365-2044.2002.02362.x
6. Weng J, Hou R, Zhou X, et al. Development and validation of a score to predict mortality in ICU patients with sepsis: a multicenter retrospective study. J Transl Med. 2021;19(1):322. doi:10.1186/s12967-021-03005-y
7. Dabhi AS, Khedekar SS, Mehalingam V. A prospective study of comparison of APACHE-IV & SAPS-II scoring systems and calculation of standardised mortality rate in severe sepsis and septic shock patients. J Clin Diagn Res. 2014;8(10):Mc09–13 doi:10.7860/JCDR/2014/9925.5052
8. Huang CT, Ruan SY, Tsai YJ, Ku SC, Yu CJ. Clinical trajectories and causes of death in septic patients with a low APACHE II score. J Clin Med. 2019;8(7):1064. doi:10.3390/jcm8071064
9. Churpek MM, Zadravecz FJ, Winslow C, Howell MD, Edelson DP. Incidence and prognostic value of the systemic inflammatory response syndrome and organ dysfunctions in ward patients. Am J Respir Crit Care Med. 2015;192(8):958–964. doi:10.1164/rccm.201502-0275OC
10. Fernando SM, Tran A, Taljaard M, et al. Prognostic accuracy of the quick sequential organ failure assessment for mortality in patients with suspected infection: a systematic review and meta-analysis. Ann Intern Med. 2018;168(4):266–275. doi:10.7326/m17-2820
11. Raith EP, Udy AA, Bailey M, et al. Prognostic accuracy of the SOFA score, SIRS criteria, and qSOFA score for in-hospital mortality among adults with suspected infection admitted to the intensive care unit. JAMA. 2017;317(3):290–300. doi:10.1001/jama.2016.20328
12. Vincent JL, Moreno R, Takala J, et al. The SOFA (Sepsis-Related Organ Failure Assessment) score to describe organ dysfunction/failure. On behalf of the working group on sepsis-related problems of the European Society of Intensive Care Medicine. Intensive Care Med. 1996;22(7):707–710. doi:10.1007/bf01709751
13. Abdullah Smob RH, Nielsen FE, Nielsen FE. Prognostic accuracy of SOFA, qSOFA, and SIRS for mortality among emergency department patients with infections. Infect Drug Resist. 2021;14:2763–2775. doi:10.2147/idr.S304952
14. Park SY. Nomogram: an analogue tool to deliver digital knowledge. J Thorac Cardiovasc Surg. 2018;155(4):1793. doi:10.1016/j.jtcvs.2017.12.107
15. Jiang X, Wang Y, Pan Y, Zhang W. Prediction models for sepsis-associated thrombocytopenia risk in intensive care units based on a machine learning algorithm. Front Med. 2022;9:837382. doi:10.3389/fmed.2022.837382
16. Levy MM, Fink MP, Marshall JC, et al. 2001 SCCM/ESICM/ACCP/ATS/SIS international sepsis definitions conference. Crit Care Med. 2003;31(4):1250–1256. doi:10.1097/01.Ccm.0000050454.01978.3b
17. Cummings P. Missing data and multiple imputation. JAMA Pediatr. 2013;167(7):656–661. doi:10.1001/jamapediatrics.2013.1329
18. Shen Y, Huang X, Zhang W. Platelet-to-lymphocyte ratio as a prognostic predictor of mortality for sepsis: interaction effect with disease severity-A retrospective study. BMJ Open. 2019;9(1):e022896. doi:10.1136/bmjopen-2018-022896
19. Zhang K, Zhang S, Cui W, Hong Y, Zhang G, Zhang Z. Development and validation of a sepsis mortality risk score for sepsis-3 patients in intensive care unit. Front Med. 2020;7:609769. doi:10.3389/fmed.2020.609769
20. Niu XK, He WF, Zhang Y, et al. Developing a new PI-RADS v2-based nomogram for forecasting high-grade prostate cancer. Clin Radiol. 2017;72(6):458–464. doi:10.1016/j.crad.2016.12.005
21. Vickers AJ, Holland F. Decision curve analysis to evaluate the clinical benefit of prediction models. Spine J. 2021;21(10):1643–1648. doi:10.1016/j.spinee.2021.02.024
22. Wang D, Li J, Sun Y, et al. A machine learning model for accurate prediction of sepsis in ICU patients. Front Public Health. 2021;9:754348. doi:10.3389/fpubh.2021.754348
23. Zhongheng Z, Chen L, Ping X, Hong Y. Predictive analytics with ensemble modeling in laparoscopic surgery: a technical note. Laparosc Endosc Robot Surg. 2022;5(1):25–34. doi:10.1016/j.lers.2021.12.003
24. Zhang L, Wang Z, Zhou Z, et al. Developing an ensemble machine learning model for early prediction of sepsis-associated acute kidney injury. iScience. 2022;25(9):104932. doi:10.1016/j.isci.2022.104932
25. Peng ZL, Huang LW, Yin J, Zhang KN, Xiao K, Qing GZ. Association between early serum cholinesterase activity and 30-day mortality in sepsis-3 patients: a retrospective cohort study. PLoS One. 2018;13(8):e0203128. doi:10.1371/journal.pone.0203128
26. Zivkovic AR, Decker SO, Zirnstein AC, et al. A sustained reduction in serum cholinesterase enzyme activity predicts patient outcome following sepsis. Mediators Inflamm. 2018;2018:1942193. doi:10.1155/2018/1942193
27. Xiao Y, Yan X, Shen L, et al. Evaluation of qSOFA score, and conjugated bilirubin and creatinine levels for predicting 28-day mortality in patients with sepsis. Exp Ther Med. 2022;24(1):447. doi:10.3892/etm.2022.11374
28. Martín-Rodríguez F, Melero-Guijarro L, Ortega GJ, et al. Combination of prehospital NT-proBNP with qSOFA and NEWS to predict sepsis and sepsis-related mortality. Dis Markers. 2022;2022:5351137. doi:10.1155/2022/5351137
29. Ping F, Li Y, Cao Y, et al. Metabolomics analysis of the development of sepsis and potential biomarkers of sepsis-induced acute kidney injury. Oxid Med Cell Longev. 2021;2021:6628847. doi:10.1155/2021/6628847
30. Varis E, Pettilä V, Poukkanen M, et al. Evolution of blood lactate and 90-day mortality in septic shock. A post hoc analysis of the FINNAKI study. Shock. 2017;47(5):574–581. doi:10.1097/shk.0000000000000772
31. Han X, Edelson DP, Snyder A, et al. Implications of centers for medicare and Medicaid services severe sepsis and septic shock early management bundle and initial lactate measurement on the management of sepsis. Chest. 2018;154(2):302–308. doi:10.1016/j.chest.2018.03.025
32. Ko BS, Kim K, Choi SH, et al. Prognosis of patients excluded by the definition of septic shock based on their lactate levels after initial fluid resuscitation: a prospective multi-center observational study. Crit Care. 2018;22(1):47. doi:10.1186/s13054-017-1935-3
33. Wacker C, Prkno A, Brunkhorst FM, Schlattmann P. Procalcitonin as a diagnostic marker for sepsis: a systematic review and meta-analysis. Lancet Infect Dis. 2013;13(5):426–435. doi:10.1016/s1473-3099(12)70323-7
34. Tan M, Lu Y, Jiang H, Zhang L. The diagnostic accuracy of procalcitonin and C-reactive protein for sepsis: a systematic review and meta-analysis. J Cell Biochem. 2019;120(4):5852–5859. doi:10.1002/jcb.27870
35. Jensen JU, Heslet L, Jensen TH, Espersen K, Steffensen P, Tvede M. Procalcitonin increase in early identification of critically ill patients at high risk of mortality. Crit Care Med. 2006;34(10):2596–2602. doi:10.1097/01.Ccm.0000239116.01855.61
36. Aloisio E, Dolci A, Panteghini M. Procalcitonin: between evidence and critical issues. Clin Chim Acta. 2019;496:7–12. doi:10.1016/j.cca.2019.06.010
37. Bachler M, Hell T, Schausberger L, et al. Response patterns of routinely measured inflammatory and coagulatory parameters in sepsis. Peer J. 2019;7:e7147. doi:10.7717/peerj.7147
38. Guo F, Zhu X, Wu Z, Zhu L, Wu J, Zhang F. Clinical applications of machine learning in the survival prediction and classification of sepsis: coagulation and heparin usage matter. J Transl Med. 2022;20(1):265. doi:10.1186/s12967-022-03469-6
39. Guarracino F, Bertini P, Pinsky MR. Cardiovascular determinants of resuscitation from sepsis and septic shock. Crit Care. 2019;23(1):118. doi:10.1186/s13054-019-2414-9
40. Asfar P, Meziani F, Hamel JF, et al. High versus low blood-pressure target in patients with septic shock. N Engl J Med. 2014;370(17):1583–1593. doi:10.1056/NEJMoa1312173
41. Cheng B, Li Z, Wang J, et al. Comparison of the performance between sepsis-1 and sepsis-3 in ICUs in China: a retrospective multicenter study. Shock. 2017;48(3):301–306. doi:10.1097/shk.0000000000000868
42. Moreno-Torres V, Royuela A, Múñez E, et al. Better prognostic ability of NEWS2, SOFA and SAPS-II in septic patients. Med Clin. 2022;159(5):224–229. doi:10.1016/j.medcli.2021.10.021
43. Liu Z, Meng Z, Li Y, et al. Prognostic accuracy of the serum lactate level, the SOFA score and the qSOFA score for mortality among adults with sepsis. Scand J Trauma Resusc Emerg Med. 2019;27(1):51. doi:10.1186/s13049-019-0609-3
44. Kelly CJ, Karthikesalingam A, Suleyman M, Corrado G, King D. Key challenges for delivering clinical impact with artificial intelligence. BMC Med. 2019;17(1):195. doi:10.1186/s12916-019-1426-2
 © 2023 The Author(s). This work is published and licensed by Dove Medical Press Limited. The
full terms of this license are available at https://www.dovepress.com/terms
and incorporate the Creative Commons Attribution
- Non Commercial (unported, 3.0) License.
By accessing the work you hereby accept the Terms. Non-commercial uses of the work are permitted
without any further permission from Dove Medical Press Limited, provided the work is properly
attributed. For permission for commercial use of this work, please see paragraphs 4.2 and 5 of our Terms.
© 2023 The Author(s). This work is published and licensed by Dove Medical Press Limited. The
full terms of this license are available at https://www.dovepress.com/terms
and incorporate the Creative Commons Attribution
- Non Commercial (unported, 3.0) License.
By accessing the work you hereby accept the Terms. Non-commercial uses of the work are permitted
without any further permission from Dove Medical Press Limited, provided the work is properly
attributed. For permission for commercial use of this work, please see paragraphs 4.2 and 5 of our Terms.
Recommended articles
An Individualized Nomogram for Predicting Mortality Risk of Septic Shock Patients During Hospitalization: A ten Years Retrospective Analysis
Wang M, Shi Y, Pan X, Wang B, Lu B, Ouyang J
Infection and Drug Resistance 2023, 16:6247-6257
Published Date: 20 September 2023
Early Warning of Axillary Lymph Node Metastasis in Breast Cancer Patients Using Multi-Omics Signature: A Machine Learning-Based Retrospective Study
Ke Z, Shen L, Shao J
International Journal of General Medicine 2024, 17:6101-6114
Published Date: 12 December 2024
Machine Learning and Experimental Validation of m6A RNA Methylation Related Signatures for Risk Prediction, Diagnostic Biomarkers, and Immune Subtypes in Chronic Kidney Disease
Chen J, Wang Z, Liao Y, Ding W
Journal of Inflammation Research 2026, 19:553934
Published Date: 2 February 2026
Comparative Prognostic Performance of SOFA2.0 and SOFA for 28-Day Mortality in Patients Developing Sepsis During ECMO Support
Chen JY, Gu XL, Liu HY, Li T, Yu YW, Xu M
Journal of Inflammation Research 2026, 19:607506
Published Date: 9 July 2026