Back to Journals » International Journal of General Medicine » Volume 14
Development and Validation of Prognostic Nomogram for Young Patients with Kidney Cancer
Authors Tian S, Sun S, Mao W ![]() , Qian S, Zhang L
, Qian S, Zhang L ![]() , Zhang G, Xu B, Chen M
, Zhang G, Xu B, Chen M ![]()
Received 31 July 2021
Accepted for publication 24 August 2021
Published 1 September 2021 Volume 2021:14 Pages 5091—5103
DOI https://doi.org/10.2147/IJGM.S331627
Checked for plagiarism Yes
Review by Single anonymous peer review
Peer reviewer comments 2
Editor who approved publication: Dr Scott Fraser
Shengwei Tian,1,2,* Si Sun,1,2,* Weipu Mao,1,2,* Siwei Qian,1,2 Lei Zhang,1,2 Guangyuan Zhang,1,2 Bin Xu,1,2 Ming Chen1– 3
1Department of Urology, Zhongda Hospital, Southeast University, Nanjing, 210009, People’s Republic of China; 2Surgical Research Center, Institute of Urology, Southeast University Medical School, Nanjing, 210009, People’s Republic of China; 3Department of Urology, Nanjing Lishui District People’s Hospital, Zhongda Hospital Lishui Branch, Southeast University, Nanjing, 211200, People’s Republic of China
*These authors contributed equally to this work
Correspondence: Bin Xu; Ming Chen
Department of Urology, Zhongda Hospital, Southeast University, No. 87 Dingjiaqiao, Hunan Road, Gulou District, Nanjing, 210009, People’s Republic of China
Tel +86-18012949196
; +86-13913009977
Email [email protected]; [email protected]
Background: The aim of this study was to establish a nomogram model to evaluate the prognosis of early-onset kidney cancer (EOKC) in terms of overall survival (OS) and cancer-specific survival (CSS).
Methods: Patients with EOKC diagnosed between 2004 and 2015 were collected from Surveillance, Epidemiology and End Results (SEER) and randomly assigned to the training and validation set at a ratio of 2 to 1. Important variables for constructing nomograms were screened by univariate and multivariate Cox analysis. The nomogram model was evaluated using concordance index (C-index), decision curve analysis (DCA) curves, and receiver operating characteristic (ROC) curves.
Results: A total of 12,526 EOKC patients were included in the study. OS nomogram was constructed based on gender, age, race, grade, AJCC stage, TNM stage, histology, chemotherapy and radiotherapy. CSS nomogram was constructed based on listed above except gender. In the external validation, the C-index for the OS nomogram was 0.855 (95% CI 0.834– 0.976), and the C-index for the CSS nomogram was 0.938 (0.925– 0.951). High-quality calibration curves were noted in both OS and CSS nomogram models. ROC and DCA curves showed that nomograms had better predictive performance than TNM stage and SEER stage.
Conclusion: The nomogram model provides an applicable tool for evaluating the OS and CSS prognosis of EOKC.
Keywords: early-onset kidney cancer, nomogram, OS, CSS, SEER
Introduction
Globally, the incidence of kidney cancer has shown an increasing trend year by year.1–4 Especially in the past 20 years, with the development and popularization of medical imaging technology and equipment, the improvement of national health care awareness, the increase of the number of physical examinations and the extension of average life expectancy, more and more kidney cancer patients have been found. Some studies have shown that the median age of patients with kidney cancer is 64 years old, and the age is approximately normal distribution.5,6 Early-onset kidney cancer (EOKC) is defined as kidney cancer patients younger than 47 years old.7 Patients with EOKC may be associated with a higher risk of metastasis and genetic factors.8,9
Clinically, the prognosis of cancer patients after surgery is frequently evaluated by the Tumor-Node-Metastasis (TNM) classification system.10 In recent years, several studies have shown that other pathological factors such as race, gender, age, and postoperative treatment may also influence the outcome of kidney cancer patients.11,12 By analyzing data of 35,151 patients with renal clear cell carcinoma, all from SEER, Zhang et al constructed a nomogram for predicting postoperative outcomes, on the basis of TNM stage, age, gender, race, marital status, surgical approach and Fuhrman grade were also involved in this predictive model.13
The nomogram is visual representations of mathematical models, characterized by showing quantitative relationships between individual predictors in a predictive model. The nomogram integrates multiple predictors based on multivariable linear regression model and individualizes the prediction of outcomes. The nomogram visualizes complex statistical regression equations and simplifies the computation of complex clinical prediction models, providing a reference for clinicians and patients in the assessment of cancer treatment outcomes.
Several institutions have proposed nomograms for postoperative survival after kidney cancer; nonetheless, these models are usually based on all kidney cancer patients.14,15 There are differences in pathology, genetics, and prognosis between young and old kidney cancer.7 The aim of this study was to establish a prognostic nomogram to estimate the survival of patients with EOKC.
Patients and Methods
Patient Selection
Clinical data of EOKC patients from 2004 to 2015 were retrieved from SEER using SEER*Stat software. Because the patient information in the SEER database is anonymized and publicly available, our study was not monitored by an institutional review board. The exclusion criteria included: (I) age >46 years old; (II) incomplete TNM stage information; (III) multiple primary tumor lesions; (IV) incomplete survival data; (V) not having undergone surgical treatment (Figure 1). The training group accounted for two-thirds of the total, and the included EOKCs were randomly assigned to these two sets.
 |
Figure 1 Flow diagram of the EOKC patients with training and validation sets. Abbreviation: EOKC, early-onset kidney cancer. |
Clinical Variables of EOKC
Clinical variables included gender, age, race, grade, AJCC stage, TNM stage, SEER stage, histology, chemotherapy and radiotherapy. Overall survival (OS) was the primary endpoint. OS was defined as the date of diagnosis to the end of follow-up or death from all causes, and CSS was defined as the date of diagnosis to the date of death from kidney cancer.
Statistical Analyses
Using RStudio software (Version 1.2.5033), all patients were randomized into the two sets. Age was categorically divided based on the optimal cut-off value generated by X-tile software (Version 3.6.1). In the training set, univariate and multivariate Cox regressions were used to analyze the factors associated with OS and CSS, and the results were presented as hazard ratios (HR) and 95% confidence interval (CI). Based on the results of multivariate Cox regression analysis, we constructed patient OS and CSS prognostic nomograms. In addition, C-index, ROC curves, DCA curves, and internal validation were used to assess the predictive performance of nomograms. The C-index reflected the probability of agreement between the actual value and the predicted value. In general, the C-index was a measure of the accuracy of the line graph, with values greater than 0.75 generally indicating relatively good discrimination, and the closer to 1.0 the more accurate it was, applying to censored data, with similar areas under the ROC curve. The calibration curve is then introduced to graphically visualize the difference in prediction accuracy between the predicted 3- and 5-year OS or CSS and the actual OS or CSS. Finally, DCA is used to evaluate the clinical utility of the nomograms. All statistical tests were considered statistically significant at P<0.05.
Results
Patients Baseline Characteristics
A total of 12,526 EOKC were included in this study, 8350 of whom were assigned to the training set (Figure 1). For all patients, 7677 (61.3%) were male and 9948 (79.4%) were White. Age was divided in 3 sets: Age < 39, 39–44, age > 44. Patients older than 44 years were in the majority (5564, 44.4%). The majority of the tumors were grade II (46.8%). The most common tumor histology for EOKC was clear cell adenocarcinoma (59.9%), followed by renal cell carcinoma, NOS (27.3%), papillary adenocarcinoma (8.5%) and others (4.3%). Moreover, 83.6% of all patients were localized in SEER stage classification (Table 1). The median follow-up length was 69 [0–155] months. As of the follow-up date of December 31, 2015, a total of 1394 patients (11.1%) died and 958 (7.6%) patients died of renal cell carcinoma.
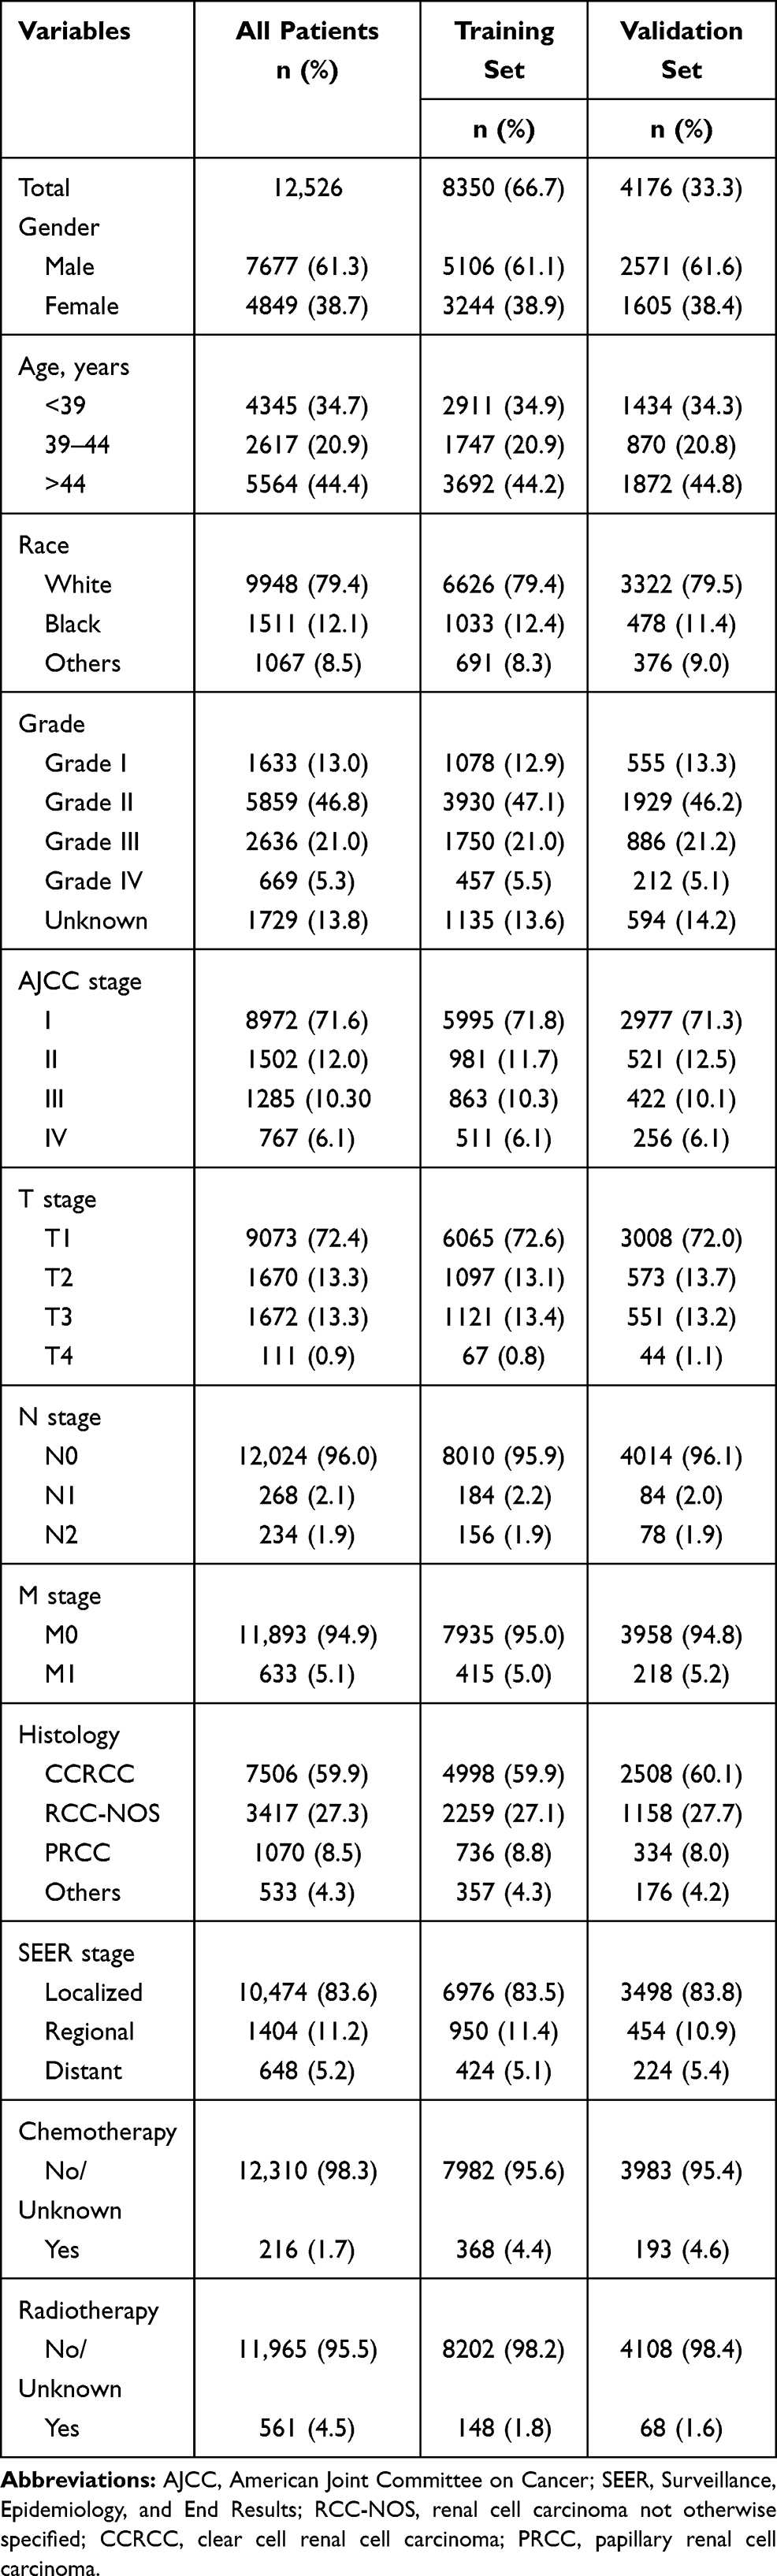 |
Table 1 Baseline Demographic and Clinical Characteristics |
Construction of Nomogram
In the training set, gender, age, race, grade, AJCC stage, TNM stage, histology, SEER stage, chemotherapy and radiotherapy were significantly identified in univariate Cox analysis of OS rates (Table 2). Only SEER stage was excluded in multivariate analysis. Next, these nine independent factors were used as the basis for constructing the OS nomogram (Table 2, Figure 2A). Moreover, gender, age, race, grade, AJCC stage, TNM stage, histology, SEER stage, chemotherapy and radiotherapy were identified in univariate Cox analysis of CSS rates. However, only age, race, grade, AJCC stage, TNM stage, histology, chemotherapy and radiotherapy were independent prognostic factors in multivariate analysis, and the CSS nomogram was constructed (Table 3, Figure 2B). In addition, we established the nomogram of both OS and CSS in the non-metastatic EOKC patients. Gender, age, race, grade, AJCC stage, T stage, N stage, surgery type and chemotherapy were significantly associated with OS, while only race, grade, AJCC stage, T stage, N stage, surgery type and chemotherapy were independent prognostic factors of CSS (Table S1, Table S2, Table S3, Figure S1).
 |
Table 2 Univariate and Multivariate Analysis of Overall Survival (OS) Rates in Training Set |
 |
 |
 |
Table 3 Univariate and Multivariate Analysis of Cancer-Specific Survival (CSS) Rates in Training Set |
 |
Figure 2 OS and CSS associated nomograms for EOKC patients. (A) OS nomograms for EOKC in 3- and 5-year; (B) CSS nomograms for EOKC in 3- and 5-year. Abbreviations: OS, overall survival; CSS, cancer-specific survival; EOKC, early-onset kidney cancer; RCC-NOS, renal cell carcinoma not otherwise specified; CCRCC, clear cell renal cell carcinoma; PRCC, papillary renal cell carcinoma. |
Nomogram Validation
In the training set, the C-index for the OS nomogram was 0.849 (0.834–0.864), while the C-index for the CSS nomogram was 0.937 (0.928–0.946) (Table 4). The C-index for the OS nomogram was 0.855 (0.834–0.976), and the C-index for the CSS nomogram was 0.938 (0.925–0.951) in the validation set (Table 4). Meanwhile, high quality calibration charts showed the reliability of the OS and CSS nomogram models (Figures 3 and 4). In addition, area under ROC curve (AUC) was higher than both TNM and SEER stage (Figure 5). The clinical applicability of the nomogram was superior to TNM and SEER stage indicated by DCA results (Figure 6). Specifically, both internal and external validation showed that OS and CSS nomograms outperformed the TNM and SEER stages (Table 5).
 |
Table 4 Comparison of C-Indexes Between the Nomogram, TNM and SEER Stages in Early-Onset Kidney Cancer Patients |
 |
Table 5 Comparison of Area Under the Curve (AUC) Between the Nomogram, TNM and SEER Stages in Early-Onset Kidney Cancer Patients |
 |
Figure 3 Calibration plots of OS associated nomograms in both training and validation sets. (A and B) Calibration plots of 3- and 5-year OS in training set; (C and D) calibration plots of 3- and 5-year OS in validation set. Abbreviation: OS, overall survival. |
 |
Figure 4 Calibration plots of CSS associated nomograms in both training and validation sets. (A and B) Calibration plots of 3- and 5-year CSS in training set; (C and D) calibration plots of 3- and 5-year CSS in validation set. Abbreviation: CSS, cancer-specific survival. |
 |
Figure 5 ROC curves of the nomograms for OS and CSS in both training and validation sets. (A) The ROC curve of nomogram for OS in training set; (B) the ROC curve of nomogram for CSS in training set; (C) the ROC curve of nomogram for OS in validation set; (D) the ROC curve of nomogram for CSS in validation set. Abbreviations: ROC, receiver operating characteristic; OS, overall survival; CSS, cancer-specific survival. |
 |
Figure 6 DCA curves of the nomograms for OS and CSS in both training and validation sets. (A) The DCA curve of nomogram for OS in training set; (B) the DCA curve of nomogram for CSS in training set; (C) the DCA curve of nomogram for OS in validation set; (D) the DCA curve of nomogram for CSS in validation set. Abbreviations: DCA, decision curve analysis; OS, overall survival; CSS, cancer-specific survival. |
Discussion
Based on the publicly available SEER database, this study developed and validated prognostic nomogram models for patients with EOKC. The ROC and DCA results showed that the nomogram was superior to TNM stage and SEER stage in terms of predicting patient prognosis. The nomogram could be useful for postoperative evaluation of EOKC patients and development of individualized treatment plans.
We are interested in EOKC for two main reasons. Firstly, epidemiological investigations found that the increase in kidney cancer was greater in young people (2.95–6.23% in individuals aged 25–49) than in the elderly (1.67–2.19% in individuals aged 50–84).16 There are differences in pathology, genetics, and prognosis between young and old kidney cancers.7 However, there are no studies assessing the prognostic risk of EOKC. Therefore, the development of a nomogram that is more specific to EOKC directly, rather than to the general patient population, may have greater clinical value. Secondly, considering that age of onset <47 years may be associated with hereditary syndromes, this has the potential for confounding bias in general prognostic indicators, especially when focusing on EOKC.7,17 Indeed, the nomogram model in the present study also reflects individualized treatment management.
To date, the nomograms for EOKC that incorporate demographic and clinicopathological factors are not available. Based on the SEER database, we included 12,526 patients with EOKC and developed a novel nomogram. The 3- and 5-year OS and CSS rates of EOKC patients were predicted by multivariate Cox regression analysis. The C-index and AUC curve demonstrate the accuracy of nomograms in predicting the prognosis of patients with EOKC. Clinicians can use the nomograms to classify patients into different risk sets and make better treatment recommendations, such as adjuvant therapy, gene sequencing, or genetic counseling.
Our nomogram indicated that the AJCC stage, which is based on the TNM stage, contributed the most to the prognosis. This result indicated that we need to combine T stage, N stage and M stage to evaluate the prognosis of EOKC patients in clinical practice. Moreover, TNM stage and grade also had significant share in the model. It was well known that the TNM stage was the conventional factor for assessing the prognosis of renal cell carcinoma and grade has been demonstrated to be another significant prognostic element for all types of renal cell carcinoma.18 As shown in the nomograms, race and age at diagnosis had some impact on OS and CSS. Risk increased in age between 39 and 46 compared to age <39. Stafford et al analyzed the connection between the demographic factors and death of kidney cancer patients based on the California Cancer Registry and found that blacks had lower survival rate than whites and other races.19 Our study found that gender was also an independent prognostic factor for OS. However, the specific mechanism by which gender affected the prognosis of kidney cancer was not clear, while the previous study suggested that the tumor grade and pathological stage of male kidney cancer patients were more likely to be malignant.20 The effect of radiotherapy and chemotherapy on the prognosis of EOKC patients was also introduced in our study. The results showed that the prognosis of patients who received radiotherapy and chemotherapy was worse than those who did not.
Moreover, localized RCC can be managed with surgery, while metastatic RCC has been treated with systemic treatment including cytoreductive nephrectomy, targeted agents and immunotherapies.1 The treatment of metastatic renal cell carcinoma has developed rapidly, and it is unwise to ignore the effect of treatment on prognosis. So, we also decided to do a subgroup analysis including the data of the surgical treatment and systemic therapy to make the results of our study more meaningful. However, the SEER dataset lacked this part of data about systemic treatment for metastatic RCC, which is the intrinsic deficiency of the database. Considering the enormous difference in the landscape of systemic therapies between metastatic and non-metastatic patients, we have excluded the metastatic RCC in this subgroup analysis to make our nomogram more available for individuals. Our study presented that partial nephrectomy increased OS and CSS compared with total nephrectomy. The previous study indicated the significance of surgical therapy for better renal function outcomes21 and the decrease of renal function could contribute to an increased all-cause mortality.22 Our research also found that radiotherapy could not be applied to predicate the prognosis in the non-metastatic patients. It was understandable that the most common types of renal cancer were insensitive to radiotherapy, and most of the kidney cancer patients who received radiotherapy were usually patients with special types or advanced tumors.23
In a combined analysis of the SEER database and the data of their clinical center, Shuch et al found that 70% of patients with hereditary kidney cancer were <46 years of age.7 If 46 years of age was used as the cut-off point for genetic testing, then the test would detect genetic kidney cancer with the highest sensitivity and specificity. Wu et al used Panel to genetically test kidney tumors in 190 patients under 46 years of age and outcomes showed that 6.3% of all were definitude kidney cancer-associated mutations.17 Together, these studies revealed the high proportion of hereditary kidney cancer in patients with early-onset kidney cancer. Several prognostic models have been developed to predict the prognosis of patients with kidney cancer using nomograms. In 2001, a nomogram used to predict 5-year survival in kidney cancer patients was reported by Kattan et al. The nomogram incorporated four factors, which were symptoms, histological subtype, tumor size and TNM stage (1997 version).14 In 2018, Zhang et al developed a nomogram specifically to assess the prognosis of renal clear cell carcinoma (ccRCC) patients after surgery, based on clinical data from 35,151 patients.13 The nomogram showed that age, gender, race, marital status, surgical approach, TNM stage, and Fuhrman grade were independent risk factors for ccRCC patients. The internal validation of this nomogram had an accuracy of 86%. The predictive accuracy of our model (84.9% for OS) is similar to the models that address similar endpoints.
However, the limitations of these models cannot be ignored. The nomogram developed by Kattan et al did not incorporate grade of tumor. Subsequent studies have demonstrated that tumor grade is a solid predictor of OS.24,25 After a literature search, this is the first study based on a large population to construct a nomogram to predict OS and CSS in patients with EOKC. The advantage of our nomogram over earlier studies is the large sample scope (12,526 patients with EOKC), making the nomogram widely applicable to clinical practice. In addition, some demographic variables were included in our study, such as race and sex, which could potentially improve the accuracy of the nomogram. In this study, blacks had the worst OS and CSS.
Moreover, our study has several limitations. First, due to the lack of granular data in SEER dataset, some potential prognostic factors were unavailable, such as surgical treatment details and other non-surgical treatments including immunotherapy and targeted therapy. Second, this study excluded some cases with missing follow-up information, which may lead to bias in the prediction model. Third, this study is a retrospective analysis based on large clinical data, which is limited by the nature of the study, and the accuracy of the model predictions can only be better validated by a prospective cohort study. Fourth, a great number of young patients with kidney cancer also suffered from hereditary syndromes, which influenced the recurrence or survival rate, thus altering our nomogram.
Conclusion
In the present study, we establish and validate a novel nomogram that can provide individual prediction of OS and CSS for patients with early-onset kidney cancer. This nomogram may play a valuable role in clinical practice for EOKC patients. However, more external data remain needed for verification, so that better clinical application capabilities can be achieved.
Abbreviations
EOKC, early-onset kidney cancer; ccRCC, clear-cell renal cell carcinoma; SEER, Surveillance, Epidemiology and End Results; AJCC, American Joint Committee on Cancer; OS, overall survival; CSS, cancer-specific survival; HR, hazard ratios; CI, confidence interval.
Ethical Statement
This article does not contain any studies with human participants or animals performed by any of the authors. The patient information in the SEER database is anonymized and publicly available, and our study was not monitored by an institutional review board. The authors are accountable for all aspects of the work in ensuring that questions related to the accuracy or integrity of any part of the work are appropriately investigated and resolved.
Acknowledgments
The authors are grateful for the invaluable support and useful discussions with other members of the general surgery department.
Funding
This work was supported by the National Natural Science Foundation of China (No.6590000186) and the Natural Science Foundation of Jiangsu Province (BK20200360).
Disclosure
The authors report no conflicts of interest in this work.
References
1. Hsieh JJ, Purdue MP, Signoretti S, et al. Renal cell carcinoma. Nat Rev Dis Primers. 2017;3:17009. doi:10.1038/nrdp.2017.9
2. Perazella MA, Dreicer R, Rosner MH. Renal cell carcinoma for the nephrologist. Kidney Int. 2018;94:471–483. doi:10.1016/j.kint.2018.01.023
3. Znaor A, Lortet-Tieulent J, Laversanne M, Jemal A, Bray F. International variations and trends in renal cell carcinoma incidence and mortality. Eur Urol. 2015;67:519–530. doi:10.1016/j.eururo.2014.10.002
4. King SC, Pollack LA, Li J, King JB, Master VA. Continued increase in incidence of renal cell carcinoma, especially in young patients and high grade disease: United States 2001 to 2010. J Urol. 2014;191:1665–1670. doi:10.1016/j.juro.2013.12.046
5. Saad AM, Gad MM, Al-Husseini MJ, et al. Trends in Renal-Cell Carcinoma Incidence and Mortality in the United States in the Last 2 Decades: a SEER-Based Study. Clin Genitourin Cancer. 2019;17:46–57 e45. doi:10.1016/j.clgc.2018.10.002
6. Nielsen SM, Rhodes L, Blanco I, et al. Von Hippel-Lindau Disease: genetics and Role of Genetic Counseling in a Multiple Neoplasia Syndrome. J Clin Oncol. 2016;34:2172–2181. doi:10.1200/JCO.2015.65.6140
7. Shuch B, Vourganti S, Ricketts CJ, et al. Defining early-onset kidney cancer: implications for germline and somatic mutation testing and clinical management. J Clin Oncol. 2014;32:431–437. doi:10.1200/JCO.2013.50.8192
8. Haas NB, Nathanson KL. Hereditary kidney cancer syndromes. Adv Chronic Kidney Dis. 2014;21:81–90. doi:10.1053/j.ackd.2013.10.001
9. Adeniran AJ, Shuch B, Humphrey PA. Hereditary Renal Cell Carcinoma Syndromes: clinical, Pathologic, and Genetic Features. Am J Surg Pathol. 2015;39:e1–e18. doi:10.1097/PAS.0000000000000562
10. Gettman MT, Blute ML, Spotts B, Bryant SC, Zincke H. Pathologic staging of renal cell carcinoma: significance of tumor classification with the 1997 TNM staging system. Cancer. 2001;91:354–361. doi:10.1002/1097-0142(20010115)91:2<354::aid-cncr1009>3.0.co;2-9
11. Lee CT, Katz J, Fearn PA, Russo P. Mode of presentation of renal cell carcinoma provides prognostic information. Urol Oncol. 2002;7:135–140. doi:10.1016/s1078-1439(01)00185-5
12. Jung EJ, Lee HJ, Kwak C, Ku JH, Moon KC. Young age is independent prognostic factor for cancer-specific survival of low-stage clear cell renal cell carcinoma. Urology. 2009;73:137–141. doi:10.1016/j.urology.2008.08.460
13. Zhang G, Wu Y, Zhang J, et al. Nomograms for predicting long-term overall survival and disease-specific survival of patients with clear cell renal cell carcinoma. Onco Targets Ther. 2018;11:5535–5544. doi:10.2147/OTT.S171881
14. Kattan MW, Reuter V, Motzer RJ, Katz J, Russo P. A postoperative prognostic nomogram for renal cell carcinoma. J Urol. 2001;166:63–67. doi:10.1016/S0022-5347(05)66077-6
15. Sorbellini M, Kattan MW, Snyder ME, et al. A postoperative prognostic nomogram predicting recurrence for patients with conventional clear cell renal cell carcinoma. J Urol. 2005;173(1):48–51. doi:10.1097/01.ju.0000148261.19532.2c
16. Sung H, Siegel RL, Rosenberg PS, Jemal A. Emerging cancer trends among young adults in the USA: analysis of a population-based cancer registry. Lancet Public Health. 2019;4:e137–e147. doi:10.1016/S2468-2667(18)30267-6
17. Wu J, Wang H, Ricketts CJ, et al. Germline mutations of renal cancer predisposition genes and clinical relevance in Chinese patients with sporadic, early-onset disease. Cancer. 2019;125(7):1060–1069. doi:10.1002/cncr.31908
18. Nese N, Paner GP, Mallin K, Ritchey J, Stewart A, Amin MB. Renal cell carcinoma: assessment of key pathologic prognostic parameters and patient characteristics in 47,909 cases using the National Cancer Data Base. Ann Diagn Pathol. 2009;13:1–8. doi:10.1016/j.anndiagpath.2008.10.002
19. Stafford HS, Saltzstein SL, Shimasaki S, Sanders C, Downs TM, Sadler GR. Racial/ethnic and gender disparities in renal cell carcinoma incidence and survival. J Urol. 2008;179:1704–1708. doi:10.1016/j.juro.2008.01.027
20. Lughezzani G, Paciotti M, Fasulo V, Casale P, Saita A. Gender-specific risk factors for renal cell carcinoma: a systematic review. Curr Opin Urol. 2019;29:272–278. doi:10.1097/MOU.0000000000000603
21. Karakiewicz PI, Briganti A, Chun FK, et al. Multi-institutional validation of a new renal cancer-specific survival nomogram. J Clin Oncol. 2007;25:1316–1322. doi:10.1200/JCO.2006.06.1218
22. Huang WC, Levey AS, Serio AM, et al. Chronic kidney disease after nephrectomy in patients with renal cortical tumours: a retrospective cohort study. Lancet Oncol. 2006;7:735–740. doi:10.1016/S1470-2045(06)70803-8
23. Weiss C, Schulze B, Ottinger A, Rodel C. To combine or not combine: the role of radiotherapy and targeted agents in the treatment for renal cell carcinoma. World J Urol. 2014;32:59–67. doi:10.1007/s00345-013-1068-5
24. Lau WK, Cheville JC, Blute ML, Weaver AL, Zincke H. Prognostic features of pathologic stage T1 renal cell carcinoma after radical nephrectomy. Urology. 2002;59:532–537. doi:10.1016/s0090-4295(01)01589-8
25. Amin MB, Amin MB, Tamboli P, et al. Prognostic impact of histologic subtyping of adult renal epithelial neoplasms: an experience of 405 cases. Am J Surg Pathol. 2002;26:281–291. doi:10.1097/00000478-200203000-00001
 © 2021 The Author(s). This work is published and licensed by Dove Medical Press Limited. The
full terms of this license are available at https://www.dovepress.com/terms
and incorporate the Creative Commons Attribution
- Non Commercial (unported, 3.0) License.
By accessing the work you hereby accept the Terms. Non-commercial uses of the work are permitted
without any further permission from Dove Medical Press Limited, provided the work is properly
attributed. For permission for commercial use of this work, please see paragraphs 4.2 and 5 of our Terms.
© 2021 The Author(s). This work is published and licensed by Dove Medical Press Limited. The
full terms of this license are available at https://www.dovepress.com/terms
and incorporate the Creative Commons Attribution
- Non Commercial (unported, 3.0) License.
By accessing the work you hereby accept the Terms. Non-commercial uses of the work are permitted
without any further permission from Dove Medical Press Limited, provided the work is properly
attributed. For permission for commercial use of this work, please see paragraphs 4.2 and 5 of our Terms.