Back to Journals » Infection and Drug Resistance » Volume 14
Development and Validation of an HPLC-UV Method for Quantitation of Linezolid: Application to Resistance Study Using in vitro PK/PD Model
Authors Yang G ![]() , Yan Y, Mao J, Liu H, Chen M, Zhang N, Li Y
, Yan Y, Mao J, Liu H, Chen M, Zhang N, Li Y ![]() , Gu J, Huang X
, Gu J, Huang X
Received 12 October 2021
Accepted for publication 19 November 2021
Published 1 December 2021 Volume 2021:14 Pages 5089—5098
DOI https://doi.org/10.2147/IDR.S343200
Checked for plagiarism Yes
Review by Single anonymous peer review
Peer reviewer comments 3
Editor who approved publication: Professor Suresh Antony
Guang Yang,1,2 Yisong Yan,1,3 Jun Mao,1 Huiping Liu,1 Mingtao Chen,1 Na Zhang,1 Yaowen Li,1 Jiangjun Gu,2 Xiaohui Huang1
1Department of Basic and Clinical Pharmacology, School of Pharmacy, Anhui Medical University, Hefei, Anhui, People’s Republic of China; 2Department of Pharmacy, The Third People’s Hospital of Tongling, Tongling, Anhui, People’s Republic of China; 3Department of Pharmacy, Anhui College of Traditional Chinese Medicine, Wuhu, Anhui, People’s Republic of China
Correspondence: Xiaohui Huang
Department of Basic and Clinical Pharmacology, School of Pharmacy, Anhui Medical University, Meishan Road 81#, Hefei, Anhui, 230032, People’s Republic of China
Tel +86 138 5518 3138
Email [email protected]
Background: Linezolid (LNZ), an oxazolidinone antibiotic, has 100% oral bioavailability and favorable activities against gram-positive pathogens. The in vitro PK/PD model was developed based on concentrations obtained with routine doses in humans can be used to guide dose optimization in the clinic.
Methods: In this study, we employed an in vitro PK/PD model to simulate the changes in the plasma concentration of linezolid in the human body against a clinical isolate of MRSA in vitro. A high-performance liquid chromatography (HPLC)-UV method was applied to measure the concentration of linezolid. Bacterial samples were collected at different times from the central compartment for count.
Results: The chromatographic separation was carried out with an AichromBond-AQC18 column(250mm× 4.6mm, 5μm), using a mobile phase of water with 0.1% formic acid:acetonitrile 70:30 (v/v), followed by detection at 254 nm, and a single detection run was completed within 10 min. The method was validated by estimating the precision and accuracy for the inter- and intra-day analyses in the concentration range of 0.25– 32 mg/L. The method was linear over the investigated range of 0.125– 32 mg/L, with all correlation coefficients R2 = 0.9999. The intra-day and inter-day precisions were within 7.598%, and the method recovery ranged from 90.912% to 106.459%. In vitro PK/PD model, both the absorption and elimination of linezolid being simulated can be precisely controlled by computer. In the control group, the bacterial reached 7.9 Log10CFU/mL in the first 48h and maintained until the end, indicating that the colonies grew well in vitro PK/PD model. In the linezolid 600 mg q12h administration group, the colony decreased to 2.39 Log10CFU/mL at 24h, showing a good bactericidal effect; however, the colonies resumed growth to the initial level in 48h, indicating an emergence of resistance.
Conclusion: We successfully established an in vitro infection PK/PD model and developed an HPLC-UV method to determine linezolid concentration for resistance investigation. The results suggest that the 600 mg q12h dosing regimen may no longer be applicable and requires optimization.
Keywords: linezolid, HPLC-UV, PK/PD model, resistance
Introduction
There is globally a critical need for new and effective antibiotics. Linezolid (LNZ) can be the treatment of choice for a variety of gram-positive bacteria including penicillin-resistant Streptococcus pneumoniae, Methicillin-resistant Staphylococcus aureus (MRSA), glycopeptide intermediate Staphylococcus aureus, vancomycin-resistant enterococci (VRE), and so on.1 However, clinical isolates resistant to linezolid have been reported including MRSA and VRE.2
With the emergence of resistant bacteria, the usual administration regimen of LNZ may not be efficacious. There is an urgency for dose optimization in clinical settings. Compared with the traditional in vitro static time-kill experiments and animal infection models, PK/PD simulations carried out with in vitro models provide important PK/PD information for dose optimization.3–5 We employed an in vitro PK/PD model and simulated an intermittent intravenous dose of 600 mg q12h against a clinical isolate for 3 days treatment with linezolid.6
A rapid and reliable analytical method to quantify the concentration is required. High-performance liquid chromatography (HPLC) methods involving different sample handling methods such as deproteinization7,8 and solid-phase extraction9,10 have been proposed for LNZ determination in plasma, serum, urine, and microdialysis samples, and an on-line extraction technique has also been applied to Mueller–Hinton Broth (MHB) samples.11 HPLC can be considered an adequate technique for determining LNZ in MHB. The sensitivity and precision of HPLC and its applicability to a wide variety of compounds have resulted in its use in clinical laboratories for monitoring a variety of therapeutic agents in hospital settings, as well as pharmacokinetic and metabolism studies. Most of the methods reported measure the concentration of LNZ in plasma that may not suit for applying in broth. Therefore, we need to establish new methods to detect it. In addition, the established methods need to be rapidly and accurately applied to determine a large number of samples in vitro PK/PD mode.
To effectively monitor the drug concentration under bacterial infection, we developed and validated a deproteinization method for LNZ determination in MHB, using a simple and accurate HPLC-UV method that enabled the quantification of LNZ in vitro and provided a basis for its further application in vitro drug resistance study. The application of fully automatic injection technology allows us to determine large numbers of samples accurately and quickly.
Materials and Methods
Chemicals and Isolates
LNZ was commercially obtained from Pfizer and the National Institute for Food and Drug Control of China (Beijing China). HPLC-grade acetonitrile and formic acid were provided by Macklin (Shanghai, China). HPLC-grade water was produced using a Milli-Q system. Mueller–Hinton Broth (MHB) and Mueller–Hinton Agar (MHA) were purchased from Oxoid (England), MRSA clinical isolate and ATCC 29213 were acquired from The First Affiliated Hospital of AHMU. MRSA sample was isolated from the sputum of a patient admitted to the first affiliated hospital of Anhui Medical University as part of routine care. In addition, the clinical strain was not specifically isolated for this research, but they were part of the routine hospital microbiology laboratory procedure. This study was approved by the First Affiliated Hospital of Anhui Medical University institutional review board. ATCC 29213 was used as quality control in susceptibility testing.
Determination of MIC
According to CLSI,12 the MIC of linezolid was performed using the broth microdilution method in 96-well plates by adding a series of twofold dilutions of the antimicrobial drug followed by a 150-fold dilution of the logarithmic growth phase bacterial solution (approximately 1.5×10⁸ CFU/mL) to the small wells. The plates were incubated at 37°C for 24 h and the results were observed at the lowest drug concentration without visible bacterial growth as MIC. ATCC29213 was used as a quality control strain and the experiment was replicated three times.
Preparation of Stock Solutions, Calibration Standards, and Quality Control Samples
The stock solution was prepared by mixing standard LNZ (Beijing China) in water reached 1000 mg/L and preserved in the absence of light, working solutions of LNZ were prepared by mixing an accurately weighed volume of the stock solution with water to yield final concentrations of 320, 160, 80, 40, 20, 10, 5, 2.5 and 1.25 mg/L. Calibration standards were prepared by diluting working solutions of LNZ in broth to yield LNZ concentrations of 32, 16, 8, 4, 2, 1, 0.5, 0.25 and 0.125 mg/L. Quality control (QC) samples were obtained by diluted the working solutions of LNZ in broth at high, medium and low concentrations of 32, 16 and 0.25 mg/L.
Sample Preparation
Protein precipitation was performed using in MHB samples from an in vitro PK/PD model. Briefly, 1 mL of broth sample was taken from the in vitro PK/PD model stored at −20 °C until analysis. Before analysis, the preserved samples were thawed and centrifuged at 12,000 rpm for 10 min. The supernatants were filtered through a 0.22-μm membrane and 100 μL of the supernatants were added to 200 μL of acetonitrile and vortexed for 1 min. The samples were re-centrifuged at 12,000 rpm for 10 min and 20 μL of the supernatant was injected into the HPLC-UV equipment, the calibration standards and quality control samples in broth were processed in the same manner.
HPLC-UV Instruments and Analytical Conditions
The HPLC system used was Shimadzu LC-20AD high-performance liquid chromatograph, SIL-20A autosampler, SPD-20A UV detector, CTO-20A column temperature chamber, CBM-20A system controller (Kyoto, Japan). A 250 mm × 4.6 AichromBond-AQ C18 chromatographic column with 5μm particles was used. The mobile phase was water with 0.1% formic acid: acetonitrile 70:30 (v/v). The flow rate was 1 mL/min, and the injection volume was 20 μL. The column temperature was maintained at 35°C and detection was monitored at a wavelength of 254 nm.
In vitro PK/PD Model
The in vitro PK/PD model utilized MRSA clinical isolate. The isolates stored at −20 °C were inoculated on an agar plate for 24h at 37 °C. A single fresh colony was taken from the agar plate, suspended in fresh broth and cultured overnight at 37 °C and 200 rpm to reach the logarithmic growth phase; an appropriate amount of bacteria was added into the broth and vortexed to reach 0.5 McFarland. Then, 2mL of the prepared bacterial suspension was added to the central compartment yield 105–106 CFU/mL. The bacteria were exposed to LNZ with multiple doses of 600 mg q12h with a 0.5 h continuous infusion for 3 days.13,14 The simulated concentration of LNZ in vitro PK/PD model was achieved by controlling the flow rate of the peristaltic pump using a computer. Bacterial and drug samples were collected at different times from the central compartment for analysis.
Method Validation
Linearity
Calibration curves were prepared by assaying standard broth samples at 9 different concentrations. The linearity of each calibration curve was determined by plotting the peak area versus the nominal concentration of analytes with weighted (1/x2) least-square linear regression.
Accuracy and Precision
Five QC samples of MHB with three concentrations of LNZ (0.25, 16, and 32 mg/L) were prepared. Inter-day accuracy and precision were assessed by analyzing QC samples in three replicates at three concentration levels on three different days. Intra-day accuracy and precision were assessed by analyzing QC samples in three replicates at three concentration levels on the same day using the same calibration curve. The accuracy for each QC concentration level was expressed as recovery by calculating the percentage bias from the nominal concentration of the quality-control samples. The precision for each QC concentration was expressed as CV (Coefficient of Variation) by calculating the standard deviation as a percentage of the mean calculated concentration.
Stability Study
Studies were conducted to evaluate the stability of the analytes under different storage conditions: at 4 °C (up to 24 h), freeze–thaw at −20 °C (three cycles) and at room temperature (up to 24 h). Experiments were performed at the lower quality control (LQC), middle quality control (MQC) and higher quality control (HQC) concentrations for LNZ. The measured concentrations were compared to nominal values. The samples were stable if the deviation was ± 15% of the nominal values.
Software
Certara Phoenix WinNonlin 8.3 was used for pharmacokinetic simulation (Princeton, NJ, USA). IBM SPSS statistics 25 (New York, NY USA) was used for one-way analysis of variance (ANOVA). P<0.05 indicated a statistically significant difference. Plotting was performed using origin 9.0 (MA, USA).
Results
MIC
The broth microdilution linezolid MIC for this isolate was 2 mg/L.
HPLC-UV Chromatograms
Under the above analytical conditions, the chromatographic peak shape of LNZ was good, no apparent interference from endogenous substances was detected. The retention time of LNZ was 7.4 min. Figure 1 shows the chromatograms of blank broth, broth containing LNZ and the chromatogram of LNZ in the pure water sample.
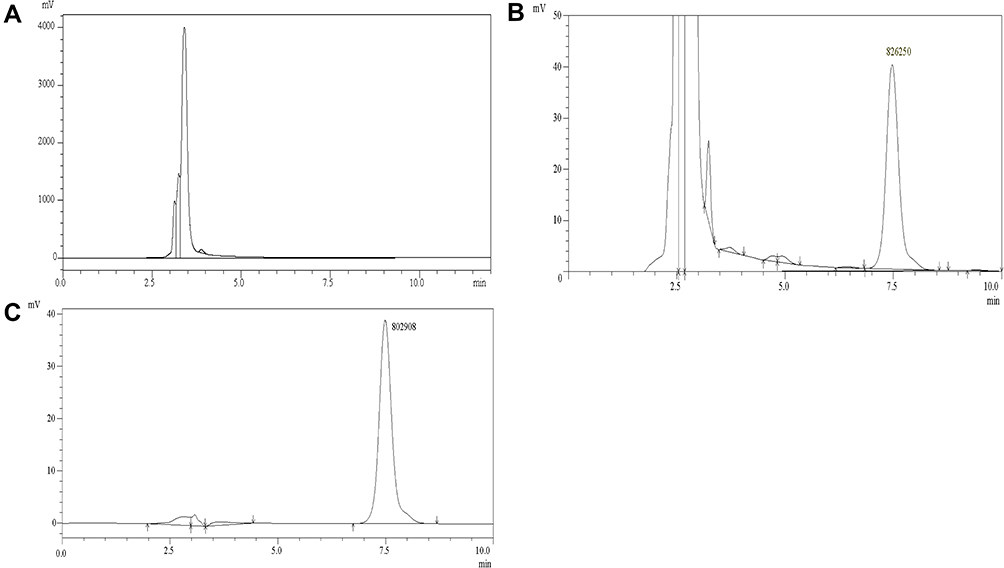 |
Figure 1 Chromatograms: (A) blank broth, (B) broth sample spiked with LNZ, (C) water sample spiked with LNZ. |
Linearity
The linearity of the method was evaluated at nine non-zero concentrations ranging from 0.125 to 32 mg/L. A regression equation was employed to establish the best fit for the concentration–peak area response relationship (Figure 2). The correlation coefficient of the weighted calibration curves generated during the validation was 0.9999.
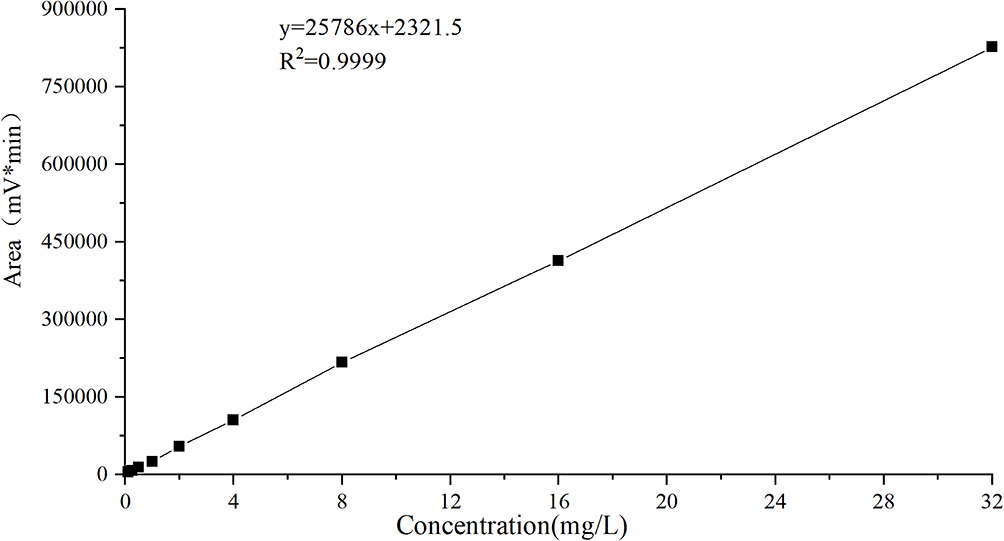 |
Figure 2 Standard curve. |
Precision and Accuracy
The results for accuracy and intra- and inter-day precision for the three QC levels are provided in Tables 1 and 2; the results were found to be within the acceptable limits defined by the 2018 Bioanalytical Method Validation Guidance for Industry (FDA.2018).15 There was no bias for QC samples and the mean values were within ± 15% of the nominal concentrations. Imprecision was acceptable, as indicated by both intra- and inter-day coefficients of variation of <15% at all concentrations of LNZ. Similarly, the intra- and inter-day accuracies were within ±15% of the nominal concentrations.
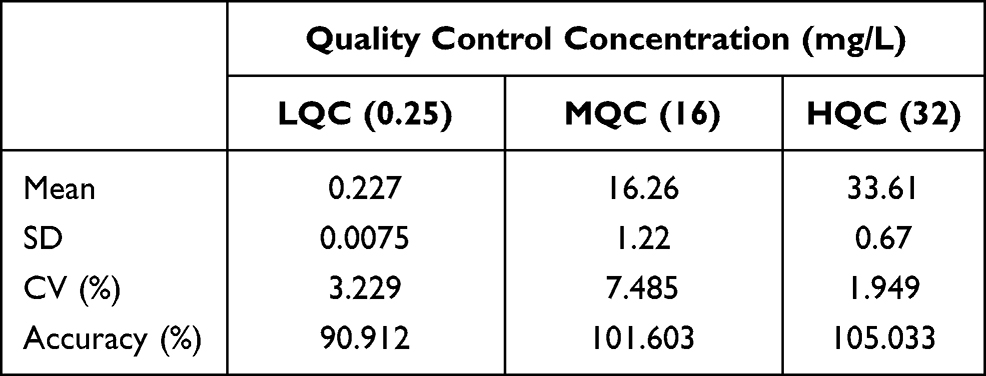 |
Table 1 Intra-Day Precision and Accuracy for Linezolid (n=5 at Each QC Level) |
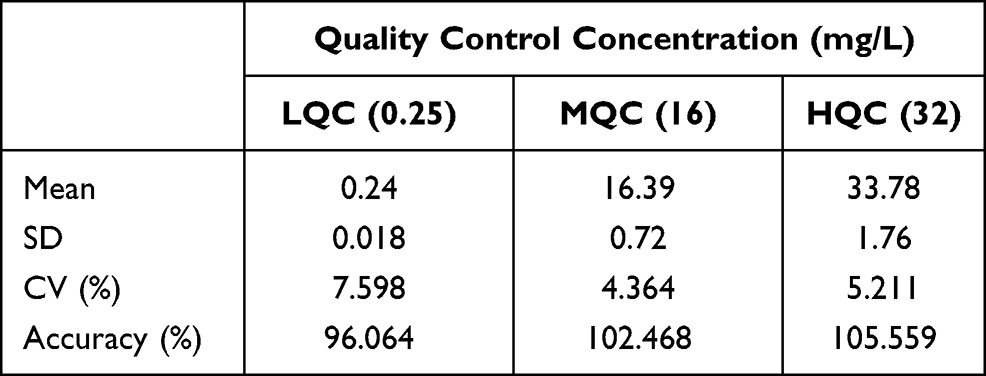 |
Table 2 Inter-Day Precision and Accuracy for Linezolid (n=15 at Each QC Level) |
Stability Study
The stability of LNZ QC samples stored at 4°C for up to 24 h in the autosampler, on the benchtop at room temperature for up to 24 h, and under three freeze–thaw cycles in broth was evaluated. As shown in Table 3, LNZ was stable percentage accuracies for all the stability tests for LNZ were found to be ±15% of the nominal concentrations at low, medium and high QC levels.
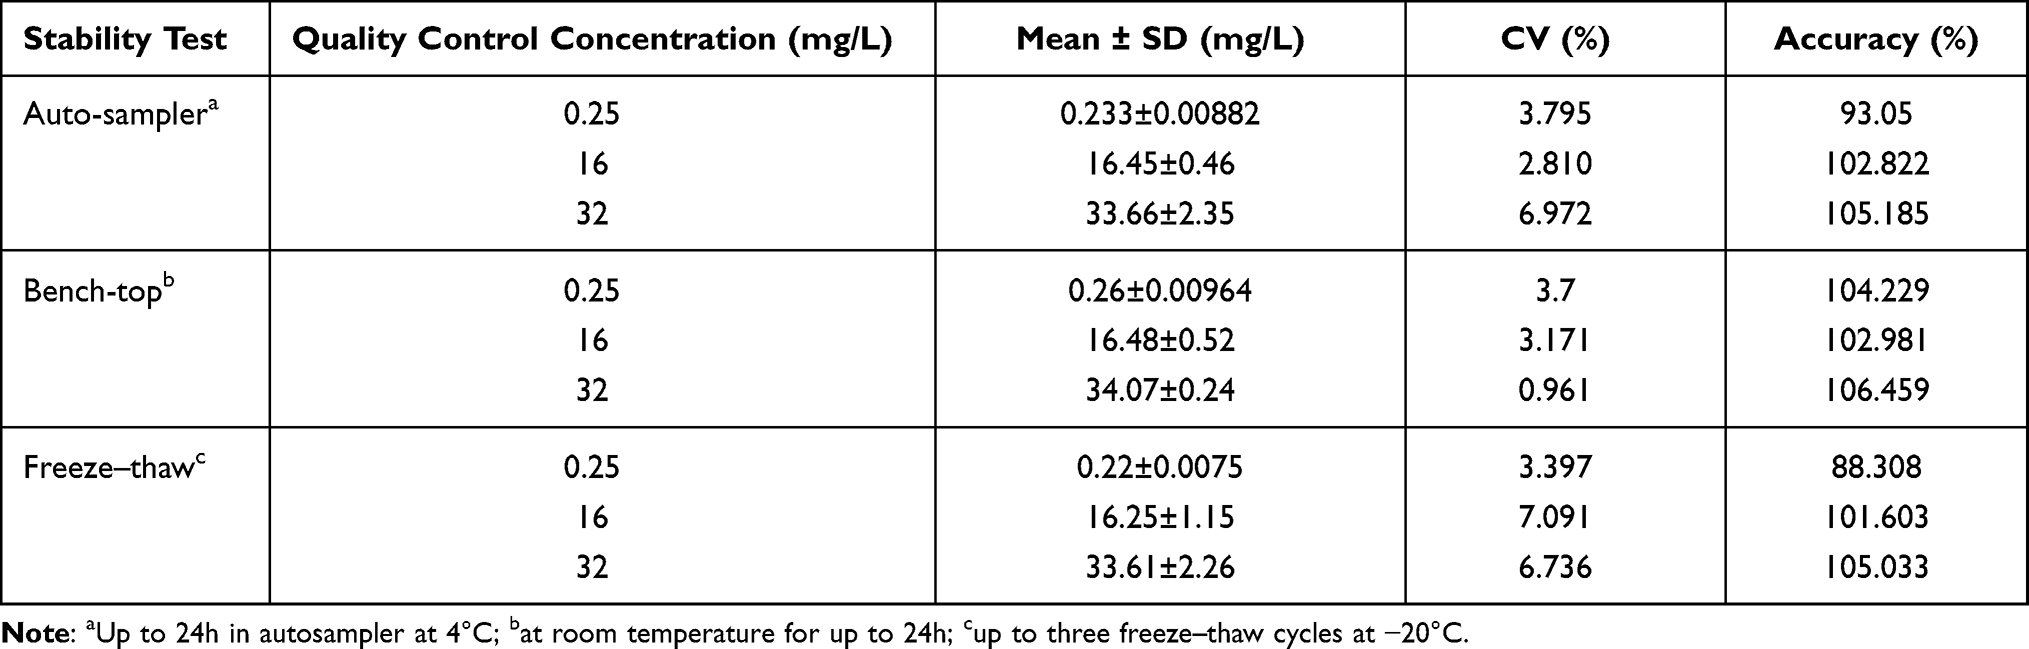 |
Table 3 Stability Data for Linezolid in Muller–Hinton Broth; n=5 at Each QC Level |
In vitro PK/PD Model
The observed concentrations of LNZ in vitro PK/PD model closely mimicked the targeted concentrations for the simulated dosing regimen (Figure 3). The pharmacokinetic parameters of LNZ in vitro and in vivo are shown in Table 4. There are minor difference between the experimental parameters and simulated parameters. The bacterial kill and regrowth curve is displayed in Figure 4 among control group and 600mg q12h group. In the control group, the bacterial reached 7.9 Log10CFU/mL at 48 h and remained. In the 600mg q12h group, the Log10CFU/mL value decreased to 2.39 in the initial 24h. However, bacterial regrowth was observed after 24h and the colony reached 5.67 Log10CFU/mL at 48h until 72h.
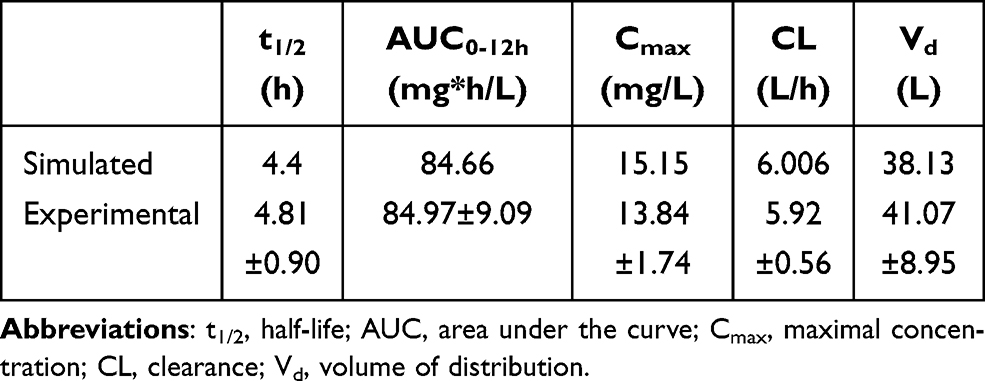 |
Table 4 Pharmacokinetic Parameters of LNZ |
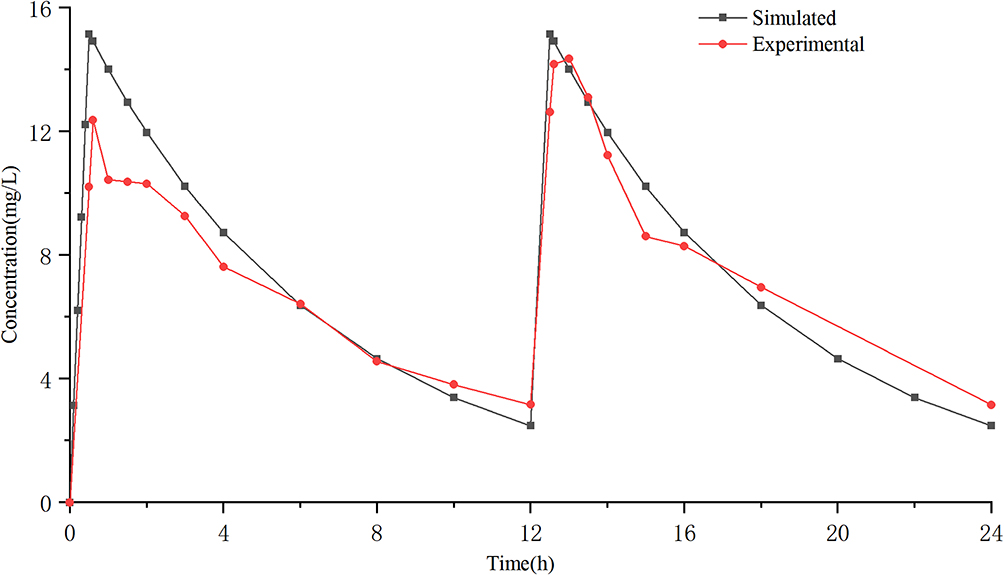 |
Figure 3 Concentration–time curve. |
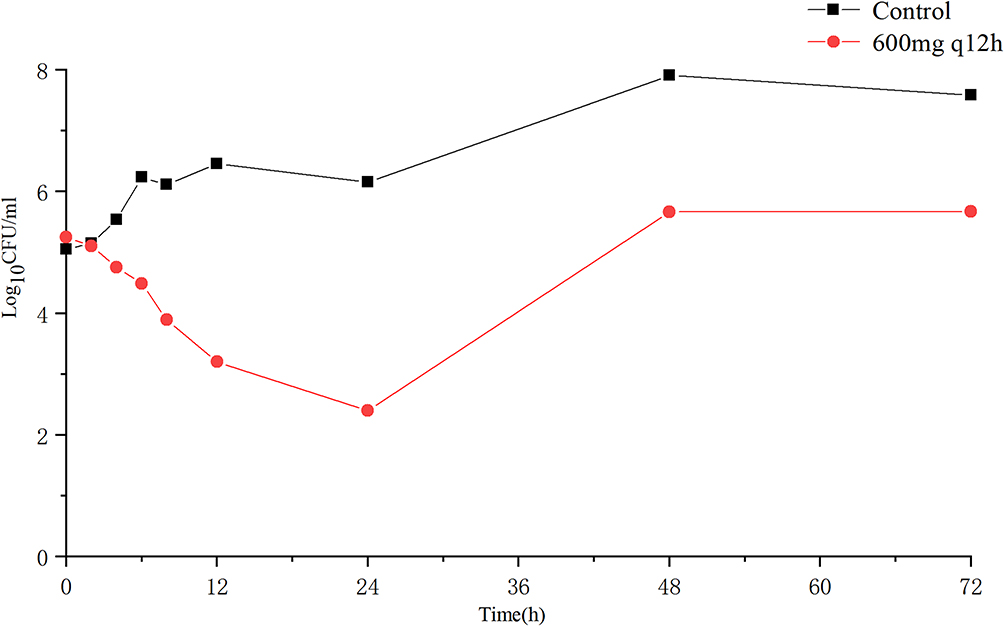 |
Figure 4 Bacterial kill and regrowth curve. |
Discussion
Antibiotic resistance has become a global public health problem, especially the infection caused by multidrug-resistant bacteria, which often means serious illness and high mortality. Linezolid is recommended for the treatment of community-acquired and hospital-acquired pneumonia caused by MRSA, which is one of the pathogens causing multiple-drug resistance.16 The clinically recommended intravenous dose is 600mg q12h, administered at 0.5h.1,17 Our groups were also interested in the activity of LNZ against MRSA isolates. In this study, an in vitro PK/PD model was used to simulate the clinical intravenous dose of linezolid to observe its antibacterial activity against a clinically isolated MRSA strain.
A simple, specific and automatable HPLC assay was developed to quantify linezolid in broth using deproteinization method and UV detection. The major advantage of this assay is the sample preparation deproteinization with acetonitrile is a simple procedure, with good recoveries. The impurity are almost completely separated in the first 6 minutes of the assay and do not affect the quantitative determination of linezolid. Another advantage of the present method over previously reported methods is the application of fully automatic injection techniques and the relatively short detection time, meeting the need for rapid and accurate detection.7–11,18,19
As seen in Figure 3, the closeness of experimental data from the in vitro PK/PD infection model and the simulated pharmacokinetic curve up to 24 h suggests the reliability of the model in simulating drug concentrations over time and the concentration remained above 2mg/L during the 3 days treatment. As shown in Table 4, there are minor differences between the experimental parameters and simulated parameters analyzed by Phoenix Winnonlin 8.3, demonstrating the successful establishment of the in vitro PK/PD model.
The growth control group reached 7.9 Log10CFU/mL at 48 h indicating that the in vitro PK/PD model represents cultivated bacteria well (Figure 4). In the 600 mg q12h group, the Log10CFU/mL value decreased to 2.39 in the initial 24h, showed great bactericidal effect on the clinical MRSA isolate. However, bacterial regrowth was observed after 24h and the colony reached 5.67 Log10CFU/mL at 48h, while LNZ remained above the minimum inhibitory concentration (MIC) of 2 mg/L. We can also seen that the colony count remained at 5.67 Log10CFU/mL until 72h. These findings indicated the emergence of drug resistance in vitro PK/PD model. The results of one-way ANOVA (Table 5) showe that there was a statistically significant difference (P<0.05) in colony growth between the experimental group and the control group during the whole experiment period (P=0.003), indicating that linezolid showed bacteriostatic activity against this clinical isolate in the whole 3 days of treatment. Linezolid demonstrated bacteriostatic20–24 and bactericidal20,25–27 activities against target pathogens has been reported elsewhere. Why we can observed the regrowth of colony in the dosing group? Maybe drug resistance mutation occurred, the resistance mutation frequency of Staphylococcus to LNZ under natural conditions was 10−9–10−11.30 Boak et al28 investigated the PK/PD factors influencing emergence of resistance to linezolid in an in vitro model that similar with us, four strains including MRSA isolate has been studied. The simulation with 600 mg q12h provided a >3-Log10 reduction in the number of CFU/mL for all four strains in 3 days assay which was differ from our study. Firsov et al29,30 applied inoculum with an S. aureus parent strain was supplemented with derived linezolid-resistant cells that were selected through extensive passaging on linezolid-containing media to simulate the mutation frequency and they observed the enrichment of resistant mutants with AUC/MIC=30, AUC/MIC=60 and AUC/MIC=120 groups that contained the clinical dose regimen. To our knowledge, this is the first investigation that found the loss of susceptibility of MRSA isolate to linezolid without use of mixed inoculum. The risk factors for the development of resistance, including the use of inadequate linezolid doses, long durations of therapy and the nature of the infection, have been reported.31–33 We can infer that the resistance of the MRSA to linezolid will continue to develop in the central compartment with 600mg q12h administration simulation.
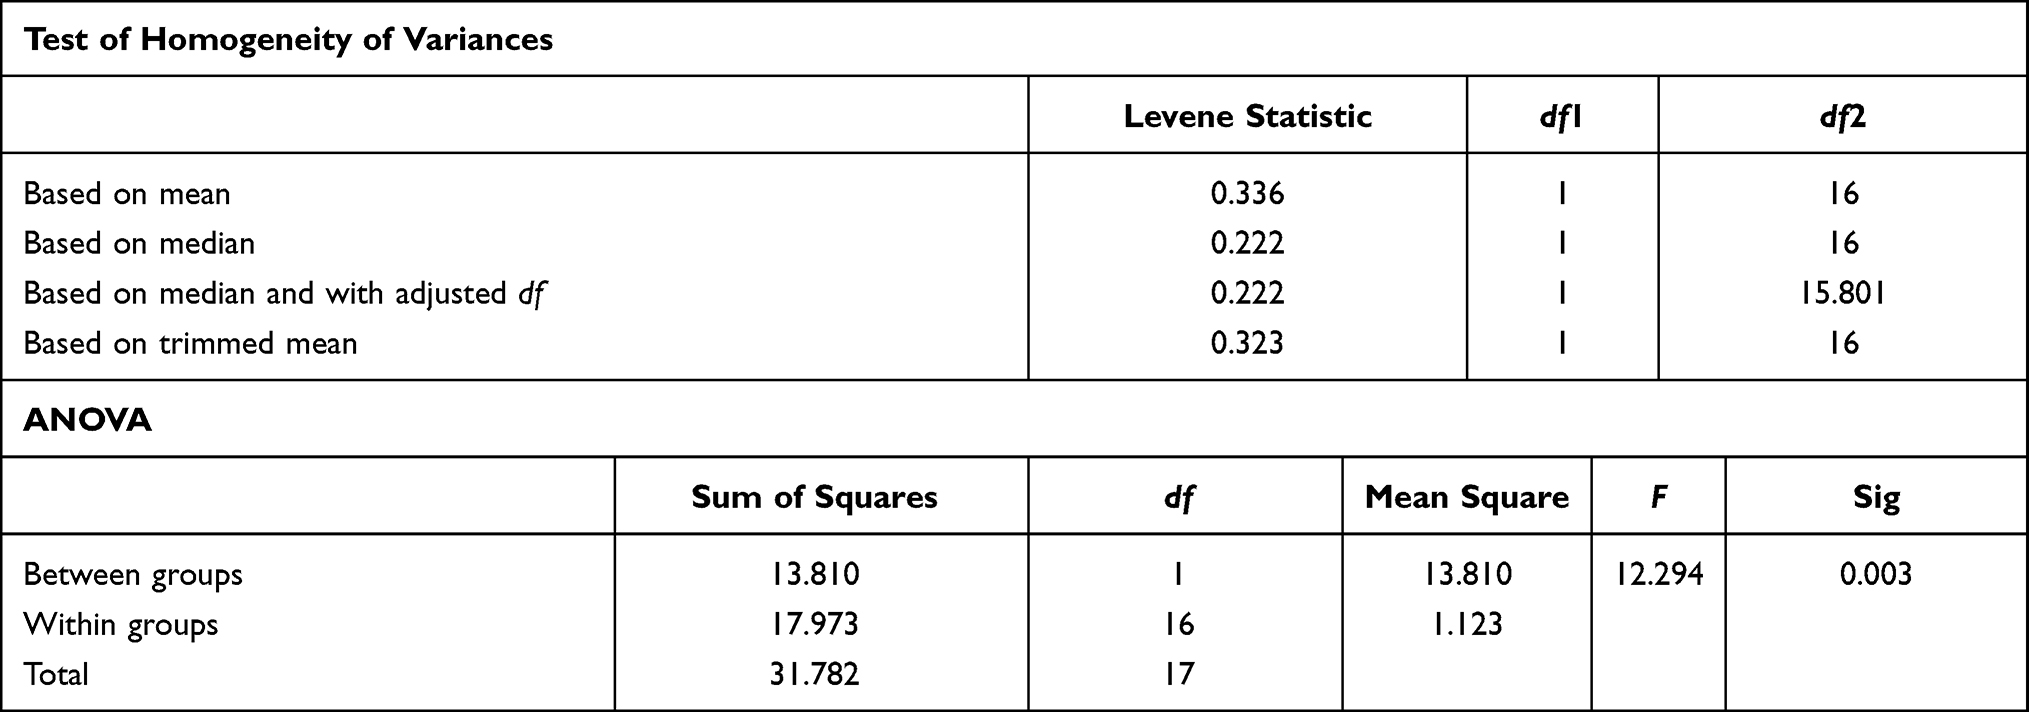 |
Table 5 The Results of One-Way ANOVA of Logarithmic Changes About 600mg LNZ q12h Group vs Control Group in 3 Days Simulation |
The emergence of resistance can be explained by the hypothesis of MSW, that is the concentration range from the MIC to the mutant prevention concentration (MPC), within which it is proposed that resistant mutants are enriched or selected.34 During the treatment, the concentration of linezolid may fall within the MSW for a long time in vitro PK/PD model. The mechanism of resistance to linezolid may be linked to the domain V region of the 23S rRNA gene; G2576T mutation is known to be the most prevalent.35 Closing the mutant selection window (MSW) is an effective solution to delay emergence of bacterial resistance, and there was no enrichment of resistant mutant occurred when the AUC/MIC reached 240.30 However, this value was twofold higher than that in clinical trial. Combination is another solution, Jiang et al36 observed that linezolid combined with fosfomycin closing each other’s mutant selection window through Mueller–Hinton Agar dilution method.
The limitaion of our study was only a single linezolid regimen was simulated and the pharmacodynamic index that best predicts the development of linezolid resistance was not elucidated. Further studies evaluating a range of linezolid exposures are necessary to describe better with the pharmacodynamics of linezolid resistance. These results imply that for the treatment of MRSA infection, the usual doses and administration of linezolid need to be optimized to suppress the emergence of resistance, and this in vitro PK/PD model can guide antibiotic studies for dose optimization.
Conclusion
We established an in vitro PK/PD model and an HPLC-UV method to measure the concentration of LNZ. The method’s LLOQ of 0.125 mg/L for LNZ easily meets the requirements for drug detection well below the intended MIC of 2 mg/L. The present method is simple, rapid, and sensitive, with good recoveries, and is selective and quantitative for the in vitro evaluation of linezolid efficacy. In vitro experimental data were similar to the simulated plasma data, further confirming the appropriateness of the experimental design to quantitate antibiotics and to study the emergence of antimicrobial resistance in real time. An emergence of resistance was occurred in LNZ 3 days administration simulation. These results also indicate that the usual clinical dose of linezolid should be optimized to suppress the emergence of resistance.
Acknowledgments
This study was supported by the National Natural Science Foundation of China (81173133), the Fund of Excellent Talents in Colleges and Universities of Anhui Province, China (gxbjZD06), and the Fund of Academic Leaders of Anhui Province, China (2015D068).
Disclosure
The authors report no conflicts of interest in this work.
References
1. Perry CM, Jarvis B. Linezolid: a review of its use in the management of serious gram-positive infections. Drugs. 2001;61(4):525–551. published correction appears in Drugs 2003;63(19);61(4):2126. doi:10.2165/00003495-200161040-00008
2. Doern CD, Park JY, Gallegos M, et al. Investigation of linezolid resistance in staphylococci and enterococci. J Clin Microbiol. 2016;54(5):1289–1294. doi:10.1128/JCM.01929-15
3. Chen H, Li L, Liu Y, et al. in vitro activity and post-antibiotic effects of linezolid in combination with fosfomycin against clinical isolates of Staphylococcus aureus. Infect Drug Resist. 2018;11:2107–2115. doi:10.2147/IDR.S175978
4. Zhou YF, Xiong YQ, Tao MT, et al. Increased activity of linezolid in combination with rifampicin in a murine pneumonia model due to in vitro. J Antimicrob Chemother. 2018;73(7):1899–1907. doi:10.1093/jac/dky129
5. Louie A, Maynard M, Duncanson B, et al. Determination of the dynamically linked indices of fosfomycin for Pseudomonas aeruginosa in the hollow fiber infection model. Antimicrob Agents Chemother. 2018;62(6):e02627–17. doi:10.1128/AAC.02627-17
6. Dryden MS. Linezolid pharmacokinetics and pharmacodynamics in clinical treatment. J Antimicrob Chemother. 2011;66(4):iv7–iv15. doi:10.1093/jac/dkr072
7. Boak LM, Li J, Nation RL, Rayner CR. High-performance liquid chromatographic method for simple and rapid determination of linezolid in human plasma. Biomed Chromatogr. 2006;20(8):782–786. doi:10.1002/bmc.597
8. Li J, Rayner CR, Dixson S, et al. Simple method for the assay of linezolid in brain heart infusion broth by high-performance liquid chromatography. Biomed Chromatogr. 2004;18(1):1–5. doi:10.1002/bmc.283
9. Toutain J, Boselli E, Djabarouti S, et al. Determination of linezolid in plasma and bronchoalveolar lavage by high-performance liquid chromatography with ultraviolet detection using a fully automated extraction method. J Chromatogr B Analyt Technol Biomed Life Sci. 2004;813(1–2):145–150. doi:10.1016/j.jchromb.2004.09.030
10. Davis LT, Kumar N, Nijm LM, et al. An adaptable HPLC method for the analysis of frequently used antibiotics in ocular samples. J Chromatogr B Analyt Technol Biomed Life Sci. 2010;878(26):2421–2426. doi:10.1016/j.jchromb.2010.08.001
11. Ba BB, Nso BB, Quentin C, et al. Determination of linezolid in growth media by high-performance liquid chromatography with on-line extraction. J Chromatogr B Analyt Technol Biomed Life Sci. 2007;854(1–2):104–108. doi:10.1016/j.jchromb.2007.04.011
12. CLSI. Methods for Dilution Antimicrobial Susceptibility Tests for Bacteria That Grow Aerobically.
13. Stalker DJ, Jungbluth GL, Hopkins NK, et al. Pharmacokinetics and tolerance of single- and multiple-dose oral or intravenous linezolid, an oxazolidinone antibiotic, in healthy volunteers. J Antimicrob Chemother. 2003;51(5):1239–1246. doi:10.1093/jac/dkg180
14. Stalker DJ, Jungbluth GL. Clinical pharmacokinetics of linezolid, a novel oxazolidinone antibacterial. Clin Pharmacokinet. 2003;42(13):1129–1140. doi:10.2165/00003088-200342130-00004
15. Bioanalytical method validation guidance for industry. Available from: http://www.fda.gov/Drugs/GuidanceComplianceRegulatoryInformation/Guidances/default.htm.
16. Lodise TP
17. Chavanet P. The ZEPHyR study: a randomized comparison of linezolid and vancomycin for MRSA pneumonia. Med Mal Infect. 2013;43(11–12):451–455. doi:10.1016/j.medmal.2013.09.011
18. Fernandes GFDS, Salgado HRN, Santos JLD. A critical review of HPLC-based analytical methods for quantification of Linezolid. Crit Rev Anal Chem. 2020;50(3):196–211. doi:10.1080/10408347.2019.1605876
19. Kumar L, Yadav YS, Rathnanand M. Simultaneous determination of linezolid and levamisole hydrochloride in a fixed dose combination. Indian J Pharm Educ Res. 2017;51(4):613–619. doi:10.5530/ijper.51.4.91
20. Allen GP, Cha R, Rybak MJ. In vitro activities of quinupristin-dalfopristin and cefepime, alone and in combination with various antimicrobials, against multidrug-resistant staphylococci and enterococci in an in vitro pharmacodynamic model. Antimicrob Agents Chemother. 2002;46(8):2606–2612. doi:10.1128/AAC.46.8.2606-2612.2002
21. Cha R, Akins RL, Rybak MJ. Linezolid, levofloxacin, and vancomycin against vancomycin-tolerant and fluoroquinolone-resistant Streptococcus pneumoniae in an in vitro pharmacodynamic model. Pharmacotherapy. 2003;23(12):1531–1537. doi:10.1592/phco.23.15.1531.31964
22. Gunderson BW, Ibrahim KH, Peloquin CA, et al. Comparison of linezolid activities under aerobic and anaerobic conditions against methicillin-resistant Staphylococcus aureus and vancomycin-resistant Enterococcus faecium. Antimicrob Agents Chemother. 2003;47(1):398–399. doi:10.1128/AAC.47.1.398-399.2003
23. Jacqueline C, Batard E, Perez L, et al. In vivo efficacy of continuous infusion versus intermittent dosing of linezolid compared to vancomycin in a methicillin-resistant Staphylococcus aureus rabbit endocarditis model. Antimicrob Agents Chemother. 2002;46(12):3706–3711. doi:10.1128/AAC.46.12.3706-3711.2002
24. LaPlante KL, Rybak MJ. Impact of high-inoculum Staphylococcus aureus on the activities of nafcillin, vancomycin, linezolid, and daptomycin, alone and in combination with gentamicin, in an in vitro pharmacodynamic model. Antimicrob Agents Chemother. 2004;48(12):4665–4672. doi:10.1128/AAC.48.12.4665-4672.2004
25. Cha R, Brown WJ, Rybak MJ. Bactericidal activities of daptomycin, quinupristin-dalfopristin, and linezolid against vancomycin-resistant Staphylococcus aureus in an in vitro pharmacodynamic model with simulated endocardial vegetations. Antimicrob Agents Chemother. 2003;47(12):3960–3963. doi:10.1128/AAC.47.12.3960-3963.2003
26. Cha R, Rybak MJ. Linezolid and vancomycin, alone and in combination with rifampin, compared with moxifloxacin against a multidrug-resistant and a vancomycin-tolerant Streptococcus pneumoniae strain in an in vitro pharmacodynamic model. Antimicrob Agents Chemother. 2003;47(6):1984–1987. doi:10.1128/AAC.47.6.1984-1987.2003
27. Oramas-Shirey MP, Buchanan LV, Dileto-Fang CL, et al. Efficacy of linezolid in a staphylococcal endocarditis rabbit model. J Antimicrob Chemother. 2001;47(3):349–352. doi:10.1093/jac/47.3.349
28. Boak LM, Li J, Rayner CR, et al. Pharmacokinetic/pharmacodynamic factors influencing emergence of resistance to linezolid in an in vitro model. Antimicrob Agents Chemother. 2007;51(4):1287–1292. doi:10.1128/AAC.01194-06
29. Firsov AA, Alieva KN, Strukova EN, et al. Testing the mutant selection window hypothesis with Staphylococcus aureus exposed to linezolid in an in vitro dynamic model. J Antimicrob Chemother. 2017;72(11):3100–3107. doi:10.1093/jac/dkx249
30. Firsov AA, Golikova MV, Strukova EN, et al. In vitro resistance studies with bacteria that exhibit low mutation frequencies: prediction of “antimutant” linezolid concentrations using a mixed inoculum containing both susceptible and resistant Staphylococcus aureus. Antimicrob Agents Chemother. 2015;59(2):1014–1019. doi:10.1128/AAC.04214-14
31. Birmingham MC, Rayner CR, Meagher AK, et al. Linezolid for the treatment of multidrug-resistant, gram-positive infections: experience from a compassionate-use program. Clin Infect Dis. 2003;36(2):159–168. doi:10.1086/345744
32. Pai MP, Rodvold KA, Schreckenberger PC, et al. Risk factors associated with the development of infection with linezolid- and vancomycin-resistant Enterococcus faecium. Clin Infect Dis. 2002;35(10):1269–1272. doi:10.1086/344177
33. Roberts SM, Freeman AF, Harrington SM, et al. Linezolid-resistant Staphylococcus aureus in two pediatric patients receiving low-dose linezolid therapy. Pediatr Infect Dis J. 2006;25(6):562–564. doi:10.1097/01.inf.0000219401.70804.1a
34. Firsov AA, Smirnova MV, Lubenko IY, et al. Testing the mutant selection window hypothesis with Staphylococcus aureus exposed to daptomycin and vancomycin in an in vitro dynamic model. J Antimicrob Chemother. 2006;58(6):1185–1192. doi:10.1093/jac/dkl387
35. Wu D, Yan B, Yang X, et al. Whole-genome sequencing for detecting linezolid resistance in a patient with persistent methicillin-resistant Staphylococcus aureus infection during linezolid exposure. Int J Antimicrob Agents. 2020;55(1):105819. doi:10.1016/j.ijantimicag.2019.09.023
36. Jiang L, Xie N, Chen M, et al. Synergistic combination of linezolid and fosfomycin closing each other’s mutant selection window to prevent enterococcal resistance. Front Microbiol. 2021;11:605962. doi:10.3389/fmicb.2020.605962
 © 2021 The Author(s). This work is published and licensed by Dove Medical Press Limited. The
full terms of this license are available at https://www.dovepress.com/terms
and incorporate the Creative Commons Attribution
- Non Commercial (unported, 3.0) License.
By accessing the work you hereby accept the Terms. Non-commercial uses of the work are permitted
without any further permission from Dove Medical Press Limited, provided the work is properly
attributed. For permission for commercial use of this work, please see paragraphs 4.2 and 5 of our Terms.
© 2021 The Author(s). This work is published and licensed by Dove Medical Press Limited. The
full terms of this license are available at https://www.dovepress.com/terms
and incorporate the Creative Commons Attribution
- Non Commercial (unported, 3.0) License.
By accessing the work you hereby accept the Terms. Non-commercial uses of the work are permitted
without any further permission from Dove Medical Press Limited, provided the work is properly
attributed. For permission for commercial use of this work, please see paragraphs 4.2 and 5 of our Terms.