Back to Journals » Diabetes, Metabolic Syndrome and Obesity » Volume 15
Development and Validation of a Simple Risk Model for Predicting Metabolic Syndrome (MetS) in Midlife: A Cohort Study
Authors Ibrahim MS ![]() , Pang D, Randhawa G, Pappas Y
, Pang D, Randhawa G, Pappas Y ![]()
Received 24 October 2021
Accepted for publication 15 January 2022
Published 6 April 2022 Volume 2022:15 Pages 1051—1075
DOI https://doi.org/10.2147/DMSO.S336384
Checked for plagiarism Yes
Review by Single anonymous peer review
Peer reviewer comments 3
Editor who approved publication: Dr Konstantinos Tziomalos
Musa S Ibrahim, Dong Pang, Gurch Randhawa, Yannis Pappas
Institute for Health Research, University of Bedfordshire, Putteridge Bury Luton, Bedfordshire, LU2 8LE, England
Correspondence: Musa S Ibrahim, Tel +447918698231, Email [email protected]
Purpose: To develop and validate a simple risk model for predicting metabolic syndrome in midlife using a prospective cohort data.
Design: Prospective cohort study.
Participants: A total of 7626 members of the 1958 British birth cohort (individuals born in the first week of March 1958) participated in the biomedical survey at age 45 and have completed information on metabolic syndrome.
Methods: Variables utilised were obtained prospectively at birth, 7, 16, 23 and 45 years. Multivariable logistic regression was used to develop a total of ten (10) MetS risk prediction models taking the life course approach. Measures of discrimination and calibration were used to evaluate the performance of the models. A pragmatic criteria developed was used to select one model with the most potential to be useful. The internal validity (overfitting) of the selected model was assessed using bootstrap technique of Stata.
Main Outcome Measure: Metabolic syndrome was defined based on the NCEP-ATP III clinical criteria.
Results: There is high prevalence of MetS among the cohort members (19.6%), with males having higher risk as compared to females (22.8% vs 16.4%, P < 0.001). Individuals with MetS are more likely to have higher levels of HbA1c and low HDL-cholesterol. Similarly, regarding the individual components of MetS, male cohort members are more likely to have higher levels of glycaemia (HbA1c), BP and serum triglycerides. In contrast, female cohort members have lower levels of HDL-cholesterol and higher levels of waist circumference. Furthermore, a total of ten (10) MetS risk prediction models were developed taking the life course approach. Of these, one model with the most potential to be applied in practical setting was selected. The model has good accuracy (AUROC 0.91 (0.90, 0.92)), is well calibrated (Hosmer-Lemeshow 6.47 (0.595)) and has good internal validity.
Conclusion: Early life factors could be included in a risk model to predict MetS in midlife. The developed model has been shown to be accurate and has good internal validity. Therefore, interventions targeting socioeconomic inequality could help in the wider prevention of MetS. However, the validity of the developed model needs to be further established in an external population.
Keywords: metabolic syndrome, prediction model, risk score, development and validation of risk model, 1958 British birth cohort, national child development study
Introduction
Worldwide, the prevalence of Metabolic Syndrome (MetS) - “a clustering of risk factors which includes hypertension, central obesity, impaired glucose metabolism with insulin resistance, and dyslipidemia”1 is high and rising, with nearly one in four adults affected.2 The diagnosis of MetS increases an individual’s risk of developing CVD by two to threefold, T2DM by fivefold and all-cause mortality by twofold.3 Furthermore, MetS is recognised as a useful tool for identifying individuals at increased risk of CVD and T2DM. Hence, the WHO stress that it should be viewed as a premorbid state of CVD and T2DM rather than a distinct clinical disease.4
There is increased popularity in the use of risk prediction models in public health/ clinical practice, partly due to availability of large datasets, advanced statistical methods and computational power.5 Furthermore, abdominal obesity is generally presumed to be central to the diagnosis of MetS, but, not all individuals with obesity have MetS and vice versa.6 Without a valid test, it may not be possible to detect or suspect MetS in non-obese individuals.7 Identifying the subset of individuals (both obese and non-obese) with MetS is necessary and could have implications on subsequent management approach.7 Thus, an accurate and reliable MetS prediction model could be used in screening individuals at increased risk of MetS. Focusing on assessing risk of MetS provides a single unifying theme which could enable clinicians to identify an individual’s global risk of CVD and T2DM (holistic approach).8 Therefore, both from clinical and public health perspective, early identification and control of MetS is of great significance, as it could result in the reduction of T2DM and CVD related morbidity and mortality.
Previous evidence suggests that the risk of MetS starts early on in life9,10 and persists into adulthood.11 This makes it appropriate to use life course approach in the studies of MetS.12 Early life risk factors are as important in the development of MetS as adult risk factors. In order to effectively prevent and manage MetS, an approach which is holistic and equitable should be employed, focusing on risk factors (both biological and psychosocial) acquired at different stages of life.13 Therefore, the purpose of this study is to develop and validate a simple prediction model taking a life course approach using a prospective birth cohort data to forecast risk of MetS in midlife.
Subjects and Methods
Participants
The 1958 British birth cohort, also known as the National Child Development Study (NCDS). The full details of the cohort are previously provided.14 Briefly, the cohort consists of 18,558 individuals born in the first week of March 1958 in Britain. It was originally set-up to investigate the factors (both obstetric and social) responsible for the high perinatal mortality (stillbirth rate). In subsequent years, the NCDS was adjusted and used for monitoring how the members are developing (educationally, physically and socially) as they grow from infancy to adulthood. Since its inception, regular prospective follow-ups have been conducted both in childhood and adulthood.
Between the years 2002 and 2003 (cohort members aged 44/45 years), follow up was conducted in a form of a biomedical survey. The main purpose of the survey was to objectively collect measures of disease and biomedical risk factors to address a wide range of specific hypotheses relating to anthropometry, cardiovascular system, respiratory system and allergic diseases, visual and hearing impairment, and mental health. This survey was carried out by registered research nurses who visited cohort members at their homes or specified research clinics within that period. A total of 9377 cohort members participated in the survey. However, only 8585 participants consented for all the four parts of the investigation.
In terms of demography, the 1958 British birth cohort is predominantly white (typical representation of Great Britain at the beginning of the cohort). Nevertheless, the sample has been shown to represent the national population concerning many socioeconomic characteristics during follow-ups at 33 years as well as the 45 year survey.15
The 1958 British birth cohort data is managed by the United Kingdom Data Service, based at the University of Essex, UK. We accessed the anonymized data after obtaining a formal permission from them. In the same vein, the ethical approval for this study was granted by Institute for Health Research Ethics Committee, University of Bedfordshire.
Variables
Predictors
This study utilised predictors that are well established in the literature and clinically relevant.
Sociodemographic Characteristics
The main demographic variables considered are gender and socioeconomic status.
Socioeconomic conditions/Social class: participants’ childhood social class is defined according to registrar general’s classification of the father’s occupation in 1958 (OPCS, 1987). Where this information is not available, the father’s occupation at age 7 is used. Furthermore, cohort members’ socioeconomic conditions at age 21/23 years and 33/ 45 years were used.12 Categorisation is same as the social categories at birth (I–V). Based on the above, a binary variable of social class was generated as (Non-manual vs manual).12
Early Life Predictors
Early-life factors were all recorded prospectively at birth (birth weight, gestational age and childhood social class) or at age 7 (BMI at 7 years, household crowding and family history of T2DM).
Birth weight: The study participants’ birth weight was recorded in pounds and ounces. Before analysis, this was converted to kilograms (kg) and categorised into quartiles.
Gestational age: participants’ gestational age as reported by mothers was recorded in days. This was converted to weeks and gestational age less than 38 weeks is defined as “Preterm”.16
Family history of T2DM: this was elicited during the survey conducted at age 7 with response Yes or No. In this analysis, family history of T2DM is treated as a binary variable.
BMI at 7 years: Participants’ weight (kg) and height (cm) measured during the follow-up at age 7 were used to compute BMI (kg/m2) at 7.
Household overcrowding: was assessed by determining the ratio of the number of individuals by the total number of rooms in a given house. Household having ≥1.5 persons per room is considered overcrowded.12
Adolescence/Early Adulthood Factors (16 and 23 Years)
BMI at 16 and 23 years: Participants’ weight (kg) and height (cm) measured during the follow-up at ages 16 and 23 years were used to compute BMI (kg/m2) for the respective ages. BMI was classified based on standard adult categories as; underweight <18.5 kg/m2, normal 18.5–24.9, overweight 25–29.9 and obese ≥30 kg/m2.
Socioeconomic status at 16 and 23 years: Same as above.
Adulthood Predictors (45 Years)
Blood pressure, HDL-cholesterol, triglycerides, waist circumference and high HbA1c, are the adult predictors considered in this study.2,17–20 See below for description.
Outcome Variables
In this study, the primary outcome of interest is MetS defined based on the NCEP-ATP III clinical criteria. Information regarding the individual components of MetS was collected during the NCDS biomedical survey (when cohort members were 43–45 years) by a trained registered research nurse, using standard protocols. However, because fasting plasma glucose (FPG) was not recorded in the biomedical survey, glycosylated haemoglobin (HbA1c) was used as a proxy variable.12,21,22 MetS is identified at the age of 43–45 years old if three or more of the following occurred:
Blood Pressure
Blood pressure was measured in a quiet room using an Omron 705CP automated sphygmomanometer (Omron, Tokyo, Japan). A hypertension variable was generated as systolic blood pressure of 130 mmHg or higher, or diastolic blood pressure of 85 mmHg or higher. Hypertension was assessed as a binary outcome, using the above definition.
Blood Glucose (Glycated Haemoglobin (HbA1c)
In the biomedical survey, HbA1c was investigated using ion-exchange high-performance liquid chromatography (HLC-723GHbA1c 2.2; Tosoh Corp, Tokyo Japan).This technique has been adjudged to be standard and reproducible.23,24 In this analysis, high blood glucose variable was derived based on the data of glycated hemoglobin at age 45 years. Noteworthy, HbA1c ≥6.5% has been shown to be a good predictor of diabetes in previous modelling studies.25,26 But for the purpose of identifying MetS, a lower cut-off point of HbA1c ≥6.0% (which corresponds to pre- diabetes)21,22 is usually considered. Therefore, the cut-off point of HbA1c ≥6.0% is used in this study. High blood glucose was treated as a binary variable during further analysis.
HDL-Cholesterol
Enzymatic methods with an autoanalyser (Olympus AU640, Japan) were used to measure High-density lipoprotein cholesterol (HDL-C). Based on the data available for HDL-cholesterol, a low HDL cholesterol variable was generated. Low HDL-cholesterol was defined as <0.40 g/L for men and <0.50 g/L for women (NCEP, 2001) and was treated as a binary outcome variable during further statistical analysis.
Triglycerides
Triglycerides were also measured using enzymatic methods with an autoanalyser (Olympus AU640, Japan). Triglycerides level of ≥150 mg/dL was used as the cut-off level in this study and was treated as a binary outcome variable during further statistical analysis.
Abdominal Obesity
During the survey, waist circumference (WC) was measured using a tension tape at an imaginary meeting point between the lower rib and upper part of pelvis, in the mid-axillary line.27 During the procedure, participants were requested to be in a loose dress with the belt removed and relax their muscles of abdomen by breathing in and out. WC was measured and recorded to the nearest 1 centimeter (cm). In this study, abdominal obesity variable was generated as WC ≥102 cm for men or ≥88 cm for women.1
Covariates
The potential confounders included in this study were selected a priori based on the literature.
Early Life
Early life potential socioeconomic/ psychosocial stress: Proxy variables on birth and perinatal conditions were chosen to capture the heading and subsequent MetS. These include:
Maternal smoking during pregnancy: (no smoking, variable smoker, moderate smoker, heavy smoker),
Type of delivery: (vaginal, emergency caesarean, elective caesarean),
Mother’s parity: number of children previously borne by a mother in 1958,
Mother’s age at birth (23 years or less, 24 to 27 years, 28 to 31 years, and 32 years or more)
Foetal distress: No distress, Yes distress
Breastfed: collected at 7 years (no, yes for less than 1 month, yes more than 1 month).12
Adult Health Behaviours/Lifestyle
During the biomedical survey, information concerning the above mentioned was collected from the cohort members through the means of the computer-assisted self-administered interview (CASI).
Smoking status: is categorised as non-smoker (individuals who have never smoked), ex-smoker (smoked one or more cigarette per day in the past, but have currently stopped smoking) or current smoker (smoke one or more cigarettes per day).
Drinking status: is coded as non-drinker, 1–2 drinks per day, 3–4 drinks per day, 5–6 drinks per day, and ≥7 drinks per day.
Physical activity: level of physical activity is defined as
highly active (vigorous exercise at least once per week), moderately active (moderate exercise at least once per week) and not active (hardly ever/never moderate-vigorous exercise).12
BMI at 45 years: classified as; underweight <18.5 kg/m2, normal 18.5–24.9, overweight 25–29.9 and obese ≥30 kg/m2.
Statistical Methods
Descriptive Statistics
The study uses the information of 7626 members of the 1958 British birth cohort who have complete data regarding all components of MetS at 45 years. Chi-square test of association was initially conducted in order to test the association between MetS, its individual components, the selected predictors and confounders. The level of significance was set at P= 0.05.
Model Development
Variables Selection
Variables included in the logistic regression models were selected a priori based on the literature and clinical/public health relevance. Further, their significance to the understanding of the life course origin of MetS was also considered.
Model Specification
Using the stepwise logistic regression technique, various combination of the predictors was used to build models starting with gender and father’s social class at birth. Variables were included sequentially taking a life course approach. No pre-specified inclusion criteria were set. The only parameters of interest assessed are the stability and fit of the produced models. A total of 10 models with good fit and stability were initially selected for further assessment of performance. The analysis was performed both on complete cases and multiply imputed data.
Predictive Performance of the Developed Models
For the purpose of this study, the performance of the prediction models was assessed using the measures of discrimination and calibration.
Discrimination
This refers to the ability of a predictive risk model to distinguish participants that will develop the disease in context from those that will not.28 This is often assessed using sensitivity, specificity, and the Receiver Operator Characteristic (ROC) curve.28
In this study discrimination is assessed using measures of sensitivity, specificity and AUROC.
Calibration
Calibration is a statistical measure that evaluates whether what is being predicted by a risk model appears to be close to what is observed in reality over time.28 It is a further test of a model’s predictive power and is usually assessed along with discrimination.
In this study calibration is assessed using Hosmer–Lemeshow goodness-of-fit - estimates using deciles as well as calibration plots.
Missing Values
Missing values were imputed by multiple imputations by chain equations (MICE) method using the imputation by chained equation (ICE) programme of Stata29 in order to account for missing data. The final imputed datasets were based on m=10 imputations.
Selecting the Model with the Most Potential to Be Useful
Given the large number of models generated following the stepwise logistic regression, it is necessary to select one (with the most potentials to be used in a real-life setting). Central to this decision is the simplicity and accuracy of the model. To develop risk models which are clinically useful, the models’ simplicity and reliability of measurements are vital criteria.30,31 Complex models generated through extensive variable selection often lead to over-optimistic predictions.32 Thus, for any prediction model or risk score to be considered useful, it should be accurate (statistically significant calibration, and discrimination above 0.70), generalisable (externally validated by a separate research team on a different population) and usable (has few components that are commonly used in practical setting).33
Therefore, to prioritize risk models or scores at this stage of the analysis, pragmatic criteria were developed by the research team by modifying the criteria set by Wyatt and Altman30 and Altman et al.33 MetS risk prediction model is favored if it is accurate (has discrimination above 0.70 and statistically significant calibration), simple to use (contains few predictors that may not be difficult to obtain in a routine clinical setting). In addition to the above, the model should contain no more than two adult predictors. Finally, the model should contain predictors that can improve equity in the prevention of MetS.34
Adjusting for Potential Confounders
Potential confounders were added to the selected model in sequence; starting with those collected around birth (early life).
Internal Validity of the Selected Model
A random sample was drawn with replacement using the bootstrap command of Stata (Stata, 2015) with 1000 reps in order to test the internal validity of the selected model.
The summary of the stages involved in developing and internally validating the MetS risk prediction model is provided below:
- Variables selected a priori based on the literature, clinical/ public health relevance and their significance to the understanding of the life course origin of MetS.
- Multiple logistic regression models created using various combinations of early life predictors and adulthood predictors (life course approach).
- Ten (10) stable models with good fit were selected for further assessment of performance.
- Models’ performance was assessed using discrimination and calibration.
- Model with the most potentials to be useful was selected after applying the model selection criteria.
- Potential confounders were adjusted for sequentially.
- Internal validity of the selected model was assessed using the bootstrapping technique of Stata.
Results
Sample Characteristics
Table 1 above shows the summary characteristic of the studied sample in respect to MetS.
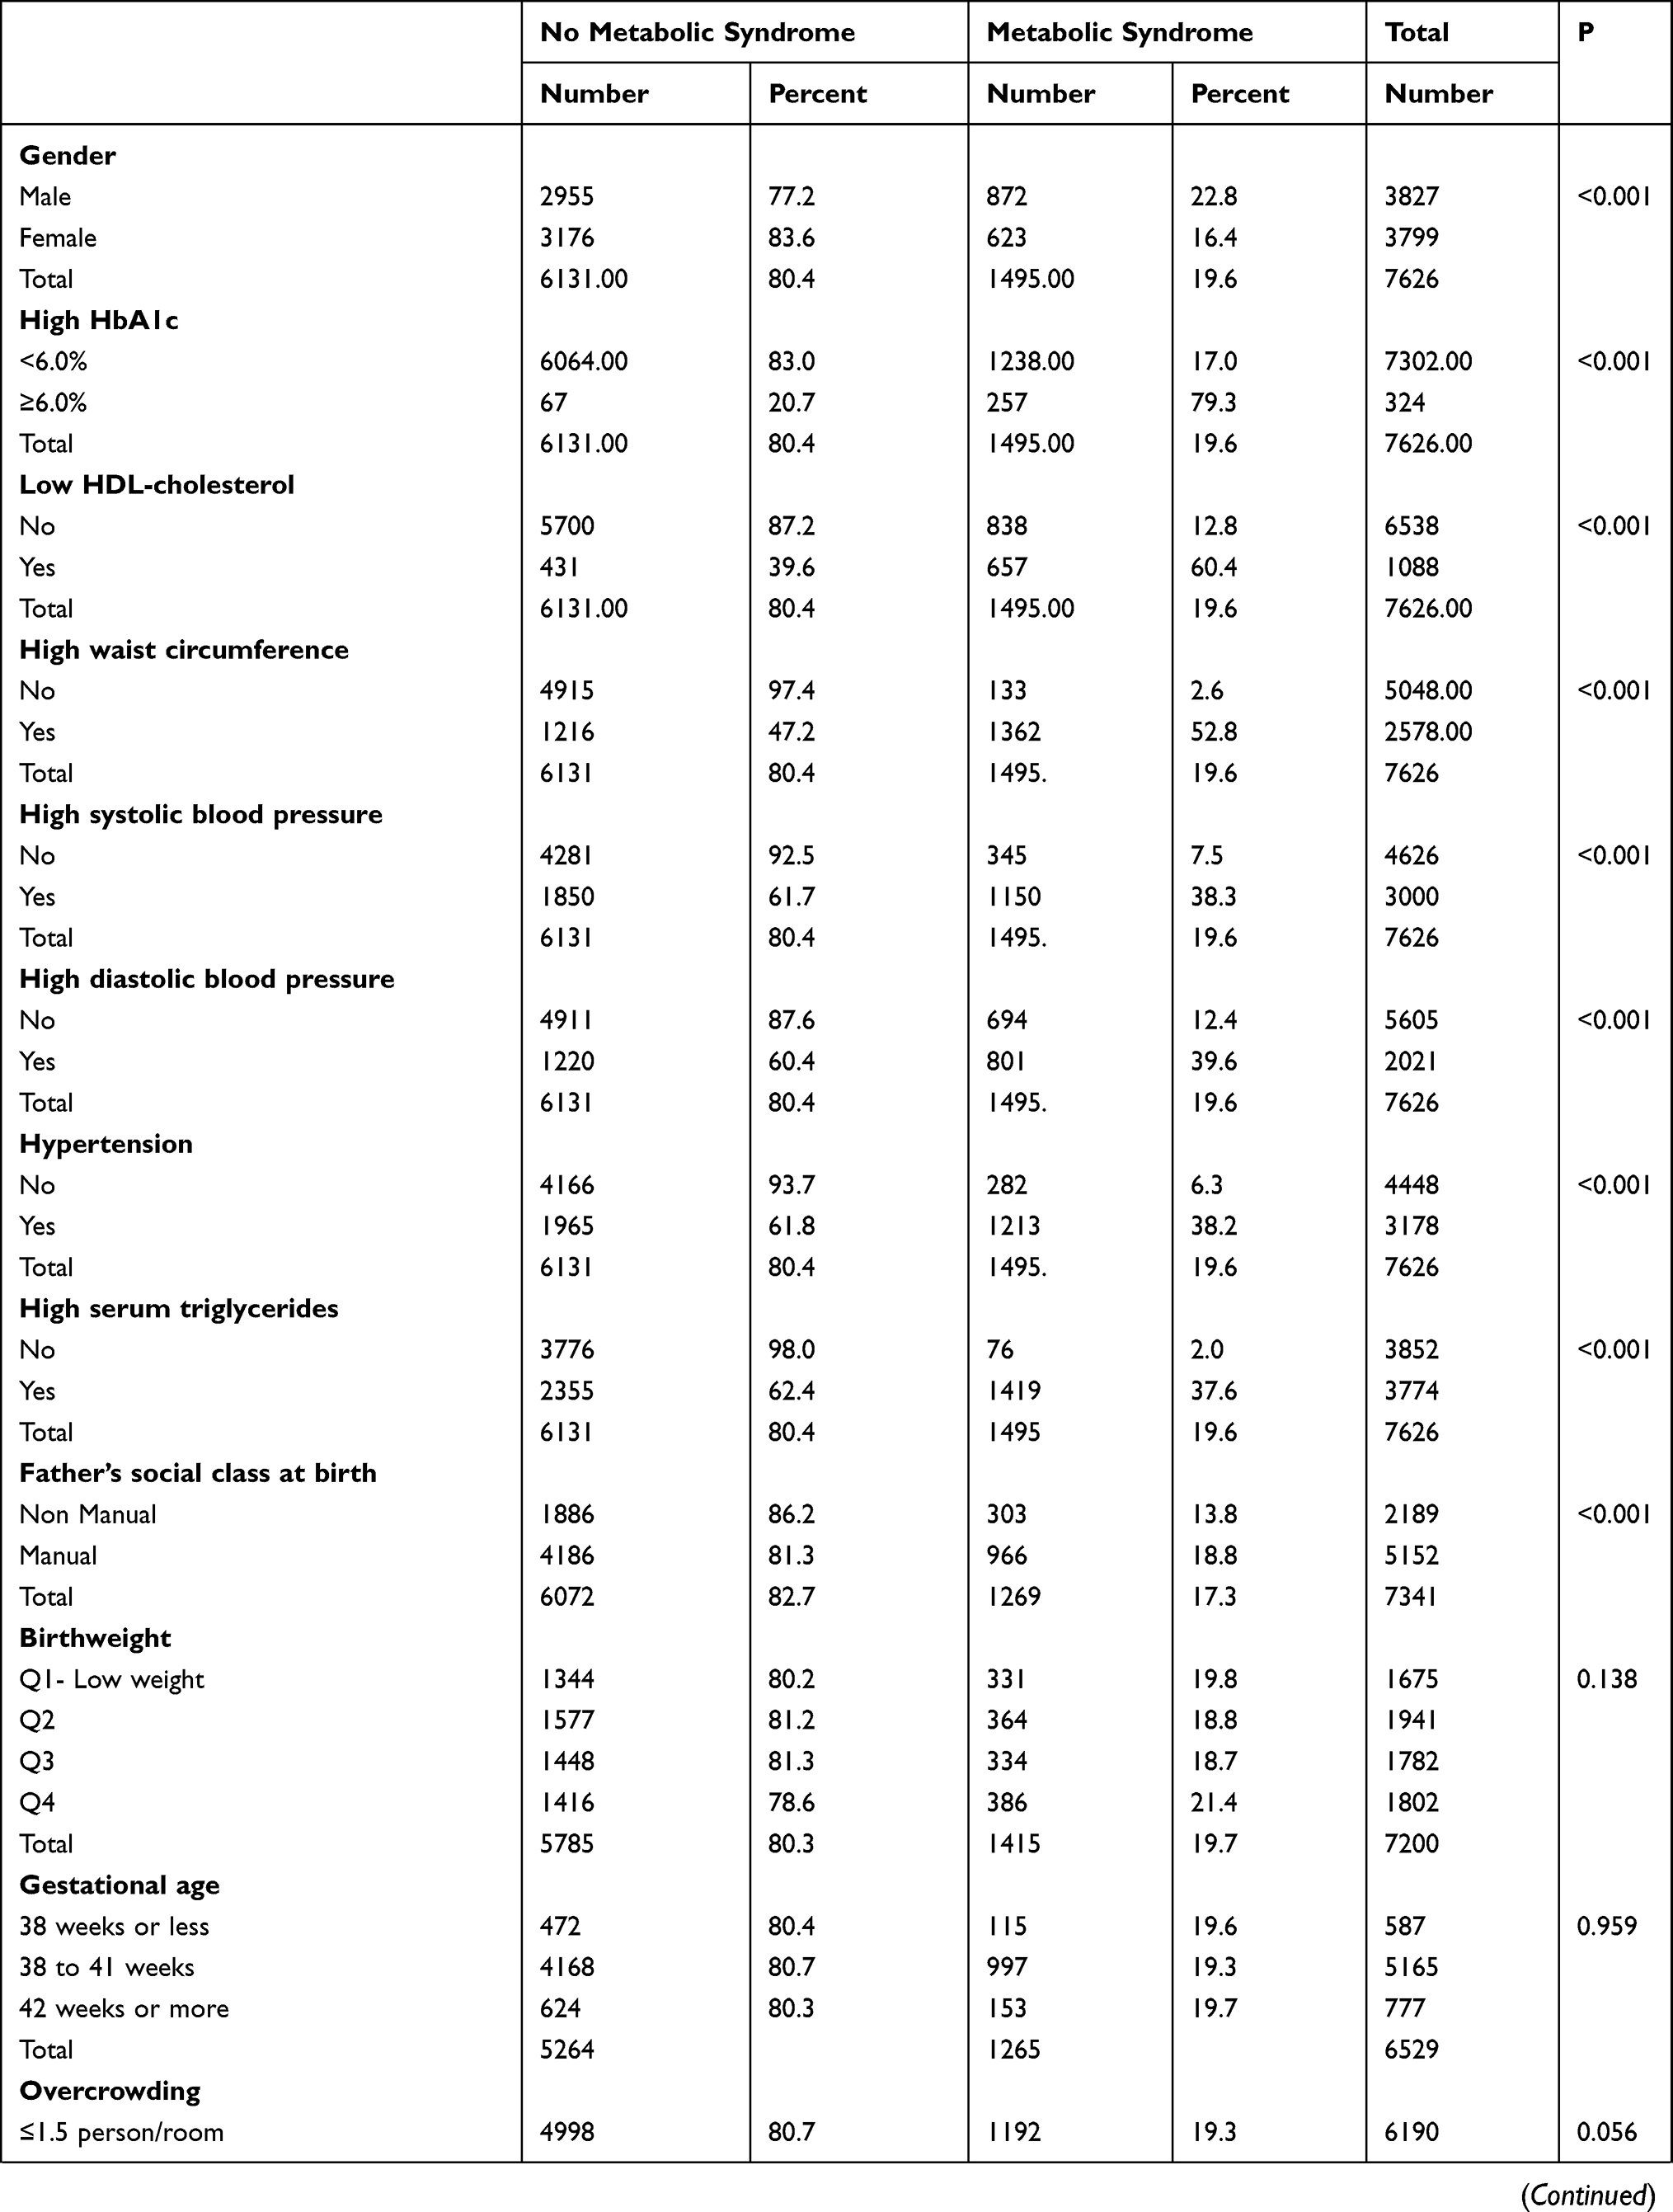 | 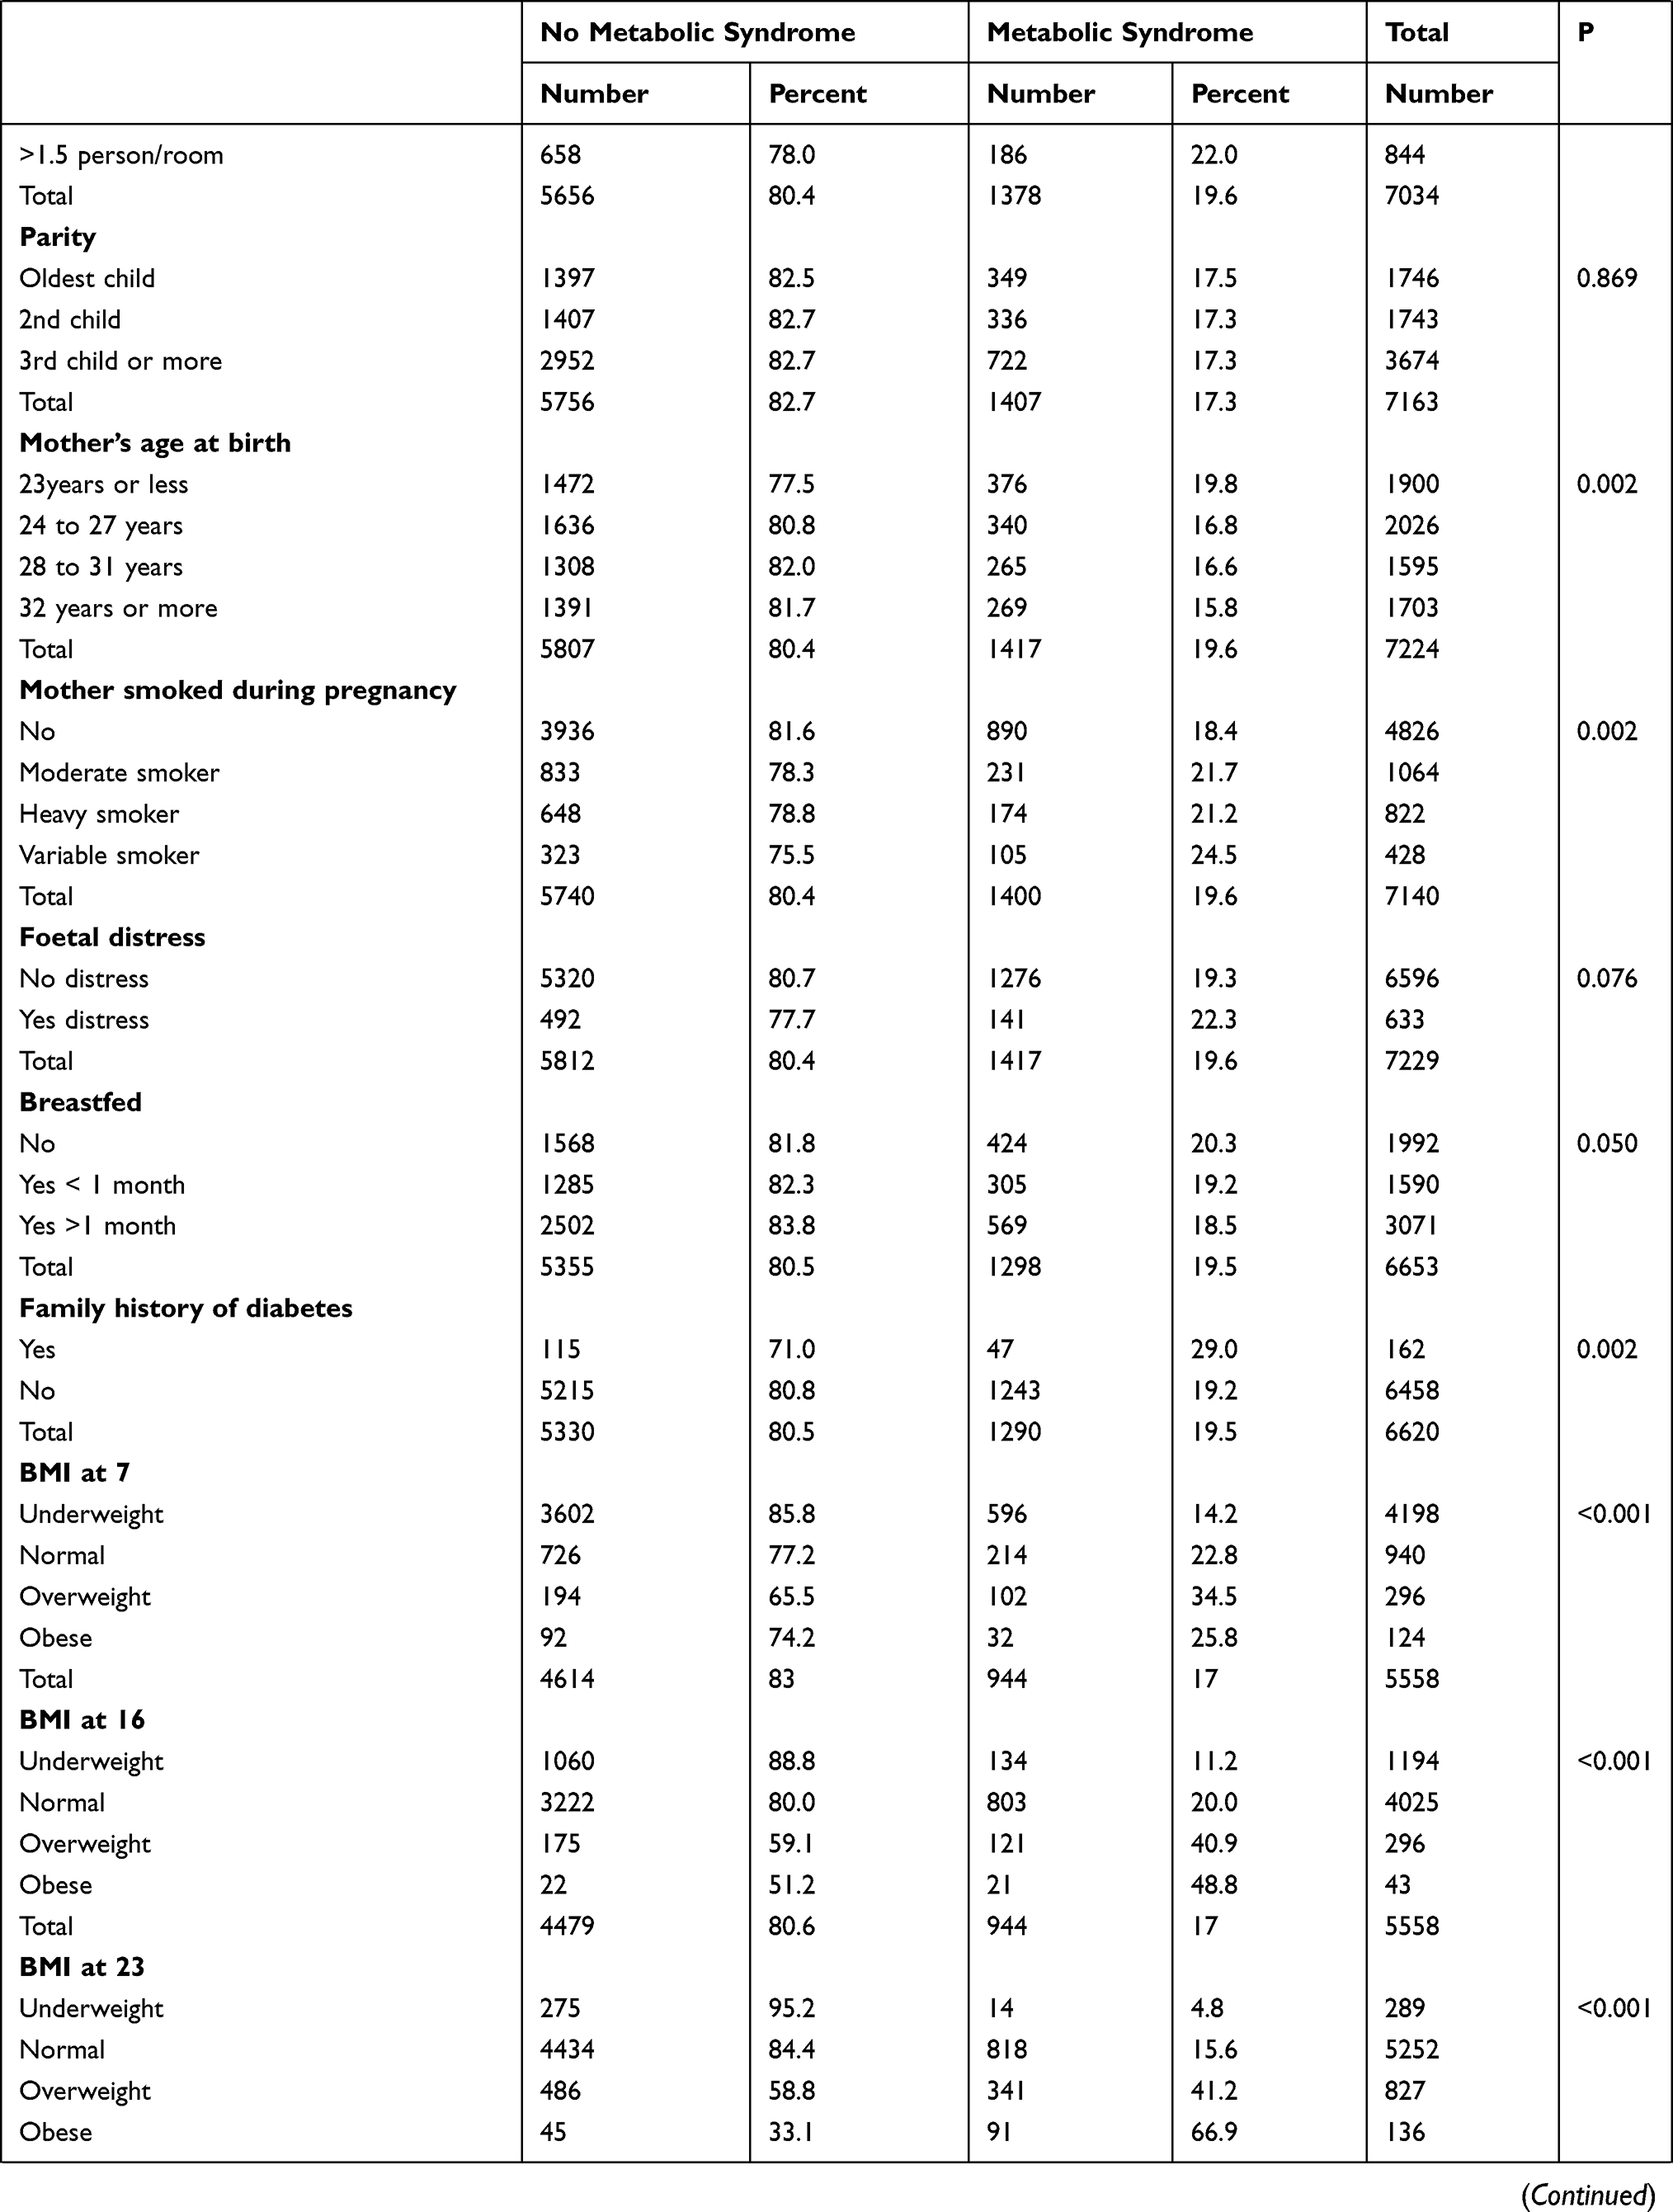 |  |
Table 1 Sample Characteristics |
Of the initial 18,558 cohort members at birth, 9377 participated in the biomedical survey at age 45. Out of these, complete information regarding MetS was obtained from 7626 individuals (81.33%). Therefore, this analysis is based on these 7626 individuals. The sample is almost equally split with males accounting for 3827 (50.2%) and females 3799 (49.8%). Overall, 19.6% of the sample has MetS based on modified NCEP-ATP III criteria. Male cohort members are more likely to develop MetS as compared to females (22.8% vs 16.4%, P <0.001).
Table 2 shows the gender differences in the prevalence of individual components of MetS. Male cohort members are more likely to have higher levels of glycaemia (HbA1c) (61.56% vs 38.44%, P <0.001), hypertension (67.40% vs 32.60%, P <0.001) and serum triglycerides (63.20% vs 36.80%, P <0.001).
 |
Table 2 Gender Differences in the Prevalence in the Individual Components of MetS |
On the contrary, female cohort members have lower levels of HDL-cholesterol (67.73% vs 32.27%, P <0.001) and higher levels of waist circumference (53.24% vs 46.76%, P <0.001).
Developing MetS Risk Prediction Models
After performing the stepwise multivariate logistic regression, a total of ten (10) stable prediction models with good fit were generated. The models consists of candidate variables (predictors) ranging from three (3) to seven (7), with the average being approximately five (5).
The logistic regression models developed are displayed in Tables 3–12
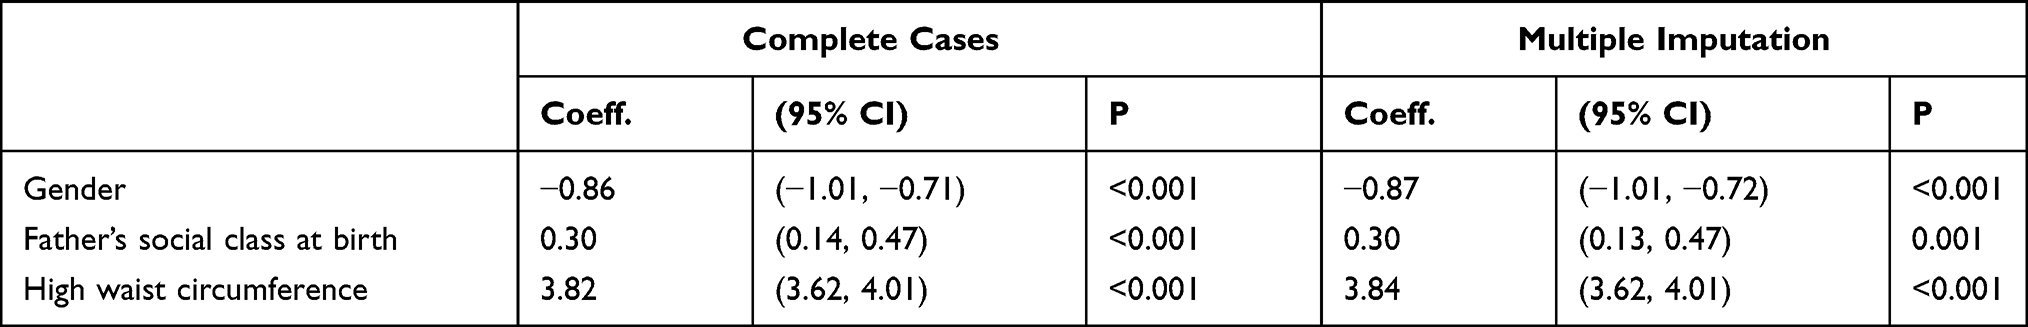 |
Table 3 Model 1 (MetS Prediction Model Consisting of Gender, Father’s Social Class at Birth and High Waist Circumference) |
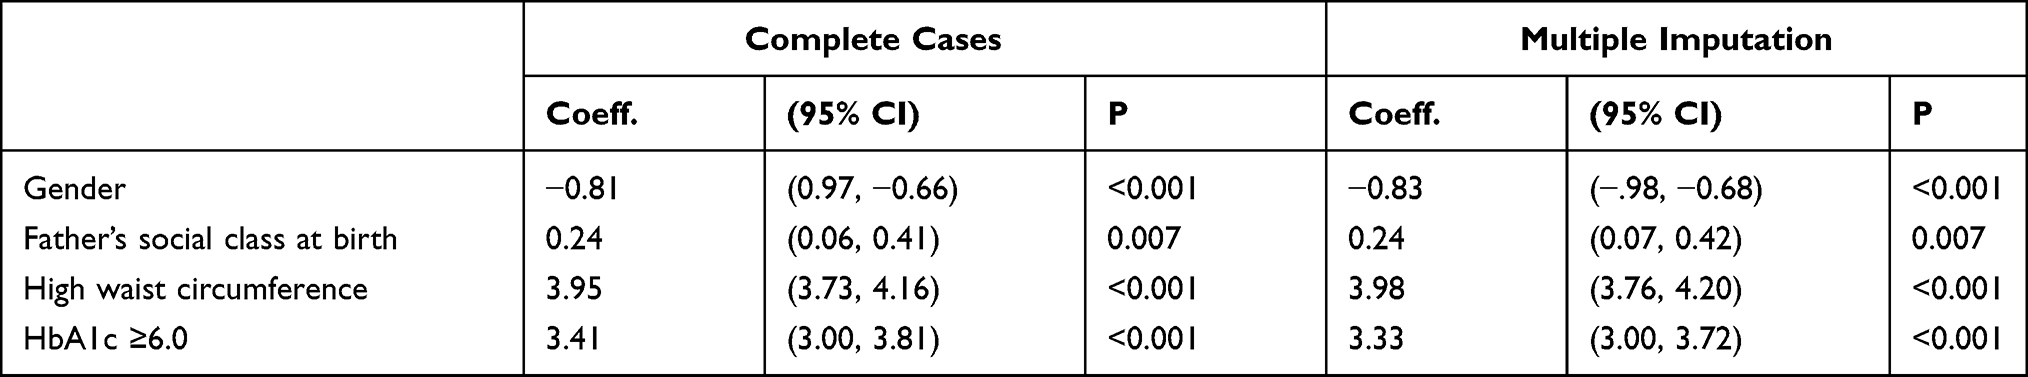 |
Table 4 Model 2 (MetS Prediction Model Consisting of Gender, Father’s Social Class at Birth, High Waist Circumference and HbA1c ≥6.0) |
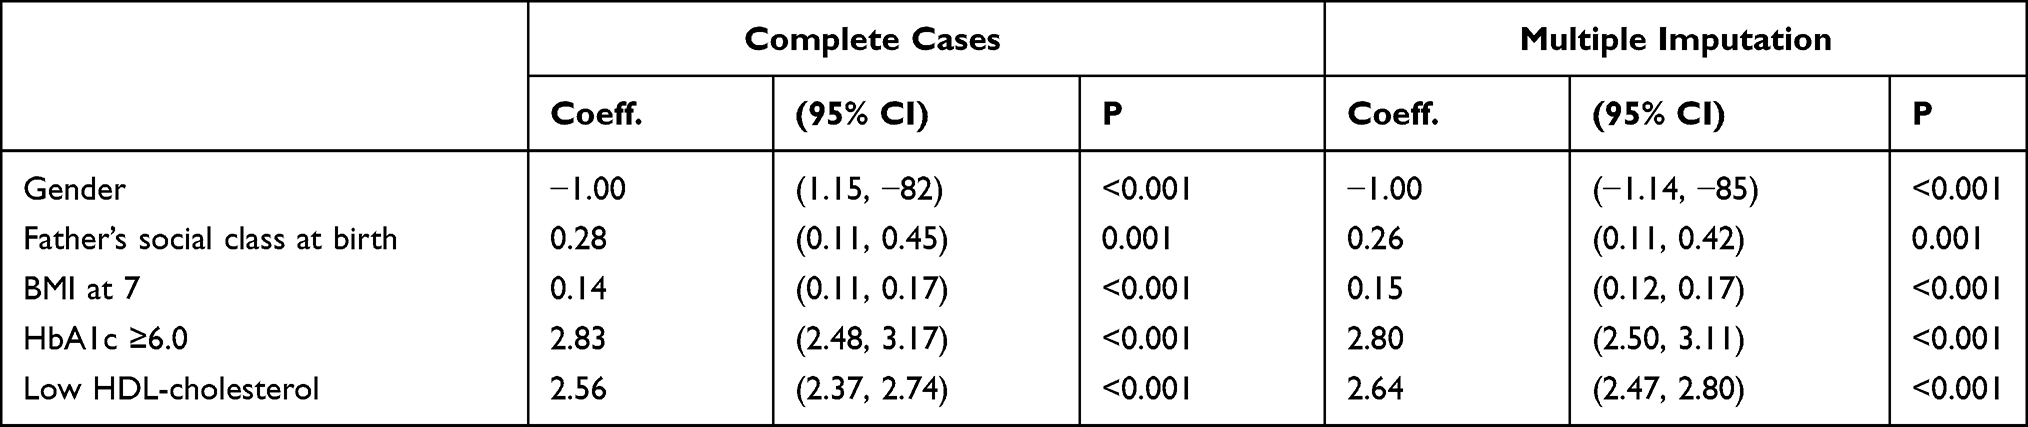 |
Table 5 Model 3 (MetS Prediction Model Consisting of Gender, Father’s Social Class at Birth, BMI at 7, HbA1c ≥6.0 and Low HDL-Cholesterol) |
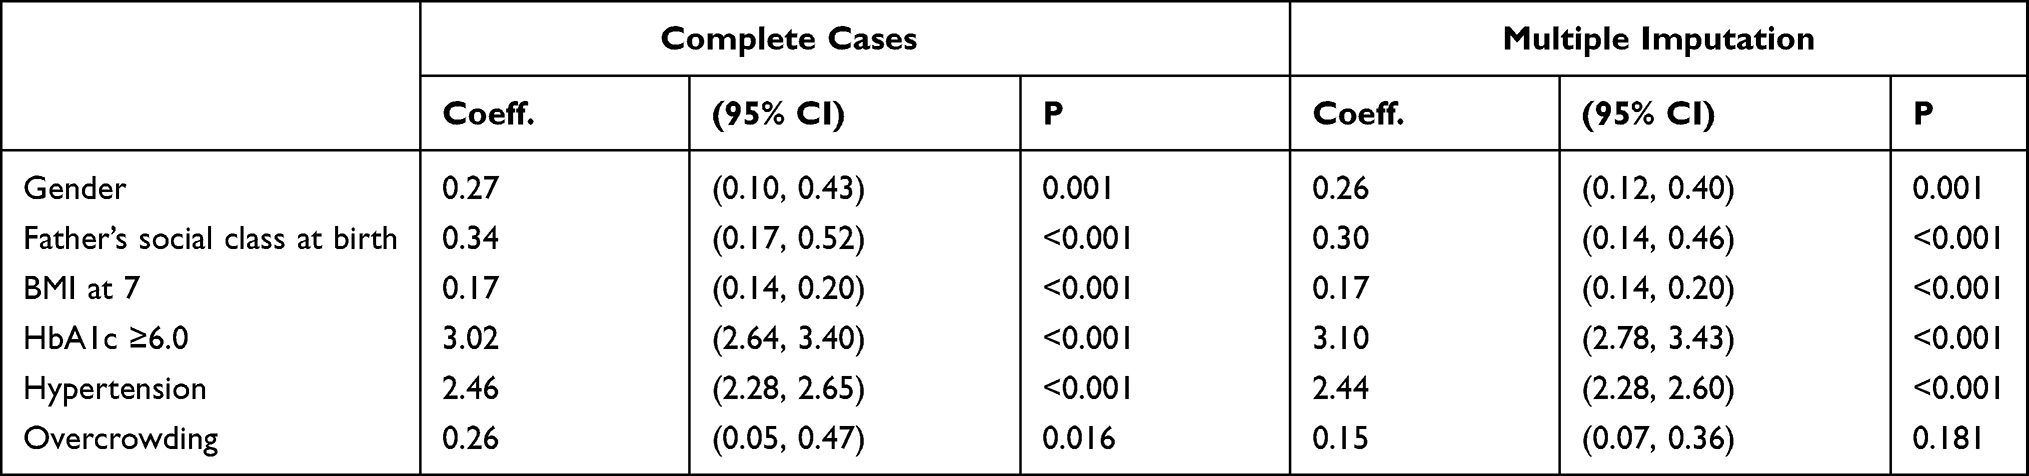 |
Table 6 Model 4 (MetS Prediction Model Consisting of Gender, Father’s Social Class at Birth, BMI at 7, HbA1c ≥6.0, Hypertension and Overcrowding) |
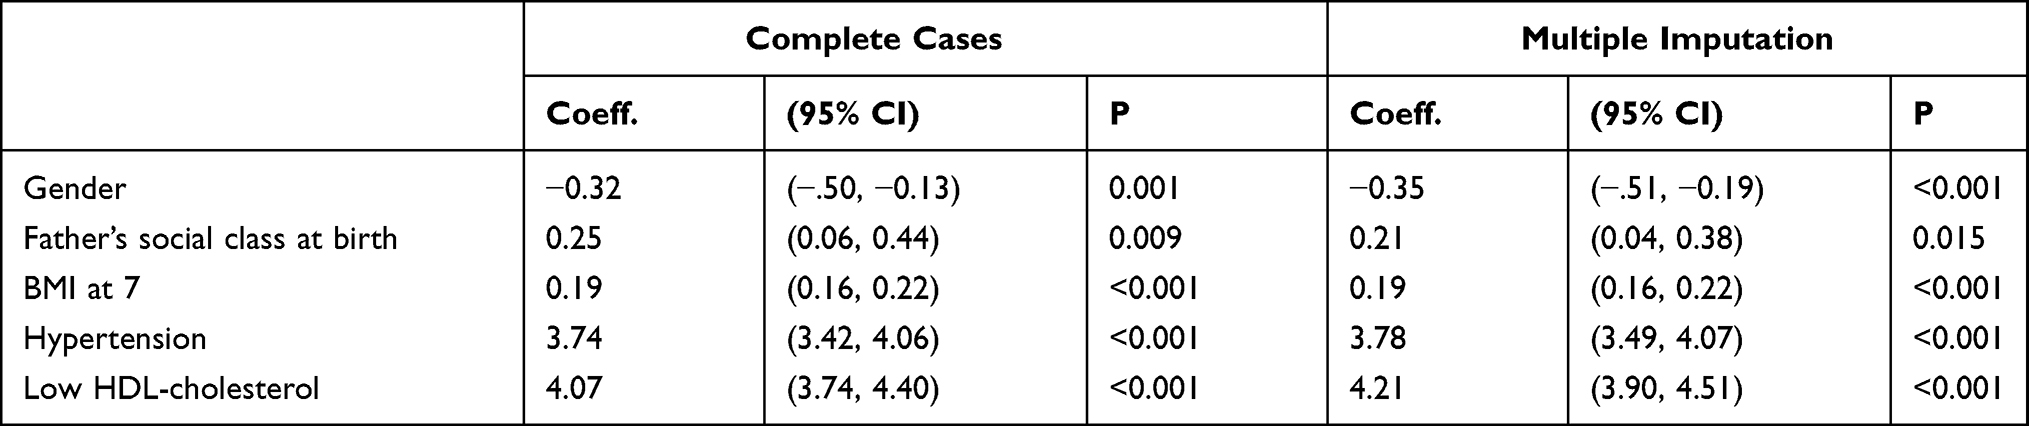 |
Table 7 Model 5 (MetS Prediction Model Consisting of Gender, Father’s Social Class at Birth, BMI at 7, Hypertension and HDL-Cholesterol) |
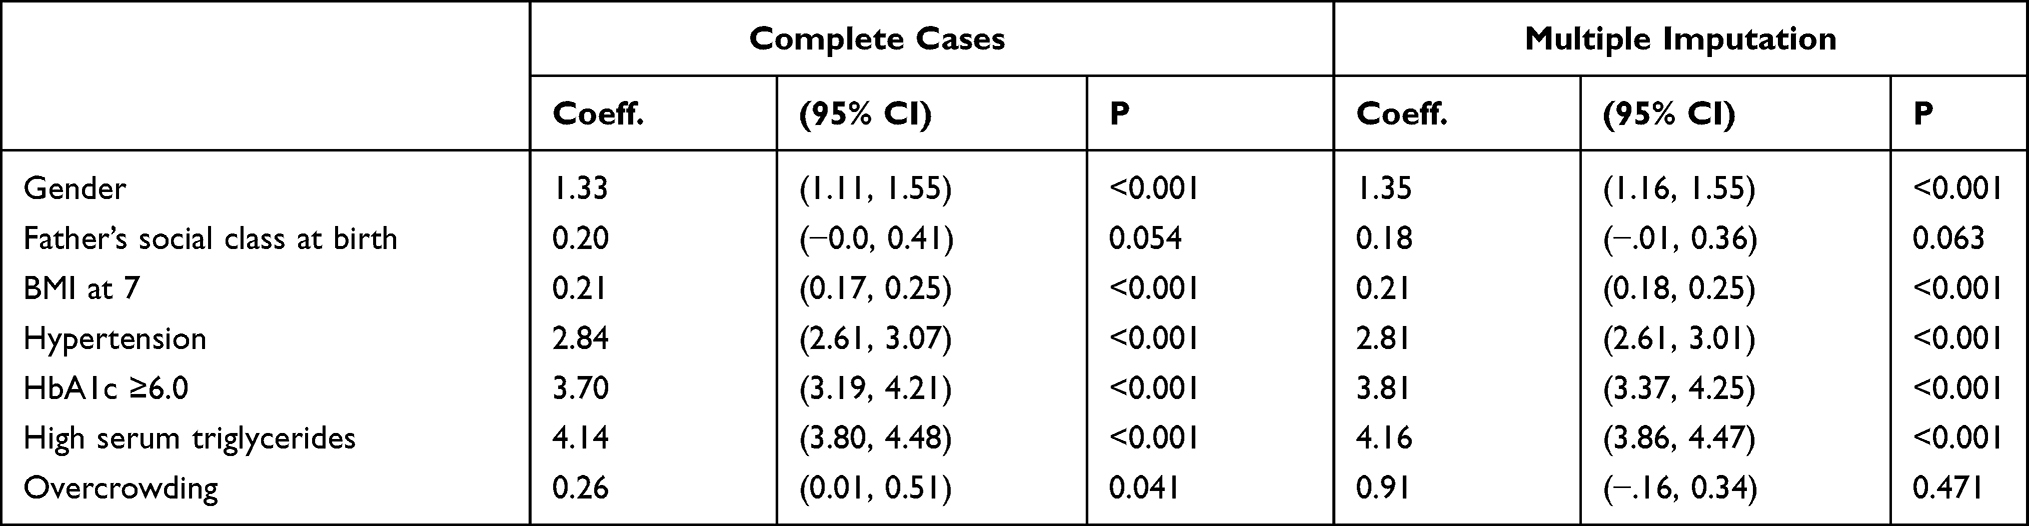 |
Table 8 Model 6 (MetS Prediction Model Consisting of Gender, Father’s Social Class at Birth, BMI at 7, HbA1c ≥6.0, Hypertension, High Serum Triglycerides and Overcrowding) |
 |
Table 9 Model 7 (MetS Prediction Model Consisting of Gender, Father’s Social Class at Birth, BMI at 7, Hypertension and High Serum Triglycerides) |
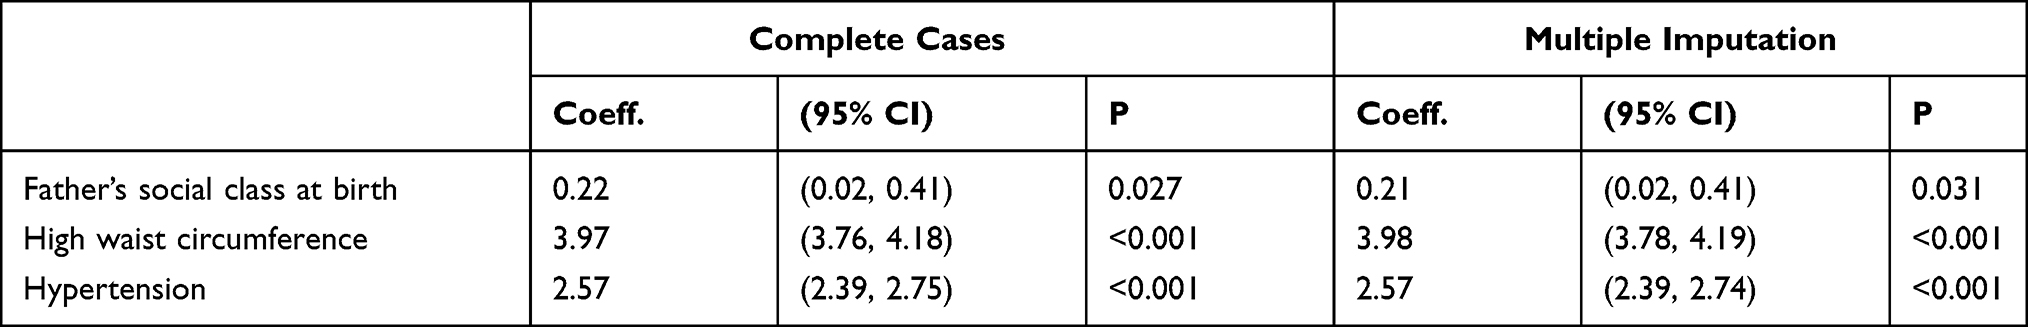 |
Table 10 Model 8 (MetS Prediction Model Consisting of Father’s Social Class at Birth, High Waist Circumference and Hypertension) |
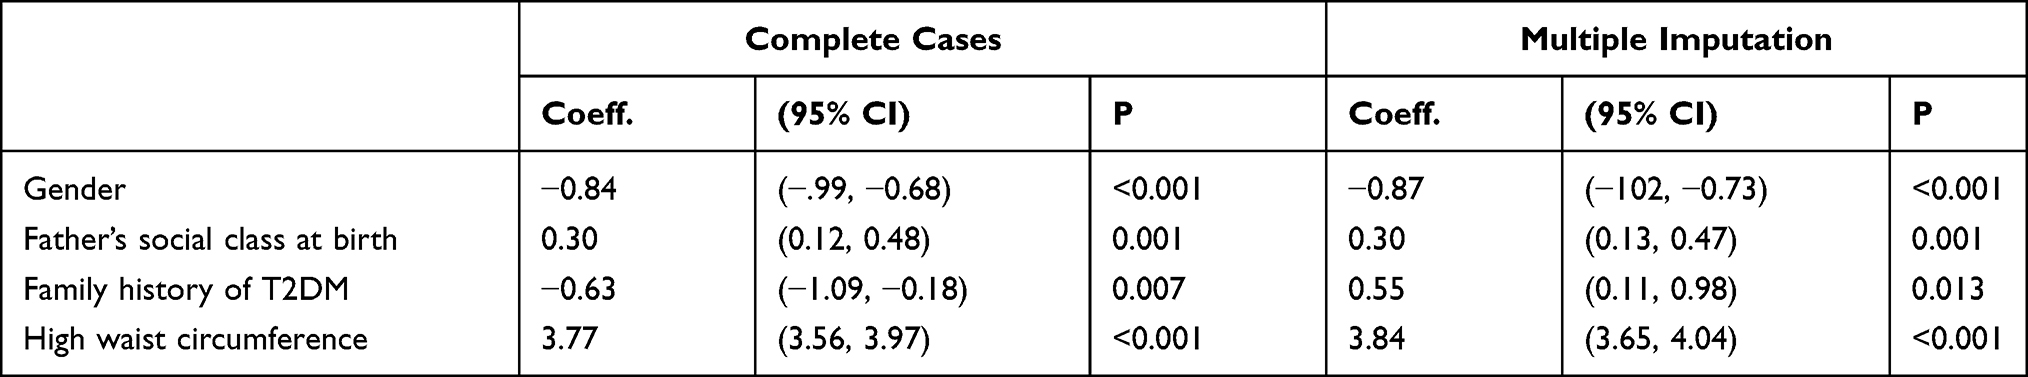 |
Table 11 Model 9 (MetS Prediction Model Consisting of Gender, Father’s Social Class at Birth, Family History of T2DM and High Waist Circumference) |
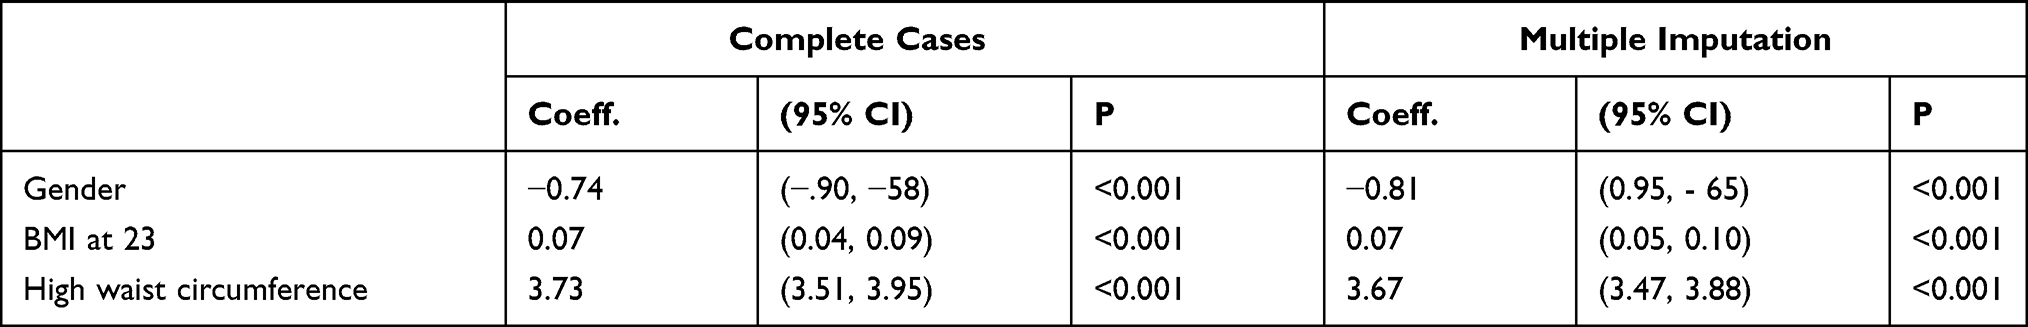 |
Table 12 Model 10 (MetS Prediction Model Consisting of Gender, BMI at 23 and High Waist Circumference) |
Performance of the Developed Models
Models Discrimination
Sensitivity analyses as well as ROC analyses were conducted in order to assess the discrimination of the models produced in this study. The ROC curves for all the ten (10) models were produced (see Figures 1–10).
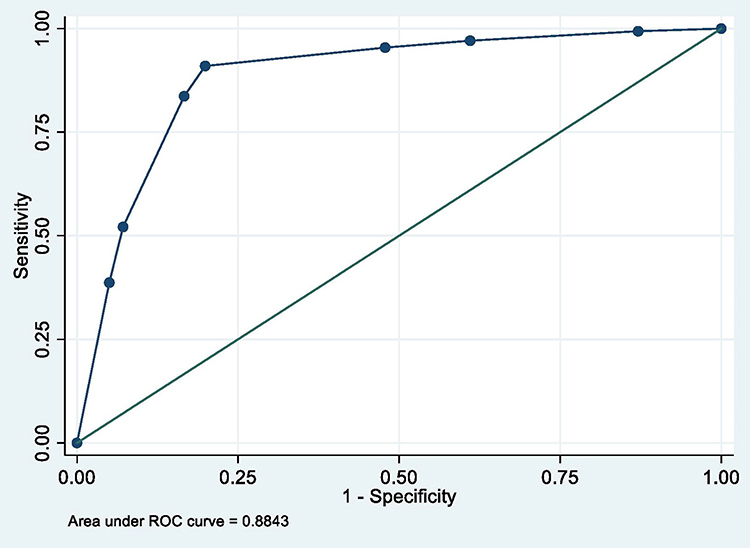 |
Figure 1 ROC curve of Model 1 (MetS prediction model consisting of gender, father’s social class at birth and high waist circumference). |
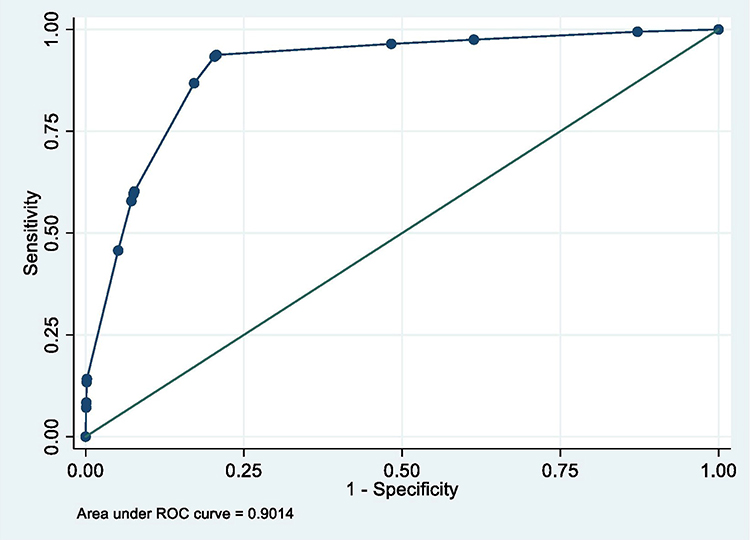 |
Figure 2 ROC curve of model 2 (MetS prediction model consisting of gender, father’s social class at birth, high waist circumference and HbA1c ≥6.0). |
 |
Figure 3 ROC curve of Model 3 (MetS prediction model consisting of gender, father’s social class at birth, BMI at 7, HbA1c ≥6.0 and low HDL-cholesterol). |
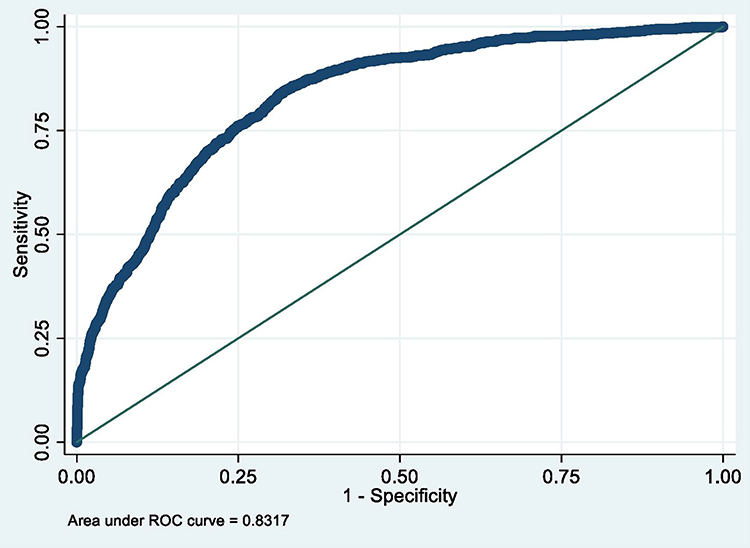 |
Figure 4 ROC curve of Model 4 (MetS prediction model consisting of gender, father’s social class at birth, BMI at 7, HbA1c ≥6.0, hypertension and overcrowding). |
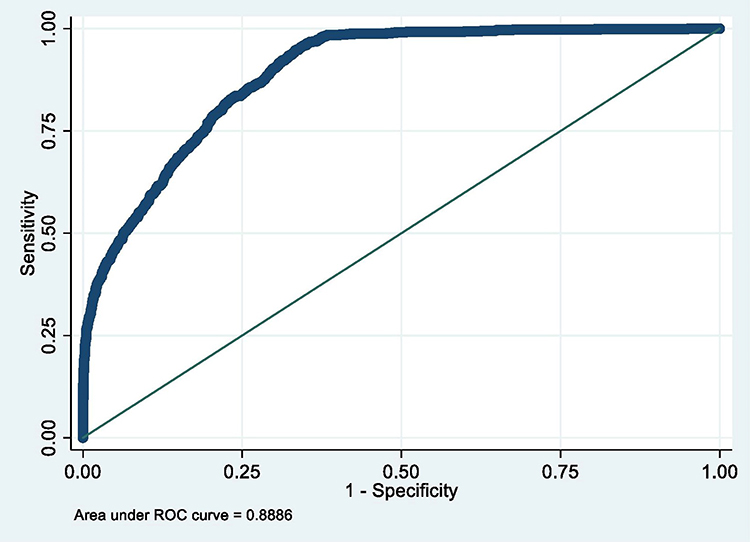 |
Figure 5 ROC curve of Model 5 (MetS prediction model consisting of gender, father’s social class at birth, BMI at 7 and hypertension). |
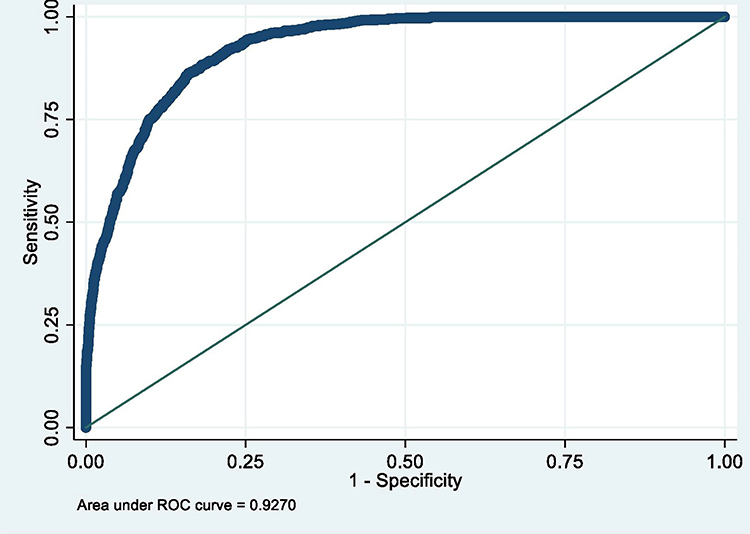 |
Figure 6 ROC curve of Model 6 (MetS prediction model consisting of gender, father’s social class at birth, BMI at 7, HbA1c ≥6.0, hypertension, high serum triglycerides and overcrowding). |
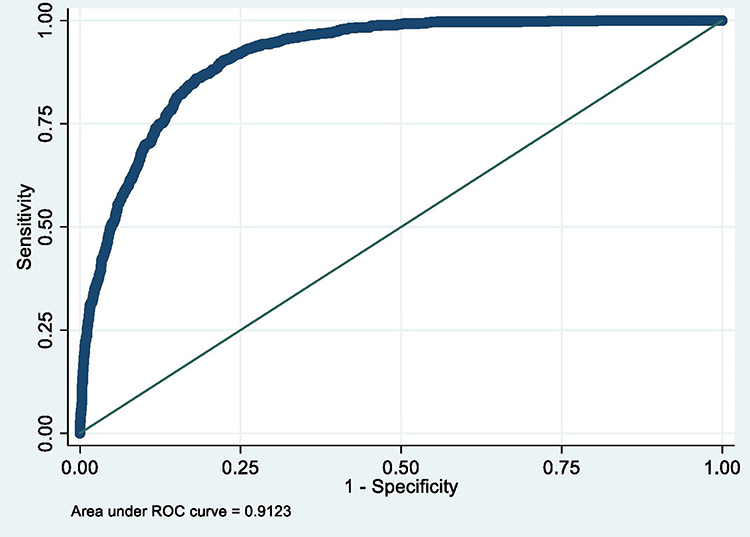 |
Figure 7 ROC curve of Model 7 (MetS prediction model consisting of gender, father’s social class at birth, BMI at 7, hypertension and high serum triglycerides). |
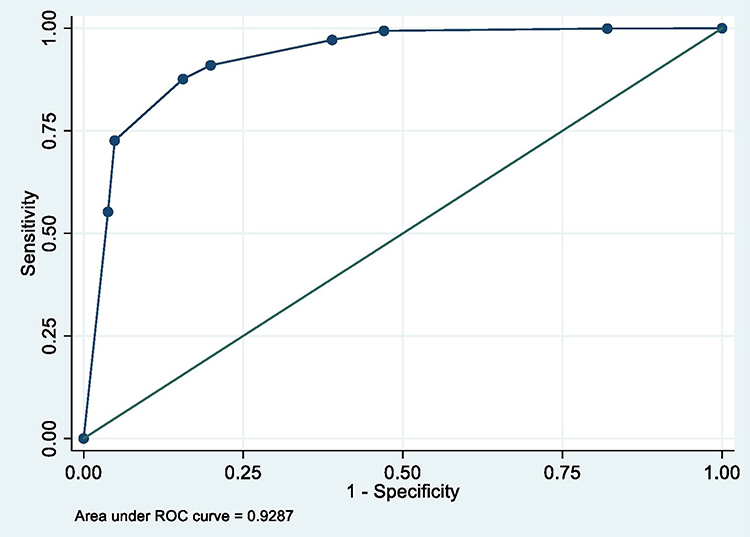 |
Figure 8 ROC curve of Model 8 (MetS prediction model consisting of father’s social class at birth, high waist circumference and hypertension). |
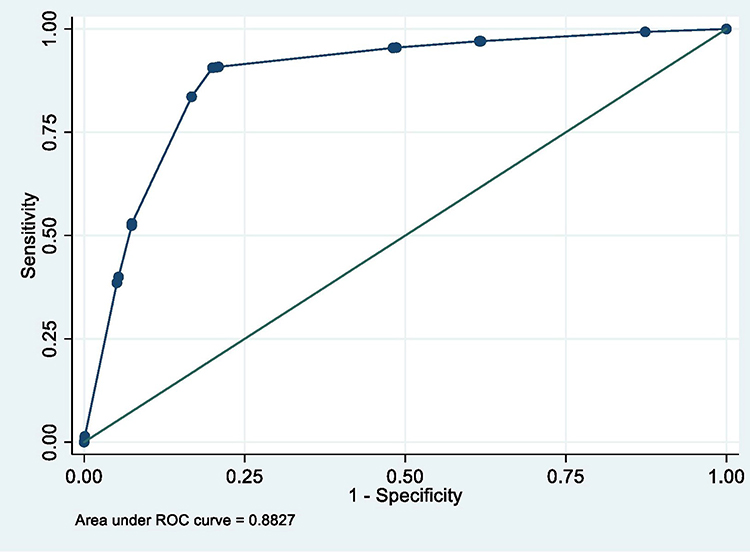 |
Figure 9 ROC curve of Model 9 (MetS prediction model consisting of gender, father’s social class at birth, family history of T2DM and high waist circumference). |
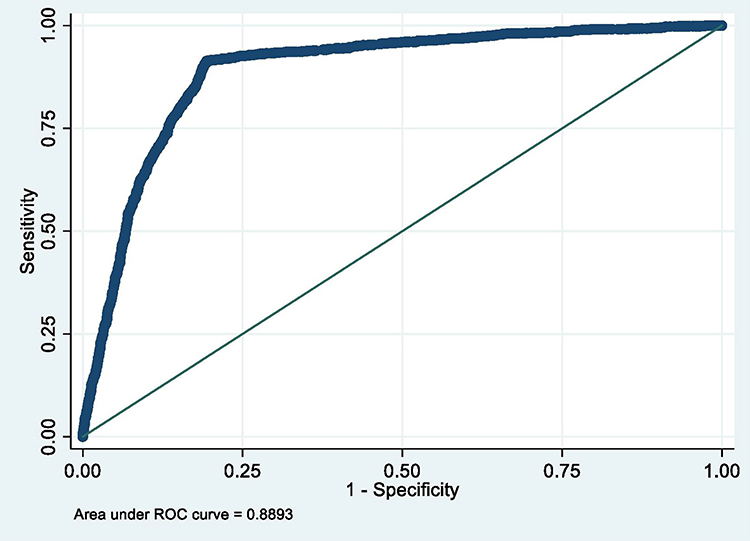 |
Figure 10 ROC curve of Model 10 (MetS prediction model consisting of gender, BMI at 23 and high waist circumference). |
The summary of the sensitivity/specificity, discrimination as well as the calibration (performance parameters) of the models is provided in Table 13.0. From the table, it is clear that all the models are well discriminated. The values for AUROC ranges from 0.83 to 0.93.
The sensitivity of the models is quite modest. While the majority of the models (6 out of 10) have sensitivity slightly above 50%, few (3) are not sensitive with values far less than 50%. One model (Model 8) has very good sensitivity of 72.62%. On the contrary, the models in this study are very specific in predicting MetS in midlife. Specificity ranges from 91.76% to 98.05%.
Similarly, positive predictive value (PPV) of the produced models is good. The values for PPV range from 62.92% to 78.45%. In the same vein, negative predictive value (NPV) of the models is very good with values ranging from 84.23% to 93.44%.
Models Calibration
The Hosmer-Lemeshow goodness-of-fit test was used in this analysis to assess the calibration of the models produced. The summary of the calibration (Hosmer-Lemeshow goodness-of-fit test) is provided in Table 13 above. From the table, it is clear that the majority (70%) of the models are well calibrated.
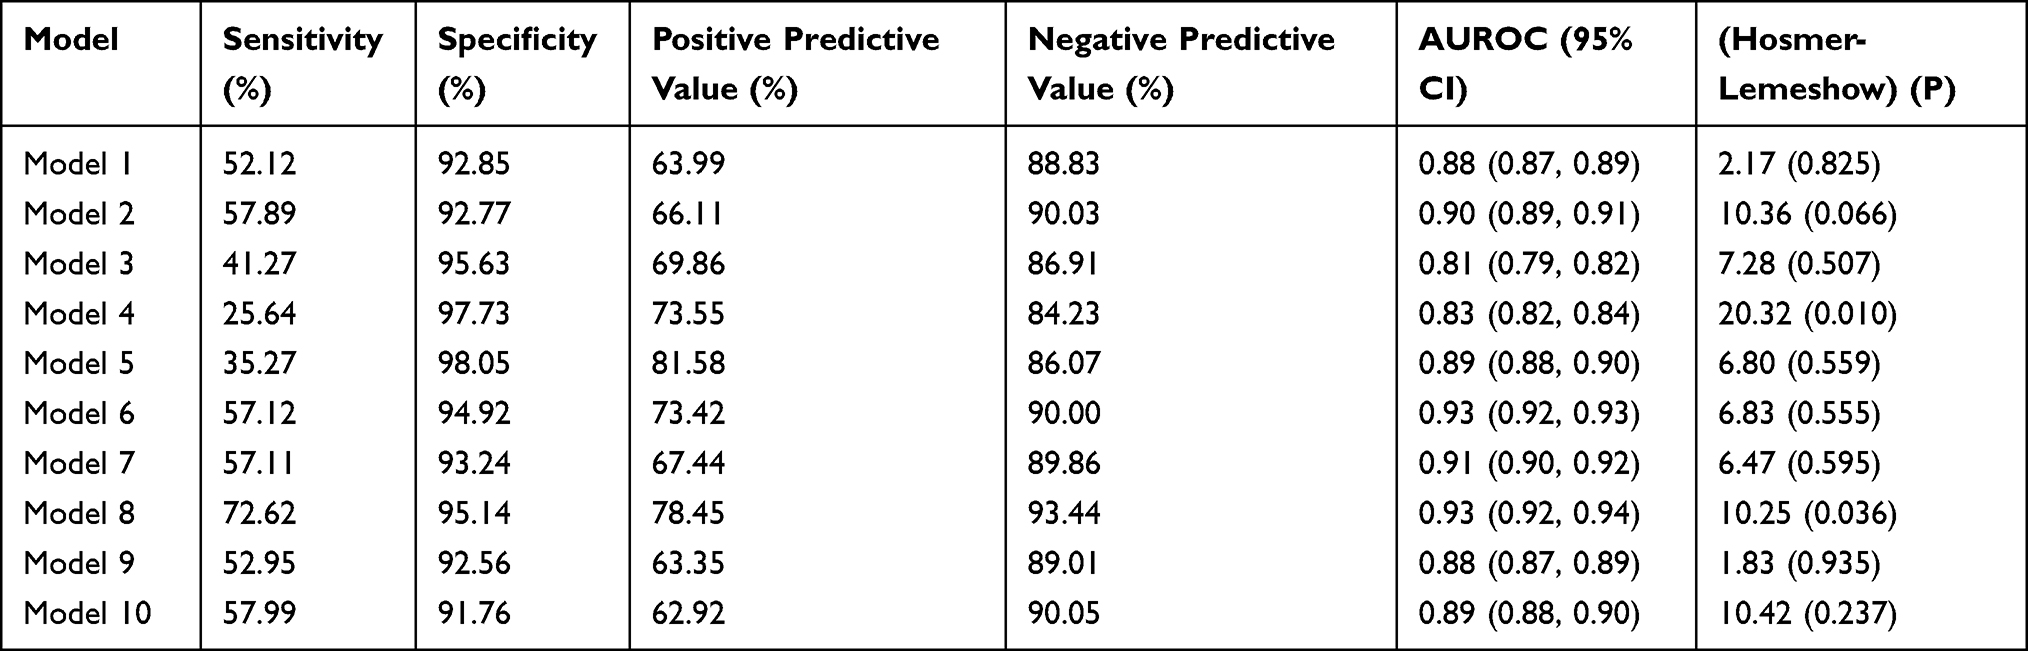 |
Table 13 Summary of the Performance Parameters of the Ten (10) MetS Models Developed |
The models that are poorly calibrated (Models 2, 4 and 8) consist of four, six and three predictors, respectively. Also, they all share a common predictor (father’s social class at birth).
Selecting the Model with the Most Potentials to Be Useful
The pragmatic model selection criteria discussed earlier was applied to all the ten (10) models developed. Briefly, a model is selected if it is accurate (has discrimination above 0.70 and statistically significant calibration), simple to use (contains few predictors that may not be difficult to obtain in a routine clinical setting). In addition to the above, the model should contain no more than 2 adult predictors. Finally, the model should contain predictors that can improve equity in the prevention of MetS.34
Based on the above, the Model 7 (MetS prediction model consisting of gender, father’s social class at birth, BMI at 7 years, hypertension and high serum triglycerides) was selected. The model is accurate as it has excellent discrimination 0.91 (0.90, 0.92) and is well calibrated (Hosmer-Lemeshow 6.47, P 0.595). Similarly, Model 7 is relatively simple to use as it is composed of five (5) predictors that may not be difficult to obtain in routine practice. Finally, the model has two (2) predictors (father’s social class at birth and BMI at 7) which could be used to address issues of equity in the wider prevention of MetS.
Adjusting for Potential Confounders
Table 14 shows the selected model (model 7) adjusted for potential confounders. Confounders were adjusted for sequentially, starting from those measured around birth (early life). All the predictors remained significant even after the adjustment except father’s social class at birth which became less significant after the adjustments. However, the overall model remained significant and reported performance similar to the unadjusted model (see Figure 11).
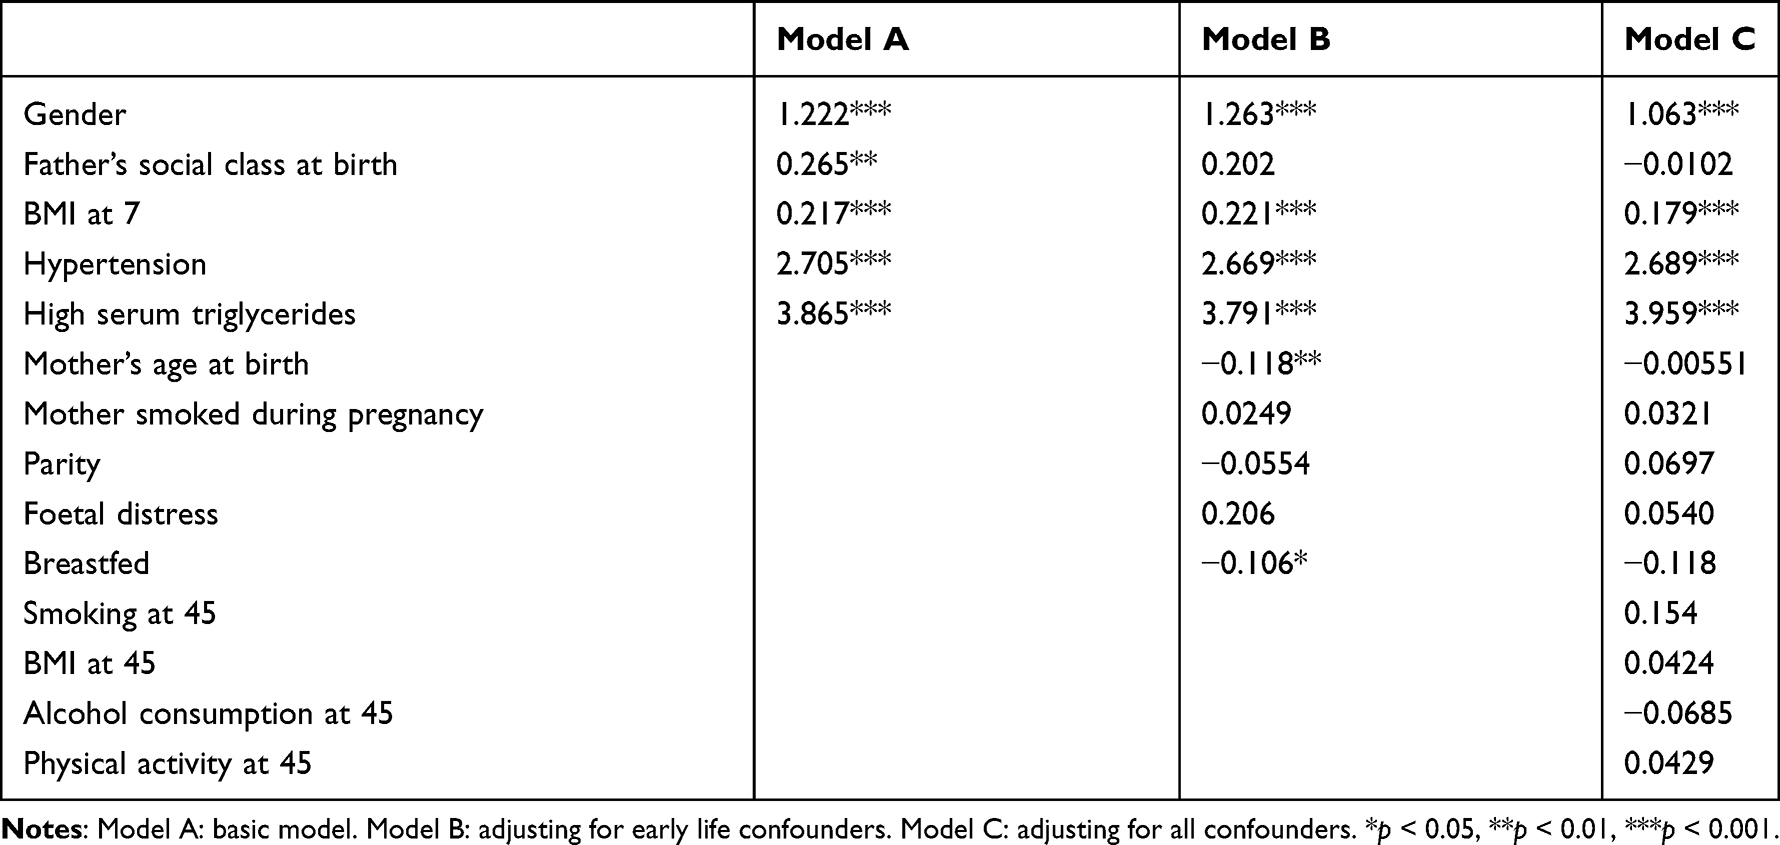 |
Table 14 Selected Model (Model 7) Adjusted for Confounders |
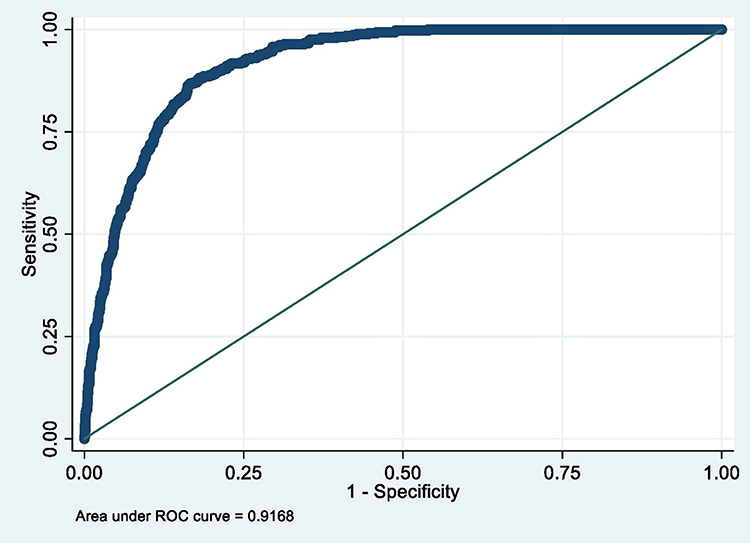 |
Figure 11 ROC of selected model after controlling for possible confounders. |
Internal Validity of the Selected Model (Model 7)
Table 15 shows the selected model (Model 7) applied on a random bootstrap sample. From the table, there is a slight variation between the coefficients and the respective 95% CI. However, the level of significance remained similar except for father’s social class at birth which increased from 0.004 to 0.010.
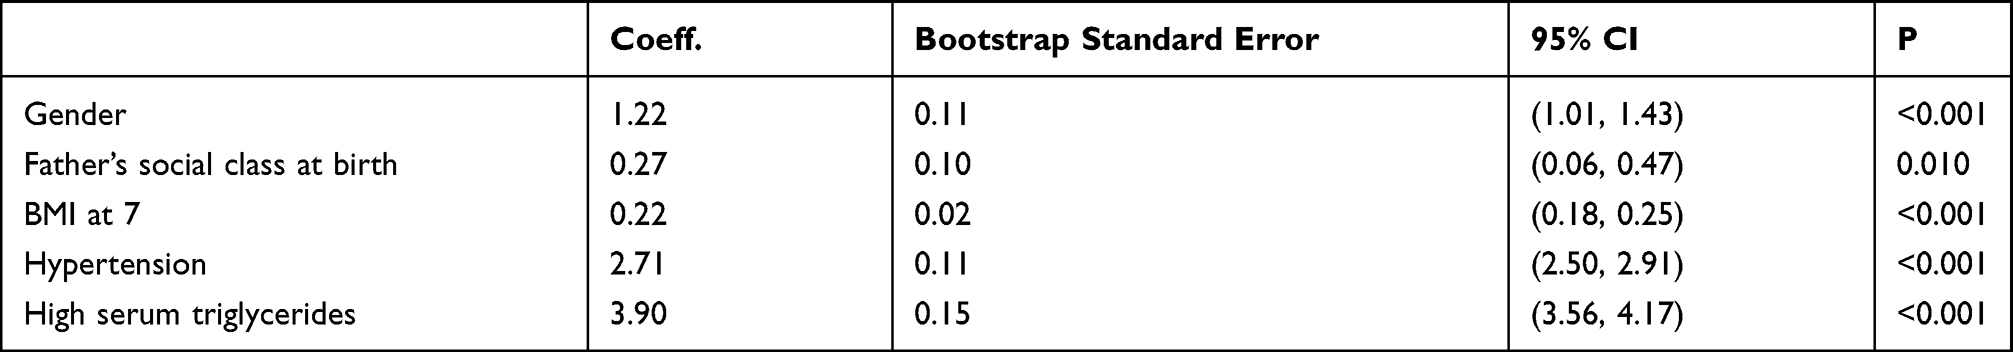 |
Table 15 Selected Model (Model 7) Applied on a Random Bootstrap Sample |
Furthermore, the performance of the selected model (Model 7) applied on the bootstrap sample was assessed using ROC analyses and Hosmer-Lemeshow test. The findings did not differ significantly with those observed earlier on the main development data (see Table 16 and Figure 12). Therefore, the model is less likely to be overfitted to the developing data.
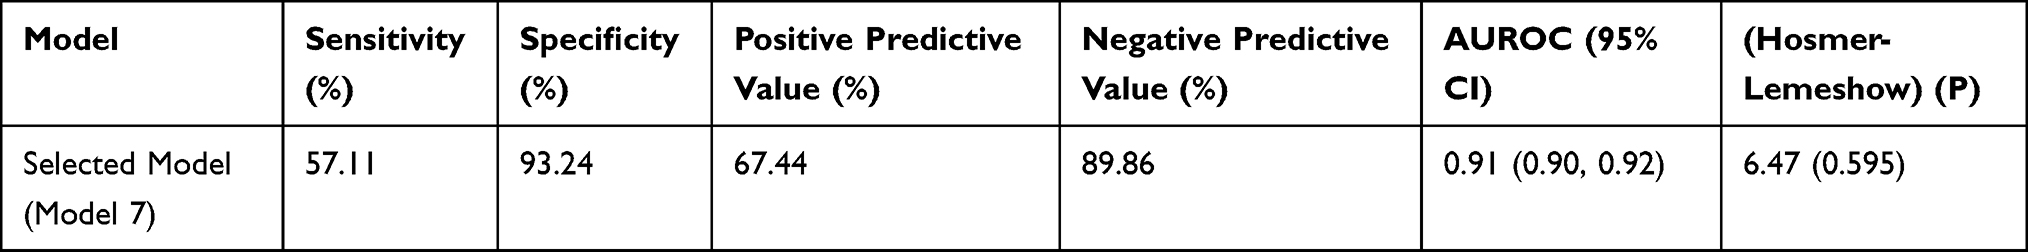 |
Table 16 Summary Performance of the Selected Model (Model 7) Applied on a Random Bootstrap Sample |
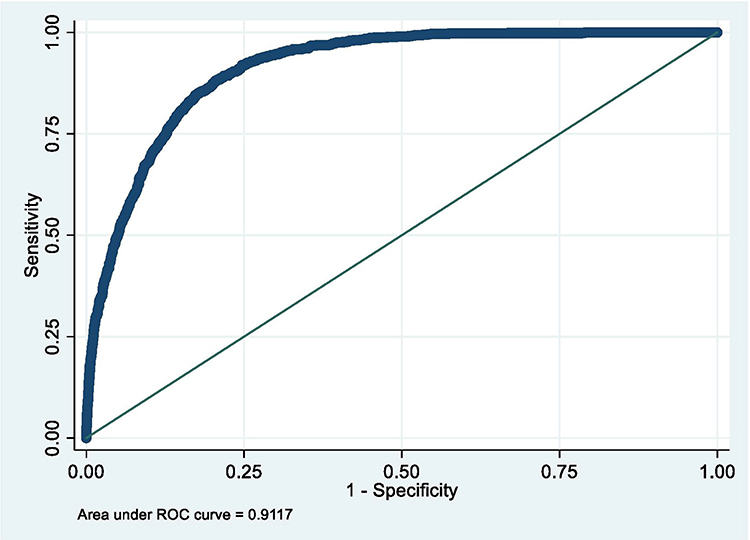 |
Figure 12 ROC curve of selected model applied on a random bootstrap sample. |
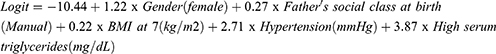
Model Equation
The equation for the developed model (Model 7) is provided below:
Discussion
Main Findings
This analysis revealed that the prevalence of MetS in midlife is high, with males having higher risk as compared to females. Individuals with MetS are more likely to have higher levels of HbA1c and low HDL-cholesterol. Similarly, regarding the individual components of MetS, male cohort members are more likely to have higher levels of glycaemia (HbA1c), BP and serum triglycerides. In contrast, female cohort members have lower levels of HDL-cholesterol and higher levels of waist circumference. Furthermore, a total of ten (10) MetS risk prediction models were developed taking the life course approach. Out of these, one model (with most potential to be applied in practical setting) was selected after using the pragmatic criteria developed. The model has been shown to have good accuracy, is well calibrated and is free from overfitting (has good internal validity).
The prevalence of MetS is high and rising globally. The estimated global prevalence of MetS is nearly twenty-five per cent of the worldwide adult population.2 Prevalence differs between countries, ethnicities, age groups and gender.2,35 A rough divide is observed between the more developed countries and developing countries with developed ones having a higher prevalence12,36,37 though this is not always the case.38,39 In this analysis, nearly one in five individuals have MetS. Although this is lower than the global average, it is in keeping with what was previously published.20,40–44
A possible explanation of why the prevalence of MetS in this study is lower than the estimated global average could be due to the difference in the studied samples. The 1958 British birth cohort is 43/45 years old at the time of the biomedical survey. Therefore, this study utilised relatively young individuals who are below the peak age of MetS prevalence.45 However, recent studies are showing a rise in the prevalence of MetS in younger individuals.2,46 Similarly, this observed difference could be due to the criteria used in defining MetS (the NCEP-ATP III criteria). Certain criteria of MetS such as IDF are known to exaggerate the prevalence of MetS in some populations.2,46,47
The overall aim of developing a risk prediction model is not just for it to be statistically significant, but, for it to work when applied in practice. For this to be achieved, it has to be accurate, generalisable and effective.30 Clinical credibility of model focuses not only on the statistical significance of the constituent predictors, but, also on their clinical relevance, how easy they are to obtain, and the overall simplicity of the model.30 Therefore, careful selection of predictors is necessary. The predictors used in this study are determined a priori from the literature. In addition, their clinical/ public health relevance and significance to the understanding of the life course origin of MetS was also considered. This is based on recommendations by experts in the field.48–50 However, this approach is not very popular in previous MetS studies. Therefore, in order for the MetS prediction discipline to progress to the next level, methods of predictor selection need to be improved by researchers. One of the ways this can be achieved is through collaboration between clinicians and statisticians to ensure predictors are included based on expert knowledge (literature) and clinical significance.48,49
This analysis has shown that early life circumstances could have a significant effect on the individual’s risk of MetS later in life. Also, it has revealed how these factors can be included in a risk model to predict MetS in midlife. A similar approach has been used in developing a popular CVD risk score (ASSIGN score).34 This is an important finding because it highlights the relevance of wider determinants of health51 as a significant contributor to the rising burden of obesity and subsequent MetS.52 Therefore, for any genuine intervention aimed at MetS prevention to be successful, it needs to be holistic and systematically address these factors at every stage of life.13 Indeed, for any intervention targeting one determinant of health to be effective, it has to address all the other determinants.53
Discrimination is a statistical measure used in prediction models to distinguish individuals who will develop the outcome from those who will not.28 The models developed in this analysis are well discriminated with AUROC ranging from 0.83 to 0.93; and the one selected having AUROC of 0.91 (95% CI 0.90, 0.92). Good discrimination is a common finding across the studies of MetS prediction models.20,36,54–60 Similarly, the models in this study have a relatively modest sensitivity. This is in keeping with what was reported in similar studies from Taiwan and Australia.61,62 On the contrary, other studies reported higher levels of sensitivity.20,54,55,57,59 The observed low sensitivity of the models could be due to the relatively low prevalence of MetS in the sample. It is well known that the prevalence of a disease has a direct relationship with the sensitivity of a prediction test.61 However, the sensitivity of a model is hardly used alone when deciding the diagnostic power of a model. Rather, it is determined by both sensitivity, specificity and the trade-off between them (AUROC).28
Calibration assesses whether those categorised as having the outcome truly have it.28 The Hosmer-Lemeshow test was used to assess calibration in this study. Majority (70%) of the models in this study are well calibrated. Also, the selected model is well calibrated. This is in keeping with what is obtained from previous studies of MetS.59,63 Noteworthy, most previous studies of MetS prediction models do not report calibration. Not reporting any measure of calibration is also a common problem across most NCD prediction studies.49,64–68
Overfitting is one of the commonest flaws encountered in prediction model studies.50,69,70 Models often perform best in the data in which they are developed; thereby leading to an exaggeration of the findings.48–50 Furthermore, overfitting leads to models that cannot be applied beyond the sample which they are developed on.48–50 Bootstrapping was conducted on the model developed in this analysis to assess stability and overfitting. The findings remained significant, and no much difference was observed from the original model, indicating a good fit. However, the best way to assess overfitting is to apply the model on an entirely different sample from the one it is developed.70 Therefore, this model will benefit from an external validation study.
Strengths and Weaknesses of the Analysis
One of the major strengths of this analysis is that variable selection, solely based on statistical significance, was avoided. The predictors are determined based on the literature, clinical/ public health relevance and importance to the understanding of the life course origin of MetS.48–50 The bootstrapping conducted to assess for stability and overfitting is another strength of this analysis.
However, this analysis has a number of limitations which should be considered. One of the methodological limitations of this analysis is the dichotomisation of variables. Majority of the variables used in this analysis are dichotomised. This could lead to a significant loss of information and statistical power to observe real associations.70 However, dichotomisation is conducted in order to conform to the criteria used to define MetS (NCEP –ATP III),1 which is binary in nature. Furthermore, the majority of the previous studies of MetS prediction used dichotomisation. Nevertheless, this could be improved in the future by not dichotomizing (retaining variables as continuous where necessary).
More so, the original NCEP-ATPIII criteria has been modified in this analysis in order to address the limitations of the cohort data. Hyperglycemia was defined as HbA1c ≥6.0% because (FPG) was not collected in the data during the biomedical survey. Previous studies have used HbA1c as a marker of glycaemia.21,22 Also, due to limited information, individuals treated for high cholesterol, hypertension, or T2DM were not accounted for (not included) in the definition of MetS. Therefore, the definition of NCEP-ATP III criteria used in this analysis is a conservative one.
Although this analysis is conducted taking the life course approach, no attempt was made to establish the potential pathways through which MetS develops. This is beyond the scope of the study. Instead, the existing evidence was utilised and deemed sufficient in this regards. Furthermore, there is a possibility that some important variables, such as mother’s BMI before pregnancy12 may have been missed out in this analysis. The BMI pathway, especially through mother’s BMI, is one of the currently held assumptions through which MetS is transmitted from parents to their offsprings.12,71 In the available dataset, the variable “maternal pre-pregnancy weight” is presented as grouped data. This makes it impossible to derive the individual mother’s weight and subsequently compute the BMI.
Another limitation of this analysis is that only the father’s social class at birth (occupation in 1958) was used in categorizing childhood socioeconomic position. A better approach would be to include the mother’s social class at birth, compare the two and then select the one which is higher. The NCDS data lacks detailed information about the mother’s social class at birth (occupation in 1958). However, father’s social class has been used successfully in the past to denote childhood socioeconomic position in previous studies that used the NCDS data.12
The stepwise technique was used to build models in this study. Certain variables that fit well may have been missed by this technique.31,50 Also, the technique is criticised as it is prone to overfitting and overestimation of findings.50,72–74 However, several steps were taken to minimize the likelihood of overfitting/ overestimation in this analysis. Indeed, the biggest limitation of the stepwise technique is that of sample size; they tend to produce overfitted and spurious models if there are fewer data per variable. However, a large sample with an adequate event per variable is used in this analysis. Additionally, variables selection solely based on statistical significance was avoided. Finally, bootstrapping was conducted to test for internal validity/ overfitting, and no significant variations were observed between the findings. Nevertheless, the model developed will benefit from external validation study to assess whether its findings can be generalisable.
Missing data resulting from cohort attrition is among the major limitations of this study. Although this is partly addressed by the application of multiple imputations in the models. However, the application of multiple imputation relies on the assumption that the data is MAR (the missingness is dependent on the observed data but not the unobserved data), which is a hardly verifiable assumption. Therefore, there is a possibility that some of the data are MNAR. Including a large number of covariates in the multiple imputation is one way of limiting the impact of MNAR and thereby making the MAR assumption more credible.75,76 Also, age and socioeconomic status have been recognised as the leading causes of attrition in UK studies.77,78 In that regards, significant causes of missingness like socioeconomic status, demographic characteristics and behavioural/lifestyle variables were included in the multiple imputation conducted in this study. By so doing, it is assumed that any other unaccounted variable that is missing is MAR, since the known major causes of missingness have been accounted for. Moreover, no significant difference was observed between the results of this study (both complete cases and multiple imputation) when sensitivity analysis was conducted.
Another limitation of this study is the lack of representativeness of the sample, especially concerning ethnicity. The 1958 British birth cohort is predominantly white, which is a representation of the UK population in the 1950s. However, the contemporary UK population is ethnically diverse. More so, certain components of the MetS, such as waist circumference differ significantly between ethnicities.79,80 Therefore, the findings of this study in its current state might not be generalisable to the whole UK population. Similarly, the cohort members are relatively young (45 years) at the time the biomedical survey was conducted. This is below the peak age of MetS prevalence.45 However, recent studies are showing a rise in the prevalence of MetS in younger individuals.2,46 Yet, caution should be applied while extrapolating the findings of this study to an older population.
Conclusion
We developed and validated a simple MetS risk prediction model in this study. The prevalence of MetS was observed to be high; approximately one in five participants has MetS with males being more at risk. Taking life course approach, it is possible to include early life factors to predict MetS in midlife. The developed model has been shown to be accurate and has good internal validity. Therefore, interventions targeting socioeconomic inequality could help in the wider prevention of MetS. However, the validity of the developed model needs to be further established in an external population.
Disclosure
The authors report no conflicts of interest in this work.
References
1. Expert Panel on Detection EJJ. Executive summary of the third report of the National Cholesterol Education Program (NCEP) expert panel on detection, evaluation, and treatment of high blood cholesterol in adults (adult treatment panel III). JAMA. 2001;285(19):2486–2497. doi:10.1001/jama.285.19.2486
2. Saklayen MG. The global epidemic of the metabolic syndrome. Curr Hypertens Rep. 2018;20(2):1–8.
3. Ahrens W, Moreno LA, Mårild S, et al. Metabolic syndrome in young children: definitions and results of the IDEFICS study. Int J Obes. 2014;38(2):S4–S14. doi:10.1038/ijo.2014.130
4. Simmons R, Alberti K, Gale E, et al. The metabolic syndrome: useful concept or clinical tool? Report of a WHO Expert Consultation. Diabetologia. 2010;53(4):600–605. doi:10.1007/s00125-009-1620-4
5. Maglio PP, Mabry PL. Agent-based models and systems science approaches to public health. Am J Prev Med. 2011;40(3):392–394. doi:10.1016/j.amepre.2010.11.010
6. Després J-P, Lemieux I. Abdominal obesity and metabolic syndrome. Nature. 2006;444(7121):881–887. doi:10.1038/nature05488
7. Choe EK, Rhee H, Lee S, et al. Metabolic syndrome prediction using machine learning models with genetic and clinical information from a nonobese healthy population. Genomics Inform. 2018;16(4). doi:10.5808/GI.2018.16.4.e31
8. Martin A, Neale EP, Batterham M, Tapsell LC. Identifying metabolic syndrome in a clinical cohort: implications for prevention of chronic disease. Prev Med Rep. 2016;4:502–506. doi:10.1016/j.pmedr.2016.09.007
9. Bao W, Srinivasan SR, Wattigney WA, Berenson GS. Persistence of multiple cardiovascular risk clustering related to syndrome X from childhood to young adulthood: the Bogalusa Heart Study. Arch Intern Med. 1994;154(16):1842–1847.
10. Chen W, Srinivasan SR, Elkasabany A, Berenson GS. The association of cardiovascular risk factor clustering related to insulin resistance syndrome (Syndrome X) between young parents and their offspring: the Bogalusa Heart Study. Atherosclerosis. 1999;145(1):197–205. doi:10.1016/S0021-9150(99)00025-8
11. Ford ES, Giles WH, Mokdad AH. Increasing prevalence of the metabolic syndrome among US adults. Diabetes Care. 2004;27(10):2444–2449. doi:10.2337/diacare.27.10.2444
12. Delpierre C, Fantin R, Barboza-Solis C, Lepage B, Darnaudéry M, Kelly-Irving M. The early life nutritional environment and early life stress as potential pathways towards the metabolic syndrome in mid-life? A lifecourse analysis using the 1958 British Birth cohort. BMC Public Health. 2016;16(1):815. doi:10.1186/s12889-016-3484-0
13. Kuh D, Ben-Shlomo Y, Lynch J, Hallqvist J, Power C. Life course epidemiology. J Epidemiol Community Health. 2003;57(10):778. doi:10.1136/jech.57.10.778
14. Power C, Elliott J. Cohort profile: 1958 British birth cohort (National Child Development Study). Int J Epidemiol. 2006;35(1):34–41. doi:10.1093/ije/dyi183
15. Atherton K, Fuller E, Shepherd P, Strachan D, Power CJ. Loss and representativeness in a biomedical survey at age 45 years: 1958 British birth cohort. J Epidemiol Community Health. 2008;62(3):216–223. doi:10.1136/jech.2006.058966
16. Blencowe H, Cousens S, Oestergaard MZ, et al. National, regional, and worldwide estimates of preterm birth rates in the year 2010 with time trends since 1990 for selected countries: a systematic analysis and implications. Lancet. 2012;379(9832):2162–2172. doi:10.1016/S0140-6736(12)60820-4
17. Palaniappan L, Carnethon MR, Wang Y, et al. Predictors of the incident metabolic syndrome in adults: the Insulin Resistance Atherosclerosis Study. Diabetes Care. 2004;27(3):788–793. doi:10.2337/diacare.27.3.788
18. Mirmiran P, Noori N, Azizi F. A prospective study of determinants of the metabolic syndrome in adults. Nutr Metab Cardiovasc Dis. 2008;18(8):567–573. doi:10.1016/j.numecd.2007.06.002
19. Salonen MK, Kajantie E, Osmond C, et al. Role of childhood growth on the risk of metabolic syndrome in obese men and women. Diabetes Metab. 2009;35(2):94–100. doi:10.1016/j.diabet.2008.08.008
20. Hosseini M, Sarrafzadegan N, Kelishadi R, Monajemi M, Asgary S, Vardanjani HM. Population-based metabolic syndrome risk score and its determinants: the Isfahan Healthy Heart Program. J Res Med Sci. 2014;19(12):1167–1174.
21. Rohlfing CL, Little RR, Wiedmeyer H-M, et al. Use of GHb (HbA1c) in screening for undiagnosed diabetes in the US population. Diabetes Care. 2000;23(2):187–191. doi:10.2337/diacare.23.2.187
22. Barr RG, Nathan DM, Meigs JB, Singer DE. Tests of glycemia for the diagnosis of type 2 diabetes mellitus. Ann Intern Med. 2002;137(4):263–272. doi:10.7326/0003-4819-137-4-200208200-00011
23. Gibb I, Parnham A, Fonfrède M, Lecock F. Multicenter evaluation of Tosoh glycohemoglobin analyzer. Clin Chem. 1999;45(10):1833–1841.
24. Chapelle J-P, Teixeira J, Maisin D, et al. Multicentre evaluation of the Tosoh HbA1c G8 analyser. Clin Chem Lab Med. 2010;48(3):365–371. doi:10.1515/CCLM.2010.062
25. Kälsch J, Bechmann LP, Heider D, et al. Normal liver enzymes are correlated with severity of metabolic syndrome in a large population based cohort. Sci Rep. 2015;5(1):1–9. doi:10.1038/srep13058
26. Spänig S, Emberger-Klein A, Sowa JP, Canbay A, Menrad K, Heider D. The virtual doctor: an interactive clinical-decision-support system based on deep learning for non-invasive prediction of diabetes. Artif Intell Med. 2019;100:101706. doi:10.1016/j.artmed.2019.101706
27. National Institutes of Health. The practical guide: identification, evaluation and treatment of overweight and obesity in adults. Bethesda, MD: National Institutes of Health; 2000.
28. Steyerberg EW, Vickers AJ, Cook NR, et al. Assessing the performance of prediction models: a framework for some traditional and novel measures. Epidemiology. 2010;21(1):128. doi:10.1097/EDE.0b013e3181c30fb2
29. Royston P. Multiple imputation of missing values. Stata J. 2004;4(3):227–241.
30. Wyatt JC, Altman DG. Commentary: prognostic models: clinically useful or quickly forgotten? BMJ. 1995;311(7019):1539–1541.
31. Moons KG, Royston P, Vergouwe Y, Grobbee DE, Altman DG. Prognosis and prognostic research: what, why, and how? BMJ. 2009;338:b375.
32. Sauerbrei WJ. The use of resampling methods to simplify regression models in medical statistics. J R Stat Soc Series C. 1999;48(3):313–329.
33. Altman DG, Vergouwe Y, Royston P, Moons KG. Prognosis and prognostic research: validating a prognostic model. BMJ. 2009;338:b605.
34. Woodward M, Brindle P, Tunstall-Pedoe H. Adding social deprivation and family history to cardiovascular risk assessment: the ASSIGN score from the Scottish Heart Health Extended Cohort (SHHEC). Heart. 2007;93(2):172–176. doi:10.1136/hrt.2006.108167
35. Cornier M-A, Dabelea D, Hernandez TL, et al. The metabolic syndrome. Endocr Rev. 2008;29(7):777–822. doi:10.1210/er.2008-0024
36. Tan C, Sasagawa Y, Kamo K-I, et al. Evaluation of the Japanese Metabolic Syndrome Risk Score (JAMRISC): a newly developed questionnaire used as a screening tool for diagnosing metabolic syndrome and insulin resistance in Japan. Environ Health Prev Med. 2016;21(6):470–479. doi:10.1007/s12199-016-0568-5
37. Sancar N, Tinazli M. Development of an intelligent model to estimate the probability of having metabolic syndrome. Procedia Comput Sci. 2016;102:106–112. doi:10.1016/j.urology.2016.08.071
38. Obeidat AA, Ahmad MN, Haddad FH, Azzeh FS. Evaluation of several anthropometric indices of obesity as predictors of metabolic syndrome in Jordanian adults. Nutr Hosp. 2015;32(2):667–677. doi:10.3305/nh.2015.32.2.9063
39. Al-Rubeaan K, Bawazeer N, Al Farsi Y, et al. Prevalence of metabolic syndrome in Saudi Arabia-a cross sectional study. BMC Endocr Disord. 2018;18(1):1–9.
40. Mattsson N, Rönnemaa T, Juonala M, Viikari JS, Raitakari OT. Childhood predictors of the metabolic syndrome in adulthood. The Cardiovascular Risk in Young Finns Study. Ann Med. 2008;40(7):542–552. doi:10.1080/07853890802307709
41. Wilkerson GB, Bullard JT, Bartal DW. Identification of cardiometabolic risk among collegiate football players. J Athl Train. 2010;45(1):67–74. doi:10.4085/1062-6050-45.1.67
42. Riediger ND, Clara IJC. Prevalence of metabolic syndrome in the Canadian adult population. CMAJ. 2011;183(15):E1127–E1134. doi:10.1503/cmaj.110070
43. Zhang W, Chen Q, Yuan Z, et al. A routine biomarker-based risk prediction model for metabolic syndrome in urban Han Chinese population. BMC Public Health. 2015;15:64. doi:10.1186/s12889-015-1424-z
44. Kakudi HA, Loo CK, Moy FM. Predicting metabolic syndrome using risk quantification and ensemble methods.
45. Meigs JB. Epidemiology of the metabolic syndrome. Am J Manag Care. 2002;8(11;SUPP/1):S283–S292.
46. Nolan PB, Carrick-Ranson G, Stinear JW, Reading SA, Dalleck LC. Prevalence of metabolic syndrome and metabolic syndrome components in young adults: a pooled analysis. Prev Med Rep. 2017;7:211–215. doi:10.1016/j.pmedr.2017.07.004
47. Delavari A, Forouzanfar MH, Alikhani S, Sharifian A, Kelishadi R. First nationwide study of the prevalence of the metabolic syndrome and optimal cutoff points of waist circumference in the Middle East: the national survey of risk factors for noncommunicable diseases of Iran. Diabetes Care. 2009;32(6):1092–1097. doi:10.2337/dc08-1800
48. Royston P, Moons KG, Altman DG, Vergouwe Y. Prognosis and prognostic research: developing a prognostic model. BMJ. 2009;338:b604. doi:10.1136/bmj.b604
49. Collins GS, Mallett S, Omar O, Yu L-M. Developing risk prediction models for type 2 diabetes: a systematic review of methodology and reporting. BMC Med. 2011;9(1):1–14.
50. Harrell FE. Regression Modeling Strategies: With Applications to Linear Models, Logistic and Ordinal Regression, and Survival Analysis. Vol. 3. Springer; 2015.
51. Göran D, Whitehead M. Policies and strategies to promote social equity in health; 1991.
52. Marmot M. The health gap: the challenge of an unequal world. Lancet. 2015;386(10011):2442–2444. doi:10.1016/S0140-6736(15)00150-6
53. Marmot M, Bell R. Fair society, healthy lives. Public Health. 2012;126:S4–S10. doi:10.1016/j.puhe.2012.05.014
54. Okosun IS, Lyn R, Davis-Smith M, Eriksen M, Seale P. Validity of a continuous metabolic risk score as an index for modeling metabolic syndrome in adolescents. Ann Epidemiol. 2010;20(11):843–851. doi:10.1016/j.annepidem.2010.08.001
55. Shafiee G, Kelishadi R, Heshmat R, et al. First report on the validity of a continuous metabolic syndrome score as an indicator for metabolic syndrome in a national sample of paediatric population - the CASPIAN-III study. Endokrynol Pol. 2013;64(4):278–284. doi:10.5603/EP.2013.0006
56. Steinberg GB, Church BW, McCall CJ, Scott AB, Kalis BP. Novel predictive models for metabolic syndrome risk: a “big data” analytic approach. Am J Manag Care. 2014;20(6):e221–e228.
57. Graziano F, Grassi M, Sacco S, et al. Probing the factor structure of metabolic syndrome in Sardinian genetic isolates. Nutr Metab Cardiovasc Dis. 2015;25(6):548–555. doi:10.1016/j.numecd.2015.02.004
58. Zhang W, Chen Q, Yuan Z, et al. A routine biomarker-based risk prediction model for metabolic syndrome in urban Han Chinese population. Expert Rev Anticancer Ther. 2015;15(1):1–9. doi:10.1586/14737140.2015.992420
59. Obokata M, Negishi K, Ohyama Y, et al. Score with additional four independent factors to predict the incidence and recovery from metabolic syndrome: development and validation in large Japanese Cohorts. PLoS One. 2015;10(7):e0133884. doi:10.1371/journal.pone.0133884
60. Je Y, Kim Y, Park T. Development of a self-assessment score for metabolic syndrome risk in non-obese Korean adults. Asia Pac J Clin Nutr. 2017;26(2):220–226. doi:10.6133/apjcn.012016.02
61. Liu H, Hsu C-H, Lin J-D, et al. Predicting metabolic syndrome by using hematogram models in elderly women. Platelets. 2014;25(2):97–101. doi:10.3109/09537104.2013.780017
62. Wiley JF, Carrington MJ. A metabolic syndrome severity score: a tool to quantify cardio-metabolic risk factors. Prev Med. 2016;88:189–195. doi:10.1016/j.ypmed.2016.04.006
63. Hsiao F-C, Wu C-Z, Hsieh C-H, He C-T, Hung Y-J, Pei D. Chinese metabolic syndrome risk score. South Med J. 2009;102(2):159–164. doi:10.1097/SMJ.0b013e3181836b19
64. Beswick A, Brindle P, Fahey T, Ebrahim S. A systematic review of risk scoring methods and clinical decision aids used in the primary prevention of coronary heart disease (supplement); 2011.
65. Noble D, Mathur R, Dent T, Meads C, Greenhalgh T. Risk models and scores for type 2 diabetes: systematic review. BMJ. 2011;343:d7163.
66. Abbasi A, Peelen LM, Corpeleijn E, et al. Prediction models for risk of developing type 2 diabetes: systematic literature search and independent external validation study. BMJ. 2012;345. doi:10.1136/bmj.e5900
67. Siontis GC, Tzoulaki I, Siontis KC, Ioannidis J. Comparisons of established risk prediction models for cardiovascular disease: systematic review. BMJ. 2012;344. doi:10.1136/bmj.e3318
68. Damen JA, Hooft L, Schuit E, et al. Prediction models for cardiovascular disease risk in the general population: systematic review. BMJ. 2016;353. doi:10.1136/bmj.i2416
69. Justice AC, Covinsky KE, Berlin JA. Assessing the generalizability of prognostic information. Ann Intern Med. 1999;130(6):515–524. doi:10.7326/0003-4819-130-6-199903160-00016
70. Steyerberg EW, Vergouwe Y. Towards better clinical prediction models: seven steps for development and an ABCD for validation. Eur Heart J. 2014;35(29):1925–1931. doi:10.1093/eurheartj/ehu207
71. Cooper R, Pereira SP, Power C, Hyppönen EJ. Parental obesity and risk factors for cardiovascular disease among their offspring in mid-life: findings from the 1958 British Birth Cohort Study. Int J Obes. 2013;37(12):1590–1596. doi:10.1038/ijo.2013.40
72. Hurvich CM, Tsai CL. The impact of model selection on inference in linear regression. Am Stat. 1990;44(3):214–217.
73. Steyerberg EW, Eijkemans MJ, Harrell FE, Habbema JD. Prognostic modelling with logistic regression analysis: a comparison of selection and estimation methods in small data sets. Stat Med. 2000;19(8):1059–1079. doi:10.1002/(sici)1097-0258(20000430)19:8<1059::aid-sim412>3.0.co;2-0
74. Austin PC, Tu J. Automated variable selection methods for logistic regression produced unstable models for predicting acute myocardial infarction mortality. J Clin Epidemiol. 2004;57(11):1138–1146. doi:10.1016/j.jclinepi.2004.04.003
75. White IR, Royston P, Wood AM. Multiple imputation using chained equations: issues and guidance for practice. Stat Med. 2011;30(4):377–399. doi:10.1002/sim.4067
76. von Hippel PT. Should a normal imputation model be modified to impute skewed variables? Sociol Methods Res. 2013;42(1):105–138.
77. Durrant GB, Goldstein H. Analysing the probability of attrition in a longitudinal survey; 2010.
78. Uhrig SN. The nature and causes of attrition in the British Household Panel Survey; 2008.
79. Zhu S, Heymsfield SB, Toyoshima H, Wang Z, Pietrobelli A, Heshka S. Race-ethnicity-specific waist circumference cutoffs for identifying cardiovascular disease risk factors. Am J Clin Nutr. 2005;81(2):409–415. doi:10.1093/ajcn.81.2.409
80. Bodicoat DH, Gray LJ, Henson J, et al. Body mass index and waist circumference cut-points in multi-ethnic populations from the UK and India: the ADDITION-Leicester, Jaipur heart watch and New Delhi cross-sectional studies. PLoS One. 2014;9(3):e90813. doi:10.1371/journal.pone.0090813
 © 2022 The Author(s). This work is published and licensed by Dove Medical Press Limited. The
full terms of this license are available at https://www.dovepress.com/terms
and incorporate the Creative Commons Attribution
- Non Commercial (unported, 3.0) License.
By accessing the work you hereby accept the Terms. Non-commercial uses of the work are permitted
without any further permission from Dove Medical Press Limited, provided the work is properly
attributed. For permission for commercial use of this work, please see paragraphs 4.2 and 5 of our Terms.
© 2022 The Author(s). This work is published and licensed by Dove Medical Press Limited. The
full terms of this license are available at https://www.dovepress.com/terms
and incorporate the Creative Commons Attribution
- Non Commercial (unported, 3.0) License.
By accessing the work you hereby accept the Terms. Non-commercial uses of the work are permitted
without any further permission from Dove Medical Press Limited, provided the work is properly
attributed. For permission for commercial use of this work, please see paragraphs 4.2 and 5 of our Terms.