Back to Journals » International Journal of General Medicine » Volume 14
Development and Validation of a Simple and Sensitive LC-MS/MS Method for Quantification of Metformin in Dried Blood Spot Its Application as an Indicator for Medication Adherence
Authors ALquadeib BT ![]() , Aloudah NM, Almurshedi AS, ALfagih IM, ALdosari BN, ALmeleky AS, Almubyedh NM
, Aloudah NM, Almurshedi AS, ALfagih IM, ALdosari BN, ALmeleky AS, Almubyedh NM
Received 1 April 2021
Accepted for publication 17 May 2021
Published 8 July 2021 Volume 2021:14 Pages 3225—3233
DOI https://doi.org/10.2147/IJGM.S312633
Checked for plagiarism Yes
Review by Single anonymous peer review
Peer reviewer comments 2
Editor who approved publication: Dr Scott Fraser
Bushra T ALquadeib,1,* Nouf M Aloudah,2,* Alanood S Almurshedi,1 Iman M ALfagih,1 Basmah N ALdosari,1 Adim S ALmeleky,3 Nour M Almubyedh3
1Department of Pharmaceutics, College of Pharmacy, King Saud University, Riyadh, 11671, Saudi Arabia; 2Department of Clinical Pharmacy, College of Pharmacy, King Saud University, Riyadh, 11671, Saudi Arabia; 3College of Pharmacy, King Saud University, Riyadh, 11671, Saudi Arabia
*These authors contributed equally to this work
Correspondence: Bushra T ALquadeib Email [email protected]
Objective: Metformin (MET), an oral biguanide agent, can improve insulin resistance and decrease hepatic glucose production, leading to a reduction in blood-sugar levels. The objective of the present study was to develop and validate simple and rapid LC-MS/MS method for analysis of MET in dried blood spot (DBS) sample for patient monitoring studies purposes (drug adherence).
Methods: The chromatographic separation was achieved with Waters HSS-T3 column using gradient elution of mobile phases of two solvents: 1) solvent A, consisted of 10mM ammonium formate, 0.2% formic acid 1%; and 2) acetonitrile solvent B, contained 0.2% formic acid in acetonitrile at a flow rate of 0.2 mL/min. The total run time was 3.0 min. The effectiveness of chromatographic conditions was optimized, and afatinib was used as the internal standard. The assay method was validated using USP 26 and the ICH guidelines.
Results: The method showed good linearity in the range 8– 48 ng/mL for MET with correlation coefficient (r) > 0.9907. The intra- and inter‑day precision values for MET met the acceptance criteria as per regulatory guidelines. MET was stable during the stability studies at ambient temperature 25 °C, at refrigerator 4 °C, at 10 °C autosampler, freeze/thaw cycles and 30 days storage in a freezer at − 30 ± 0.5 °C.
Conclusion: This method has successfully fulfilled all validation requirements referring to EMA and FDA guidelines, and successfully can be applied for MET adherence study. All the six studied patients were approved to metformin adherence.
Keywords: metformin, dried blood spot, liquid chromatography–tandem mass spectrometry, method validation, medication adherence
Introduction
Diabetes mellitus is a condition of chronic illness of increase blood glucose level, to avoid acute complications and reduce the risk of long-term complications, ongoing medical treatment and patient self-management education are needed.1,2 Controlling glycaemia and blood pressure was the main goal for diabetes mellitus patients in order to minimize symptoms and avoid complications such as microvascular (eye and kidney disease). Regulation of glycemia and blood pressure reduces risk; control of lipids and hypertension, smoking cessation, and aspirin treatment reduces macrovascular (ie, coronary, cerebrovascular, and peripheral vascular) risk; and control of glycemia and blood pressure reduces metabolic and neurologic risk.1,3
The oral biguanide agent metformin (MET) is one of the most widely prescribed medications for type 2 diabetes, and it can improve insulin resistance and decrease hepatic glucose production, leading to a reduction in blood-sugar levels.4–7 In order to research the pharmacokinetics of this medication, to assess patient adherence to prescribed therapy in diabetic patients, and for general drug monitoring, it is necessary to calculate the plasma concentration of metformin. Metformin in biological fluids has been determined using a variety of high-performance liquid chromatography methods.8–11 However, they had a number of drawbacks, including a lack of sensitivity. Because of its high sensitivity, rapid analytical speed, and ease of use, LC-MS/MS is now widely regarded as a powerful technology for accurately quantifying compounds in biological samples. Until now, only a few LC-MS/MS methods for determining MET have been published in biological samples, such as plasma and serum.6,12–15
Dried blood spot (DBS) screening tests were used in the 1960s to diagnose metabolic disorders (phenylketonuria) in infants. Dried Blood Spot (DBS) has recently become a popular choice for bio sampling and for the therapeutic drug monitoring.16–18 The DBS sampling technique is minimally invasive, when it is compared to the conventional venipuncture method. The DBS method collected the blood from a finger prick.
Interest in the DBS technique as an easy blood sampling method can be used easily for monitoring of various drug such as drugs and used as an indicator of adherence to medication.19–24 The key drawback of the DBS technique is its sensitivity, which is expected to increase as more MS and MS/MS equipment becomes available in clinical and scientific laboratories for drug analysis. Recently, few sensitive methods were reported for individual estimation of MET using LC-MS/MS.6,12–15,25–28 Only a few studies published the analysis of MET from DBS utilizing LC-MS/MS.1,4,29–32
This sampling technique (DBS) is also acceptable for infants, which reduces the risk of HIV infection and other infectious pathogens to a minimum. Furthermore, DBSs allow for easier storage and mail delivery to the designated laboratory, saving time and money. After sampling, they should be well desiccated (at least 2–3 hours). DBS technique has various applications like therapeutic drug monitoring,17,18 toxicokinetic studies,33 and preclinical or clinical pharmacokinetic studies.4,28,33
Even when free medicines were available with a high level of health-care access through government primary care units, the study demonstrated poor and suboptimal adherence have been reported in type 2 diabetic population in Saudi Arabia.34
As a result, the aim of this study was to create a tool for therapeutic drug monitoring of metformin using a more straightforward technique: dried blood spot assays. We focused on developing a simple and also sensitive method for MET analysis using LC-MS/MS system using Afatinib as an internal standard (IS). The assay method was validated using USP 2635 or the ICH Harmonized Tripartite Guidelines.36 Linearity, precision, specificity, limit of detection (LOD), and limit of quantification are all factors to consider (LOQ). The developed method was applied for the determination of MET in DBS for diabetic patients receiving the drug for drug adherence study.
Materials and Methods
Materials
Metformin hydrochloride (99% purity) was a gift from Saudi Pharmaceutical Industries & Medical Appliances Corporation (Spimaco, Riyadh, Saudi Arabia). Afatinib (AFT) (99.8% purity) was purchased from Green Stone Swiss Co., Limited. Whatman 903 Protein Saver card (Sigma Aldrich,Chemie GmbH, Munich, Germany). Whatman 903 Protein Saver card (Sigma Aldrich,Chemie GmbH).
All other reagents and chemicals were of HPLC analytical grade, and were used as received. Water was deionized and purified using a Milli-Q Reagent Grade water system (Millipore Corporation, Bedford, MX 01730, USA).
Instrumentation
The study utilized a Waters® Acquity HPLC system with a tandem mass spectrometer (triple-stage quadrupole) and electrospray ionization (ESI) source connected to an Acquity binary solvent manager pump, a cooling autosampler, and Mass lynx software, version 4.1.
Chromatographic and Mass Spectrometric Conditions
Chromatographic separation was achieved at 40℃ using UPLC-HSS T3 (WatersTM) Acquity column (1.0 × 100 mm) and particle size of 1.7 μm. The mobile phase used for analysis was 10 mM ammonium formate with 0.2% formic acid (solvent A, pH 7.0 ± 0.02) and acetonitrile with 0.2% formic acid (solvent B). The gradient elution profile was as follows: 0–2.7 min, 90–30% A, at 2.71 min, 90% A, The total flow rate was 0.2 mL/min, and the total run time for each sample was 3 min. The autosampler kept at 100℃ and sample injection volume was 10µL. Both MET and IS were detected by triple–quadruple LC/tandem mass spectrometric detection (WatersTM) with multiple reaction monitoring (MRM) chromatograms in the electrospray ionization (ESI) positive mode were used in this system. With a dwell time of 0.5 second, the multiple reaction monitoring (MRM) transitions of m/z 130.171.3 for MET and 486.14 370.84 for IS were used. At a flow rate of 650 L/h, nitrogen was used as a desolvating gas. The temperature of the desolvation line was 500°C, while the temperature of the source was 150°C, and the temperature of the nebulizer was 150°C (7 psi). The collision gas (argon) flow rate was 0.15 mL/min, with a 2.5 kV capillary voltage. For MET, the cone voltage and collision energy were set at 26 V and 19 eV, respectively, and for IS, they were set at 86 V and 26 eV.
Calibration Criteria and Quality Control Samples Preparation
MET (6 μg/mL) and Afatinib (IS) (1 μg/mL) standard stock solutions were prepared by dissolving correctly weighted amounts of their respective standards in water and methanol, respectively, stored in 4 mL glass vials at 4 °C in the refrigerator. Different MET serial diluting in the mobile process was used to prepare working calibration, standard solutions, and quality control samples to achieve final concentrations of 8, 16, 24, 32, 40 and 48 ng/mL by dissolving in the mobile phase and spiking working standard solutions in blank DBS. In the same manner, three QCs samples at 8, 23, 48 ng/mL for MET was also prepared by spiking in the blank DBS. Both DBS standards and QC samples were kept at −30 °C until used for validation and/or optimization. New calibration samples and QC samples were prepared freshly on each experimental day.
Sample Extraction Procedure
Using the protein precipitation process, DBS sample preparation and extraction of MET were performed. A 30 μL of blood specifically spotted on whatman 903 cards. Left at ambient temperature for 2 hours let to dry before extraction. Then, to each DBS was punched then transferred to an Eppendorf tube. Protein precipitation done, by adding 1.5 mL aliquots of acetonitrile: Formic acid (90:10) with addition of 20 μL of 1 μg/μL of IS to DBS samples containing different MET spiked concentration (8–48 ng/mL). Sonicate for 10 min then undergo nitrogen evaporation. Samples were reconstituted with two mL of the mobile phase transferred to autosampler vials and aliquots of up to 10.0 μL were injected into the LC-MS/MS system.
Validation Procedures
The full validation assay was performed in accordance with the Food and Drug Administration35 and the European Medicines Agency37 recommendations for bioanalytical method validation.
Application of Method to Volunteer Blood Spot Samples
Utilizing the developed DBS-based LC-MS/MS method, a series of dried blood spot samples collected from selected diabetic volunteers were assessed. All of these volunteers were administered MET for long time, more than 1 year. The samples (30 µL) were taken between 1 and 12 hours after the drug was taken orally. A second group of unprepared volunteers provided a series of DBS blank control samples. The study has received ethical approval of King Saud University Institutional Review Board Committee (IRB); Research Project No. E-20-4829. It was conducted in accordance with the Declaration of Helsinki. All patients provided written informed consent.
Stability
Stock solutions of MET of (6 µg/mL) was prepared in water and stored in autosampler glass vials stable at room temperature (25 °C), at 10 °C, in the refrigerator (4 °C) and in the freezer (−30 °C). Each analyte’s stock solution stability was evaluated separately after 0, 1, 2, 4, 7, 14 and 30 days of storage at different temperatures. The peak areas (PA) of samples prepared from stored stock solutions were compared to those prepared from fresh stock solutions, and the percent difference between the two was determined using the equation below.
% Difference = 100*(Mean PA of old stock−mean PA of new stock)/Mean PA of new stock.
If the percent difference in the mean peak area between the two stock solutions was less than 15% and the percent CV was less than 15%, the stored stock solutions were considered stable.
Results and Discussions
Optimization of Chromatographic Condition
Initially, selection of the columns for the MET and IS separation were assessed. The C18 column does not define the drug and/or IS, while the HSS-T3 (WatersTM) had an excellent separation. The best separation parameters, including the largest area values, relatively quick retention times, a tailing factor close to 1, were obtained with the conditions stated previously. MET showed predominant protonated [M +H]+ parent ions at m/z 131.1 ions, while IS gave [M + NH4]+ at m/z 484.14. The most abundant ion in the product ion mass spectrum was m/z 71.3 for MET and m/z 370.84 for IS (Figure 1).
 |
Figure 1 Product ion spectra of [M + H]+ of metformin, afatinib (IS), fragmentation ion scans. Y-axis is Relative intensity (cps); X-axis is mass-to-charge (m/z, Da). |
Since both MET (polar) and IS (nonpolar) have different physicochemical characteristics, so substantial effort has been made to change chromatographic conditions to achieve sharp peak shape and satisfactory response. The highest chromatographic efficiency with the least solvent consumption was obtained by the use of the HSS-T3 column at 40 0C temperature with a flow rate of (0.2 mL/min) and injection volume (10μL). Methanol and acetonitrile were tested in various ratios with formic acid as organic modifiers. In a short period of time, the use of acetonitrile rather than methanol permitted better response and elution of the two analytes. The gradient ratio of the mobile phase was found to be the most appropriate for the best sensitivity, efficiency and peak form, as described earlier (Figure 2).
 |
Figure 2 Mass chromatograms of blank dried blood spot (A), dried blood spot spiked with a metformin (8 µg/mL) (B) and afatinib (5µg/mL) (C) and dried blood spot from patient after 4 h after administration of 500 mg metformin (D). |
Additionally, the use of the mobile phase in the combination mentioned above as well as the ammonium formate buffer (pH 7.0) is the best for the both MET and IS separation. Comparable results were obtained using the phosphate buffer for the best for separations (pH 7.0).29,38,39
Assay Validation
Selectivity and Specificity
For MET and IS, the method built in this study proved to be highly selective. There were no major endogenous compound interferences at the retention times for MET and IS in six separate blank DBS and QC samples. A representative chromatogram of DBS blank and spiked with MET and IS (Figure 2). System suitability tests were performed with six injections and retention time and peak area ratio (PAR) were obtained with a CV of <2.0% after determining optimal conditions. Average retention time of MET and IS, are 0.71 ± 0.23 and 1.96 ± 0.27 min, respectively (Figure 2). This is a measure of the evolved LC-MS/MS method’s selectivity. In this analysis, the retention time was the shortest, which was comparable to the reported data for MET. It is reported to be at 0.89 min,15,26 at 1.26 min,41 at 1.4 min,27 at 1.45 min,42 1.8 min,14 at 2.65 min25 and at 3.1 min.28
Linearity, Limit of Quantification, Limit of Detection
Peak area ratios (PAR) of MET have a linear relationship (r > 0.996 0.01) and the corresponding concentrations over 8–48 ng/m. The mean linear regression equation of MET was of the form Y = (0.077±0.027) × -(0.0126 ±0.36). The limit of quantification (LOQ) for this assay was 6.1 ng/mL, with a relative standard deviation of 4.2%. At a signal-to-noise ratio of >3, the LOD was 4.5 ng/mL.
Precision and Accuracy
Table 1 shows the intra- and inter-day accuracy and precision tests were performed at 8, 24 and 40 ng/mL of MET concentrations, which was carried out in six replicates (n=6). The accuracy (%differences value) was less than 20% (Table 1). The precision (%RSD value) for the inter- and intra-day were between run of MET, was 2.3–4.1% and 3.05–5.19% (Table 1), respectively. Recovery was calculated using six replicates at same three concentration levels. The mean recovery for MET was 98.24−101.05 with %CV value less than 15% as recommended by ICH guidelines for all concentrations. The accuracy and precision from the results obtained were producible and reliable for quantification of MET in DBS and QC samples.
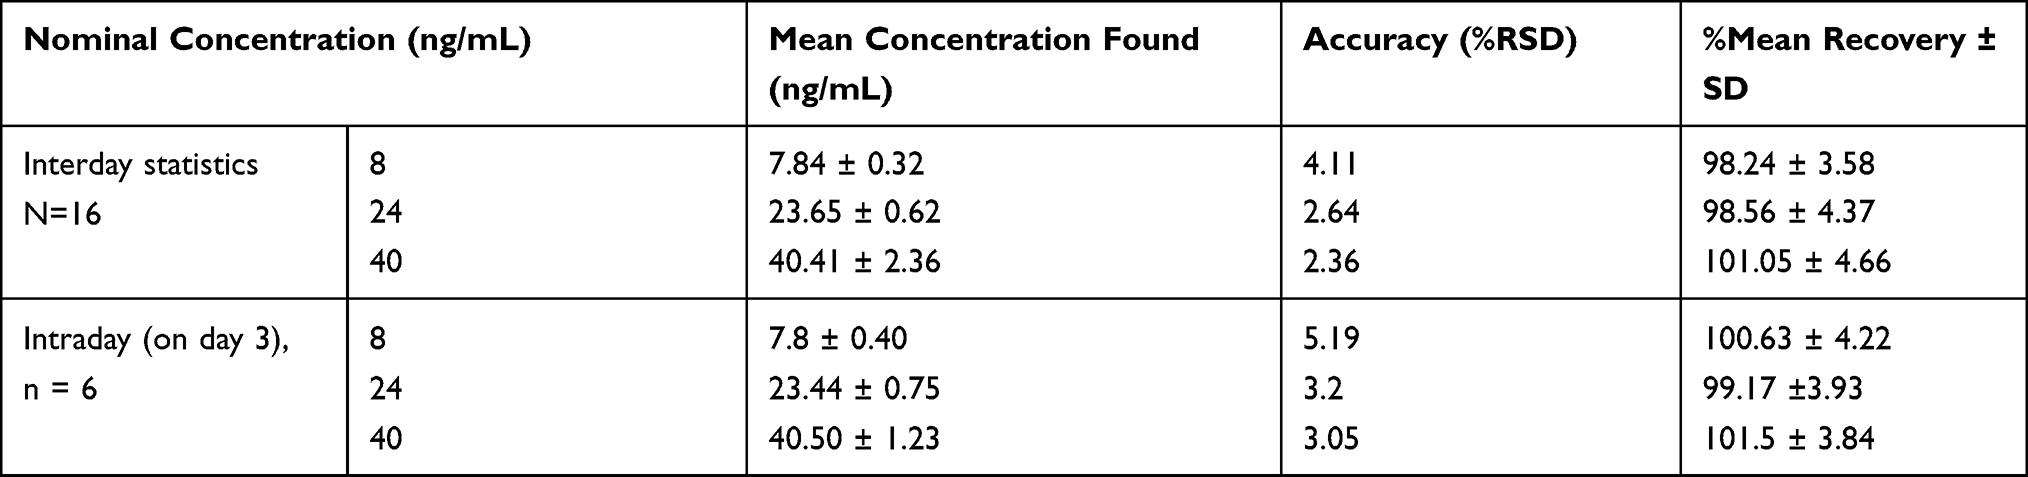 |
Table 1 Summary of Back Calculated of the Calibration Curve for the Determination of MET |
Extraction Recovery (ER)
The peak area ratios of three MET concentrations (low, medium, and high QC samples) to the collected spiked samples at sufficient concentrations were used to assess the mean extraction recoveries (ER) of MET. At QC speeds, the extraction recovery values for the CV percent were less than 8%. As a result, extraction recovery for the MET was repeatable at each QC stage. ER can be calculated as, % ER = 100* (pre-extraction peak area ratio/post-extraction peak area ratio). As displayed in Table 2, % ER ranged from 94.21% ± 3.74 to 98.65%± 5.34 for MET.
 |
Table 2 Extraction Recovery (ER) and Matrix Effect (ME) of QC Sample of Metformin in Spiked DBS Using LC-MS/MS |
Stability Studies
Prior to analysis, the stability test for MET in DBS was evaluated in the short and long term at storage temperature and autosampler condition. Figure 3 shows that the MET was stable at 4, 10, 25 and −30℃ for 1 month in the processed samples held in the autosampler. No evident changes in the elution profile and chromatographic reports have been observed.
 |
Figure 3 Stability of metformin in autosampler vials at different temperature conditions. |
All percent CV values were within the range provided in the guidelines of the FDA (ie, <3%), indicating that the method developed is stable.
Application of Method to Volunteer DBS Samples
A retractable lancet pricked the finger and a sterile gauze cleaned away the first drop of blood. On a Whatman 903 sampling card, subsequent drops were deposited on marked parts and allowed to dry. The spot sizes were adequate without sacrificing the DBS sample to allow the use of an 8 mm punch. For the identification and quantification of 12 dried blood spot samples collected from a group of volunteers (n=6), the validated DBS based LC-MS/MS approach was successfully used. Table 3 presents the measured DBS drug concentrations collected.
 |
Table 3 Metformin Concentrations from Six Volunteers |
All data in Table 3 were within the therapeutic MET concentration, so the drug was at a steady state level to ensure that the drug has already been distributed. The therapeutic level for this drug was reported to be between 0.129 and 90 mg/L.40 There was no correlation ship between the concentration of MET and the drug dose per day, this may be due to individual variation. This technique can also classify the adherence of the patient to the drug.
Discussion
For the quantitative determination of drugs in biological matrices such as dried blood spots, liquid chromatography coupled with electrospray ionization tandem mass spectrometry (LC-MS/MS) is now widely used (DBS). The developed LC-MS/MS method allowed for sensitive MET estimation in DBS, with results that met FDA bioanalytical requirements. A simple technique of preparation that requires a single step and rapid extraction with short run time (3 min), as well as can measure up to 4 ng/mL as limit of quantification for MET. This procedure was successfully performed to assess the plasma concentration of MET in diabetes mellitus volunteers following the oral administration of MET tablet. This technique, DBS home sampling, can be used easily for the purpose of therapeutic drug monitoring. According to the findings of this report, DBS home sampling for TDM is linked to lower healthcare and patient costs, as well as increased patient trust.
Conclusion
In conclusion, a fast, delicate and simpler method has been developed and validated for DBS quantification of MET with LC-MS/MS technique, with a shorter run time of 3.0 min. Sensitivity and regeneration have also been maintained and have been adequate to measure the patient’s MET, albeit using DBS. All validation criteria referring to EMA and FDA guidelines have been successfully met by this process. This method can be reply on it to as DBS home sampling for the purpose of TDM of patients receiving MET for treatment of diabetic mellitus.
Data Sharing Statement
All data and material are available upon request.
Ethics
Institutional Review Board Committee (IRB) of King Saud University; Research Project No. E-20-4829.
Acknowledgments
The authors extend their appreciation to the Deputyship for Research & Innovation, “Ministry of Education” in Saudi Arabia for funding this research work through the project number IFKSURG-91.
Author Contributions
All authors contributed to data analysis, drafting or revising the article, have agreed on the journal to which the article will be submitted, gave final approval of the version to be published, and agree to be accountable for all aspects of the work.
Disclosure
The authors reported no conflicts of interest for this work.
References
1. American Diabetes Association. Standards of medical care for patients with diabetes mellitus. Diabetes Care. 2002;25:213–229. doi:10.2337/diacare.25.1.213
2. Prahalad P, Tanenbaum M, Hood K, Maahs D. Diabetes technology: improving care, improving patient‐reported outcomes and preventing complications in young people with Type 1 diabetes. Diabet Med. 2018;35:419–429. doi:10.1111/dme.13588
3. American Diabetes Association. 6. Glycemic targets: standards of medical care in diabetes—2021. Diabetes Care. 2021;44:S73–S84. doi:10.2337/dc21-S006
4. Aburuz S, Millership J, Mcelnay J. Dried blood spot liquid chromatography assay for therapeutic drug monitoring of metformin. J Chromatogr B. 2006;832:202–207. doi:10.1016/j.jchromb.2005.12.050
5. Dey L, Attele AS, Yuan CS. Alternative therapies for type 2 diabetes. Altern Med Rev. 2002;7:45–58.
6. Jiang J, She X, Zhu J, et al. A composite consisting of sulfo-functionalized magnetic graphene and mesoporous silica for extraction of metformin and glimepiride prior to their determination by liquid chromatography tandem mass spectrometry. Microchimica Acta. 2019;186:590. doi:10.1007/s00604-019-3693-1
7. Mukhtar Y, Galalain A, Yunusa U. A modern overview on diabetes mellitus: a chronic endocrine disorder. Eur J Biol. 2020;5:1–14.
8. Arayne MS, Sultana N, Zuberi MH. Development and validation of RP-HPLC method for the analysis of metformin. Pak J Pharm Sci. 2006;19:231–235.
9. Attimarad M, Elgorashe REE, Subramaniam R, et al. Development and validation of rapid RP-HPLC and green second-derivative UV spectroscopic methods for simultaneous quantification of metformin and remogliflozin in formulation using experimental design. Separations. 2020;7:59. doi:10.3390/separations7040059
10. Kar M, Choudhury P. HPLC method for estimation of metformin hydrochloride in formulated microspheres and tablet dosage form. Indian J Pharm Sci. 2009;71:318. doi:10.4103/0250-474X.56031
11. Umapathi P, Ayyappan J, Quine SD. Quantitative determination of metformin hydrochloride in tablet formulation containing croscarmellose sodium as disintegrant by HPLC and UV spectrophotometry. Trop J Pharm Res. 2012;11:107–116. doi:10.4314/tjpr.v11i1.14
12. Elgawish MS, Nasser S, Salama I, Abbas AM, Mostafa SM. Liquid chromatography tandem mass spectrometry for the simultaneous determination of metformin and pioglitazone in rat plasma: application to pharmacokinetic and drug-drug interaction studies. J Chromatogr B. 2019;1124:47–57. doi:10.1016/j.jchromb.2019.05.036
13. Mohamed D, Elshahed MS, Nasr T, Aboutaleb N, Zakaria O. Novel LC–MS/MS method for analysis of metformin and canagliflozin in human plasma: application to a pharmacokinetic study. BMC Chem. 2019;13:82. doi:10.1186/s13065-019-0597-4
14. Moussa BA, Mahrouse MA, Fawzy MG. A validated LC-MS/MS method for simultaneous determination of linagliptin and metformin in spiked human plasma coupled with solid phase extraction: application to a pharmacokinetic study in healthy volunteers. J Pharm Biomed Anal. 2019;163:153–161. doi:10.1016/j.jpba.2018.09.052
15. Thao NNN, Hieu NN, DO CHAU MINH VINH THO T, Loan TT, Tuan ND. Development, validation, and application for simultaneous assay of metformin and sitagliptin in human plasma by liquid chromatography–tandem mass spectrometry. Sys Rev Pharm. 2020;11:6–13.
16. Chernonosov A. The use of dried blood spots for the quantification of antihypertensive drugs. Int J Anal Chem. 2018;2018. doi:10.1155/2018/3235072
17. Freeman JD, Rosman LM, Ratcliff JD, Strickland PT, Graham DR, Silbergeld EK. State of the science in dried blood spots. Clin Chem. 2018;64:656–679. doi:10.1373/clinchem.2017.275966
18. Li W, Lee M, Li W, Lee M. Dried blood spots. In: Applications and Techniques. Wiley Hoboken; 2014:VIII–IX.
19. Bernieh D, Lawson G, Tanna S. Quantitative LC–HRMS determination of selected cardiovascular drugs, in dried blood spots, as an indicator of adherence to medication. J Pharm Biomed Anal. 2017;142:232–243. doi:10.1016/j.jpba.2017.04.045
20. Capiau S, Veenhof H, Koster RA, et al. Official international association for therapeutic drug monitoring and clinical toxicology guideline: development and validation of dried blood spot–based methods for therapeutic drug monitoring. Ther Drug Monit. 2019;41:409–430. doi:10.1097/FTD.0000000000000643
21. Lehmann S, Delaby C, Vialaret J, Ducos J, Hirtz C. Current and future use of “dried blood spot” analyses in clinical chemistry. Clin Chem Lab Med. 2013;51:1897–1909. doi:10.1515/cclm-2013-0228
22. Maggadani BP, Harahap Y, Haryono SJ, Sitorus TRJ. Simple and rapid method for the simultaneous analysis of tamoxifen, endoxifen, and 4-hydroxytamoxifen in dried blood spot using liquid chromatography–tandem mass spectrometry. Int J Appl Pharm. 2020;12:112–120. doi:10.22159/ijap.2020v12i3.36434
23. Velghe S, Deprez S, Stove CP. Fully automated therapeutic drug monitoring of anti-epileptic drugs making use of dried blood spots. J Chromatogr A. 2019;1601:95–103. doi:10.1016/j.chroma.2019.06.022
24. Wagner M, Tonoli D, Varesio E, Hopfgartner G. The use of mass spectrometry to analyze dried blood spots. Mass Spectrom Rev. 2016;35:361–438. doi:10.1002/mas.21441
25. Agrawal Y, Gogoi P, Manna K, Bhatt H, Jain V. A supercritical fluid chromatography/tandem mass spectrometry method for the simultaneous quantification of metformin and gliclazide in human plasma. Indian J Pharm Sci. 2010;72:50. doi:10.4103/0250-474X.62231
26. Chaudhari K, Wang J, Xu Y, et al. Determination of metformin bio-distribution by LC-MS/MS in mice treated with a clinically relevant paradigm. PLoS One. 2020;15:e0234571. doi:10.1371/journal.pone.0234571
27. Kumar PP, Murthy T, Rao MB. Development, validation of liquid chromatography-tandem mass spectrometry method for simultaneous determination of rosuvastatin and metformin in human plasma and its application to a pharmacokinetic study. J Adv Pharm Technol Res. 2015;6:118. doi:10.4103/2231-4040.157982
28. Shah PA, Shah JV, Sanyal M, Shrivastav PS. LC–tandem mass spectrometry method for the simultaneous determination of metformin and sitagliptin in human plasma after ion-pair solid phase extraction. J Pharm Biomed Anal. 2016;131:64–70. doi:10.1016/j.jpba.2016.08.011
29. Harahap Y, Sari PA, Jatmika C. Development and validation of a high-performance liquid chromatography method for determining metformin hydrochloride in dried blood spots. Int J Appl Pharm. 2018;10:126–129. doi:10.22159/ijap.2018.v10s1.26
30. Scherf-clavel M, Albert E, Zieher S, Valotis A, Hickethier T, Högger P. Dried blood spot testing for estimation of renal function and analysis of metformin and sitagliptin concentrations in diabetic patients: a cross-sectional study. Eur J Clin Pharmacol. 2019;75:809–816. doi:10.1007/s00228-019-02637-w
31. Scherf-clavel M, Högger P. Analysis of metformin, sitagliptin and creatinine in human dried blood spots. J Chromatogr B. 2015;997:218–228. doi:10.1016/j.jchromb.2015.06.014
32. Swales JG, Gallagher RT, Denn M, Peter RM. Simultaneous quantitation of metformin and sitagliptin from mouse and human dried blood spots using laser diode thermal desorption tandem mass spectrometry. J Pharm Biomed Anal. 2011;55:544–551. doi:10.1016/j.jpba.2011.02.030
33. Burnett JE. Dried blood spot sampling: practical considerations and recommendation for use with preclinical studies. Bioanalysis. 2011;3:1099–1107. doi:10.4155/bio.11.68
34. Alqarni AM, Alrahbeni T, AL QARNI A, AL QARNI HM. Adherence to diabetes medication among diabetic patients in the Bisha governorate of Saudi Arabia–a cross-sectional survey. Patient Prefer Adherence. 2019;13:63. doi:10.2147/PPA.S176355
35. Administration, F. A. D. Guidance for industry bioanalytical method validation guidance for industry bioanalytical method validation. 2018.
36. ICH, ICOHORFROPFHU. Q2 (R1) Validation of analytical procedures: text and methodology. Geneva: International Conference on Harmonization; 2005.
37. EM Agency. Guideline on Bioanalytical Method Validation. EM Agency; 2012.
38. Elshaboury SR, Mohamed NA, Ahmed S, Farrag S. An efficient ion-pair liquid chromatographic method for the determination of some H2 receptor antagonists. J Chromatogr Sci. 2016;54:419–428. doi:10.1093/chromsci/bmv159
39. Iwasaki Y, Sawada T, Hatayama K, et al. Separation technique for the determination of highly polar metabolites in biological samples. Metabolites. 2012;2:496–515. doi:10.3390/metabo2030496
40. Kajbaf F, De Broe ME, Lalau JD. Therapeutic concentrations of metformin: a systematic review. Clin Pharmacokinet. 2016;55:439–459. doi:10.1007/s40262-015-0323-x
41. Wang Y, Tang Y, Gu J, Fawcett JP, Bai X. Rapid and sensitive liquid chromatography-tandem mass spectrometric method for the quantitation of metformin in human plasma. Chromatogr B Analyt Technol Biomed Life Sci. 2004:808(2):215-219.
42. Mistri H, Jangid AG, Shrivastav RS. Liquid chromatography-tandem mass spectroscopy method for simultaneous determination of antidiabetic drugs metformin and glyburide in human plasma. Pharm Biomed Anal. 2007:45:(1):97-106.
 © 2021 The Author(s). This work is published and licensed by Dove Medical Press Limited. The
full terms of this license are available at https://www.dovepress.com/terms
and incorporate the Creative Commons Attribution
- Non Commercial (unported, 3.0) License.
By accessing the work you hereby accept the Terms. Non-commercial uses of the work are permitted
without any further permission from Dove Medical Press Limited, provided the work is properly
attributed. For permission for commercial use of this work, please see paragraphs 4.2 and 5 of our Terms.
© 2021 The Author(s). This work is published and licensed by Dove Medical Press Limited. The
full terms of this license are available at https://www.dovepress.com/terms
and incorporate the Creative Commons Attribution
- Non Commercial (unported, 3.0) License.
By accessing the work you hereby accept the Terms. Non-commercial uses of the work are permitted
without any further permission from Dove Medical Press Limited, provided the work is properly
attributed. For permission for commercial use of this work, please see paragraphs 4.2 and 5 of our Terms.