Back to Journals » Diabetes, Metabolic Syndrome and Obesity » Volume 16
Development and Validation of a Risk Prediction Model for Ketosis-Prone Type 2 Diabetes Mellitus Among Patients Newly Diagnosed with Type 2 Diabetes Mellitus in China
Authors Jiang Y ![]() , Zhu J
, Zhu J ![]() , Lai X
, Lai X ![]()
Received 23 June 2023
Accepted for publication 5 August 2023
Published 18 August 2023 Volume 2023:16 Pages 2491—2502
DOI https://doi.org/10.2147/DMSO.S424267
Checked for plagiarism Yes
Review by Single anonymous peer review
Peer reviewer comments 3
Editor who approved publication: Prof. Dr. Juei-Tang Cheng
Yanjuan Jiang,1 Jianting Zhu,2 Xiaoyang Lai1
1Department of Endocrinology, The Second Affiliated Hospital of Nanchang University, Nanchang, People’s Republic of China; 2Department of Intensive Care Unit, The Second Affiliated Hospital of Nanchang University, Nanchang, People’s Republic of China
Correspondence: Xiaoyang Lai, Department of Endocrinology, The Second Affiliated Hospital of Nanchang University, No. 1, Minde Road, Donghu District, Nanchang, 330006, People’s Republic of China, Tel +8613607916298, Email [email protected]
Background: We established a nomogram for ketosis-prone type 2 diabetes mellitus (KP-T2DM) in the Chinese adult population in order to identify high-risk groups early and intervene in the disease progression in a timely manner.
Methods: We reviewed the medical records of 924 adults with newly diagnosed T2DM from January 2018 to June 2021. All patients were randomly divided into the training and validation sets at a ratio of 7:3. The least absolute shrinkage and selection operator regression analysis method was used to screen the predictors of the training set, and the multivariable logistic regression analysis was used to establish the nomogram prediction model. We verified the prediction model using the receiver operating characteristic (ROC) curve, judged the model’s goodness-of-fit using the Hosmer-Lemeshow goodness-of-fit test, and predicted the risk of ketosis using the decision curve analysis.
Results: A total of 21 variables were analyzed, and four predictors—hemoglobin A1C, 2-hour postprandial blood glucose, 2-hour postprandial C-peptide, and age—were established. The area under the ROC curve for the training and validation sets were 0.8172 and 0.8084, respectively. The Hosmer-Lemeshow test showed that the prediction model and validation set have a high degree of fit. The decision curve analysis curve showed that the nomogram had better clinical applicability when the threshold probability of the patients was 0.03– 0.79.
Conclusion: The nomogram based on hemoglobin A1C, 2-hour postprandial blood glucose, 2-hour postprandial C-peptide, and age has good performance and can serve as a favorable tool for clinicians to predict KP-T2DM.
Keywords: diabetic ketoacidosis, nomogram, prediction model, ketosis-prone type 2 diabetes mellitus
Introduction
Some diabetics have spontaneous ketosis or diabetic ketoacidosis (DKA) at onset, often lacking evidence of islet cell autoimmunity, with clinical features similar to those of type 2 diabetes mellitus (T2DM). In recent years, this has been termed as ketosis-prone T2DM (KP-T2DM) and is a group of heterogeneous diseases.1 Previous research have suggested that KP-T2DM is closely relevant to A-β+ ketosis-prone diabetes (KPD) according to the currently recognized “Aβ” classification scheme, which can accurately predict long-term blood glucose performance and islet cell function.2 Similar to A-β+ KPD, KP-T2DM is more sensitive to glucotoxicity, and hyperglycemia during the first episode of ketosis leads to a temporary and sharp decline in islet β-cell function, which can initially be improved with insulin treatment and can also be recovered. Insulin therapy is not required for a long period of time and is followed by an inevitable decline in insulin dependence, presenting clinical features different from those of classic T2DM.3
Despite rapid progress in the diagnosis and treatment of diabetes, DKA still has a high mortality rate in developing countries.4,5 A Chinese study suggested that the prevalence of diabetic ketosis without acidosis (DKWA) was significantly higher than that of DKA in patients with KP-T2DM; however, patients with DKWA are usually asymptomatic, making DKWA difficult to identify, which can lead to worse outcomes.6 In the past, KP-T2DM was common in African- American and Hispanic populations. Among African-American and Hispanic patients with newly diagnosed DKA, the prevalence of KP-T2DM was estimated to be between 20% and 50%.7–9 With the worldwide prevalence of T2DM, an increasing number of cases of KP-T2DM have been reported. Seok et al found that patients with T2DM with ketosis onset accounted for 35% of patients with new-onset diabetes in the Korean population.3 Similar illnesses had been reported in young adults in Japan.10 In urban China, patients with KPD under the age of 35 accounted for 7.6% of all patients with diabetes.11 The epidemiological data of diabetes in China in 2020 show that the prevalence of diabetes among Chinese adults is 12.8%, and is on the rise.12 Thus, patients with KP-T2DM may become a huge proportion of patients with diabetes in China in the future.
Methods
Study Population
We collected the medical records of 1130 patients with newly diagnosed diabetes admitted to the Department of Endocrinology, Second Affiliated Hospital of Nanchang University, Jiangxi Province, China, from January 2018 to June 2021 for retrospective analysis. After excluding cases that did not meet the inclusion criteria and those with missing or wrong data, 924 cases were included in the study, including 214 with ketosis onset and 710 with non-ketosis onset. A flowchart of the research design is presented in Figure 1.
 |
Figure 1 Flow diagram of study design. Abbreviations: T2DM, type 2 diabetes mellitus; WHO, world Health Organization; ADA, the American Diabetes Association; LASSO, least absolute shrinkage and selection operator; HbA1c, hemoglobin A1C; 2h-PBG, 2-hour postprandial blood sugar; 2hC-P, 2-hour postprandial C-peptide. |
All patients with newly diagnosed diabetes (duration < 1 year) were aged ≥ 18 years at onset and were not receiving antidiabetic medication at diagnosis. All patients met the definition and criteria of T2DM established by the American Diabetes Association: fasting blood glucose (FBG) concentration ≥ 7.0 mmol/L (126 mg/dL) or venous blood glucose 2 h after glycemic load ≥ 11.1 mmol/L (200 mg/dL), confirmed on two occasions. Patients with type 1 diabetes mellitus (T1DM), special type diabetes, and unspecified types were excluded according to the clinical diagnosis of the respective attending physicians. The patient’s serum glutamate decarboxylase antibody, insulinoma-associated antigen 2 antibody, and zinc transporter 8 antibody levels were all negative, and these items were detected by enzyme-linked immunosorbent assay. Pregnant and lactating women as well as patients with severe heart, liver, and renal insufficiency; tumors; physical disabilities; infections; trauma; and surgery were excluded.
Data Collection
This was a single-center retrospective cross-sectional study. The following patient data were collected through the big data platform of the clinical medical records of the Second Affiliated Hospital of Nanchang University.
- Basic information: We collected information on age, sex, height, weight, and calculated the body mass index (BMI). Family history of diabetes, smoking, and drinking were based on the records of the attending physician when the patient was admitted to the hospital. The average systolic blood pressure (SBP) and diastolic blood pressure (DBP) were calculated by averaging the two values at admission. The diagnosis of nonalcoholic fatty liver disease (NAFLD) was determined in conjunction with the abdominal ultrasound report and discharge diagnosis.
- Laboratory indicators: All tests were performed after subjects fasted for 8 h. Based on the laboratory regulations of the Second Affiliated Hospital of Nanchang University, FBG, 2-hour postprandial blood glucose (2h-PBG), total cholesterol (TC), triglyceride (TG), high-density lipoprotein cholesterol (HDL-C), low-density lipoprotein cholesterol (LDL-C), and serum creatinine (SCr) were determined using the kinetic enzymatic method. Hemoglobin A1C (HbA1c) assessed by chromatography. Fasting C-peptide (FC-P), 2-hour postprandial C-peptide (2hC-P), serum uric acid (SUA), and urine microalbumin (UMA) were measured using immunoassay, and the ratio of urine albumin to creatinine ratio (UACR) was calculated.
Definition of KP-T2DM
Patients with KP-T2DM are patients with new-onset T2DM with unprovoked ketosis or DKA as the main symptoms. DKA was defined as blood ketones ≥ 3 mmol/L or positive urine glucose and ketone bodies (≥ ++) with increased blood glucose levels (> 13.9 mmol/L), arterial pH < 7.3, and/or decreased carbon dioxide binding capacity (serum bicarbonate level < 18 mmol/L). In the absence of acidosis, it is called diabetic ketosis.
Compliance with Ethics Guidelines
Before the study commenced, we obtained approval from the Ethics Committee of the Second Affiliated Hospital of Nanchang University (The Examination and Approval No. Review [2021] No. 010). This study was approved by the Clinical Research Center of the Second Affiliated Hospital of Nanchang University and completed in accordance with the Declaration of Helsinki. All participants signed informed consent forms before the start of the study.
Statistical Analyses
Statistical analyses were performed using the R programming language (version 4.1.3). The measurement data conforming to the normal distribution are described as the means ± standard deviations, and the independent-samples t-test was used for comparison between the two groups. The measurement data that did not conform to the normal distribution were expressed as medians and quartiles, and nonparametric tests were used. Enumeration data were analyzed using χ2 tests.
All data were allocated to the training and validation sets according to the ratio of 7:3, and KP-T2DM was used as the outcome variable to screen the predictors by the least absolute shrinkage and selection operator (LASSO) regression analysis. Multivariate logistic regression analysis was used to further explore and establish a nomogram prediction model. To evaluate the performance of the prediction model, this study used the area under the receiver operating characteristic (ROC) curve to verify the prediction effect of the prediction model and used the Hosmer-Lemeshow goodness-of-fit test to judge the goodness-of-fit of the model and draw a calibration curve. Decision curve analysis (DCA) was used to predict the risk of developing diabetic ketosis. Statistical significance was set at P < 0.05.
Results
Basic Information of the Study Cohort
A total of 924 patients with newly diagnosed T2DM were included, of which 214 had ketosis at onset. Therefore, the prevalence of KP-T2DM was 23.16% in this cohort. There were 168 men and 46 women with onset of ketosis, with an average age of 34.54 ± 1.08 years. There were 710 patients (76.84%) with non-ketosis onset, including 471 males and 239 females, with an average age of 45.38 ± 14.37 years.
Clinical Features of KP-T2DM
By comparing the medical record data of patients with KP-T2DM and non-ketosis-prone type 2 diabetes mellitus (NKP-T2DM), we found that patients with KP-T2DM were mostly male, and the average age of onset was lower than that of patients with NKP-T2DM. Patients with KP-T2DM had higher FBG, 2h-PBG, and HbA1c levels at onset, which indicated that the blood glucose level of patients with KP-T2DM was significantly higher than that of patients with NKP-T2DM. Meanwhile, patients with KP-T2DM had significantly lower FC-P and 2hC-P levels and worse islet cell function. Furthermore, we found that patients with KP-T2DM had higher high-density lipoprotein, SUA, and SCr levels and more severe metabolic disorders. The differences in these indicators were statistically significant (P < 0.05). There were no significant differences in family history of diabetes, smoking history, drinking history, NAFLD diagnosis, BMI, and SBP, DBP, TC, TG, LDL-C, and UACR levels (P > 0.05). The baseline characteristics of the two patient groups are shown in Table 1.
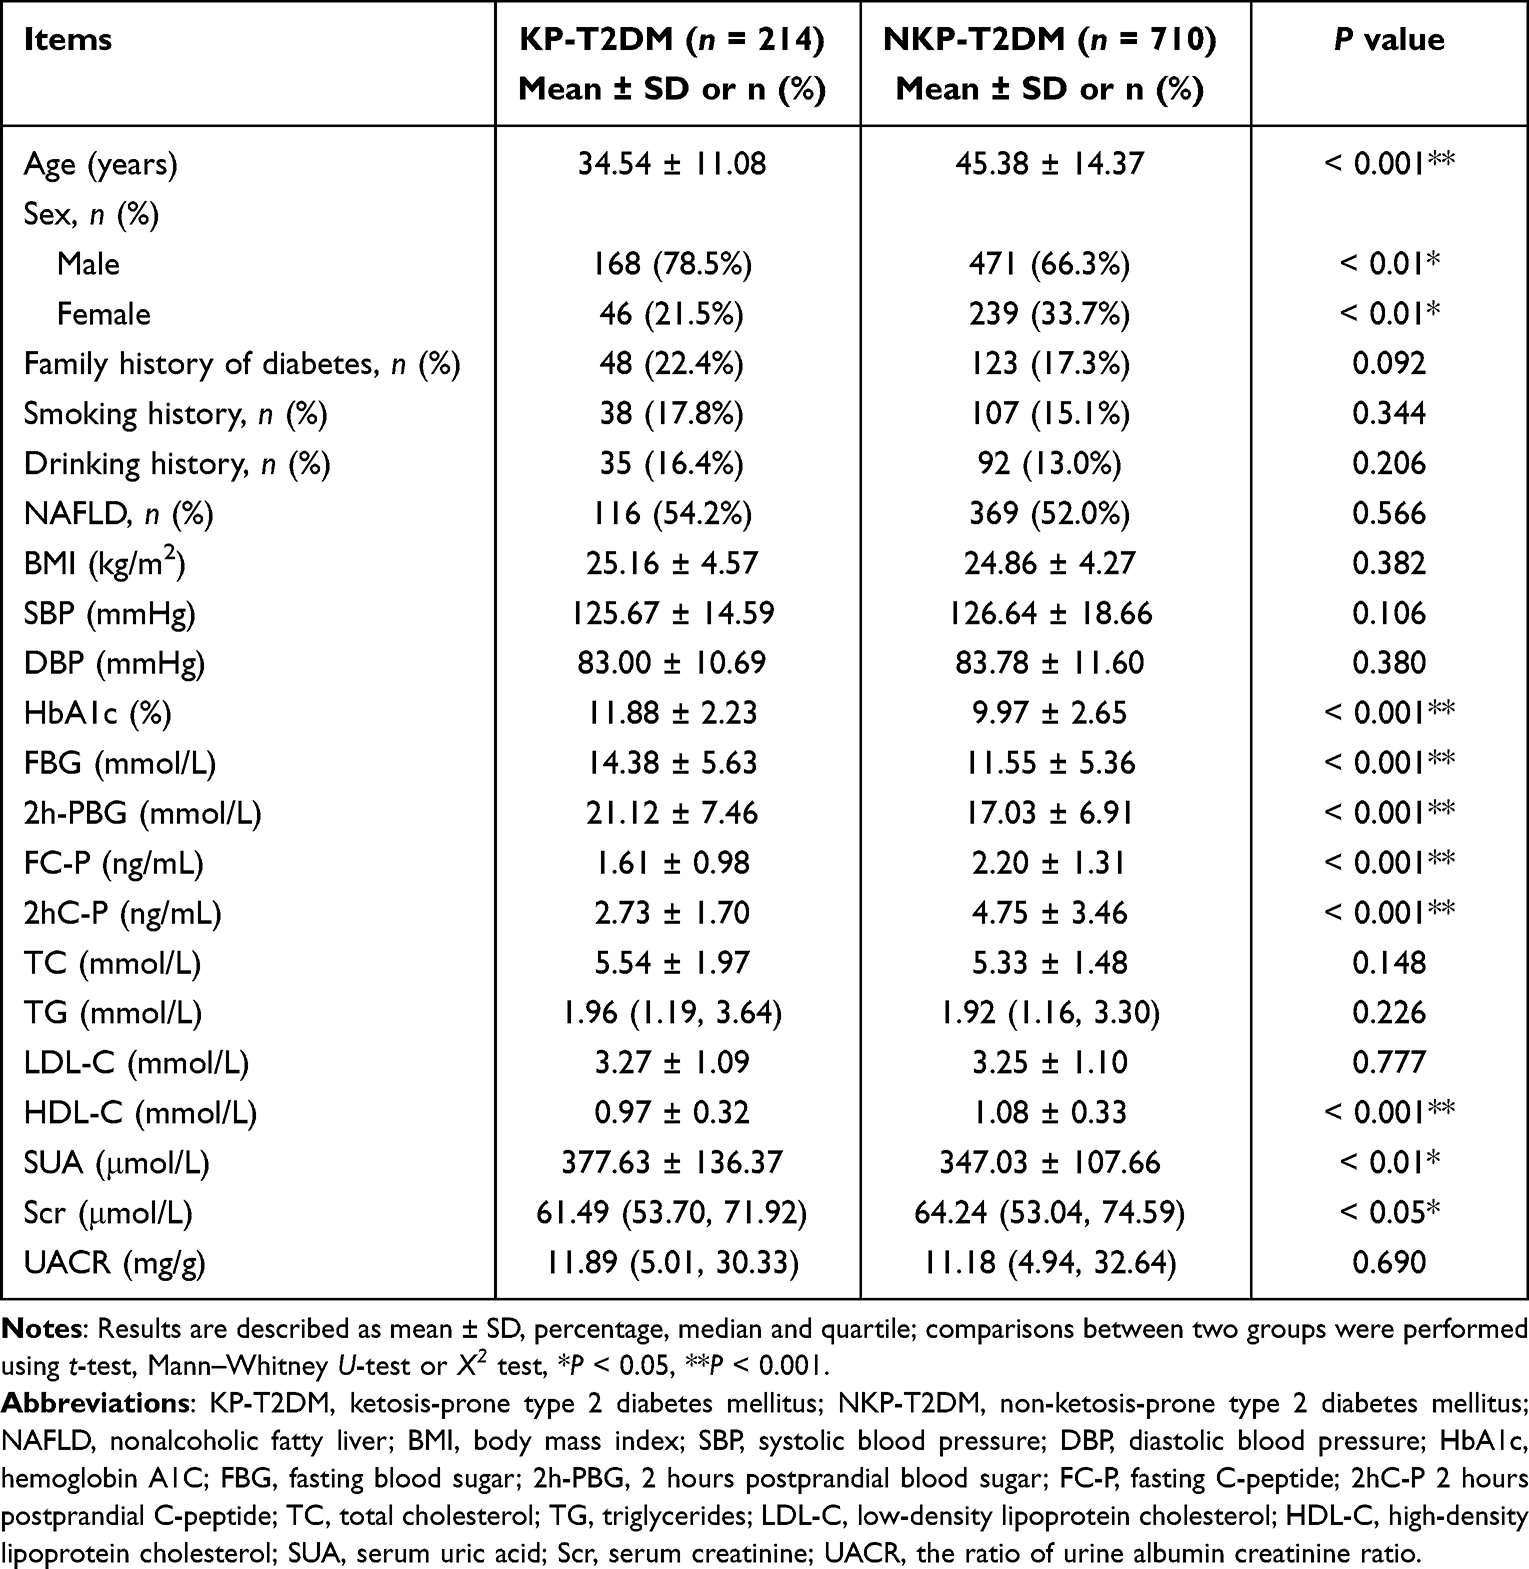 |
Table 1 Comparison of Clinical Characteristics Between KP-T2DM and NKP-T2DM Groups |
Comparison of Medical Record Data Between Training Set and Validation Set
The medical record data of the training and validation sets were compared, and the results showed that sex, family history of diabetes, smoking history, drinking history, NAFLD diagnosis, age, BMI, and SBP, DBP, HbA1c, FBG, 2h-PBG, FC-P, 2hC-P, TC, TG, LDL-C, HDL-C, SUA, SCr, and UACR levels were not statistically significant (P > 0.05) (Table 2).
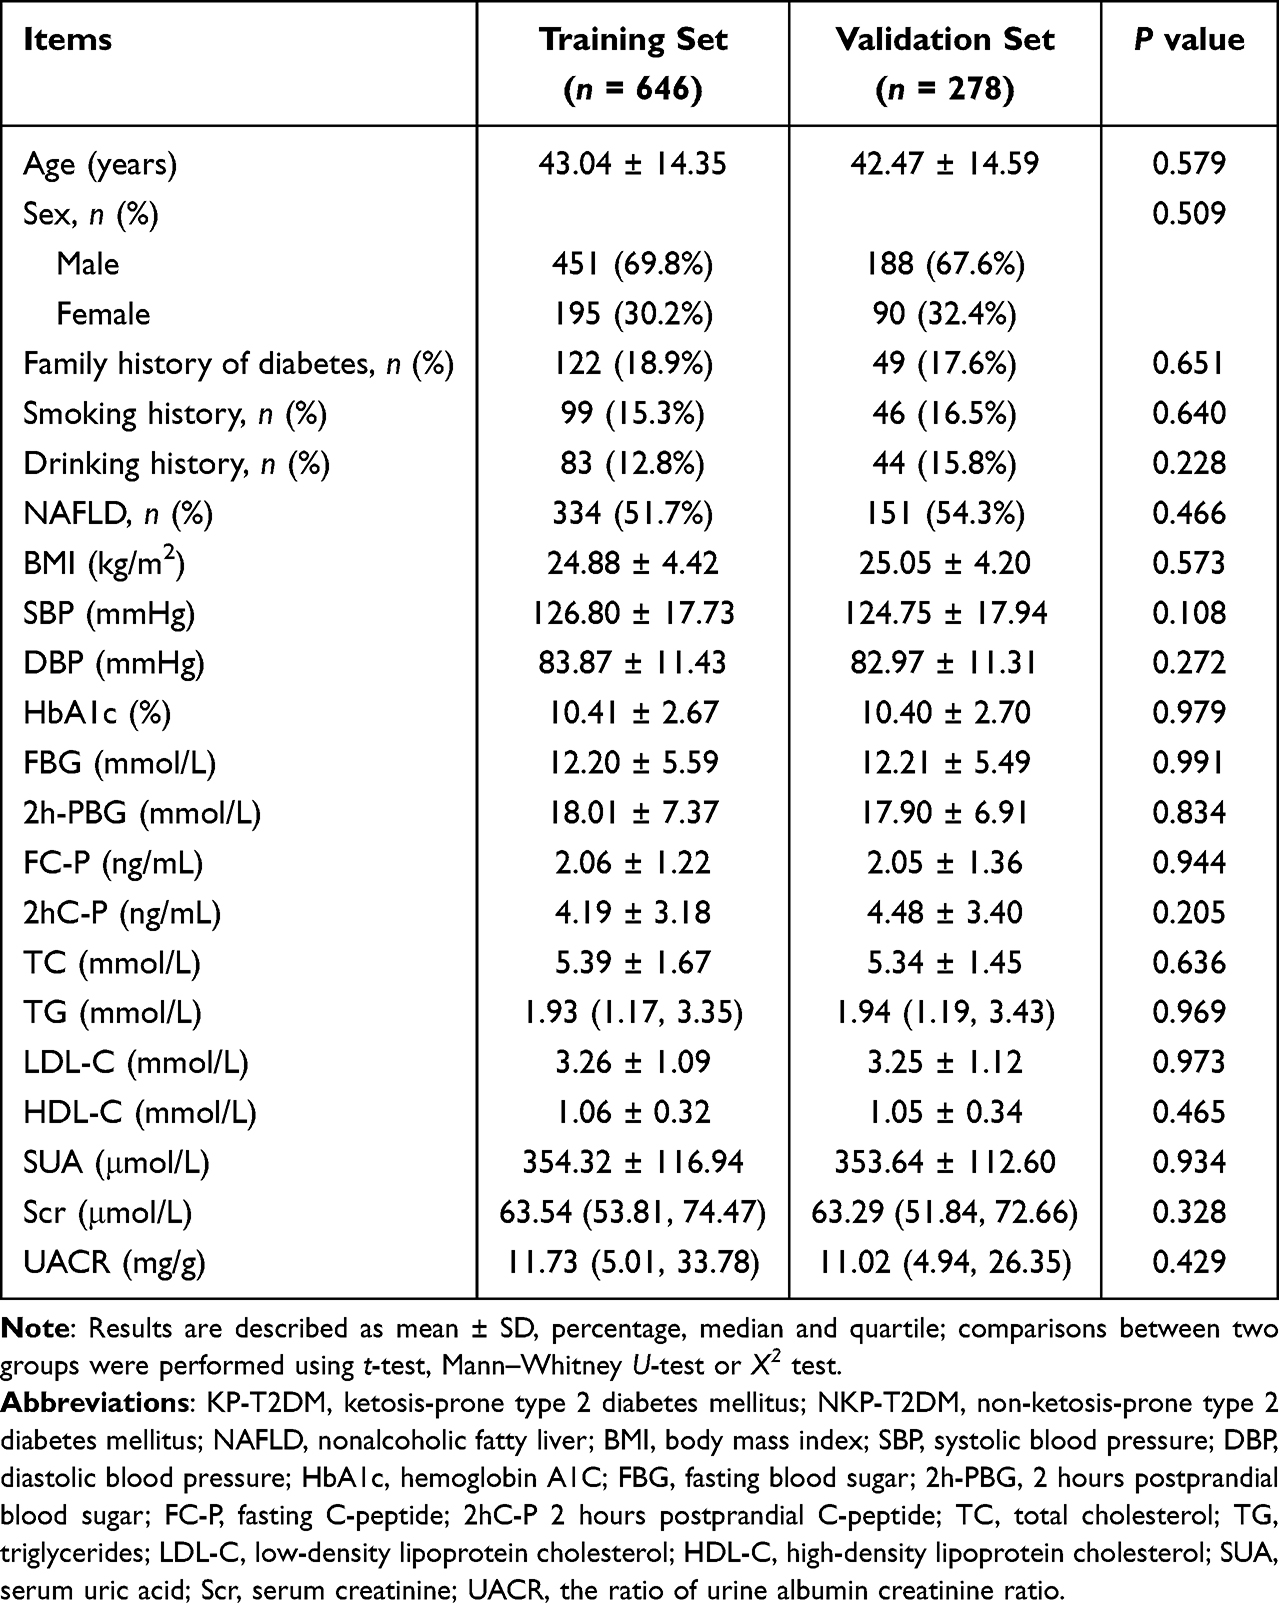 |
Table 2 Data Comparison Between Training Set and Validation Set |
Construction of Predictive Model
Screening of Predictor Variables
The main process of establishing the model was to use LASSO regression analysis to screen out the predictors and to analyze independent risk factors with multivariate logistic regression, based on KP-T2DM as the outcome variable. LASSO regression analysis was used to select predictor variables from the training set data. The original 21 variables in Table 1 were included in the prediction model with four indicators: age, HbA1c, 2h-PBG, and 2hC-P. These four variables have non-zero coefficients in the LASSO regression model (Figure 2).
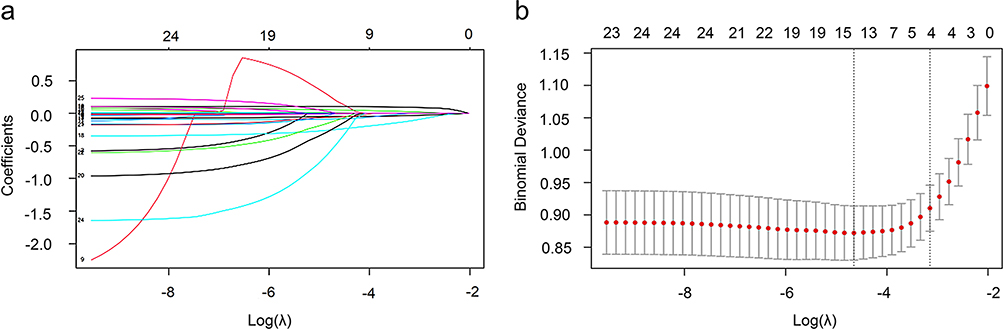 |
Figure 2 LASSO regression coefficient plot for 21 variables. Abbreviation: LASSO, least absolute shrinkage and selection operator. Notes: (a) Four variables with non-zero regression coefficients are selected as potential predictors at the most optimal lambda (λ). (b) This graph shows the binomial deviation curve versus log(λ) and chooses the best λ based on this graph. Vertical dashed lines are drawn at the optimal value and 1 standard error, with λ between these two values considered appropriate. |
The results of multivariate logistic regression analysis are shown in Table 3, which shows that age [OR = 0.938 (95% confidence interval [CI]: 0.921, 0.955)], HbA1c [odds ratio [OR] = 1.120 (95% CI: 1.008, 1.246)], 2h-PBG [OR = 1.061 (95% CI: 1.030, 1.093)] and 2hC-P [OR = 0.724 (95% CI: 0.637, 0.823)] were independent risk factors for KP-T2DM, and the difference was statistically significant (P < 0.05).
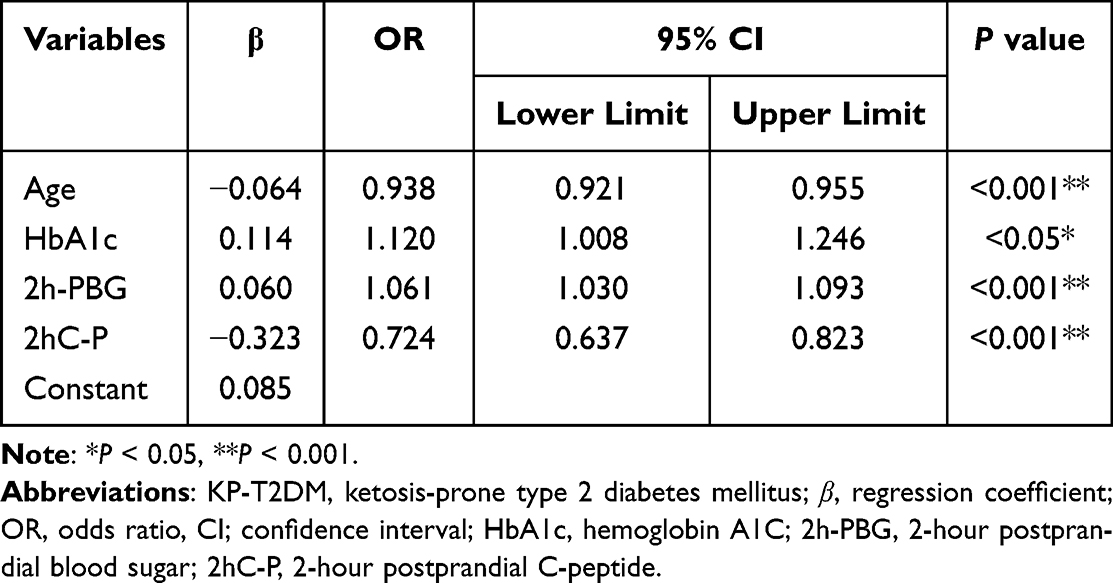 |
Table 3 Multivariate Logistic Analysis of Risk Prediction for KP-T2DM |
Establishing a Nomogram Predictive Model
All four predictors showed significant statistical differences; therefore, they were introduced to establish a predictive model, which was presented in the form of a nomogram. This transforms the predictive model into a visualization tool (Figure 3).
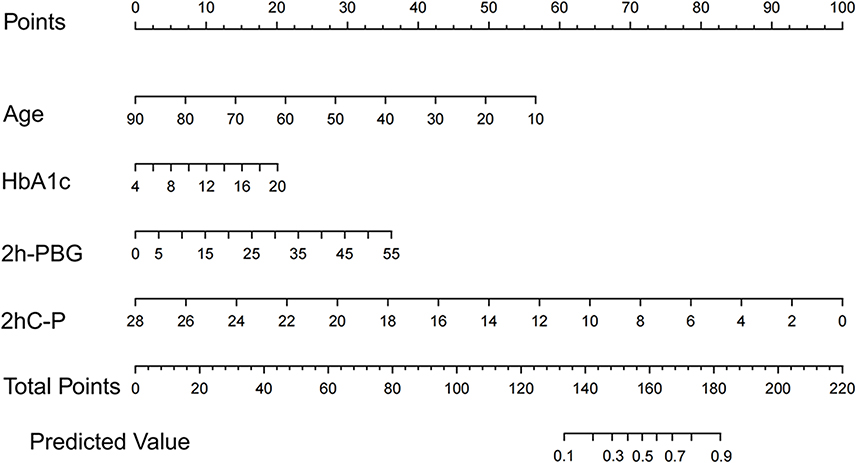 |
Figure 3 A nomogram risk prediction model based on four variables of HbA1c, 2h-PBG, 2hC-P and age. Abbreviations: HbA1c, hemoglobin A1C; 2h-PBG, 2-hour postprandial blood sugar; 2hC-P, 2-hour postprandial C-peptide. |
Validation of Predictive Model
We used ROC curves to evaluate the performance of predictive models.The area under the ROC curve for the training set was 0.8172 (95% CI: 0.7807 to 0.8536) (Figure 4a), and the area under the ROC curve for the validation set was 0.8084 (95% CI: 0.7503 to 0.8665) (Figure 4b), which indicates that the prediction model has good discriminative ability.
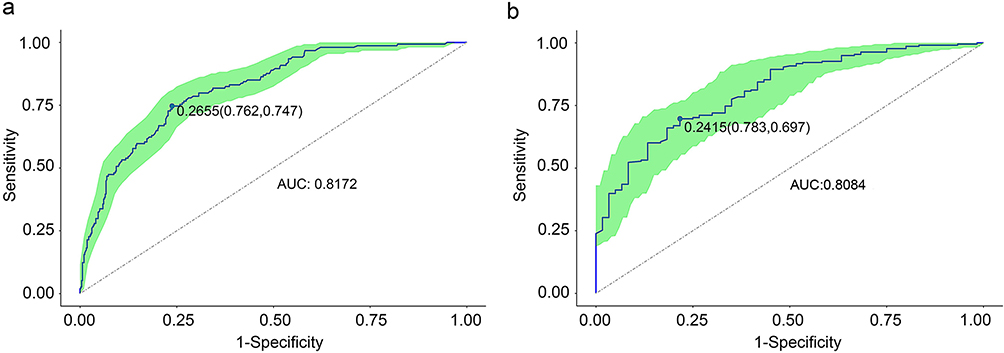 |
Figure 4 The ROC curve validation of the KP-T2DM risk nomogram prediction. Abbreviations: ROC, receiver operating characteristic; KP-T2DM, ketosis-prone type 2 diabetes mellitus; AUC, area under the curve. Notes: x-axis: the false positive rate for risk prediction (1-specificity), y-axis: the true positive rate for risk prediction (sensitivity). The curves in the green area represent the performance of the nomogram in the training set (a) and validation set (b). The AUC for the training set (a) and validation set (b) were 0.8172 and 0.8084, respectively. |
At the same time, the model was calibrated using the calibration curve plot and the Hosmer-Lemeshow test. The calibration curve shows that the prediction model fits well with the validation set. The Hosmer-Lemeshow test shows that the P value of the training set is 0.1584, and the P value of the validation set is 0.6191, which indicates that the predicted probability of the model is consistent with the actual probability and has a good degree of calibration (Figure 5).
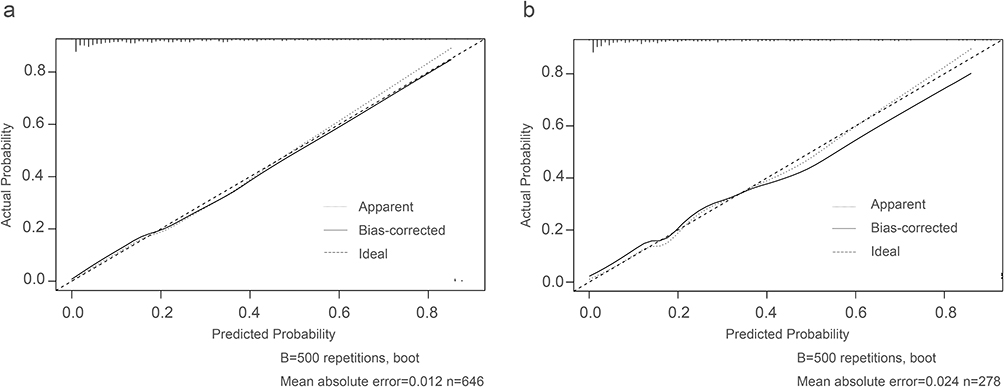 |
Figure 5 Calibration curves of the predictive KP-T2DM risk nomogram. Abbreviation: KP-T2DM, ketosis-prone type 2 diabetes mellitus. Notes: x-axis: the predicted risk of KP-T2DM,y-axis: the actual diagnosed cases of KP-T2DM. The diagonal dashed line shows the perfect prediction of the ideal model, and the solid line shows the fitting line of the predicted and measured incidence.The Hosmer-Lemeshow goodness-of-fit test showed that the P-value of the training set (a) was 0.1584, and the P-value of the validation set (b) was 0.6191, indicating that there was no statistical difference between the current model and the ideal perfect model. The model has good calibration. |
The DCA clinical decision analysis curve is shown in Figure 6. The DCA curve shows that when the threshold probability of the study subjects is 0.03–0.79, the net benefit level of applying the nomogram is significantly higher than that of the “no intervention” and “full intervention” programs, which suggests that the nomogram has good clinical applicability.
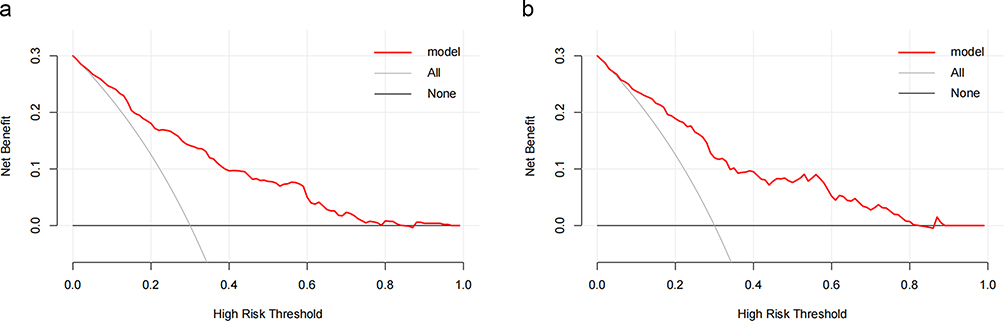 |
Figure 6 Decision curve analysis (DCA) for the KP-T2DM risk nomogram. Abbreviation: KP-T2DM, ketosis-prone type 2 diabetes mellitus. Notes: The y-axis is the net benefits. The black line indicates the hypothesis that all patients are free of KP-T2DM, the gray line indicates the hypothesis that all patients have KP-T2DM, and the red line indicates the prediction model. (a) the training set, (b) the validation set. |
Discussion
In this study, we included 21 variables by using relevant studies of KP-T2DM as evidence for screening variables and finally identified four indicators (HbA1c, 2h-PBG, 2hC-P, and age) for nomogram drawing (Figure 3). The effective sample size of the training set and the verification set was determined by the number of outcome events, and the split ratio was determined according to the 10 Events Per Variable (EPV) principle to ensure accuracy.13 According to the ratio of 7:3, the effective sample size of the training set was sufficient. Internal validation showed that the prediction performance and stability of the model were good and had clinical application value. At present, most studies have focused on the risk factors of KP-T2DM or the prediction model of DKA, and the prediction model of KP-T2DM, which is often overlooked, is lacking. Most previous risk factor analyses were based on the logistic regression analysis method. In this study, we used different statistical methods to identify the risk factors of KP-T2DM based on previous research to achieve a multivariate perspective to explain the purpose of this question. LASSO regression analysis chosen for this study is a method of simplifying high-dimensional data that can be used to analyze the best predictive risk factors for disease.14 In addition, this study aimed to establish a simple and effective model to predict the risk of KP-T2DM in a healthy Chinese population. Therefore, the research subjects that we selected were all newly diagnosed patients with diabetes, and traditional DKA risk factors, such as drugs, infection, and long course of disease, were excluded. The variables used in this model are indicators that are readily available in the clinic, and the research cost is low, which can be generalized.
Clinical Characteristics of KP-T2DM in China
We found that KP-T2DM accounted for 23.16% of patients with newly diagnosed T2DM in this study, which was lower than the 34.3% incidence of KP-T2DM in a cross-sectional study of newly diagnosed diabetes in China by Wang et al and 35% of the newly diagnosed patients with diabetes in Korea.3,15 The phenotype of KP-T2DM showed significant heterogeneity among different races. By comparing the two groups of patients with KP-T2DM and NKP-T2DM, we found that the majority of patients with KP-T2DM were young men, and they were often accompanied by overweight/obesity, severe lipid metabolism disorder, proteinuria, and low β-cell function at the onset. Seok et al also published this viewpoint in a study of Koreans, and found that during the 48-month follow-up period, the islet cell function of patients with KP-T2DM gradually recovered from the state of markedly impaired secretion at the onset to a state that could be removed from insulin therapy status.3 The first reported KPD cohort study in India showed that the phenotype of Indian patients with A-β+ KPD was different from that of Western patients because they were younger and slimmer. However, there are similarities in the male preponderance and natural history of recovery of β-cell dysfunction of both races, as in the Chinese population.7,8,16 Wang et al also showed that the prevalence of hypertension and metabolic syndrome in diabetic patients with ketosis onset was significantly higher than that in patients with T1DM, and that KP-T2DM may have a poor prognosis, which is also an important reason for us to pay attention to KP-T2DM.15
Association of Age and KP-T2DM
This study found that age was a risk factor for KP-T2DM, and the younger the age, the higher the risk of KP-T2DM. Previous studies have also found that patients with KP-T2DM have a younger average age of onset than patients with NKP-T2DM, and most of them are young.17,18 Zhang et al showed that the prevalence of KP-T2DM in Chinese patients with diabetes under the age < 35 years was 7.6%.11 This feature is similar to that observed in T1DM. For example, Hayek et al found that the risk of developing DKA was 1.35 times and 3.64 times higher in the age category of 20–29 years and in the adolescent group, respectively, than in patients with T1DM over the age of 30 years.19 Young patients with KP-T2DM are often associated with obesity and severe insulin resistance, which increases the sensitivity of β-cells to glucolipid toxicity, promotes β-cell apoptosis, and reduces mitochondrial β-oxidation of fatty acids, resulting in ketone bodies generated in the liver beyond tissue utilization to cause ketone body accumulation.20,21 Some scholars believe that the younger the age of patients with KP-T2DM who first developed DKA, the higher the risk of recurrence of DKA in the future.22
Association of HbA1c and KP-T2DM
In this study, we found higher levels of HbA1c in the KP-T2DM group using univariate logistic regression analysis, and subsequent LASSO regression analysis showed that HbA1c levels could serve as a predictor of KP-T2DM. HbA1c is an important indicator of the effect of blood sugar control, and ketosis is the result of severe blood sugar disturbances. The mean HbA1c of the KP-T2DM and the NKP-T2DM groups were 11.88% and 9.97%, respectively. High HbA1c levels indicated that patients with KP-T2DM had undetected hyperglycemia for a longer time on admission, which may be a reason for their increased susceptibility to severe acute hyperglycemic crisis. Zhu et al reported that HbA1c levels could be used to screen newly diagnosed patients with T2DM for ketosis, and their optimal threshold was 10.1%.23 Another study showed that patients with T1DM in Saudi Arabia with HbA1c levels of 8–9.9% and ≥ 10% had 1.77 and 4.06 times the risk of developing DKA, respectively, compared with those with HbA1c < 8%.19
Association of 2h-PBG and KP-T2DM
This study found that the 2h-PBG (OR = 1.061) was an independent risk factor for KP-T2DM. Compared with FBG, 2h-PBG is associated with higher mortality from diabetes-related cardiovascular disease in the DECODE (Diabetes Epidemiology: Collaborative analysis Of Diagnostic criteria in Europe) study, highlighting the need to pay attention to the risk of postprandial hyperglycemia.24 Postprandial hyperglycemia can damage β-cell function, reduce insulin secretion, and accelerate β cell failure. However, it also increases the production of glycation products, resulting in a state of oxidative stress and an increase in the production of inflammatory mediators, which manifests as an inflammatory state.25,26 In addition, osmotic diuresis caused by hyperglycemia can lead to dehydration, resulting in hemoconcentration and hypovolemia which lead to a decrease in the glomerular filtration rate. As the excretion of urine sugar and ketones decreases, ketosis is induced, which may further aggravate hyperglycemia and ketosis, forming a vicious circle.
Association of 2hC-P and KP-T2DM
Because C-peptide is highly stable and unaffected by exogenous insulin, it is often used to assess the ability of β-cells to secrete insulin. The baseline data of this study showed that patients with KP-T2DM had lower levels of FC-P and 2hC-P than patients with NKP-T2DM, suggesting that patients with KP-T2DM had poorer β-cell function at the time of onset. Impairment of islet cell function by hyperglycemia is one of the reasons for the low levels of C-peptide in patients with KP-T2DM. Previous studies have also shown that the function of pancreatic β cells is significantly reduced as blood sugar levels rise.27 Waddankeri et al believed that with the remission of ketosis, the islet β-cell function of patients with KP-T2DM gradually recovered, and C-peptide also recovered to a certain extent.28 Riddhi et al analyzed the characteristics of β-cell recovery in new-onset A-β+ KPD patients with coronavirus disease 2019 and found that fasting and stimulated C-peptide levels that were significantly suppressed at baseline in the KPD group gradually peaked over 10 months; a younger age, lower BMI, DKA, and inflammation were associated with poorer recovery of β-cell function.29
Limitations
KP-T2DM is rarely considered a diagnosis clinically and its incidence is far underestimated. This oversight has important clinical implications because it increases the risk of DKA. The diagnosis of KP-T2DM is mainly based on clinical parameters, which are widely used by Chinese clinicians in patients with first hyperglycemic crisis. Therefore, this diagnostic model has high clinical application value. This study still had several limitations. First, this was a single-center retrospective study with internal validation, which could diluted the validity of the results. In the future, a larger sample size, multi-center external verification, and the use of multiple model construction methods are needed to compare the model’s advantages and disadvantages and improve and enhance the predictive performance of the model. Second, the sample size of this study was limited and no subgroup exploratory analysis was performed. Third, due to the lack of data on blood ketone bodies, this study only used urine ketone bodies as the standard for diagnosing ketosis, and urine ketone bodies are affected by various factors such as diet and specimen collection, which may result in false-positives or false-negatives. Finally, the clinical variables used in this model were limited, and more variables related to the onset of ketosis deserve further exploration.
Conclusion
The nomogram established by this model using the four predictors—HbA1c, 2h-PBG, 2hC-P, and age—can help medical workers identify KP-T2DM high-risk groups and conduct early intervention. The constructed model had an excellent area under the ROC curve, sensitivity, specificity, and other indicators, and the prediction performance was good.
Data Sharing Statement
The original data used to support the findings of this study have been deposited in the [figshare] repository ([DOI:10.6084/m9.figshare.21304983]).
Acknowledgments
We thank the Clinical Research Center of the Second Affiliated Hospital of Nanchang University for data support and all patients who participated in this study. Furthermore, we thank all the authors involved in this study for their great contributions. All the coauthors have read and approved the final article.
Author Contributions
All authors made a significant contribution to the work reported, whether that is in the conception, study design, execution, acquisition of data, analysis and interpretation, or in all these areas; took part in drafting, revising or critically reviewing the article; gave final approval of the version to be published; have agreed on the journal to which the article has been submitted; and agree to be accountable for all aspects of the work.
Funding
This work was supported by grants from the National Natural Science Foundation of China (82060160).
Disclosure
The authors report no conflicts of interest in this work.
References
1. Lontchi-Yimagou E, Nguewa JL, Assah F, et al. Ketosis-prone atypical diabetes in Cameroonian people with hyperglycaemic crisis: frequency, clinical and metabolic phenotypes. Diabet Med. 2017;34(3):426–431. doi:10.1111/dme.13264
2. Balasubramanyam A. Syndromes of ketosis-prone diabetes. Trans Am Clin Climatol Assoc. 2019;130:145–155.
3. Seok H, Jung CH, Kim SW, et al. Clinical characteristics and insulin Independence of Koreans with new-onset type 2 diabetes presenting with diabetic ketoacidosis. Diabetes Metab Res Rev. 2013;29(6):507–513. doi:10.1002/dmrr.2421
4. Elkituni A, Elshwekh H, Bendala NM, et al. Profile of diabetic ketoacidosis at the national diabetes and endocrine center in Tripoli, Libya, 2015. Diabetes Metab Syndr. 2021;15(3):771–775. doi:10.1016/j.dsx.2021.03.014
5. Mekonnen GA, Gelaye KA, Gebreyohannes EA, et al. Treatment outcomes of diabetic ketoacidosis among diabetes patients in Ethiopia. Hospital-based study. PLoS One. 2022;17(4):0264626. doi:10.1371/journal.pone.0264626
6. Xie XJ, Hu Y, Cheng C, et al. Should diabetic ketosis without acidosis be included in ketosis-prone type 2 diabetes mellitus? Diabetes Metab Res Rev. 2014;30(1):54–59. doi:10.1002/dmrr.2448
7. Mauvais-Jarvis F, Sobngwi E, Porcher R, et al. Ketosis-prone type 2 diabetes in patients of sub-Saharan African origin: clinical pathophysiology and natural history of beta-cell dysfunction and insulin resistance. Diabetes. 2004;53(3):645–653. doi:10.2337/diabetes.53.3.645
8. Umpierrez GE, Casals MM, Gebhart SP, et al. Diabetic ketoacidosis in obese African-Americans. Diabetes. 1995;44(7):790–795. doi:10.2337/diab.44.7.790
9. Umpierrez GE, Smiley D, Kitabchi AE. Narrative review: ketosis-prone type 2 diabetes mellitus. Ann Intern Med. 2006;144(5):350–357. doi:10.7326/0003-4819-144-5-200603070-00011
10. Aizawa T, Katakura M, Taguchi N, et al. Ketoacidosis-onset noninsulin dependent diabetes in Japanese subjects. Am J Med Sci. 1995;310(5):198–201. doi:10.1097/00000441-199511000-00004
11. Zhang M, Li Y, Cui W, et al. The clinical and metabolic characteristics of young-onset ketosis-prone type 2 diabetes in China. Endocr Pract. 2015;21(12):1364–1371. doi:10.4158/EP15778
12. Li Y, Teng D, Shi X, et al. Prevalence of diabetes recorded in mainland China using 2018 diagnostic criteria from the American Diabetes Association: national cross sectional study. BMJ. 2020;28(369). doi:10.1136/bmj.m997
13. Peduzzi P, Concato J, Kemper E, et al. A simulation study of the number of events per variable in logistic regression analysis. J Clin Epidemiol. 1996;49(12):1373–1379. doi:10.1016/s0895-4356(96)00236-3
14. Pi L, Halabi S. Combined performance of screening and variable selection methods in ultra-high dimensional data in predicting time-to-event outcomes. Diagn Progn Res. 2018;2(21):018–0043. doi:10.1186/s41512-018-0043-4
15. Wang JW, Wang AP, Chen MY, et al. Prevalence and clinical characteristics of hypertension and metabolic syndrome in newly diagnosed patients with ketosis-onset diabetes: a cross-sectional study. Diabetol Metab Syndr. 2019;11(31):019–0426. doi:10.1186/s13098-019-0426-x
16. Gupta RD, Ramachandran R, Gangadhara P, et al. Clinical characteristics, beta-cell dysfunction and treatment outcomes in patients with A-β+ Ketosis-Prone Diabetes (KPD): the first identified cohort amongst Asian Indians. J Diabetes Complications. 2017;31(9):1401–1407. doi:10.1016/j.jdiacomp.2017.06.008
17. Wang J, Zhang M, Liu Z, et al. Heterogeneous clinical features of ketosis-prone type 2 diabetes mellitus patients: gender, age, loss of weight and HbA1c. Minerva Endocrinol. 2019;44(4):351–356. doi:10.23736/S0391-1977.18.02925-5
18. Xiong X, Wei L, Xiao Y, et al. Effects of family history of diabetes on pancreatic β-cell function and diabetic ketoacidosis in newly diagnosed patients with type 2 diabetes: a cross-sectional study in China. BMJ Open. 2021;11(1):2020–041072. doi:10.1136/bmjopen-2020-041072
19. Al Hayek AA, Robert AA, Al-Shaikh R, et al. Factors associated with the presence of diabetic ketoacidosis: a retrospective analysis of patients with type 1 diabetes in Saudi Arabia. Diabetes Metab Syndr. 2020;14(6):2117–2122. doi:10.1016/j.dsx.2020.11.002
20. Ye S, Ran H, Zhang H, et al. Elevated serum triglycerides are associated with ketosis-prone type 2 diabetes in young individuals. Diabetes Metab Syndr Obes. 2021;14:497–504. doi:10.2147/DMSO.S296085
21. Du S, Zhang H, Wu H, et al. Prevalence and gender differences of metabolic syndrome in young ketosis-prone type 2 diabetic individuals: a retrospective study. Diabetes Metab Syndr Obes. 2020;13:2719–2727. doi:10.2147/DMSO.S252492
22. Bradford AL, Crider CC, Xu X, et al. Predictors of recurrent hospital admission for patients presenting with diabetic ketoacidosis and hyperglycemic hyperosmolar state. J Clin Med Res. 2017;9(1):35–39. doi:10.14740/jocmr2792w
23. Zhu B, Bu L, Zhang M, et al. HbA1c as a screening tool for ketosis in patients with type 2 diabetes mellitus. Sci Rep. 2016;6(39687). doi:10.1038/srep39687
24. Gao W, Qiao Q, Tuomilehto J. Post-challenge hyperglycaemia rather than fasting hyperglycaemia is an independent risk factor of cardiovascular disease events. Clin Lab. 2004;50(9–10):609–615.
25. Ceriello A, Genovese S. Atherogenicity of postprandial hyperglycemia and lipotoxicity. Rev Endocr Metab Disord. 2016;17(1):111–116. doi:10.1007/s11154-016-9341-8
26. Darenskaya MA, Kolesnikova LI, Kolesnikov SI. Oxidative stress: pathogenetic role in diabetes mellitus and its complications and therapeutic approaches to correction. Bull Exp Biol Med. 2021;171(2):179–189. doi:10.1007/s10517-021-05191-7
27. Cernea S, Dobreanu M. Diabetes and beta cell function: from mechanisms to evaluation and clinical implications. Biochem Med. 2013;23(3):266–280. doi:10.11613/bm.2013.033
28. Waddankeri SS, Swaraj Waddankeri M, Gurushantappa Mangshetty B. Clinical and biochemical characteristics and treatment outcomes of ketosis-prone diabetes: the remission prone diabetes. Int J Endocrinol Metab. 2021;19(2):106799. doi:10.5812/ijem.106799
29. Gupta RD, Atri A, Mondal S, et al. Characterizing progressive beta-cell recovery after new-onset DKA in COVID-19 provoked A-β+ KPD (ketosis-prone diabetes): a prospective study from Eastern India. J Diabetes Complications. 2022;36(3):108100. doi:10.1016/j.jdiacomp.2021.108100
 © 2023 The Author(s). This work is published and licensed by Dove Medical Press Limited. The
full terms of this license are available at https://www.dovepress.com/terms
and incorporate the Creative Commons Attribution
- Non Commercial (unported, 3.0) License.
By accessing the work you hereby accept the Terms. Non-commercial uses of the work are permitted
without any further permission from Dove Medical Press Limited, provided the work is properly
attributed. For permission for commercial use of this work, please see paragraphs 4.2 and 5 of our Terms.
© 2023 The Author(s). This work is published and licensed by Dove Medical Press Limited. The
full terms of this license are available at https://www.dovepress.com/terms
and incorporate the Creative Commons Attribution
- Non Commercial (unported, 3.0) License.
By accessing the work you hereby accept the Terms. Non-commercial uses of the work are permitted
without any further permission from Dove Medical Press Limited, provided the work is properly
attributed. For permission for commercial use of this work, please see paragraphs 4.2 and 5 of our Terms.
Recommended articles
Predicting the Risk of Unplanned Readmission at 30 Days After PCI: Development and Validation of a New Predictive Nomogram
Xu W, Tu H, Xiong X, Peng Y, Cheng T
Clinical Interventions in Aging 2022, 17:1013-1023
Published Date: 5 July 2022
Development and Validation of a Nomogram for Predicting 28-Day Mortality on Admission in Elderly Patients with Severe Community-Acquired Pneumonia
Song Y, Wang X, Lang K, Wei T, Luo J, Song Y, Yang D
Journal of Inflammation Research 2022, 15:4149-4158
Published Date: 21 July 2022
Development and Validation of a Prediction Model for Chronic Post-Surgical Pain After Thoracic Surgery in Elderly Patients: A Retrospective Cohort Study
Wu XD, Zeng FF, Yu XX, Yang PP, Wu JP, Xv P, Wang HT, Pei YM
Journal of Pain Research 2022, 15:3079-3091
Published Date: 29 September 2022
An Easy-to-Use Nomogram Based on SII and SIRI to Predict in-Hospital Mortality Risk in Elderly Patients with Acute Myocardial Infarction
Chen Y, Xie K, Han Y, Xu Q, Zhao X
Journal of Inflammation Research 2023, 16:4061-4071
Published Date: 13 September 2023
Risk Factors for Granulomatous Mastitis and Establishment and Validation of a Clinical Prediction Model (Nomogram)
Zeng Y, Zhang D, Fu N, Zhao W, Huang Q, Cui J, Chen Y, Liu Z, Zhang X, Zhang S, Mansoor KM
Risk Management and Healthcare Policy 2023, 16:2209-2222
Published Date: 20 October 2023