Back to Journals » Cancer Management and Research » Volume 13
Development and Validation of a Prognostic Model of RNA-Binding Proteins in Colon Adenocarcinoma: A Study Based on TCGA and GEO Databases
Received 26 July 2021
Accepted for publication 20 September 2021
Published 8 October 2021 Volume 2021:13 Pages 7709—7722
DOI https://doi.org/10.2147/CMAR.S330434
Checked for plagiarism Yes
Review by Single anonymous peer review
Peer reviewer comments 4
Editor who approved publication: Dr Chien-Feng Li
Dandan Zhu,1,2,* Jierong Chen,2,* Tieying Hou1,2
1School of Medicine, South China University of Technology, Guangzhou, Guangdong, 510006, People’s Republic of China; 2Department of Laboratory Medicine, Guangdong Provincial People’s Hospital, Guangdong Academy of Medical Sciences, Guangzhou, Guangdong, 510080, People’s Republic of China
*These authors contributed equally to this work
Correspondence: Tieying Hou
Department of Laboratory Medicine, Guangdong Provincial People’s Hospital, Guangdong Academy of Medical Sciences, Guangzhou, Guangdong, 510080, People’s Republic of China
Email [email protected]
Background: Previous studies reported that dysregulation of RNA-binding proteins (RBPs) is significantly associated with the development of cancer. However, there are few studies to date on the role of RBPs in colon adenocarcinoma (COAD).
Methods: RNA sequencing and clinical data for COAD patients were downloaded from The Cancer Genome Atlas (TCGA) database to identify differentially expressed (DE) RBPs between COAD tissue and normal colon tissue, and then the expression and prognostic significance of these RBPs were investigated in detail by systematic bioinformatics analysis. qRT-PCR was used to validate the expressions of prognosis-related RBP-encoding genes.
Results: Seven RBPs (RPL10L, ERI1, POP1, CAPRIN2, TDRD7, SNIP1 and PPARGC1A) were identified as hub genes associated with prognosis by a series of regression analyses, and were then used to construct a prognostic model. Further analysis based on this model indicated that the overall survival (OS) of the high-risk groups was lower than that of the low-risk groups. In this prognostic model, the area under the ROC curve (AUC) was 0.694, 0.709 and 0.665 for the TCGA cohort at 1, 3 and 5 years, respectively, while the AUC was 0.671, 0.633 and 0.601 for the GEO combined cohort at 1, 3 and 5 years, respectively, indicating the good predictive ability of the model. We also built a nomogram based on the 7 RBPs in the TCGA cohort, and the model showed good discriminatory ability for COAD.
Conclusion: We screened seven prognosis-related genes in COAD patients based on RBP-related genes, validated the expressions of the seven prognosis-related RBP-encoding genes by qRT-PCR and constructed a prognosis-related nomogram for patients with COAD.
Keywords: colon adenocarcinoma, RNA binding proteins, overall survival, prognostic model, bioinformatics, qRT-PCR
Introduction
Colon adenocarcinoma (COAD) is one of the leading causes of cancer morbidity and mortality worldwide. It is the third and second most prevalent cancer among men and women, respectively.1 Although the survival rate of patients with COAD has improved due to advances in surgical techniques,2 the prognosis of elderly colon cancer patients remains poor due to the increased risk of postoperative complications and postoperative mortality.3 Therefore, to elucidate more effective therapeutic strategies, it is critical to clarify the molecular mechanisms of COAD pathogenesis and progression.
RNA-binding proteins (RBPs) are proteins that bind to various RNAs, such as rRNA, miRNA, snRNA, ncRNA, mRNA, snoRNA and tRNA. To date, more than 1500 RBP-encoding genes have been experimentally validated in the human genome.4 RBPs play a key role in RNA processing by mediating posttranscriptional regulation; for example, these proteins can regulate mRNA stability, localization, variable splicing, polyadenylation and translation efficiency.5 Posttranscriptional regulation is essential in life processes. Dysregulated RBP expression is associated with many human diseases.5,6 RBPs have been reported to contribute to the development and progression of cardiovascular disease through their involvement in posttranscriptional regulation.7 Some studies have reported that RBPs are expressed in various cancers, which affects mRNA-to-protein translation and is involved in carcinogenesis.8,9 Currently, there are only a few reports on the critical role of RBPs in cancer development and progression.10–13 Therefore, a comprehensive analysis is necessary to further understand the function and role of RBPs in cancer.
In the present study, we performed a detailed analysis based on RNA expression sequences and the corresponding clinical data of COAD downloaded from The Cancer Genome Atlas (TCGA) and Gene Expression Omnibus (GEO) databases. We also screened prognosis-related gene signatures by applying consensus clustering analysis, least absolute shrinkage selection operator (LASSO) regression analysis and Cox regression analysis. Moreover, we developed a prognostic model to predict the prognosis of colon adenocarcinoma and its therapeutic targets.
Materials and Methods
Data Collection and Preprocessing
We obtained RNA sequence information for 473 COAD and 41 normal colon tissues and the clinical information of the corresponding patients from the TCGA database as a training set. We performed differential analysis using the R package “limma” and the Wilcox test to identify differentially expressed (DE) RBPs between COAD and normal colon tissues. The threshold values were| log2 fold change (FC)| ≥ 0.5 and adj P value < 0.05.
GO and KEGG Pathway Enrichment Analysis of the DE RBPs
GO analysis consists of 3 main components: biological processes (BPs), cellular components (CCs), and molecular functions (MFs).14 KEGG analysis provides a biological interpretation of genomic sequences and other high-throughput data.15 We used the R package “clusterProfiler” for GO and KEGG enrichment analysis of the DE RBPs, and set significance thresholds of P and false discovery rate (FDR) less than 0.05.
Protein-Protein Interaction (PPI) Network Construction and Module Acquisition
We investigated the interactions between the associated proteins of these DE RBPs in the Search Tool for the Retrieval of Interacting Genes/Proteins (STRING) database.16 Then, Cytoscape (version 3.7.2) was used to construct the PPI networks.17 Moreover, we used the Cytoscape plugin Molecular Complexity Detection (MCODE) to obtain the more important modules in the PPI networks.
Identification of Prognosis-Related RBPs
We performed univariate Cox regression analysis to identify prognosis-related RBPs among DE RBPs using the R package “survival”, followed by LASSO regression analysis with a P value < 0.01. We used the R package “glmnet” to screen for prognosis-related RBP-encoding genes. After that, we performed multivariate Cox regression analysis to screen the best RBP-encoding genes associated with prognosis and obtained their standardized regression coefficients. In addition, risk scores were calculated by the following formula: risk score = expression of gene 1 × coefficient of gene 1 + expression of gene 2 × coefficient of gene 2 + … expression of gene N × coefficient of gene N.18,19 Based on median risk scores, we divided all COAD patients into high-risk and low-risk groups. The difference in survival between the two groups was then analyzed by the R package “survival” using Kaplan-Meier curve analysis and Log rank test. In addition, receiver operating characteristic (ROC) curves were plotted and the area under the curve (AUC) values were calculated for 1, 3, and 5 years using the R package “survival ROC” to assess predictive ability.20
Internal and External Validation of Prognosis-Related RBPs
We first performed internal validation by first randomly dividing the COAD samples within the TCGA database into two equal numbers, one as a training cohort and the other as a validation cohort. In addition, we further validated the prognosis-related RBPs by combining the GSE17538, GSE39084, GSE39582, and GSE103479 datasets from the GEO database into one dataset as an external validation cohort. Inclusion criteria for the GEO database dataset were a sample size greater than 50 and complete survival and clinicopathological data, including overall time, survival status, age, sex, and tumor stage. We then used the same formula as above to calculate the risk score for each COAD patient.
Establishment of the RBP Nomogram
According to the results of the multivariate Cox analysis, we used the R package “rms” to predict overall survival (OS) in the TCGA cohort of COAD patients at 1, 3 and 5 years, and based on this, we generated a prognostic nomogram of prognosis-related RBP-encoding genes and plotted calibration curves to assess the prognostic performance of the nomogram.
Verification of Expression Level and Prognostic Significance
We examined the expression of hub RBPs at the translational level with the Human Protein Atlas (HPA) online data.21 To demonstrate the relationship between DERBPs and OS, we plotted Kaplan-Meier survival curves. Finally, we performed the Log rank test to test the significance of the difference between the two groups.
Cell Lines and Cell Culture
COAD cell lines SW480, RKO, HCT116, HCT-15, DLD-1, HT-29, HCT-8 cells and human colonic epithelial cell (NCM460) were purchased from ATCC (American Type Culture Collection, Manassas, VA, USA). All COAD cell lines were cultured in Dulbecco’s Modified Eagle’s Medium (DMEM, Gibco) supplemented with 10% fetal bovine serum (FBS, Gibco), 100 U/mL penicillin, and 100 μg/mL streptomycin at 37 °C in 5% CO2.
RNA Extraction and Quantitative Real-Time PCR (qRT-PCR)
Total RNAs were extracted from cell lines with TRizol Reagent (Invitrogen). Total RNAs were reversely transcribed into cDNAs with PrimeScript RT Master Mix (Takara) and then used to perform quantitative real-time PCR (qRT-PCR) with SYBR qPCR Master Mix (Vazyme). GAPDH was used as an internal control for gene quantification. The 2−ΔCT was calculated for every sample and normalized to GAPDH. The primer sequences used were shown in Table 1.
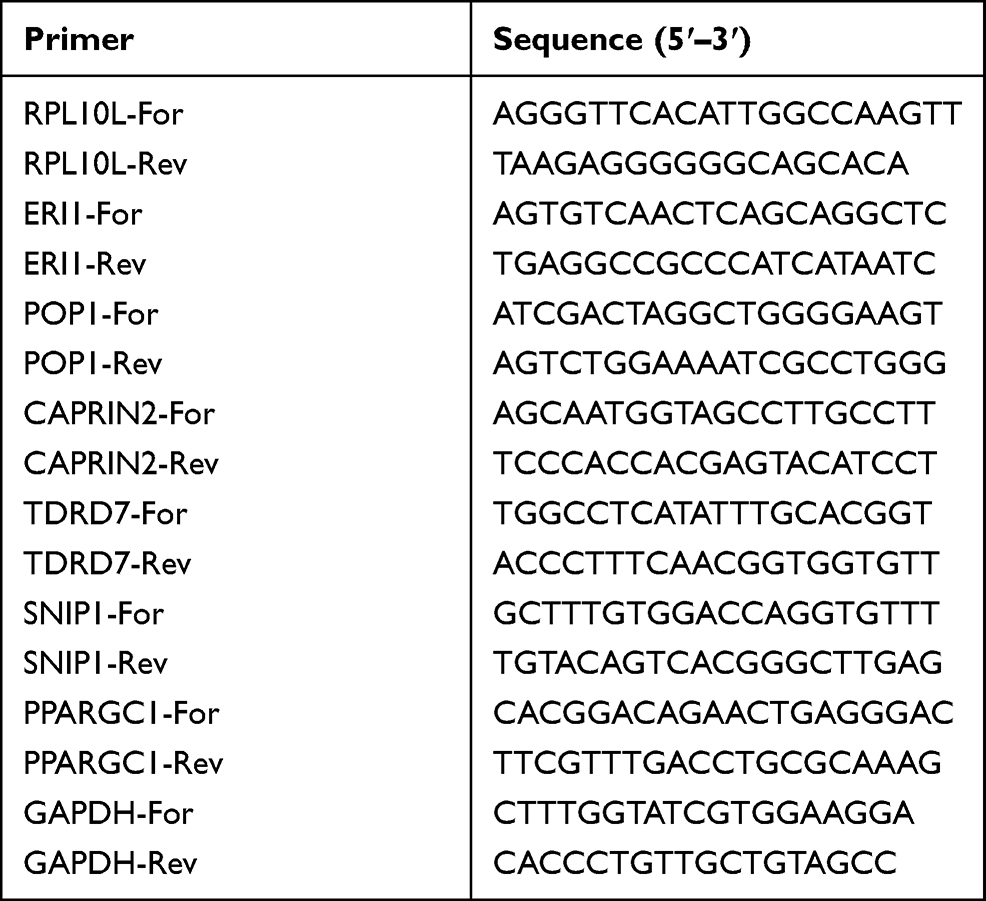 |
Table 1 Primer Sequences Used in the qRT-PCR Assay |
Results
DE RBPs Screening
We screened 496 DE RBPs, including 346 upregulated RBPs and 150 downregulated RBPs, between COAD tissues and normal colon tissues by using the R package “limma” and the Wilcox test. The heat map and volcano plot are shown in Figure 1.
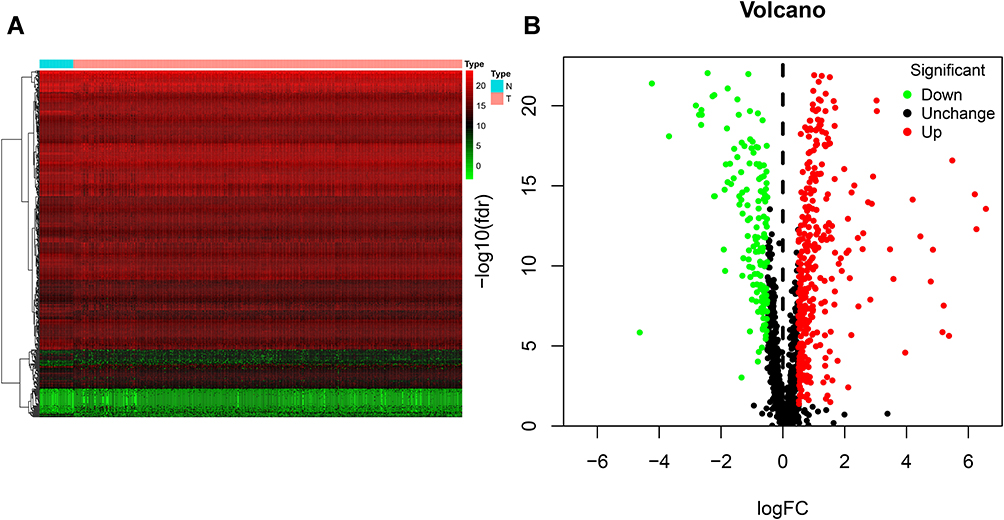 |
Figure 1 Identification of differentially expressed RNA-binding proteins (DE RBPs) in The Cancer Genome Atlas (TCGA) dataset. (A) Heat map of the DE RBPs based on their log2-transformed fragments per kilobase of transcript per million mapped reads (FPKM) expression values. Red represents high expression, and green represents low expression. (B) Volcano plot of DE RBPs between colon adenocarcinoma (COAD) and normal colon tissue; 208 were upregulated, and 122 were downregulated. Red: upregulated RBPs; black: unchanged RBPs; green: downregulated RBPs. |
GO and KEGG Pathway Enrichment Analysis of the DE RBPs
With the R package “clusterProfiler”, we performed GO and KEGG pathway enrichment analysis of the DE RBPs in COAD. The DE RBPs were significantly enriched in ncRNA processing, ribosome biogenesis, RNA catabolic processes, and RNA splicing in the BP analysis; cytoplasmic ribonucleoprotein granule, ribonucleoprotein granule, ribosome and spliceosomal complex in the CC analysis; and catalytic activity, acting on RNA, nuclease activity, ribonuclease activity and mRNA 3ʹ-untranslated region (-UTR) binding in the MF analysis (Figure 2A). According to the KEGG analysis, DE RBPs were significantly enriched in pathways related to RNA transport and degradation, mRNA monitoring, spliceosomes, ribosomes, ribosome biogenesis in eukaryotes, and coronavirus disease-COVID-19 (Figure 2B).
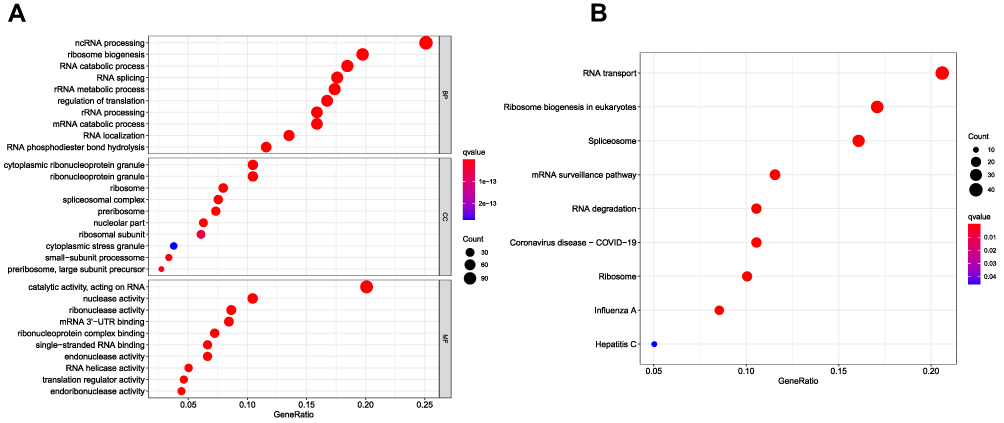 |
Figure 2 Gene ontology (GO) and Kyoto Encyclopedia of Genes and Genomes (KEGG) analysis of differentially expressed RBPs (DE RBPs). (A) Bubble plot of enriched GO terms. (B) Bubble plot of enriched KEGG pathways. |
PPI Network Construction and Key Modules Selection
We established a PPI network using Cytoscape software based on the data in the STRING database; the network, included 481 nodes and 8223 edges (Figure 3A). We used the MODE tool to screen the key modules and obtained the most significant modules, which consisted of 69 nodes and 2279 edges (Figure 3B).
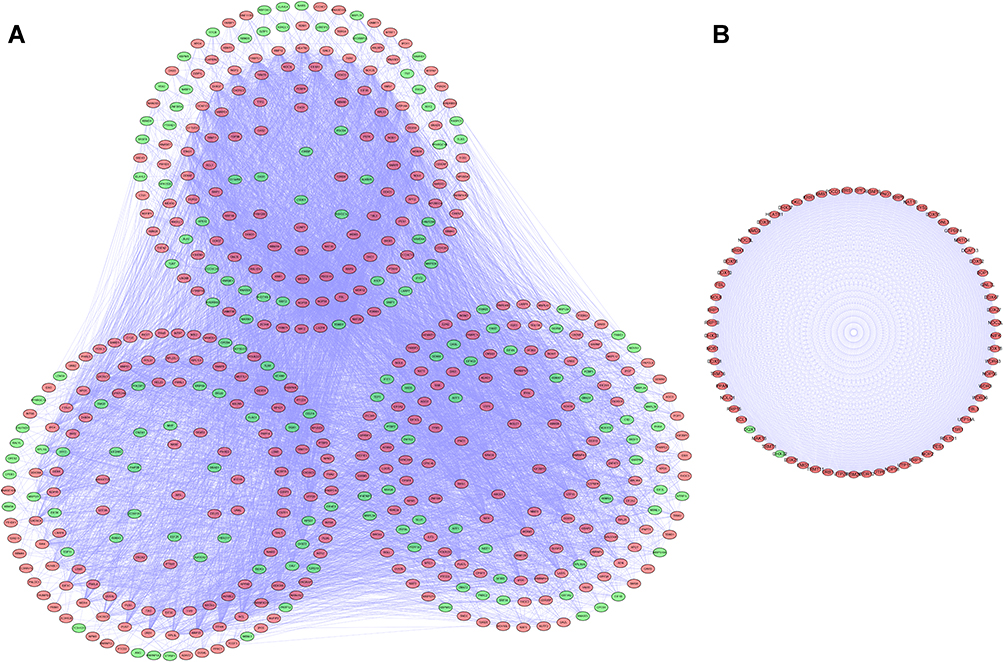 |
Figure 3 Protein-protein interaction (PPI) network and modules analysis. (A) PPI network for differentially expressed RBPs (DE RBPs). (B) Key module 1 in the PPI network. |
Selection of Prognosis-Related RBPs
We identified 481 DE RBPs from the PPI network in the TCGA cohort. We performed univariate Cox regression analysis to investigate the prognostic significance of these DE RBPs and obtained 11 hub RBPs associated with prognosis (Figure 4A). Subsequently, we analyzed these 11 prognostically relevant pivotal candidate RBPs by LASSO regression analysis (Figure 4B and C) and multivariate Cox regression analysis and found that seven pivotal RBPs were independent predictors of prognosis in COAD patients (Figure 4D).
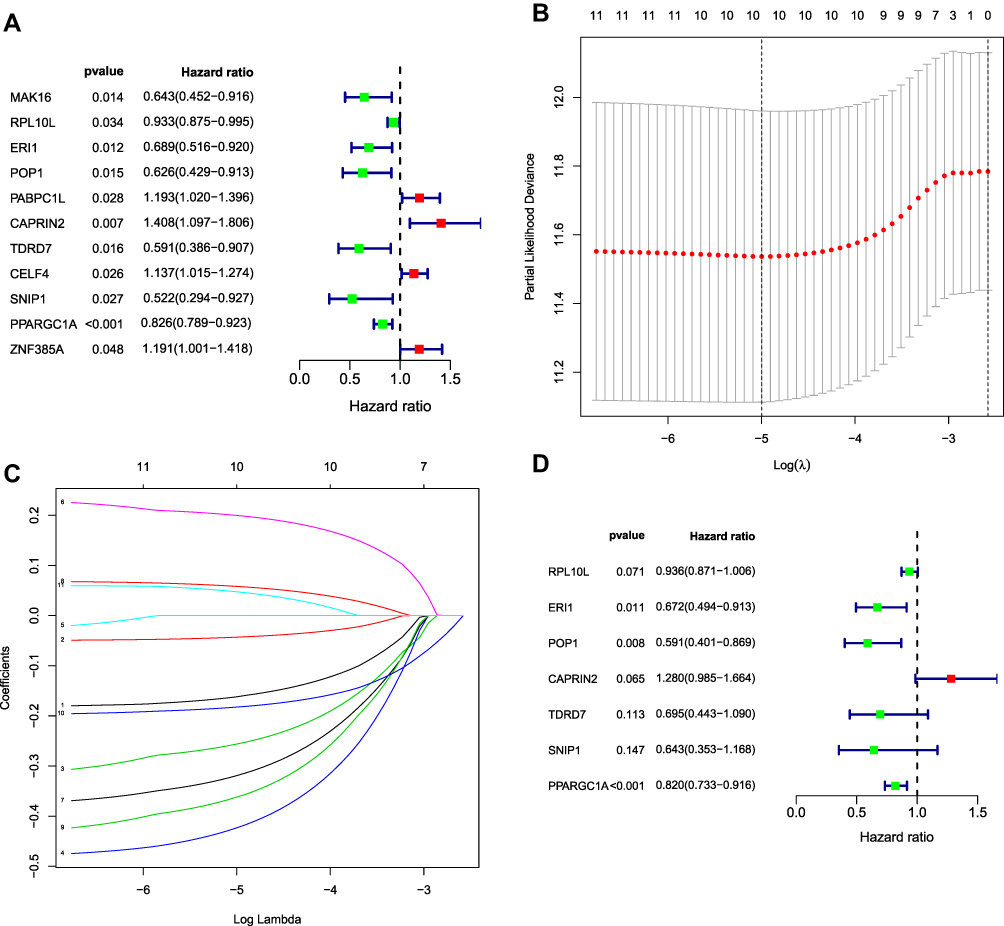 |
Figure 4 Selection of prognosis-related RBPs in the training cohort. (A) Univariate Cox regression analysis. (B and C) Least absolute shrinkage and selection operator (LASSO) regression analysis. (D) Multivariate Cox regression analysis to screen out the key RNA-binding proteins (RBPs) most relevant to prognosis. |
Construction of the RBP-Related Risk Score Model
We developed a risk score model based on seven previously obtained key RBP-encoding genes that are associated with prognosis and calculated the risk score for each COAD patient using the following formula: risk score = (−0.066 × RPL10L Exp) + (−0.39811 × ERI1 Exp) + (−0.52662 × POP1 Exp) + (0.247129 × CAPRIN2 Exp) + (−0.36382 ×TDRD7 Exp) + (−0.44221× SNIP1 Exp) + (−0.19892×PPARGC1A Exp). Of the 7 RBPs screened for prognostic relevance, CAPRIN2 was a risk factor (HR>1), while RPL10L, ERI1, POP1, TDRD7, SNIP1 and PPARGC1A were protective factors (HR < 1) (Table 2). We divided the 446 COAD patients into a high-risk group (n = 223) and a low-risk group (n = 223) according to the median risk score of the training cohort. Survival analysis revealed significantly longer OS in the low-risk group than in the high-risk group (p = 6.673e-08) (Figure 5A). We performed a time-dependent ROC analysis to assess the prognostic ability of seven RBP biomarkers. The AUCs of this RBP risk score model for 1, 3 and 5 years were 0.694, 0.709 and 0.665, respectively. (Figure 5B), indicating moderate diagnostic performance. For the low-risk and high-risk groups, we also show expression heat maps, patient survival status, and risk scores for the signature consisting of seven RBPs (Figure 5C). In addition, we used the same formula for the TCGA internal dataset and the GEO external validation dataset to build predictive models to assess whether these 7 RBPs have prognostic value in the TCGA database (Supplementary Figures 1 and 2) and other COAD patient cohorts (Figure 6). The results of the above analysis are similar to those of the TCGA external training cohort analysis. The above results indicate that the prognostic model we developed has good sensitivity and specificity.
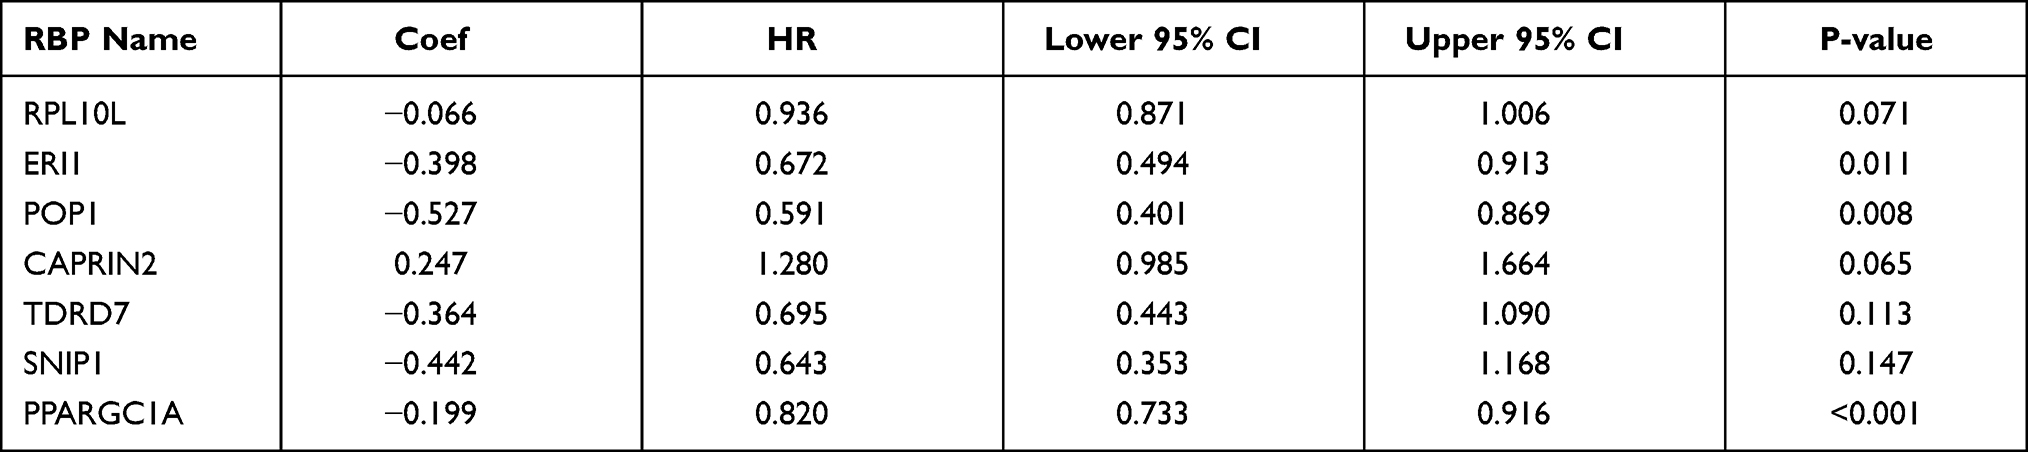 |
Table 2 Seven Prognosis-Associated Hub RNA-Binding Proteins (RBPs) Identified by Multivariate Cox Regression Analysis |
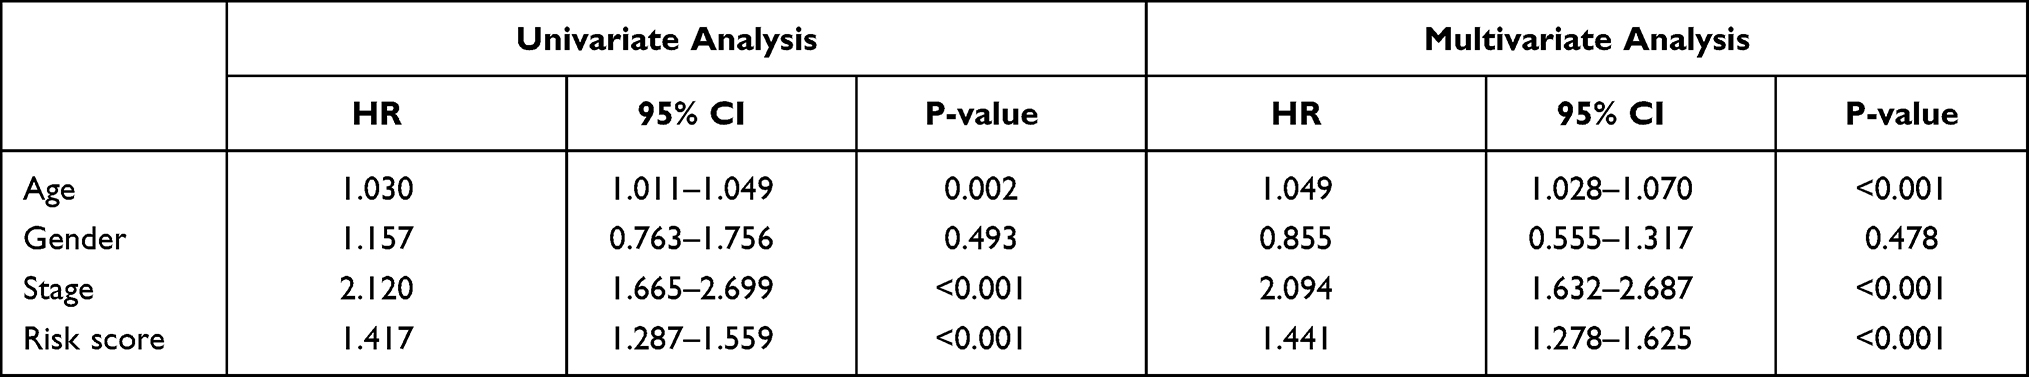 |
Table 3 The Prognostic Value of Different Clinical Parameters in the Cancer Genome Atlas (TCGA) Cohort |
 |
Figure 5 Risk score analysis of the seven-gene prognostic model in The Cancer Genome Atlas (TCGA) cohort. (A) Survival curve for low-risk and high-risk groups. (B) Receiver operating characteristic (ROC) curves for predicting overall survival (OS) based on the risk score. (C) Expression heat map, risk score distribution, and survival status. |
 |
Figure 6 Risk score analysis of the eight-gene prognostic model in the GEO database combined cohort. (A) Survival curve for low-risk and high-risk groups. (B) Receiver operating characteristic (ROC) curves for predicting overall survival (OS) based on the risk score. (C) Expression heat map, risk score distribution, and survival status. |
Relationship Between Clinical Features and the Seven Prognosis-Related RBP-Encoding Genes
We performed univariate, LASSO regression and multivariate Cox regression analyses of clinical characteristics in the training and testing sets. Age (p < 0.001), tumor stage (p = 0.013) and risk score (p < 0.001) were found to be independent prognostic indicators in the TCGA cohort (Table 3), while age (p < 0.001), tumor stage (p < 0.001) and risk score (p < 0.001) were independent prognostic indicators in the GEO database combined cohort (Table 4). Moreover, results from the TCGA internal training and validation cohorts also showed that age, tumor stage, and risk score were independent prognostic factors (Supplementary Tables 1 and 2).
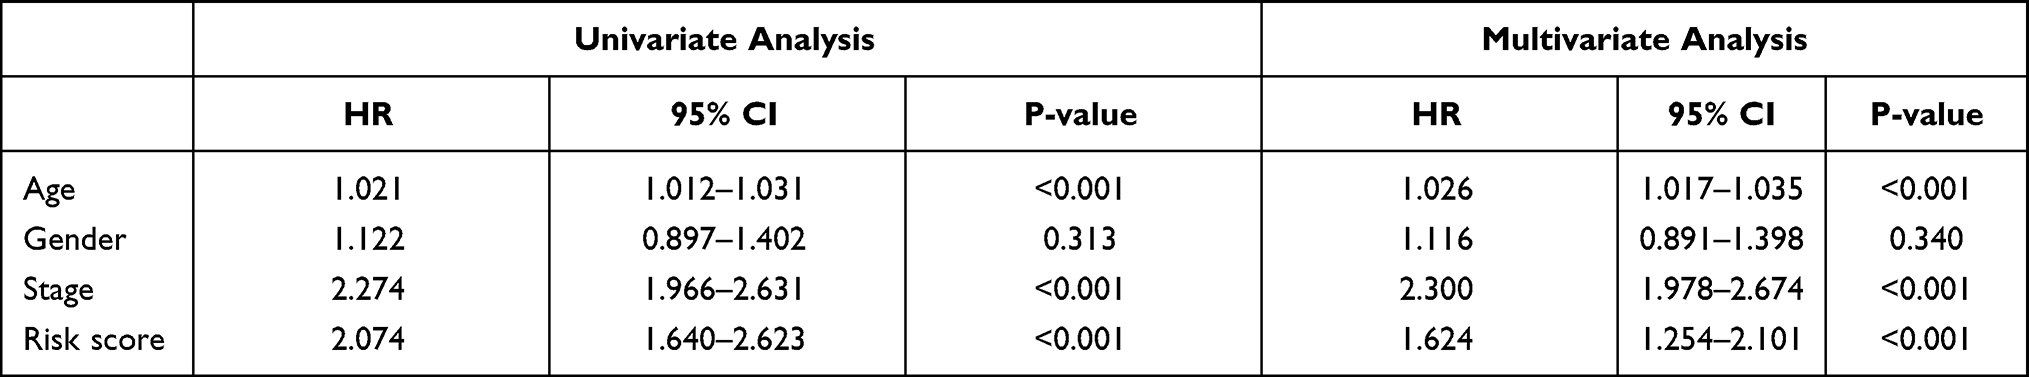 |
Table 4 The Prognostic Value of Different Clinical Parameters in the GEO Database Combined Cohort |
Construction of the RBP Nomogram
We integrated the 7-RBP signature with clinical features to create a nomogram to develop quantitative methods for assessing COAD prognosis (Figure 7A). The ability to plot a vertical line between the total point axis and each prognostic axis to calculate the survival of patients with COAD at 1, 3, and 5 years can be helpful for practitioners involved in making clinical decisions about patients with COAD. The nomogram calibration curves show that that we plotted the nomogram with better accuracy (Figure 7B).
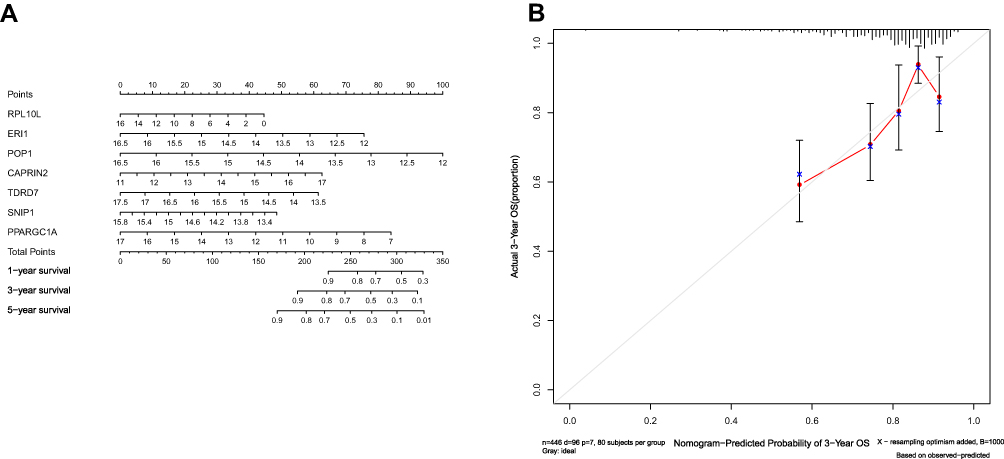 |
Figure 7 Nomogram (A) for predicting the 1-, 3-, and 5-year overall survival (OS) of colon adenocarcinoma (COAD) patients in The Cancer Genome Atlas (TCGA) cohort. (B) Calibration curves for Nomogram. |
Expression of the Seven Prognosis-Related RBP-Encoding Genes and Their Survival Impact
The expression of seven key RBPs was further analyzed with the HPA database, which contains immunohistochemical results for five RBPs (not including PPARGC1A and POP1) in COAD tissues and normal colon tissues (Figure 8). To validate the prognostic value of key RBP-encoding genes in the TCGA cohort, we analyzed the seven RBP-encoding genes by Kaplan-Meier curve analysis and showed that patients with COAD with low CAPRIN2 expression and high POP1 and PPARGC1A expression had higher OS rates than those with other expression patterns (Figure 9).
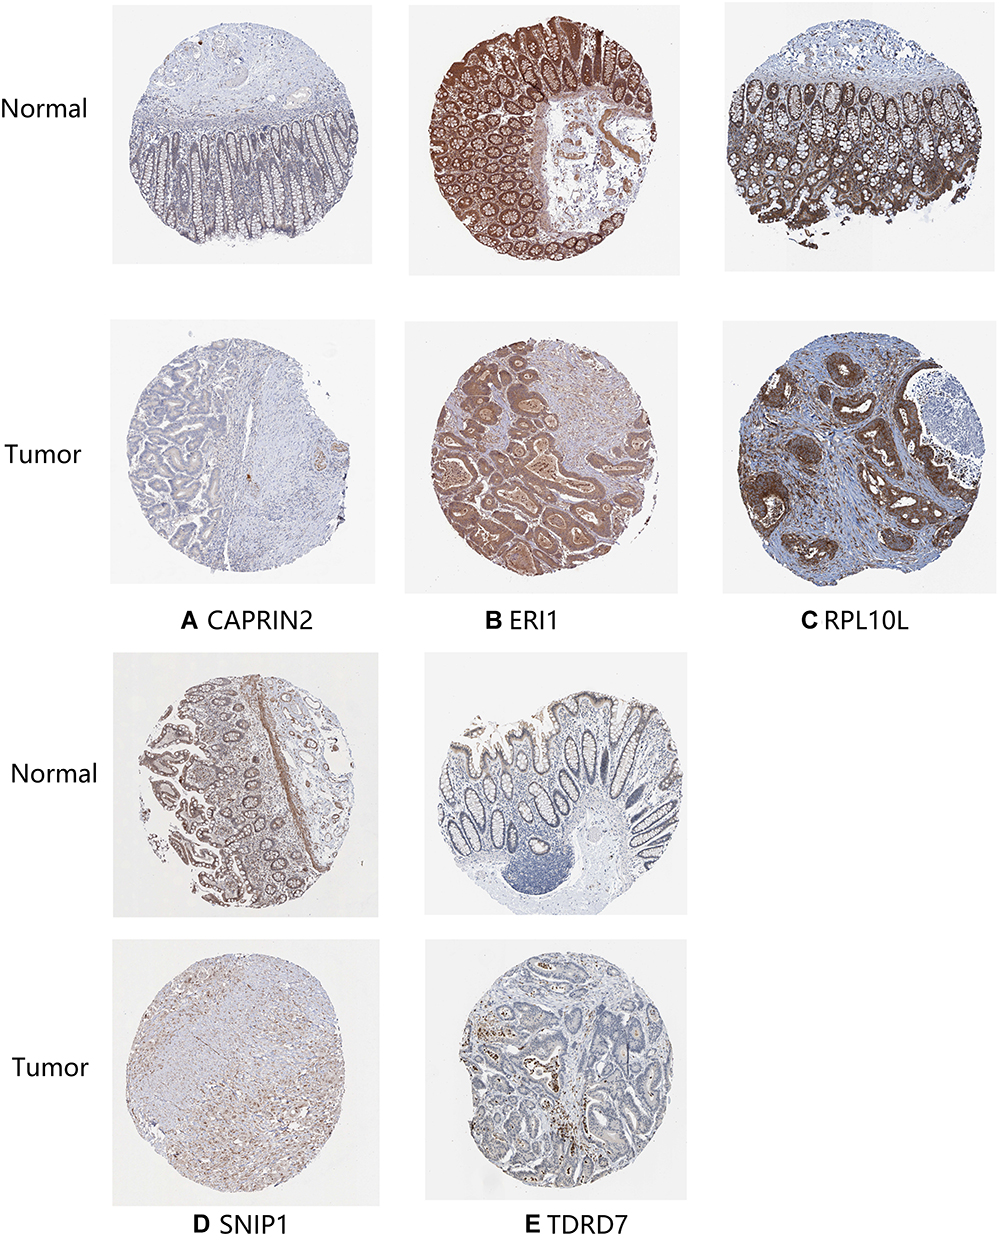 |
Figure 8 Verification of hub RNA-binding protein (RBP) expression in colon adenocarcinoma (COAD) tissues and normal colon tissues using the Human Protein Atlas (HPA) database. (A) CAPRIN2, (B) ERI1, (C) RPL10L, (D) SNIP1 and (E) TDRD7. |
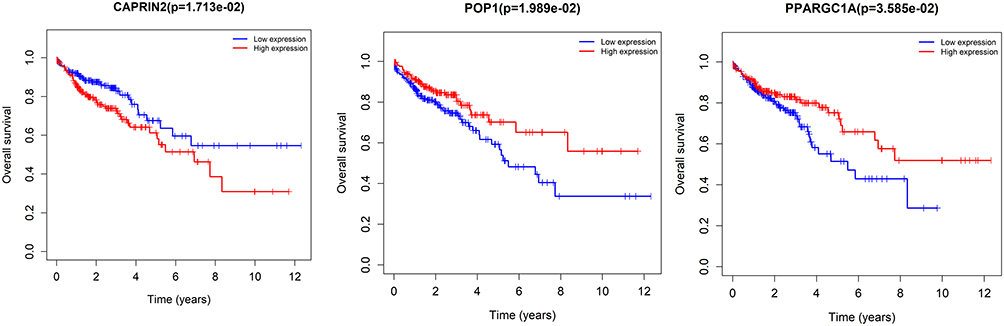 |
Figure 9 Kaplan-Meier curve analysis of the three prognostic RNA-binding proteins (RBPs), including CAPRIN2, POP1 and PPARGC1A, in The Cancer Genome Atlas (TCGA) cohort. |
qRT-PCR Validation of the Seven Prognosis-Related RBP-Encoding Genes
qRT-PCR was used to validate the expressions of the seven prognosis-related RBP-encoding genes, including CAPRIN2, RPL10L, ERI1, POP1, TDRD7, SNIP1 and PPARGC1A in seven COAD cells (SW480, RKO, HCT116, HCT-15, DLD-1, HT-29 and HCT-8) and one human colonic epithelial cell (NCM460). The results showed that RPL10L, ERI1, POP1, TDRD7, SNIP1 and PPARGC1A were lowly expressed in most COAD cell lines compared to the control cell (NCM460), while CAPRIN2 was highly expressed (Figure 10). This is consistent with the prognostic significance.
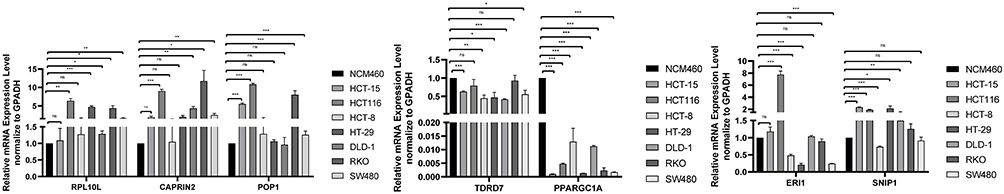 |
Figure 10 qRT-PCR validation of seven prognosis-related RBP-encoding genes in colon adenocarcinoma (COAD) cell models compared to control cells. *p < 0.05. **p < 0.01. ***p < 0.001. Abbreviation: ns, not significant. |
Discussion
Several studies have suggested that RBPs are closely associated with the development and progression of many cancers.8,22 However, there are few comprehensive studies on the function and prognosis of RBP in patients with COAD. The main purpose of this study was to analyze the relationship between RBPs and the prognosis of patients with COAD. First, we identified 496 RBPs that differed between COAD tissues and normal colon tissues in the TCGA database. Then, we further analyzed the related biological pathways and constructed PPI networks for these RBPs. In addition, we identified a total of 11 survival-related RBPs significantly associated with COAD survival by univariate Cox regression analysis. Moreover, gene signatures were constructed by LASSO and multiple Cox regression analysis, and we identified seven hub RBP-encoding genes (CAPRIN2, RPL10L, ERI1, POP1, TDRD7, SNIP1 and PPARGC1A). We later performed survival analysis and ROC curve analysis of the hub RBPs to further investigate their clinical significance. Finally, we constructed a risk model based on seven hub RBPs associated with prognosis to predict the prognosis of COAD. Our findings are useful as they revealed novel biomarkers for the diagnosis and prediction of prognosis in COAD patients.
The GO functional pathway enrichment analysis indicated that the DE RBPs were greatly enriched in ncRNA processing, ribosome biogenesis, rRNA metabolic processes, RNA catabolic processes, RNA splicing, mRNA catabolic process, regulation of translation, and catalytic activity acting on RNA. In recent years, many studies have demonstrated the role of abnormal RNA metabolism and RNA processing in various diseases.23–25 Posttranscriptional regulation of RNA stability is critical in regulating the expression of target genes. RBPs interact with RNA to form ribonucleoprotein complexes to increase the stability of mRNAs and thereby promote the expression of target genes, a process that is important in a variety of diseases. LncRNA OCC-1 regulates the levels of a large number of mRNAs directly related to colorectal cancer cell growth by regulating RBP HuR stability at the posttranscriptional level.26 The RBP IGF2BP3/ELAVL1 complex is critical for regulating the stability of oncogenic mRNA in colorectal cancer.27 RBP Msi1 inhibits the p21cip1 expression by directly binding to the shared sequence of p21cip1 3-’UTR in colon cancer cells.28 In addition, ribonucleoprotein granules are key factors in protein biosynthesis. Alterations in ribonucleoproteins affect the translation process and are associated with tumor progression.29 Analysis of the enriched KEGG pathways revealed that the aberrantly expressed RBPs regulate colon carcinogenesis and progression by affecting RNA transport, ribosome biogenesis, spliceosomes, mRNA monitoring pathways and RNA degradation.
We screened seven key prognosis-related RBPs in COAD patients, including CAPRIN2, RPL10L, ERI1, POP1, TDRD7, SNIP1 and PPARGC1A, by Cox regression analysis. Ribosomal protein L10 (RPL10) is an oncogene that encodes a protein known as oncoprotein QM.30 The expression of RPL10 was reported to be negatively correlated with prostate adenocarcinoma grade.31 A previous study reported that RPL10 is specifically expressed in ovarian cancer cells and is considered a novel biomarker for diagnostic and/or therapeutic targeting of ovarian cancer.32 Exo-ribonuclease 1 (ERL1) is a ribonuclease involved in RNA metabolism, and it has been reported that ERL1 plays an important role in defining HOXC8 expression for the correct patterning of the skeleton.33 However, there have been no studies of ERL1 in human cancer. “Pyrin-only” protein 1 (POP1, also known as POPDC1 and BVES) is a membrane protein essential for regulating tight junction (TJ) formation and blocking epithelial-mesenchymal transition (EMT), and through its epigenetic silencing, it may promote EMT in colon cancer.34 Cytoplasmic activation/proliferation-associated protein 2 (CAPRIN2) is an LRP5/6 binding protein.35 It has been reported that CAPRIN2 promotes the development of hepatoblastoma36 and oral squamous cell carcinoma37 progression by activating the classical WNT signaling pathway. Tudor domain-containing 7 (TDRD7) is a novel causative gene that can cause congenital cataracts such as azoospermia in human males.38 Nevertheless, its role in cancer has also not been reported. Smad nuclear interacting protein 1 (SNIP1) is a major gene that regulates cyclin D1 mRNA stability during cotranscription or posttranscription stages, and its overexpression alone is sufficient to cause tumorigenesis.39 Increasing research has indicated that SNIP1 might be a significant prognostic predictor in patients with cervical cancer,40 non-small cell lung cancer,41 osteosarcoma,42 and tongue squamous cell carcinoma.43 The above studies suggest that SNIP1 may serve as an important prognostic marker in cancer. Peroxisome proliferator-activated receptor coactivator 1A (PPARGC1A) might be implicated in the development of colorectal cancer.44 Previous studies showed that PPARGC1A induces the expression of oxidative phosphorylation genes and promotes tumor growth in colon cancer.45,46
We applied multivariate Cox regression analysis to construct a risk model consisting of these seven key RBPs that is valuable for predicting the prognosis of patients with COAD. Analysis of ROC curves over time showed that these seven genes had good diagnostic ability, and that the risk model we developed could be used effectively to identify COAD patients with a poor prognosis. However, to date, there have been few studies on the mechanisms by which these hub RBPs affect COAD pathogenesis. Therefore, further studies are very important. In addition, we constructed a nomogram capable of predicting OS in patients with COAD at 1, 3 and 5 years. We used Kaplan-Meier curves to evaluate the prognostic value of these seven pivotal RBPs and found that three of them (CAPRIN2, POP1, PPARGC1A) were associated with patient prognosis.
Nevertheless, there are still a few limitations of this study. First, the prediction model we developed was based on TCGA data only and was not clinically validated or prospectively studied; moreover, the limited clinical information in the TCGA dataset may reduce the accuracy of Cox regression analysis. Nevertheless, our predictive model constructed based on 7 RBPs showed great potential to predict the prognosis of COAD patients, which is crucial for clinical decision making.
Conclusion
In conclusion, we screened prognosis-related genes in COAD patients based on RBP-related genes. In addition, we validated the expressions of the seven prognosis-related RBP-encoding genes by qRT-PCR and constructed a prognosis-related nomogram for patients with COAD. The gene signatures we screened and the nomogram we created bring some enlightenment to the clinical. Nevertheless, the RBPs we screened still need to be further explored to determine if they might be useful for molecularly targeted therapy of COAD patients.
Data Sharing Statement
Publicly available datasets were analyzed in this study. This data can be found at TCGA project (https://portal.gdc.cancer.gov/), GSE17538 dataset (https://www.ncbi.nlm.nih.gov/geo/query/acc.cgi?acc=GSE17538), GSE39084 dataset (https://www.ncbi.nlm.nih.gov/geo/query/acc.cgi?acc=GSE39084), GSE39582 dataset (https://www.ncbi.nlm.nih.gov/geo/query/acc.cgi?acc=GSE39582), and GSE103479 dataset (https://www.ncbi.nlm.nih.gov/geo/query/acc.cgi?acc=GSE103479).
Author Contributions
All authors made a significant contribution to the work reported, whether that is in the conception, study design, execution, acquisition of data, analysis and interpretation, or in all these areas; took part in drafting, revising or critically reviewing the article; gave final approval of the version to be published; have agreed on the journal to which the article has been submitted; and agree to be accountable for all aspects of the work. DZ and JC designed the study. DZ, JC carried out data acquisition and analysis. DZ wrote the manuscript. DZ and JC contributed to bioinformatics analysis. TH was involved in project management and contributed to preparing and making figures. TH supervised the study.
Funding
This work was supported by grants from the National Natural Science Foundation of China (grant no. 82003149), the Guangzhou Science and Technology Program (grant no. 201803010094) and the Guangdong Medical Research Fund Project ((grant no. A2019477).
Disclosure
The authors declare that they have no conflicts of interest.
References
1. Bray F, Ferlay J, Soerjomataram I, Siegel RL, Torre LA, Jemal A. Global cancer statistics 2018: GLOBOCAN estimates of incidence and mortality worldwide for 36 cancers in 185 countries. CA Cancer J Clin. 2018;68:394–424. doi:10.3322/caac.21492
2. Sugarbaker PH. Improving oncologic outcomes for colorectal cancer at high risk for local-regional recurrence with novel surgical techniques. Expert Rev Gastroenterol Hepatol. 2016;10:205–213. doi:10.1586/17474124.2016.1110019
3. Symeonidis D, Christodoulidis G, Koukoulis G, Spyridakis M, Tepetes K. Colorectal cancer surgery in the elderly: limitations and drawbacks. Tech Coloproctol. 2011;15 Suppl 1:S47–S50. doi:10.1007/s10151-011-0751-z
4. Gerstberger S, Hafner M, Tuschl T. A census of human RNA-binding proteins, nature reviews. Genetics. 2014;15:829–845. doi:10.1038/nrg3813
5. Brinegar AE, Cooper TA. Roles for RNA-binding proteins in development and disease. Brain Res. 2016;1647:1–8. doi:10.1016/j.brainres.2016.02.050
6. Protter DSW, Parker R. Principles and properties of stress granules. Trends Cell Biol. 2016;26(9):668–679. doi:10.1586/17474124.2016.1110019
7. de Bruin RG, Rabelink TJ, van Zonneveld AJ, van der Veer EP. Emerging roles for RNA-binding proteins as effectors and regulators of cardiovascular disease. Eur Heart J. 2017;38:1380–1388. doi:10.1093/eurheartj/ehw567
8. Pereira B, Billaud M, Almeida R. RNA-binding proteins in cancer: old players and new actors. Trends Cancer. 2017;3:506–528. doi:10.1016/j.trecan.2017.05.003
9. Chatterji P, Rustgi AK. RNA binding proteins in intestinal epithelial biology and colorectal cancer. Trends Mol Med. 2018;24:490–506. doi:10.1016/j.molmed.2018.03.008
10. Xie M, Ma T, Xue J, et al. The long intergenic non-protein coding RNA 707 promotes proliferation and metastasis of gastric cancer by interacting with mRNA stabilizing protein HuR. Cancer Lett. 2019;443:67–79. doi:10.1016/j.canlet.2018.11.032
11. Zhang H, Wang Y, Dou J, et al. Acetylation of AGO2 promotes cancer progression by increasing oncogenic miR-19b biogenesis. Oncogene. 2019;38:1410–1431. doi:10.1038/s41388-018-0530-7
12. Zong F-Y, Fu X, Wei W-J, et al. The RNA-binding protein QKI suppresses cancer-associated aberrant splicing. PLoS Genet. 2014;10:e1004289. doi:10.1371/journal.pgen.1004289
13. Jeong HM, Han J, Lee SH, et al. Correction: ESRP1 is overexpressed in ovarian cancer and promotes switching from mesenchymal to epithelial phenotype in ovarian cancer cells. Oncogenesis. 2019;8:47. doi:10.1038/s41389-019-0155-x
14. Ashburner M, Ball CA, Blake JA, et al. Gene ontology: tool for the unification of biology. The gene ontology consortium. Nat Genet. 2000;25:25–29. doi:10.1038/75556
15. Kanehisa M, Sato Y, Kawashima M, Furumichi M, Tanabe M. KEGG as a reference resource for gene and protein annotation. Nucleic Acids Res. 2016;44:D457–D462. doi:10.1093/nar/gkv1070
16. Szklarczyk D, Morris JH, Cook H, et al. The STRING database in 2017: quality-controlled protein-protein association networks, made broadly accessible. Nucleic Acids Res. 2017;45:D362–D368. doi:10.1093/nar/gkw937
17. Bader GD, Hogue CWV. An automated method for finding molecular complexes in large protein interaction networks. BMC Bioinform. 2003;4:2. doi:10.1186/1471-2105-4-2
18. Chen H-Y, Yu S-L, Chen C-H, et al. A five-gene signature and clinical outcome in non-small-cell lung cancer. N Engl J Med. 2007;356:11–20. doi:10.1056/NEJMoa060096
19. Wu M, Li X, Zhang T, Liu Z, Zhao Y. Identification of a nine-gene signature and establishment of a prognostic nomogram predicting overall survival of pancreatic cancer. Front Oncol. 2019;9:996. doi:10.3389/fonc.2019.00996
20. Heagerty PJ, Lumley T, Pepe MS. Time-dependent ROC curves for censored survival data and a diagnostic marker. Biometrics. 2000;56:337–344. doi:10.1111/j.0006-341X.2000.00337.x
21. Thul PJ, Åkesson L, Wiking M, et al. A subcellular map of the human proteome. Science. 2017;356:eaal3321. doi:10.1126/science.aal3321
22. Wu Y, Chen H, Chen Y, et al. HPV shapes tumor transcriptome by globally modifying the pool of RNA binding protein-binding motif. Aging (Albany NY). 2019;11:2430–2446. doi:10.18632/aging.101927
23. Li Y, Sahni N, Pancsa R, et al. Revealing the determinants of widespread alternative splicing perturbation in cancer. Cell Rep. 2017;21:798–812. doi:10.1016/j.celrep.2017.09.071
24. Li S, Hu Z, Zhao Y, Huang S, He X. Transcriptome-wide analysis reveals the landscape of aberrant alternative splicing events in liver cancer. Hepatology (Baltimore, Md). 2019;69:359–375. doi:10.1002/hep.30158
25. Li Y, McGrail DJ, Xu J, et al. MERIT: systematic analysis and characterization of mutational effect on RNA interactome topology. Hepatology (Baltimore, Md). 2019;70:532–546. doi:10.1002/hep.30242
26. Lan Y, Xiao X, He Z, et al. Long noncoding RNA OCC-1 suppresses cell growth through destabilizing HuR protein in colorectal cancer. Nucleic Acids Res. 2018;46:5809–5821. doi:10.1093/nar/gky214
27. Li K, Huang F, Li Y, et al. Stabilization of oncogenic transcripts by the IGF2BP3/ELAVL1 complex promotes tumorigenicity in colorectal cancer. Am J Cancer Res. 2020;10:2480–2494.
28. Gao C, Han C, Yu Q, et al. Downregulation of Msi1 suppresses the growth of human colon cancer by targeting p21cip1. Int J Oncol. 2015;46:732–740. doi:10.3892/ijo.2014.2749
29. Goudarzi KM, Lindström MS. Role of ribosomal protein mutations in tumor development (review). Int J Oncol. 2016;48:1313–1324. doi:10.3892/ijo.2016.3387
30. Stålberg P, Grimfjärd P, Santesson M, et al. Transfection of the multiple endocrine neoplasia type 1 gene to a human endocrine pancreatic tumor cell line inhibits cell growth and affects expression of JunD, delta-like protein 1/preadipocyte factor-1, proliferating cell nuclear antigen, and QM/Jif-1. J Clin Endocrinol Metab. 2004;89:2326–2337. doi:10.1210/jc.2003-031228
31. Altinok G, Powell IJ, Che M, et al. Reduction of QM protein expression correlates with tumor grade in prostatic adenocarcinoma. Prostate Cancer Prostatic Dis. 2006;9:77–82. doi:10.1038/sj.pcan.4500848
32. Rohozinski J, Anderson ML, Broaddus RE, Edwards CL, Bishop CE. Spermatogenesis associated retrogenes are expressed in the human ovary and ovarian cancers. PLoS One. 2009;4:e5064. doi:10.1371/journal.pone.0005064
33. Choucair N, Rajab M, Mégarbané A, Chouery E. Homozygous microdeletion of the ERI1 and MFHAS1 genes in a patient with intellectual disability, limb abnormalities, and cardiac malformation. Am J Med Genet. 2017;173:1955–1960. doi:10.1002/ajmg.a.38271
34. Williams CS, Zhang B, Smith JJ, et al. BVES regulates EMT in human corneal and colon cancer cells and is silenced via promoter methylation in human colorectal carcinoma. J Clin Invest. 2011;121:4056–4069. doi:10.1172/JCI44228
35. Ding Y, Xi Y, Chen T, et al. Caprin-2 enhances canonical Wnt signaling through regulating LRP5/6 phosphorylation. J Cell Biol. 2008;182:865–872. doi:10.1083/jcb.200803147
36. Jia D, Dong R, Jing Y, et al. Exome sequencing of hepatoblastoma reveals novel mutations and cancer genes in the Wnt pathway and ubiquitin ligase complex. Hepatology (Baltimore, Md). 2014;60:1686–1696. doi:10.1002/hep.27243
37. Ai Y, Wu S, Zou C, Wei H. LINC00941 promotes oral squamous cell carcinoma progression via activating CAPRIN2 and canonical WNT/β-catenin signaling pathway. J Cell Mol Med. 2020;24:10512–10524. doi:10.1111/jcmm.15667
38. Tan Y-Q, Tu C, Meng L, et al. Loss-of-function mutations in TDRD7 lead to a rare novel syndrome combining congenital cataract and nonobstructive azoospermia in humans. Genet Med. 2019;21:1209–1217. doi:10.1038/gim.2017.130
39. Bracken CP, Wall SJ, Barré B, Panov KI, Ajuh PM, Perkins ND. Regulation of cyclin D1 RNA stability by SNIP1. Cancer Res. 2008;68:7621–7628. doi:10.1158/0008-5472.CAN-08-1217
40. Chen Y, Zhang W, Yan L, Zheng P, Li J. miR-29a-3p directly targets Smad nuclear interacting protein 1 and inhibits the migration and proliferation of cervical cancer HeLa cells. PeerJ. 2020;8:e10148. doi:10.7717/peerj.10148
41. Jeon H-S, Choi YY, Fukuoka J, et al. High expression of SNIP1 correlates with poor prognosis in non-small cell lung cancer and SNIP1 interferes with the recruitment of HDAC1 to RB in vitro. Lung Cancer. 2013;82:24–30. doi:10.1016/j.lungcan.2013.07.015
42. Xie Y, Deng H, Wei R, et al. Overexpression of miR-335 inhibits the migration and invasion of osteosarcoma by targeting SNIP1. Int J Biol Macromol. 2019;133:137–147. doi:10.1016/j.ijbiomac.2019.04.016
43. Liang X, Zheng M, Jiang J, Zhu G, Yang J, Tang Y. Hypoxia-inducible factor-1 alpha, in association with TWIST2 and SNIP1, is a critical prognostic factor in patients with tongue squamous cell carcinoma. Oral Oncol. 2011;47:92–97. doi:10.1016/j.oraloncology.2010.11.014
44. Lin J, Chen Y, Tang W-F, et al. rs3856806 C>T polymorphism increased the risk of colorectal cancer: a case-control study in eastern Chinese Han population. Front Oncol. 2019;9:63. doi:10.3389/fonc.2019.00063
45. Vellinga TT, Borovski T, de Boer VCJ, et al. SIRT1/PGC1α-dependent increase in oxidative phosphorylation supports chemotherapy resistance of colon cancer. Clin Cancer Res. 2015;21:2870–2879. doi:10.1158/1078-0432.CCR-14-2290
46. Mootha VK, Lindgren CM, Eriksson K-F, et al. PGC-1alpha-responsive genes involved in oxidative phosphorylation are coordinately downregulated in human diabetes. Nat Genet. 2003;34:267–273. doi:10.1038/ng1180
 © 2021 The Author(s). This work is published and licensed by Dove Medical Press Limited. The
full terms of this license are available at https://www.dovepress.com/terms
and incorporate the Creative Commons Attribution
- Non Commercial (unported, 3.0) License.
By accessing the work you hereby accept the Terms. Non-commercial uses of the work are permitted
without any further permission from Dove Medical Press Limited, provided the work is properly
attributed. For permission for commercial use of this work, please see paragraphs 4.2 and 5 of our Terms.
© 2021 The Author(s). This work is published and licensed by Dove Medical Press Limited. The
full terms of this license are available at https://www.dovepress.com/terms
and incorporate the Creative Commons Attribution
- Non Commercial (unported, 3.0) License.
By accessing the work you hereby accept the Terms. Non-commercial uses of the work are permitted
without any further permission from Dove Medical Press Limited, provided the work is properly
attributed. For permission for commercial use of this work, please see paragraphs 4.2 and 5 of our Terms.