
Back to Journals » International Journal of Women's Health » Volume 18

Development and Validation of a Predictive Model Using Logistic Regression and Machine Learning for Carotid Artery Atherosclerosis Risk in Postmenopausal Han Women from Northern China: A Retrospective Case-Control Study
Authors Liu M, Zhang Q, Niu C, Ren F, Chu Y
Received 31 January 2026
Accepted for publication 1 July 2026
Published 8 July 2026 Volume 2026:18 595246
DOI https://doi.org/10.2147/IJWH.S595246
Checked for plagiarism Yes
Review by Single anonymous peer review
Peer reviewer comments 3
Editor who approved publication: Dr Marta Barba
Video abstract of “Carotid Artery Atherosclerosis in Postmenopausal Women” [595246].
Views: 5
Ming Liu,1 Qian Zhang,2 Chang Niu,2 Feng Ren,2 Yang Chu2
1Department of Anesthesiology, The Second Affiliated Hospital of Dalian Medical University, Dalian, Liaoning Province, 116023, People’s Republic of China; 2Molecular Laboratory, Department of Laboratory Medicine, The Second Affiliated Hospital of Dalian Medical University, Dalian, Liaoning Province, 116023, People’s Republic of China
Correspondence: Yang Chu, Email [email protected]
Background: Postmenopausal women are at elevated risk for carotid atherosclerosis due to estrogen decline, yet existing prediction models do not incorporate genetic markers. This study aimed to develop and validate a risk prediction model combining clinical variables and estrogen receptor 1 rs9340799 genotype for postmenopausal Han women in northern China using logistic regression and machine learning approaches.
Methods: A total of 276 postmenopausal Han women in northern China were recruited from 1 December 2024 to 30 April 2025. They were divided into a case group (n = 162) and a control group (n = 114) based on the presence of carotid atherosclerosis (CAS). ESR1 rs9340799, a polymorphism in the estrogen receptor alpha gene, was selected for genotyping (MAF > 0.05 in Chinese population) using high–resolution melting PCR. Univariate and multivariable logistic regression identified risk factors, and a nomogram was constructed based on age, systolic blood pressure (SBP), glucose (GLU), and rs9340799 genotype. Six machine learning algorithms were compared; logistic regression was selected given its ease of interpretation and resistance to overfitting. The model was externally validated in 47 subjects in the same institution from 1 May 2025 to 30 June 2025.
Results: In the case group, age, menopause duration, SBP, and GLU were significantly higher than in controls (all P < 0.01), and rs9340799 GG genotype showed a protective effect in univariate analysis (P = 0.045). Age, SBP, GLU, and rs9340799 were selected as predictors after excluding menopause duration due to collinearity with age. Among six ML algorithms, logistic regression achieved the highest AUC (0.709, 95% CI: 0.596– 0.821) with acceptable calibration (Brier score = 0.227, HL P = 0.263) and the broadest DCA threshold range (0.30– 0.75), and was selected as the final model. SHapley Additive exPlanations (SHAP) analysis identified age as the most influential predictor. External validation in 47 subjects yielded an AUC of 0.65 (95% CI: 0.48– 0.82), sensitivity of 0.82, and specificity of 0.55; the wide CI crossing 0.50 reflects the limited sample size, and further validation is warranted.
Conclusion: This study developed a logistic regression model that included age, systolic blood pressure, GLU and ESR1 rs9340799 genotypes. The model demonstrated moderate discrimination in predicting the risk of carotid atherosclerosis in postmenopausal Han women in northern China. This model should be considered preliminary and needs further validation in larger, independent, multicenter cohorts for identifying high-risk populations for early intervention.
Keywords: carotid artery atherosclerosis, CAS, postmenopausal, high–resolution melting PCR, HRM–PCR, rs9340799, machine learning, ML
Background
Atherosclerosis (AS) is an inflammatory disease characterized by the accumulation of lipids and leukocytes in the arterial wall, which harms human health.1 This process is accelerated in postmenopausal women following estrogen decline.2 Carotid atherosclerosis can reduce cerebral blood flow and increase the risk of ischemic stroke.3–5 Once the disease progresses to carotid stenosis requiring surgical intervention, periprocedural risks also increase.6 Therefore, early risk stratification is necessary to intervene in a timely manner before plaque formation and reduce the risk of stroke.7
Postmenopausal women are at elevated risk due to estrogen deficiency and associated metabolic changes, including dyslipidemia, impaired glucose metabolism, and elevated blood pressure.8 The prevalence of carotid atherosclerosis is significantly higher, even after adjusting for age.9,10 Furthermore, the Han population in northern China faces additional risks from distinct dietary patterns (higher sodium, lower vegetable intake) and increased exposure to cold, which can increase the risk of cardiovascular and cerebrovascular diseases.11,12 Therefore, we chose postmenopausal Han Chinese women in northern China as our research subjects.
Research has shown that the diagnostic and predictive power of common clinical single indicators is limited, low-density lipoprotein cholesterol (LDL-C) may lack independent predictive value for carotid plaques when adjusted for composite lipid ratios,13 and total cholesterol/high-density lipoprotein ratio (TC/HDL) showed no significant independent association with carotid plaque presence when used alone in postmenopausal women.14 Combining clinical indicators can improve predictive performance, and machine learning (ML) facilitates this by analyzing data, screening biomarkers, and constructing multi-indicator models to assist clinical decision-making.15,16 Recently, ML algorithms have been applied to carotid plaque prediction in general populations, achieving AUCs of 0.80–0.85,17,18 however, these models were developed in mixed populations including both sexes and wide age ranges. A recently developed prediction model for postmenopausal women with carotid AS, a 7-variable nomogram based on clinical and biochemical markers achieved a C-index of 0.668 in external validation14 but does not incorporate polymorphisms or other genetic markers.
Among potential genetic markers, the estrogen receptor alpha (ESR1) gene polymorphism rs9340799 (XbaI) is of particular interest. It is located in intron 1 of ESR1, and its polymorphism has been associated with estrogen-related diseases including endometriosis19 and bone mineral density.20 Although there was no statistical difference, the E2 levels of rs9340799 AA, GA, and GG genotypes showed a gradually increasing trend.21 Since ESR1 mediates estrogen’s vascular protective effects, variants affecting receptor function may modulate atherosclerosis susceptibility.
To address these gaps, the present study retrospectively included postmenopausal Han women between December 2024 and June 2025 combining clinical variables and rs9340799 genotype to develop and validate a risk prediction model using logistic regression and ML approaches. Through this approach, our goal is to develop a clinically applicable screening tool, which integrates genetic and clinical variables, can identify early the high-risk population of carotid atherosclerosis in Han postmenopausal women in northern China, and promote timely intervention to reduce the burden of stroke.
Methods
Study Design and Participants
This study was a retrospective case-control study. The research data were from 323 postmenopausal women in the Physical Examination Center of the Second Affiliated Hospital of Dalian Medical University from 1 December 2024 to 30 June 2025. According to carotid ultrasound examination results, subjects were divided into a case group and a control group based on the presence of carotid atherosclerosis changes or plaques. Carotid atherosclerosis changes were defined as an intima–media thickness (IMT) ≥1 mm and carotid plaques as an IMT ≥1.5 mm.22 All women have been postmenopausal for more than two years. Subjects with a history of carotid endarterectomy or stent implantation, autoimmune diseases, malignant tumors, or incomplete clinical data were excluded. The training and internal validation sets included 276 subjects collected from 1 December 2024 to 30 April 2025, comprising 162 cases in the case group and 114 in the control group. The external validation set consisted of 47 subjects collected from 1 May 2025 to 30 June 2025, including 27 cases and 20 controls.
This study was approved by the Ethics Committee of the Second Affiliated Hospital of Dalian Medical University, and the ethical consent letter number is KY2024–151–02. Informed consent was obtained from each patient and the study protocol conforms to the ethical guidelines of the 1975 Declaration of Helsinki. The research flowchart is shown in Supplementary Figure 1.
Data Collection
Clinical information was collected, including age and menopausal age, general health indicators such as height, weight, systolic blood pressure (SBP), and diastolic blood pressure (DBP), as well as biochemical indicators including glucose (GLU), total cholesterol (TC), triglycerides (TG), low-density lipoprotein (LDL), and high-density lipoprotein (HDL). Biochemical indicators were detected using ADVIA CHEMISTRY XPT (Siemens, Germany).
Single Nucleotide Polymorphism Genotyping
After an overnight fast, whole blood samples were collected from the middle cubital vein of each participant for blood routine testing, and we collected clinical discarded blood samples for genotyping experiments. Genomic DNA was extracted from 200 μL of each whole blood sample using the Whole Blood DNA Extraction Kit (Magnetic Bead Method, BioPerfectus, China) according to the manufacturer’s instructions. Extracted DNA was diluted to 30 ng/μL and stored at –80°C.
SNP loci were selected based on the NCBI dbSNP database (http://www.ncbi.nlm.nih.gov/projects/SNP/), according to the following criteria: the minimum allele frequency (MAF) of the selected SNP in the Chinese population should be greater than 0.05. Primers for HRM–PCR amplification were designed to flank the SNP sites.
Polymerase chain reaction with HRM–PCR (Roche Applied Science, Germany) was used for SNP genotyping. Primer Premier 6 was used to design primers with annealing temperatures ranging from 58°C to 62°C; amplicons were limited to 100–200 bp (Supplementary Table 1). Real–time PCR cycling and HRM analyses were conducted using the Light Cycler® 480 System (Roche Applied Science, Germany). Samples were supplemented with known wild–type DNA as a standard. Wild–type and mutant homozygotes were distinguished by mixing samples with a known genotype sequence prior to PCR. Each reaction contained 30 ng of unknown genomic DNA as a template, along with an additional 3.0 ng of known wild–type DNA. PCRs were conducted in 96–well plates using touchdown–PCR cycling. HRM curve data were obtained by melting over the range 65–95°C, at a rate of 25 data acquisitions per 1°C. Results were analyzed using Light Cycler® 480 Gene Scanning software (Roche Applied Science).
Logistic Regression and Model Evaluation
We obtained the candidate predictors of carotid atherosclerosis in postmenopausal women through univariate logistic regression analyses. Variables with P < 0.05 in univariate logistic regression were entered simultaneously into the multivariable logistic regression model. Variable selection was performed on the entire dataset prior to data splitting, with odds ratios (ORs), 95% confidence intervals (CIs), and P values reported for each predictor. Based on these candidate predictors, we constructed a nomogram.
The dataset was randomly split into 70% training and 30% test sets, stratified by case/control status. The test set was held out completely during model training and hyperparameter tuning. No missing data required imputation as complete data were available for all participants. Features in the training set were standardized (z-score normalization), and the same transformation parameters were applied to the test set to prevent data leakage.
Six machine learning algorithms—logistic regression, decision tree, random forest, SVM, XGBoost, and neural network—were trained using the four candidate predictors (age, SBP, GLU, rs9340799). Hyperparameters were tuned via 10-fold cross-validation grid search on the training set with AUC as the optimization criterion: (1) Logistic Regression: binomial logit link; all predictors entered simultaneously. (2) Decision Tree: cp = 0.0737, optimized via 10-fold CV. (3) Random Forest: mtry = 1, ntree = 50, optimized via 10-fold CV grid search. (4) XGBoost: max_depth = 2, eta = 0.1, nrounds = 150, objective = binary: logistic, optimized via 10-fold CV grid search. (5) SVM: cost = 1000, gamma = 0.01 (RBF kernel), optimized via 10-fold CV grid search. (6) Neural Network: 4 hidden units. The optimal classification threshold for each model was determined by maximizing the Youden index (J = Sensitivity + Specificity − 1) on the ROC curve.
Model performance was evaluated across three dimensions as recommended by TRIPOD+AI guidelines: discrimination (AUC), calibration (Brier score, Hosmer–Lemeshow test), and clinical utility (decision curve analysis).23 SHAP analysis was performed on the finalized logistic regression model after all hyperparameter tuning was completed, to interpret feature contributions to individual predictions. KernelSHAP was applied using the first 100 observations from the training set as the explanation set, with the first 50 observations from the test set serving as the background reference.
Finally, an external validation set collected separately and not involved in any aspect of model development or selection was used to validate the final prediction model. Variable selection on the full dataset prior to cross-validation is acknowledged as a potential source of optimistic bias, mitigated by the external validation.
Statistical Analysis
The clinical data were tested for normality using the Kolmogorov–Smirnov (K–S) test. Data with a normal distribution were analyzed by t–test, and results are presented as mean ± standard deviation ( ). Non–normally distributed data were analyzed by Mann–Whitney U-test, and results are presented as median (Q1, Q3). A chi-square test was used to analyze genotype and allele frequencies in patients and control groups. All control genotype distributions were in Hardy–Weinberg equilibrium. A two–tailed P–value less than 0.05 was considered statistically significant.
All analyses were performed using R software (version 4.4.1, R Foundation for Statistical Computing, Vienna, Austria). The following packages were used: caret (v7.0.1) for model training and evaluation; rpart (v4.1.23) for decision tree modeling; randomForest (v4.7.1.2) for random forest modeling; xgboost (v3.2.1.1) for extreme gradient boosting modeling; e1071 (v1.7.17) for support vector machine modeling; nnet (v7.3.19) for neural network modeling; pROC (v1.19.0.1) for ROC curve analysis and AUC calculation; ResourceSelection (v0.3.6) for Hosmer–Lemeshow goodness-of-fit test; rmda (v1.6) for decision curve analysis; kernelshap (v0.9.1) and shapviz (v0.10.3) for SHAP analysis; and ggplot2 (v4.0.3) for data visualization.
Results
Analysis and Comparison of Clinical Laboratory Indicators in Postmenopausal Female Participants
A total of 276 postmenopausal female participants were included in the model construction process. Among them, 162 were in the case group and 114 in the control group. Their demographic and clinical characteristics are summarized in Supplementary Table 2. Compared with controls, patients in the case group were older (61.00 [58.00, 67.00] vs 57.00 [54.00, 62.00] years, P < 0.001), had a longer menopause duration (10.00 [6.25, 17.00] vs 7.00 [4.00, 12.00] years, P < 0.001), higher SBP (133.00 [121.25, 149.00] vs 127.00 [114.50, 138.25] mmHg, P = 0.002), and higher GLU (5.78 [5.35, 6.41] vs 5.54 [5.22, 5.96] mmol/L, P = 0.002) (Supplementary Table 2).
Predictors of Carotid Atherosclerosis Based on Logistic Regression Analysis
Univariate analysis revealed significant associations between several factors and the occurrence of CAS: age (OR = 1.09, 95% CI: 1.05–1.14, P < 0.001), menopause duration (OR = 1.08, 95% CI: 1.04–1.12, P = 0.0002), SBP (OR = 1.02, 95% CI: 1.01–1.03, P = 0.0018), Glu (OR = 1.68, 95% CI: 1.26–2.39, P = 0.0017), and rs9340799 GG genotype (OR = 0.20, 95% CI: 0.03–0.83, P = 0.045). Menopausal age (P = 0.088), height, weight, DBP, TC, TG, LDL and HDL were not significantly associated with CAS. The ROC curves for these significant variables are presented in Figure 1A. Multivariable logistic regression analysis including age, menopausal age, SBP, GLU, and rs9340799 genotype showed that increasing age (OR = 1.07, 95% CI: 1.02–1.11, P = 0.0044) and elevated blood glucose (OR = 1.49, 95% CI: 1.15–2.12, P = 0.013) were independent risk factors for CAS. SBP (OR = 1.01, 95% CI: 0.99–1.02, P = 0.26), menopausal age (OR = 1.03, 95% CI: 0.93–1.14, P = 0.59), and rs9340799 GG genotype (OR = 0.13, 95% CI: 0.01–0.80, P = 0.064) were not statistically significant in the multivariable model (Table 1). Menopause duration was not included in the multivariable model due to collinearity with age and menopausal age.
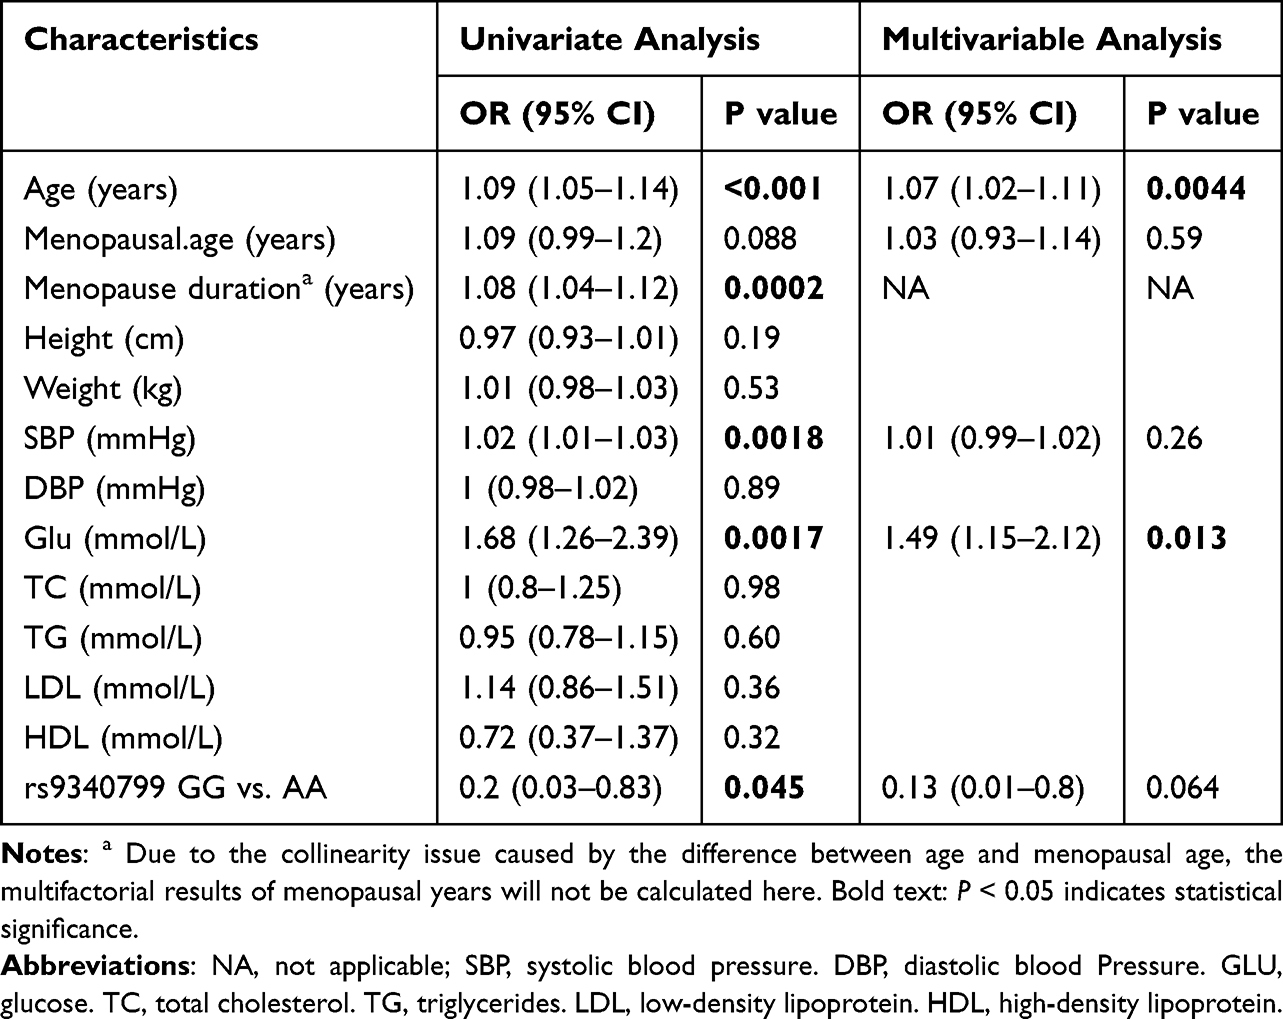 |
Table 1 Univariate and Multivariable Logistic Regression Analysis of Case Group and Control Group |
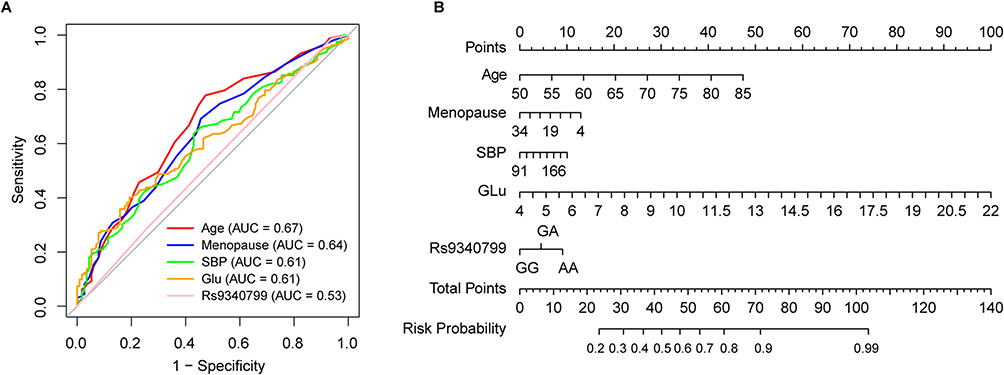 |
Figure 1 Univariate ROC results and nomogram chart. (A) Univariate ROC results of case group and control group. (B) Nomogram predicting the probability of carotid atherosclerosis (CAS) in postmenopausal women. Abbreviations: SBP, systolic blood pressure, Glu, glucose; AUC, area under the curve. |
We constructed a nomogram (Figure 1B) to visualize the logistic regression model. Each subject’s detection results are plotted on the corresponding variable axes. For each variable value, a vertical line was drawn upward to determine the corresponding score, and the points for all variables were summed. Then, a line was drawn on the total points axis to estimate the probability of CAS in the postmenopausal female population.
Model Establishment, Comparison and Evaluation
Based on univariate analysis results, we planned to incorporate age, menopause duration, SBP, blood glucose, and rs9340799 with P-values < 0.05 into the model construction. Due to concerns about multicollinearity among predictor variables—since menopause duration was calculated as the difference between age at enrollment and age at menopause—this variable was excluded. Multicollinearity was assessed using the generalized variance inflation factor (GVIF), and all variables in the final model had GVIF values well below the acceptable threshold of 5 (age: 1.09, SBP: 1.09, GLU: 1.02, rs9340799: 1.01), indicating no multicollinearity concerns. Therefore, age, SBP, blood glucose, and rs9340799 were ultimately included as predictor variables in this study. Six machine learning algorithms were then used for model building and comparison.
On the test set, logistic regression achieved the highest AUC (0.709, 95% CI: 0.596–0.821), followed by neural network (0.657), SVM (0.651), random forest (0.642), decision tree (0.621), and XGBoost (0.591) (Supplementary Table 3). Pairwise DeLong tests with Bonferroni correction revealed no statistically significant discrimination difference between logistic regression and any other model (all adjusted P > 0.01). In terms of calibration, only logistic regression (Brier score = 0.227, HL P = 0.263) and SVM (Brier score = 0.242, HL P = 0.267) demonstrated acceptable agreement between predicted and observed probabilities, while random forest, XGBoost, and neural network showed significant deviations (all P < 0.01; Supplementary Table 3, Supplementary Figure 2). Decision curve analysis (Supplementary Figure 3) showed that logistic regression (0.30–0.75) and SVM (0.35–0.80) provided the broadest threshold range of positive net benefit, followed by decision tree (0.35–0.60), random forest (0.40–0.65), XGBoost (0.40–0.60), and neural network (0.50–0.60). Based on comprehensive consideration of discrimination, calibration, clinical utility, and interpretability, logistic regression was selected as the final model.
The ROC curves of the logistic regression model on the training and testing sets are shown in Figure 2A–B, with AUCs of 0.71 (95% CI: 0.63–0.78) and 0.71 (95% CI: 0.60–0.82), respectively. The calibration curve indicates good agreement between observed and predicted probabilities (Figure 2C; HL P = 0.26). Decision curve analysis confirmed positive net benefit across threshold probabilities of 0.30–0.75 (Figure 2D).
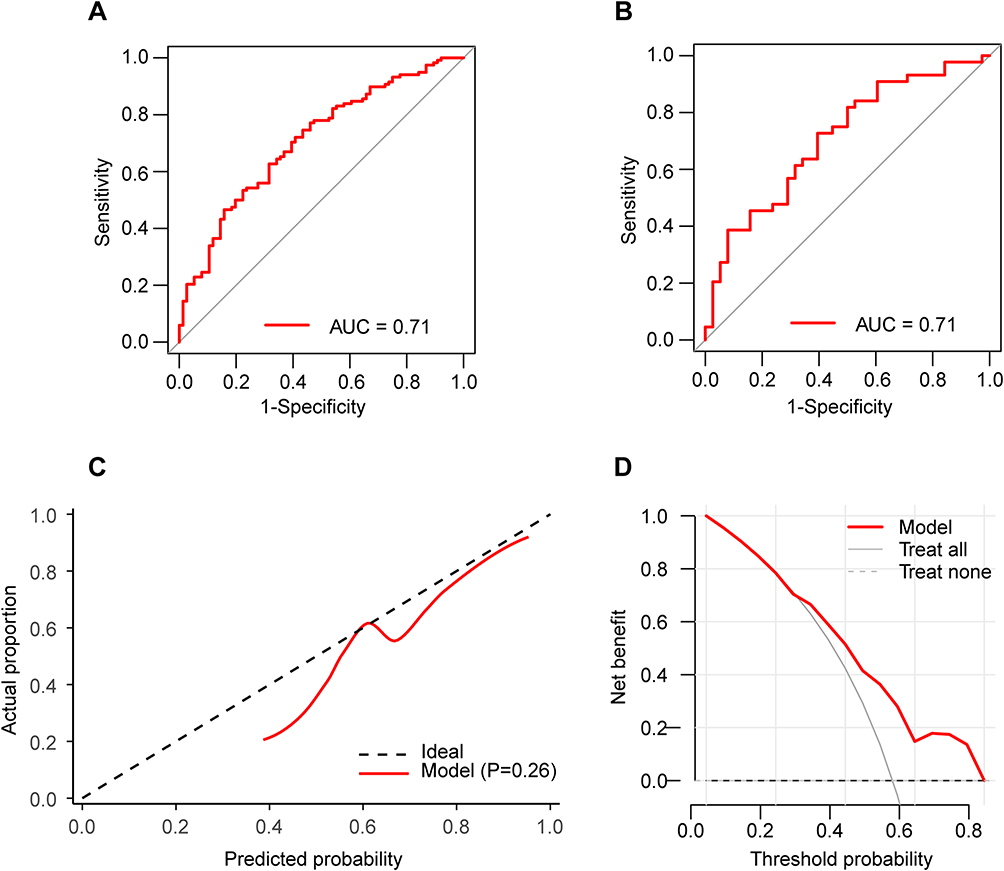 |
Figure 2 The evaluation indicators related to logistic regression models. (A) The ROC in the train set. (B) The ROC in the test set. (C) The calibration curve. (D) The result of decision curve analysis. Abbreviation: AUC, area under the curve. |
SHAP Analysis and Feature Interpretation
SHapley Additive exPlanations (SHAP) analysis was performed on the probability scale to clearly explain the model’s prediction mechanism. Among the four predictor variables, age contributed the most to the model’s predictions, followed by SBP, rs9340799, and GLU (Figure 3A). The SHAP waterfall plot (Figure 3B) visualizes the specific impact of each variable on the predicted probability for a representative patient. In the waterfall plot, the left axis displays the variable name and its value; features that increase the predicted probability and those that decrease it are shown in distinct colors. The baseline value E[f(x)] represents the average predicted probability across the background reference dataset. For this patient, the predicted probability is 0.501, lower than the baseline of 0.603: age contributed the most, decreasing the probability by 0.093; SBP decreased it by 0.012; rs9340799 increased it by 0.003; and GLU decreased it by 0.001. The waterfall plot demonstrates that the direction and magnitude of each variable’s contribution depend on individual feature values, providing a transparent decomposition of how each predictor shifts the predicted probability from the population average.
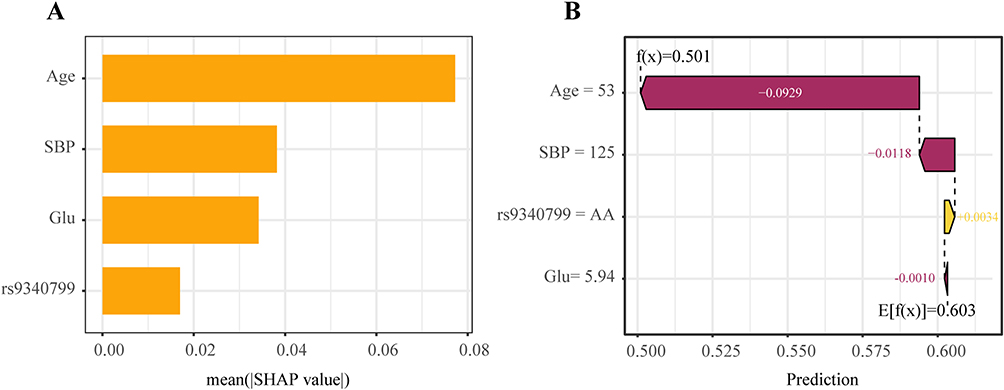 |
Figure 3 Contribution of the 4 parameters for Logistic Regression model. (A) The relative contribution of each parameter. (B) SHAP waterfall plot. SBP, systolic blood pressure. Abbreviations: Glu, glucose; SHAP, SHapley Additive exPlanations. |
External Set
To further assess the predictive model, an external validation set was used to evaluate its performance. It was performed on an independent cohort of 47 postmenopausal Han women collected from the same institution between May and June 2025. The demographic and clinical characteristics of the external cohort were comparable to those of the development cohort (P > 0.05, Supplementary Table 4). The logistic regression model achieved an AUC of 0.65 (95% CI: 0.48–0.82, Supplementary Figure 4), with sensitivity of 0.82 (0.62–0.94), specificity of 0.55 (0.32–0.77), positive predictive value (PPV) of 0.71 (0.52–0.86), negative predictive value (NPV) of 0.69 (0.41–0.89), and accuracy of 0.70 (0.55–0.83) (Supplementary Table 5). The wide 95% CI, which includes 0.50, indicates that the model’s discrimination was not statistically significantly different from chance in this small external cohort. This is likely attributable to the limited sample size, although the possibility of reduced generalizability cannot be entirely excluded. Nonetheless, further validation in larger cohorts is warranted.
Discussion
In our study, the age and menopausal duration of the case group were significantly greater than those of the control group, which is largely consistent with existing previous data.14 Research reports indicate that age is the strongest independent predictor of carotid intima-media thickness (IMT).24 The carotid IMT and plaque formation in postmenopausal women are significantly greater than those in premenopausal women.10 In addition, prolonged menopausal duration means a prolonged duration of low estrogen status. A previous hemodynamic study showed that the vascular response of postmenopausal women to acetylcholine is negatively correlated with age and menopausal duration, indicating that estrogen deficiency is a key factor leading to endothelial dysfunction.25 Estrogen deficiency leads to vascular endothelial dysfunction, upregulation of inflammatory factors, and increased oxidative stress, which collectively accelerate the development of atherosclerosis.26 These findings support the widely accepted mechanism that increasing age and prolonged menopausal duration mediate vascular injury and atherosclerosis progression through estrogen deficiency.
Elevated SBP and GLU are well-established contributors to carotid atherosclerosis. Many large cohort studies have shown that elevated systolic blood pressure is an independent risk factor for carotid atherosclerosis.27,28 Increased SBP exposes the vascular wall to greater pulsatile tensile stress. Low and oscillatory shear stress at arterial bifurcations promotes endothelial dysfunction and plaque initiation, while the elevated tensile stress from hypertension further exacerbates vascular injury.29,30 In the Swedish population, the number and area of carotid plaques in patients with prediabetes and diabetes are greater than those in individuals with normal blood glucose, suggesting that blood glucose levels are associated with greater severity of atherosclerosis.31 Even after adjusting for traditional cardiovascular risk factors, a significant correlation exists between blood glucose levels and carotid intima–media thickness (CIMT).32 The sustained expression of inflammatory genes induced by hyperglycemia (which can last for an extended period even after blood glucose returns to normal) can lead to sustained entry of monocytes into the vascular wall, promoting plaque formation.33 The elevated SBP and GLU in our case group are consistent with large-scale cohort data.14 These results emphasize that the management of blood pressure and blood glucose levels is particularly critical for the prevention of atherosclerosis in postmenopausal women.
From a clinical perspective, the inclusion of rs9340799 in the model may serve as a preliminary attempt at integrating genetic information for postmenopausal women. Although the GG genotype showed a protective effect in our univariate analysis, its contribution to the multivariable prediction model was minimal, indicating that rs9340799 does not constitute a meaningful improvement over existing clinical models; however, it may serve as a starting point for future polygenic risk models should additional variants be identified and validated. In elderly postmenopausal women, high estrogen levels in carriers of the rs9340799 AA genotype are significantly associated with the risk of ischemic arterial disease (IAD) (HR = 1.62), while there is no such association in carriers of the AG/GG genotype.34 These findings suggest potential biological links between rs9340799 and estrogen-mediated pathways; however, the clinical and mechanistic relevance of rs9340799 to carotid atherosclerosis remains uncertain. Therefore, the inclusion of rs9340799 should be considered exploratory, and whether genetic polymorphisms meaningfully enhance risk prediction for carotid atherosclerosis in postmenopausal women warrants further investigation with additional variants and larger cohorts.
In our model, age and SBP showed a moderate correlation (r = 0.43, P < 0.001), while other predictor pairs were weakly or non-significantly correlated (age–GLU r = 0.13, P = 0.075; SBP–GLU r = 0.12, P = 0.092). rs9340799 showed no significant association with any clinical variable (all P > 0.05). Therefore, some caution is warranted when interpreting the individual contributions of age and SBP, as their SHAP values may be partially interchangeable; however, the overall model prediction remains unaffected. The generally low inter-predictor correlations are unlikely to substantially affect the SHAP-based interpretation of individual feature contributions, which was intended for visualization of feature importance rather than causal attribution.
The limitations of this study include the following. First, the sample was sourced from a single-center physical examination population within a specific time period, limiting representativeness across race, region, and comorbidity distributions, which may limit external generalizability. Second, the case-control design precludes causal inference and does not allow for longitudinal outcome prediction; future studies incorporating prospective follow-up are needed to evaluate the model’s ability to predict incident carotid atherosclerosis. Third, the external validation set was small and covered only a short time period, providing limited temporal validation; moreover, its wide AUC CI crossing 0.50 means we cannot confirm that the model discriminates better than chance. Fourth, overfitting was observed in complex models such as random forest and XGBoost, underscoring the importance of overfitting assessment in model selection and supporting the choice of logistic regression for its balanced performance. Fifth, only a single ESR1 polymorphism (rs9340799) was included, and its contribution to the model was minimal, limiting the generalizability of the genetic findings. Sixth, variable selection was performed on the entire dataset before cross-validation rather than within each fold, which may introduce slight optimistic bias in model performance estimation, although independent external validation provides an unbiased assessment of generalizability. Seventh, no formal sample-size calculation was performed a priori; however, the events per variable (EPV = 29.5) exceeded the recommended minimum for logistic regression. In summary, this model should be considered preliminary, and no clinical application should be considered until validated in larger, independent, multicenter cohorts with broader populations and more comprehensive genetic data.
Conclusion
This study developed a logistic regression model that included age, systolic blood pressure, GLU and ESR1 rs9340799 genotypes. The model demonstrated moderate discrimination in predicting the risk of carotid atherosclerosis in postmenopausal Han women in northern China. This model should be considered preliminary and needs further validation in larger, independent, multicenter cohorts for identifying high-risk populations for early intervention.
Data Sharing Statement
This article includes all data generated or analyzed during the study.
Ethics Approval and Informed Consent
This study was approved by the Ethics Committee of the Second Affiliated Hospital of Dalian Medical University, and the ethical consent letter number is KY2024–151–02. Informed consent was obtained from each patient and the study protocol conforms to the ethical guidelines of the 1975 Declaration of Helsinki.
Acknowledgments
We sincerely thank all patients and participants for their contribution to this study.
Author Contributions
All authors made a significant contribution to the work reported, whether that is in the conception, study design, execution, acquisition of data, analysis and interpretation, or in all these areas; took part in drafting, revising or critically reviewing the article; gave final approval of the version to be published; have agreed on the journal to which the article has been submitted; and agree to be accountable for all aspects of the work.
Funding
This work was supported by the Department of Science and Technology of Liaoning Province (Natural Science Foundation Doctoral Research Initiation Project, grant number 2025-BSLH-105) and the Health Commission of Dalian (Dalian Medical Science Research Program, grant number 2312018).
Disclosure
The authors declare that they have no conflicts of interest in this work.
References
1. Swirski FK, Nahrendorf M. Leukocyte behavior in atherosclerosis, myocardial infarction, and heart failure. Science. 2013;339:161–11. doi:10.1126/science.1230719
2. Rossouw JE, Aragaki AK, Manson JE, et al. Menopausal hormone therapy and cardiovascular diseases in women with vasomotor symptoms: a secondary analysis of the women’s health initiative randomized clinical trials. JAMA Intern Med. 2025;185(11):1330–1339. doi:10.1001/jamainternmed.2025.4510
3. Li R, Jiang L, Wang X. Aberrant expression of miR-483-5p in patients with asymptomatic carotid artery stenosis and its predictive value for cerebrovascular event occurrence. Exp Ther Med. 2021;22(4):1101. doi:10.3892/etm.2021.10536
4. Saba L, Cau R, Vergallo R, et al. Carotid artery atherosclerosis: mechanisms of instability and clinical implications. Eur Heart J. 2025;46(10):904–921. doi:10.1093/eurheartj/ehae933
5. Guglielmi V, Compagne KCJ, Sarrami AH, et al. Assessment of recurrent stroke risk in patients with a carotid web. JAMA neurol. 2021;78(7):826–833. doi:10.1001/jamaneurol.2021.1101
6. Langhoff R, Vajda Z, Odrowaz-Pieniazek P, et al. 30-day outcomes of real-world elective carotid stenosis treatment using a dual-layer micromesh stent (ROADSAVER Study). Cardiovasc Intervent Radiol. 2025;48(4):427–437. doi:10.1007/s00270-025-04003-z
7. Musialek P, Bonati LH, Bulbulia R, et al. Stroke risk management in carotid atherosclerotic disease: a clinical consensus statement of the ESC Council on Stroke and the ESC Working Group on Aorta and Peripheral Vascular Diseases. Cardiovasc Res. 2025;121(1):13–43. doi:10.1093/cvr/cvad135
8. Bian LL, Lan AC, Zheng YK, Xue HY, Ye Q. Association between calf circumference and cardiac metabolic risk factors in middle-aged and elderly women. Heliyon. 2023;9(6):e17456. doi:10.1016/j.heliyon.2023.e17456
9. Ieamtairat P, Soontrapa S, Kaewrudee S, Promsorn J, Takong W, Somboonporn W. Difference in carotid intima-media thickness between pre and postmenopausal women. Menopause. 2019;26(1):39–44. doi:10.1097/GME.0000000000001159
10. Zhou Y, Wang D, Yang X, et al. Effect of menopausal status on carotid intima-media thickness and presence of carotid plaque in Chinese women generation population. Sci Rep. 2015;5:8076. doi:10.1038/srep08076
11. Wang M, Huang Y, Song Y, Chen J, Liu X. Study on environmental and lifestyle factors for the North-South differential of cardiovascular disease in China. Front Public Health. 2021;9:615152. doi:10.3389/fpubh.2021.615152
12. Zhao R, Zhao L, Gao X, et al. Geographic variations in dietary patterns and their associations with overweight/obesity and hypertension in China: findings from China Nutrition and Health Surveillance (2015–2017). Nutrients. 2022;14(19):3949. doi:10.3390/nu14193949
13. Tu C, Xie L, Wang Z, et al. Association between ceramides and coronary artery stenosis in patients with coronary artery disease. Lipids Health Dis. 2020;19(1):151. doi:10.1186/s12944-020-01329-0
14. Liu J, Zeng X, Ruan J, Kang Y, Lu Y, Li S. Development and validation of a predictive model for carotid atherosclerosis in postmenopausal women. Sci Rep. 2025;15(1):5079. doi:10.1038/s41598-025-89098-7
15. Taneja I, Damhorst GL, Lopez-Espina C, et al. Diagnostic and prognostic capabilities of a biomarker and EMR-based machine learning algorithm for sepsis. Clin Transl Sci. 2021;14(4):1578–1589. doi:10.1111/cts.13030
16. Taneja I, Reddy B, Damhorst G, et al. Combining biomarkers with EMR data to identify patients in different phases of sepsis. Sci Rep. 2017;7(1):10800. doi:10.1038/s41598-017-09766-1
17. Bin C, Li Q, Tang J, et al. Machine learning models for predicting the risk factor of carotid plaque in cardiovascular disease. Front Cardiovasc Med. 2023;10:1178782. doi:10.3389/fcvm.2023.1178782
18. Y E, Yao Z, Ge M, et al. Development and validation of a machine learning model for predicting vulnerable carotid plaques using routine blood biomarkers and derived indicators: insights into sex-related risk patterns. Cardiovasc Diabetol. 2025;24(1):326. doi:10.1186/s12933-025-02867-6
19. Paskulin DD, Cunha-Filho JS, Paskulin LD, Souza CA, Ashton-Prolla P. ESR1 rs9340799 is associated with endometriosis-related infertility and in vitro fertilization failure. Dis. Markers. 2013;35(6):907–913. doi:10.1155/2013/796290
20. Kobayashi S, Inoue S, Hosoi T, Ouchi Y, Shiraki M, Orimo H. Association of bone mineral density with polymorphism of the estrogen receptor gene. J Bone Mineral Res. 1996;11(3):306–311. doi:10.1002/jbmr.5650110304
21. Sowers MR, Jannausch ML, McConnell DS, Kardia SR, Randolph JF Jr. Endogenous estradiol and its association with estrogen receptor gene polymorphisms. Am J Med. 2006;119(9 Suppl 1):S16–22. doi:10.1016/j.amjmed.2006.07.002
22. Guo S, Jing Y, Li C, Zhu D, Wang W. Carotid atherosclerosis: an independent risk factor for small fiber nerve dysfunction in patients with type 2 diabetes mellitus. J Diabetes Investig. 2023;14(2):289–296. doi:10.1111/jdi.13936
23. Collins GS, Moons KGM, Dhiman P, et al. TRIPOD+AI statement: updated guidance for reporting clinical prediction models that use regression or machine learning methods. BMJ. 2024;385:e078378.
24. Merz AA, Cheng S. Sex differences in cardiovascular ageing. Heart. 2016;102(11):825–831. doi:10.1136/heartjnl-2015-308769
25. Taddei S, Virdis A, Ghiadoni L, et al. Menopause is associated with endothelial dysfunction in women. Hypertension. 1996;28(4):576–582. doi:10.1161/01.HYP.28.4.576
26. Novella S, Dantas AP, Segarra G, Medina P, Hermenegildo C. Vascular aging in women: is estrogen the fountain of youth? Front Physiol. 2012;3:165. doi:10.3389/fphys.2012.00165
27. Wang Y, Chen C, Lin Q, et al. The ratio of systolic and diastolic pressure is associated with carotid and femoral atherosclerosis. Front Cardiovasc Med. 2024;11:1353945. doi:10.3389/fcvm.2024.1353945
28. Bots ML, Hofman A, de Bruyn AM, de Jong PT, Grobbee DE. Isolated systolic hypertension and vessel wall thickness of the carotid artery. The Rotterdam Elderly Study. Arterioscleros Thrombos. 1993;13(1):64–69. doi:10.1161/01.ATV.13.1.64
29. Souilhol C, Serbanovic-Canic J, Fragiadaki M, et al. Endothelial responses to shear stress in atherosclerosis: a novel role for developmental genes. Nat Rev Cardiol. 2019;17(1):52–63. doi:10.1038/s41569-019-0239-5
30. Chen L, Qu H, Liu B, et al. Low or oscillatory shear stress and endothelial permeability in atherosclerosis. Front Physiol. 2024;15:1432719. doi:10.3389/fphys.2024.1432719
31. Östgren CJ, Otten J, Festin K, et al. Prevalence of atherosclerosis in individuals with prediabetes and diabetes compared to normoglycaemic individuals-a Swedish population-based study. Cardiovasc Diabetol. 2023;22(1):261. doi:10.1186/s12933-023-01982-6
32. Kowall B, Ebert N, Then C, et al. Associations between blood glucose and carotid intima-media thickness disappear after adjustment for shared risk factors: the KORA F4 study. PLoS One. 2012;7(12):e52590. doi:10.1371/journal.pone.0052590
33. Hanssen NMJ, Kraakman MJ, Flynn MC, Nagareddy PR, Schalkwijk CG, Murphy AJ. Postprandial glucose spikes, an important contributor to cardiovascular disease in diabetes? Front Cardiovasc Med. 2020;7:570553. doi:10.3389/fcvm.2020.570553
34. Scarabin-Carré V, Brailly-Tabard S, Ancelin ML, et al. Plasma estrogen levels, estrogen receptor gene variation, and ischemic arterial disease in postmenopausal women: the three-city prospective cohort study. J Clin Endocrinol Metab. 2014;99(8):E1539–1546. doi:10.1210/jc.2013-4472
 © 2026 The Author(s). This work is published and licensed by Dove Medical Press Limited. The
full terms of this license are available at https://www.dovepress.com/terms
and incorporate the Creative Commons Attribution
- Non Commercial (unported, 4.0) License.
By accessing the work you hereby accept the Terms. Non-commercial uses of the work are permitted
without any further permission from Dove Medical Press Limited, provided the work is properly
attributed. For permission for commercial use of this work, please see paragraphs 4.2 and 5 of our Terms.
© 2026 The Author(s). This work is published and licensed by Dove Medical Press Limited. The
full terms of this license are available at https://www.dovepress.com/terms
and incorporate the Creative Commons Attribution
- Non Commercial (unported, 4.0) License.
By accessing the work you hereby accept the Terms. Non-commercial uses of the work are permitted
without any further permission from Dove Medical Press Limited, provided the work is properly
attributed. For permission for commercial use of this work, please see paragraphs 4.2 and 5 of our Terms.