Back to Journals » Infection and Drug Resistance » Volume 19
Development and Validation of a Novel Predictive Model and Simplified Clinical Indicator for Mortality in Severe Fever with Thrombocytopenia Syndrome Patients
Received 23 October 2025
Accepted for publication 28 January 2026
Published 8 February 2026 Volume 2026:19 573018
DOI https://doi.org/10.2147/IDR.S573018
Checked for plagiarism Yes
Review by Single anonymous peer review
Peer reviewer comments 2
Editor who approved publication: Dr Hemant Joshi
Debao Shi, Yaping Pan
Department of Clinical Laboratory, The First Affliated Hospital of Anhui Medical University, Hefei, Anhui, People’s Republic of China
Correspondence: Yaping Pan, Department of Clinical Laboratory, The First Affliated Hospital of Anhui Medical University, 218 Jixi road, Hefei, Anhui, People’s Republic of China, Tel +86 551 65908075, Fax +230022, Email [email protected]
Purpose: Severe fever with thrombocytopenia syndrome (SFTS) is a highly fatal infectious disease endemic in rural areas, underscoring the need for early prognostic risk stratification.
Patients and Methods: This study aimed to develop and validate a prognostic model using readily available clinical indicators. We conducted a retrospective analysis of 260 SFTS patients (mortality rate 19.6%), integrating epidemiological characteristics, clinical symptoms and laboratory variables through a hybrid multi-model feature screening approach incorporating univariate Cox, LASSO, Random Forest, and XGBoost algorithms.
Results: Four core risk factors for mortality were identified: age ≥ 56 years, platelet count ≤ 44 × 109/L, estimated glomerular filtration rate (eGFR) ≤ 53 mL/min/1.73m2, and activated partial thromboplastin time (APTT) ≥ 66.8 seconds. Based on these factors, we developed a comprehensive prognostic model and a simplified index termed AER (APTT-to-eGFR ratio). Internal validation demonstrated excellent discriminative ability, with a C-index of 0.831 (95% CI: 0.780– 0.882) for the model and an AUC of 0.838 (95% CI: 0.782– 0.893) for the AER index. External validation further confirmed the robustness of both tools, showing no significant difference in predictive performance (p = 0.614).
Conclusion: The developed model and AER index provide valuable tools for early identification of high-risk SFTS patients, facilitating improved clinical management and resource allocation.
Keywords: severe fever with thrombocytopenia syndrome, predictive models, machine learning algorithms, activated partial thromboplastin time-to-estimated glomerular filtration rate ratio, acute kidney injury
Introduction
Severe fever with thrombocytopenia syndrome (SFTS) is an emerging infectious disease, first reported in 2009 in rural areas of central and northeastern China.1 This zoonotic disease is caused by SFTS virus, a newly recognized member of the Bandavirus genus within the Phenuiviridae family (species: Bandavirus dabieense), which is transmitted by ticks.2–6 Cases have subsequently been reported in South Korea, Japan, and Vietnam.7–9 SFTS is characterized by sudden onset with nonspecific early clinical manifestations, predominantly fever of unknown origin and fatigue. Definitive diagnosis reveals thrombocytopenia, leukopenia, and gastrointestinal symptoms. In severe cases (12–30% mortality),10 patients develop multi-organ failure presenting as shock, respiratory failure, and disseminated intravascular coagulation.11,12 Despite expanding geographical distribution,13,14 no approved vaccines or specific antiviral therapies exist. Transmission occurs not only through tick bites but also via contact with infected patients’ bodily fluids, particularly through oral and ocular membranes.15,16 Therefore, it is crucial for doctors, especially rural primary doctors, to identify patients with life-threatening conditions as early as possible.
The development of prognostic prediction models utilizing routinely available laboratory parameters accessible in primary care settings holds significant clinical utility for SFTS risk stratification. Existing studies have explored composite indices including the C-reactive protein-to-albumin ratio (CAR),17 aspartate aminotransferase-to-platelet ratio (APRI),18 and blood urea nitrogen (BUN)-to-albumin ratio (BAR),19–21 though these parameters were predominantly derived from other disease contexts with limited validation in SFTS populations and few were developed through systematic analysis of SFTS-specific risk factors. Current prediction models, such as Fang et al’s model incorporating age, multiorgan dysfunction syndrome, activated partial thromboplastin time (APTT), and D-dimer,22 and Zhong’s model utilizing age, prothrombin time (PT), BUN, and viral load,23 often demonstrate suboptimal clinical practicality due to parameter complexity. Furthermore, conventional variable selection approaches relying on univariable Cox or LASSO regression may inadequately address covariate interactions and fail to validate feature robustness through machine learning methodologies. The pathophysiological mechanisms underlying SFTS infection remain incompletely elucidated. Basic research has identified the spleen, liver, and kidneys as primary target organs of SFTSV infection.24 Previous studies predominantly relied on serum creatinine (CRE) and BUN for renal function assessment; however, these parameters exhibit delayed responsiveness and nonspecificity in reflecting glomerular filtration capacity. Notably, estimated glomerular filtration rate (eGFR), a biomarker endorsed by the Kidney Disease: Improving Global Outcomes (KDIGO) initiative for its clinical utility in standardized renal evaluation,25 is seldom incorporated into SFTS prognostic analyses.
This study aims to develop a prognostic model through integrative variable selection combining traditional regression methods with machine learning algorithms, systematically evaluating epidemiological characteristics, clinical manifestations, and laboratory parameters to identify critical predictors. The simplified model will be benchmarked against existing SFTS mortality predictors reported in the literature. The derived risk indicators may facilitate early mortality risk stratification, enabling timely clinical interventions to improve patient survival outcomes.
Materials and Methods
Study Population
This retrospective study enrolled 279 patients with suspected SFTS from the Department of Infectious Diseases at Jixi Road Campus of the First Affiliated Hospital of Anhui Medical University between January 2021 and December 2024. Case definitions strictly adhered to the Technical Guidelines for SFTS Prevention and Control (2010 edition) issued by former Ministry of Health of the People’s Republic of China,26 requiring suspected cases to meet both epidemiological criteria (at least one of: (1) occupational/recreational exposure in hilly/forested/mountainous areas during epidemic seasons; (2) tick bite within 2 weeks pre-symptom; (3) contact with infected animals/confirmed patients) and clinical manifestations. Confirmation required SFTSV nucleic acid positivity via RT-PCR or detection of virus-specific IgM/IgG antibodies. After excluding cases with severe clinical data deficiencies, hemodialysis, hematological disorders, or malignancies, 260 confirmed SFTS cases were ultimately analysed. The study was reviewed and approved by the Ethics Committee of The First Affiliated Hospital of Anhui Medical University (PJ2025-07-77). Written informed consent was waived by the same committee due to the anonymized retrospective nature of the analysis. All procedures adhered to the ethical standards of the 1964 Helsinki Declaration and its later amendments.
Data Collection and Definitions
Clinical data were extracted from participants’ electronic medical records through the Hospital Information Management System, encompassing demographics, clinical manifestations, medical history, and laboratory parameters including coagulation markers, complete blood count, and biochemical assays. In this study, the eGFR was calculated using the 4-level Race Equation of the Chronic Kidney Disease Epidemiology Collaboration (CKD-EPI), as validated for Asian populations in prior research.27 The calculation formula of eGFR is as follows: for female patients, eGFR = 151 × (0.993)age × (CRE/61.88)−0.328 when CRE ≤ 61.88 μmol/L, and eGFR = 151 × (0.993)age × (CRE/61.88)−1.210 when CRE > 61.88 μmol/L; for male patients, eGFR = 149 × (0.993)age × (CRE/61.88)−0.415 when CRE ≤ 79.56 μmol/L, and eGFR = 149 × (0.993)age × (CRE/61.88)−1.210 when CRE > 79.56 μmol/L.
External Validation
To validate the clinical applicability and generalizability of the SFTS risk prediction model and simplified index, we conducted external validation using a multi-center cohort from a peer-reviewed open dataset (doi:10.1038/s41598-024-60923-9). This validation framework incorporated 394 laboratory-confirmed SFTS cases (23.35% mortality rate) from Shandong Province, China.
Statistical Analysis
Continuous variables were assessed for normality using the Shapiro–Wilk test, with p > 0.05 indicating normal distribution. Categorical variables were presented as percentages (n, %) and compared using chi-square test or Fisher’s exact test. Normally distributed continuous variables were expressed as mean (SD) and compared with Student’s t-test, while skewed data were reported as median (IQR) with Mann–Whitney U-test for group comparisons. To ensure analytical validity and enhance data consistency, sequential mean imputation was performed only for variables with missing data ≤15%. To develop a parsimonious predictive model, variable selection was performed using four distinct approaches: univariable Cox regression (retaining variables with p < 0.05), LASSO regression (λ selected via the 1 standard error rule), random forest model (retaining the top 20 predictors ranked by Gini importance; parameters: ntree = 500, nodesize = 15), and XGBoost model (prioritizing the top 20 features based on a bootstrap presence rate > 70% and mean gain score thresholds). Variables consistently identified by all four methods through Venn diagram intersection were incorporated into the multivariable Cox regression model, with internal validation performed using the concordance index (C-index) and decision curve analysis (DCA). A predictive nomogram and Kaplan-Meier survival curves were constructed. The predictive capacity of the Cox model for SFTS mortality risk was evaluated through receiver operating characteristic (ROC) curve analysis, with optimal cutoff values determined by maximizing the Youden index. Comparative analyses between the novel Activated partial thromboplastin time-to-estimated glomerular filtration rate ratio (AER) index and established predictors (BAR, APRI, CAR) included diagnostic performance assessment based on area under the curve (AUC) comparisons. All analyses were conducted in R 4.42 software with the following packages: tableone, survival, dplyr, plyr, MASS, leaps, glmnet, survminer, riskRegression, rms, forcats, tidyverse, randomForestSRC, xgboost, ggplot2, VennDiagram, and pROC. Statistical significance was defined as p < 0.05.
Results
Demographics, Clinical Characteristics and Laboratory Parameters of Patients with SFTS
The study enrolled 260 patients diagnosed with SFTS, including 51 non-survivors and 209 survivors, yielding an overall mortality rate of 19.6%. As detailed in Table 1, comprehensive comparisons of clinical and laboratory profiles were performed between deceased and surviving patients.
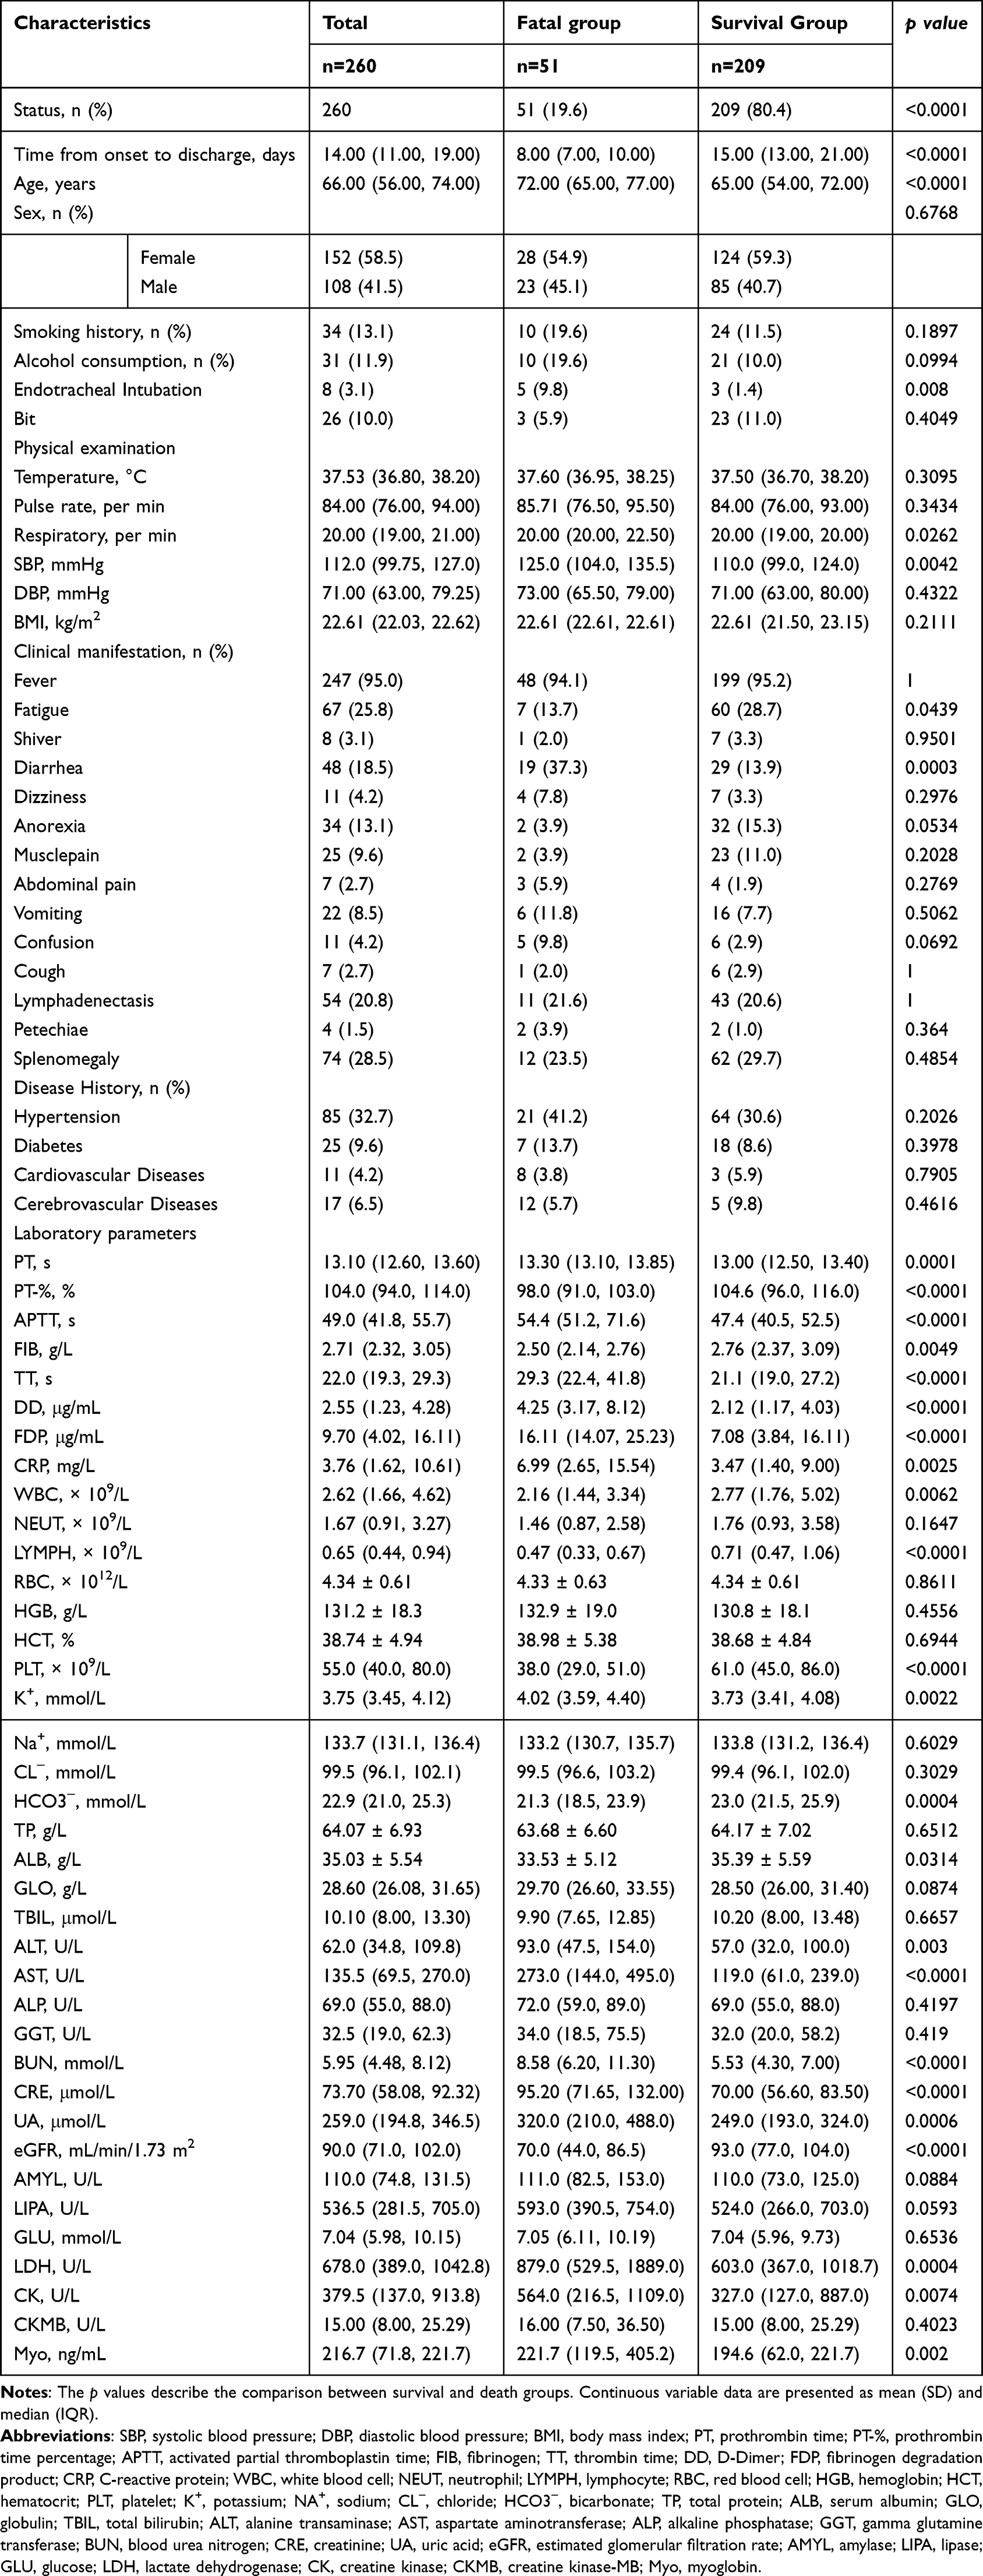 |
Table 1 Clinical and Laboratory Profiling of Severe Fever with Thrombocytopenia Syndrome (SFTS) Patients |
The cohort comprised individuals aged 30–80 years (median 66, IQR 56–74), with 41.5% males (108/260) and 58.5% females (152/260). Non-survivors demonstrated a significantly higher median age compared to survivors (72 (65–77) vs 65 (54–72), p < 0.001), while no statistically significant differences were observed in smoking history (p = 0.1897) or alcohol use history (p = 0.0994) between the two groups. Deceased patients had shorter hospitalization durations (p < 0.0001) and higher rates of endotracheal intubation (9.8% vs 1.4%, p = 0.008). Physical examination revealed elevated respiratory rates (p = 0.0262) and systolic blood pressure (p = 0.0042) in non-survivors. While fever prevalence was comparable between groups (94.1% vs 95.2%, p = 1.0), survivors reported higher fatigue incidence (28.7% vs 13.7%, p = 0.0439) and non-survivors exhibited more frequent diarrhea (37.3% vs 13.9%, p = 0.0003). Comorbidities including hypertension, diabetes, and cardiovascular/cerebrovascular diseases showed no significant associations with mortality.
Coagulation profiles demonstrated marked abnormalities in non-survivors, with significantly prolonged PT, APTT, thrombin time, and elevated D-dimer and fibrin degradation products (all p < 0.01). Conversely, survivors maintained higher prothrombin time percentage and fibrinogen levels. Hematological parameters revealed significantly lower white blood cell and lymphocyte in non-survivors (p < 0.001). Erythrocyte parameters (red blood cell, hemoglobin, hematocrit) showed no intergroup differences. Notably, thrombocytopenia was more severe in non-survivors (median platelet (PLT) 38.0 (29.0–51.0) ×109/L vs 61.0 (45.0–86.0) ×109/L, p < 0.0001). Hepatic function analysis revealed marginally lower albumin levels (p = 0.031) and significantly elevated alanine transaminase, aspartate aminotransferase levels in non-survivors (p < 0.001), though alkaline phosphatase and gamma-glutamyl transferase remained comparable. Renal dysfunction markers including BUN, CRE, uric acid, and eGFR all significantly favored survivors (p < 0.0001).
Predictor Selection and Mortality Risk Modeling
The predictive model development workflow is summarized in Table 2. From an initial cohort of 68 variables (23 categorical, 45 continuous), two traditional regression models (univariable Cox and LASSO) and two machine learning approaches (random forest, XGBoost) were employed to identify mortality predictors in SFTS patients. Univariable Cox regression identified 31 candidate predictors (p < 0.05), including clinical manifestations such as fatigue, diarrhea, confusion, and endotracheal intubation status (Figure 1A). Subsequent LASSO regression (R glmnet package) using 10-fold cross-validation with the one-standard-error rule (lambda.1se, log(λ) = −2.524) selected 8 predictors: diarrhea, age, prothrombin time percentage, APTT, PLT, eGFR, BUN, and lymphocyte (Figure 1B and C). Machine learning models retained the top 20 candidate features: random forest via Gini importance ranking and XGBoost using features with bootstrap presence rates > 70% (Figure 1D and E). Consensus variable selection through four-way Venn diagram analysis revealed four core predictors shared across all methods: age, eGFR, APTT, and PLT (Figure 1F).
 |
Table 2 Summary of Variable Screening Results from Four Predictive Models for SFTS Mortality Outcomes |
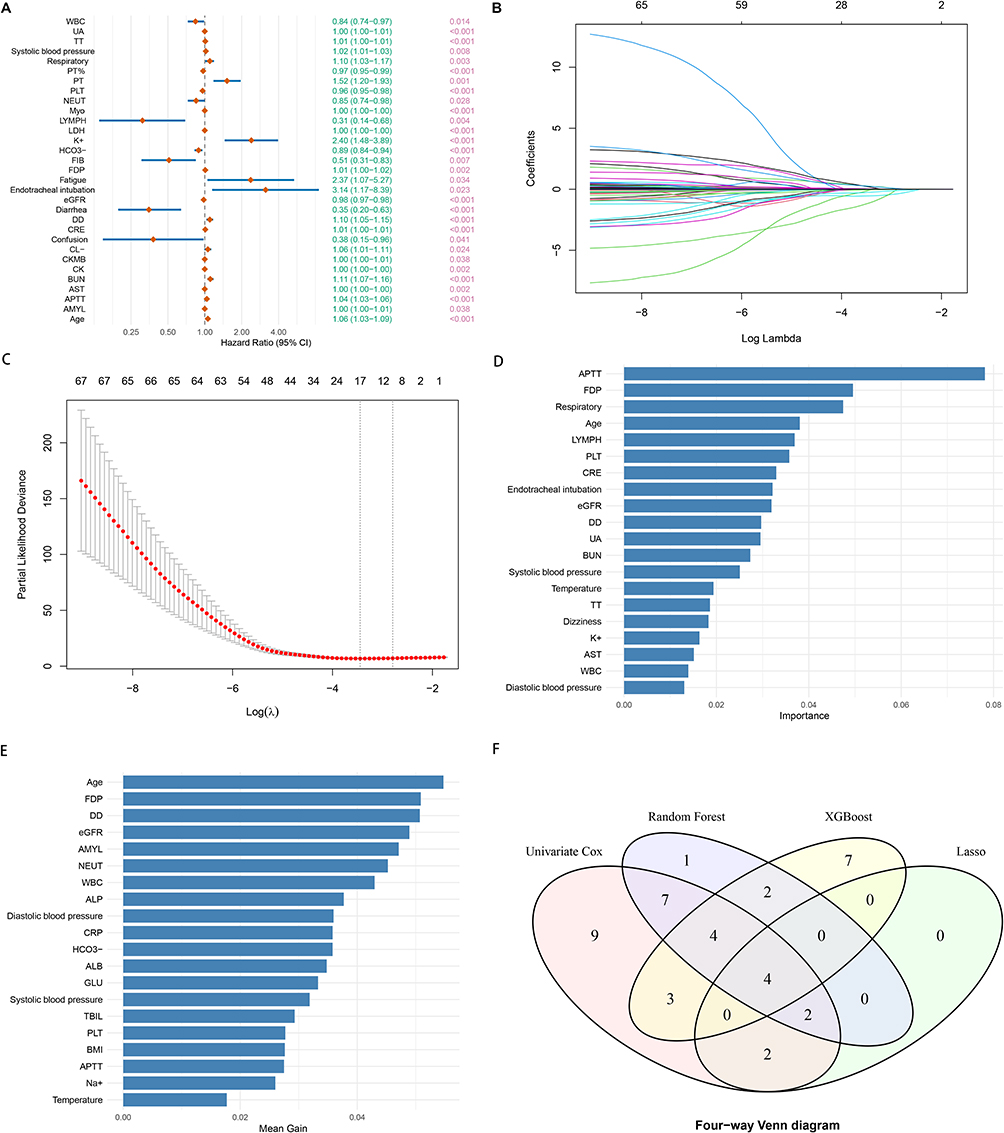 |
Figure 1 Integrated Machine Learning and Traditional Approaches for Risk Factor Identification in SFTS Mortality Prediction. (A) Primary Screening via Univariate Cox Regression. Variables significantly associated with mortality risk (Cox regression, p < 0.05) were selected as candidate features. (B) LASSO Coefficient Shrinkage Dynamics. Coefficient trajectory plot illustrating how the 68 predictors’ regression coefficients (Y-axis) evolve with increasing L1 regularization intensity (X-axis: log-transformed λ). Paths converging to zero indicate features excluded by LASSO’s sparsity constraint. (C) Regularization Parameter Optimization. Profile of partial likelihood deviance (Y-axis) versus log(λ) (X-axis). The red dotted line connects cross-validated deviance values. Vertical grey bars demarcate the optimal λ under the “1-SE rule” (λ.1se = 0.067), balancing model parsimony and predictive accuracy. (D) Random Forest Feature Prioritization. Top 20 predictors ranked by mean decrease in Gini impurity (random forest variable importance score). (E) XGBoost Feature Selection. Top 20 non-linear predictors identified through stringent thresholds: bootstrap stability (feature presence rate >70%) and mean gain score significance. (F) Consensus Predictor Identification. Four-way Venn diagram intersection of variables from 1A-1D revealed four core prognosticators: Age, eGFR, APTT, PLT. Abbreviations: PLT, platelet; eGFR, estimated glomerular filtration rates; APTT, activated partial thromboplastin time; SFTS, severe fever with thrombocytopenia syndrome. |
The four core predictors were incorporated into a multivariable Cox regression model. The age (HR=1.058, 95% CI 1.022–1.095) and APTT (HR=1.028, 95% CI 1.012–1.045) showed positive associations with mortality risk, whereas eGFR (HR=0.985, 95% CI 0.975–0.996) and PLT (HR=0.978, 95% CI 0.963–0.994) were inversely associated (Table S1). The risk prediction equation was formulated as:
Risk Score = 0.0278 × APTT (s) − 0.0147 × eGFR (mL/min/1.73 m2) + 0.0563 × Age (years) − 0.0219 × PLT (×109/L). Kaplan-Meier analysis demonstrated significantly reduced survival probabilities in patients exceeding the following thresholds (log-rank p < 0.001): APTT ≥66.8 s, age ≥56 years, eGFR ≤53 mL/min/1.73 m2, and PLT ≤44 ×109/L, all of which independently predicted mortality (Figure S1).
Internal validation revealed strong discriminative performance, with a C-index of 0.831 (95% CI 0.780–0.882), indicating an 83.1% probability of correctly stratifying mortality risk. DCA analysis demonstrated superior net clinical benefit over default strategies (treat-all or treat-none) across threshold probabilities of 20–60%, particularly for intermediate-risk patients requiring tailored therapeutic interventions to balance efficacy and risks (Figure S2A). A nomogram integrating four core predictors—eGFR, age, PLT, and APTT—was developed to quantify mortality risk in SFTS patients (Figure S3). Clinicians can estimate 7-day and 14-day survival probabilities by locating patient-specific values on each predictor’s scale, drawing vertical projections to calculate partial scores, summing these scores, and projecting the total to the corresponding probability scales. This tool facilitates rapid risk stratification, enabling timely escalation of care for high-risk patients while optimizing resource allocation in primary healthcare settings.
To enhance clinical utility, we developed the APTT/eGFR Ratio (AER), a novel composite index integrating two pivotal predictors from the multivariable Cox model. A Decision Curve Analysis (DCA) was performed for AER (Figure S2B), and the results demonstrated a net clinical benefit profile similar to that of the Risk Score. To evaluate the temporal stability of the predictive performance of the Risk Ccore and AER, we further assessed their prognostic value for mortality risk at different time points (7-day and 14-day survival). Kaplan-Meier survival analysis revealed that patients in the high-risk group had significantly lower survival rates at both 7 and 14 days compared to those in the low-risk group (all log-rank p < 0.001) (Figure S4). Cox regression analysis confirmed that both the Risk Score and AER were independent predictors of mortality at 7 and 14 days (all p < 0.001). Specifically, for each 1-point increase in the Risk Score, the 7-day mortality risk increased by 1.694-fold (HR = 2.694, 95% CI: 1.751–4.146, p < 0.001), and the 14-day mortality risk increased by 1.808-fold (HR = 2.808, 95% CI: 2.161–3.649, p < 0.001). For AER, the corresponding hazard ratios were 1.461 (95% CI: 1.09–1.958, p = 0.0113) for 7-day mortality and 1.459 (95% CI: 1.228–1.734, p < 0.001) for 14-day mortality.
These findings suggest that the Risk Score model, which integrates multidimensional information, possesses stronger discriminatory power for risk stratification. The Risk Score can thus serve as a robust comprehensive tool for rapidly identifying SFTS patients at extremely high risk of mortality within the subsequent 1–2 weeks. Meanwhile, AER, as a simple clinical indicator, also effectively signals elevated mortality risk. Although its effect size is not as strong as that of the comprehensive Risk Score, its calculation is straightforward and allows for rapid bedside assessment, offering practical value in resource-limited settings. Together, these tools provide important quantitative evidence to guide early risk stratification and clinical decision-making for SFTS patients.
Predictive Performance of ROC Curve Analysis
ROC curve analysis demonstrated superior prognostic performance of the Risk Score model (AUC=0.869, 95% CI 0.818–0.919) compared to established biomarkers including BAR (AUC=0.767), APRI (AUC=0.738), and CAR (AUC=0.640; all p < 0.05), though no statistically significant difference was observed versus AER (ΔAUC=0.031, p = 0.784) (Figure 2A and Table 3). At the optimal cutoff of 2.964, the Risk Score achieved high sensitivity (88.2%) with preserved specificity (71.8%), while AER exhibited higher specificity (84.7%) at its cutoff of 0.760. Baseline characteristics of all biomarkers are provided in Table S2. The significantly attenuated predictive accuracy of conventional biomarkers underscores the clinical superiority of this novel framework.
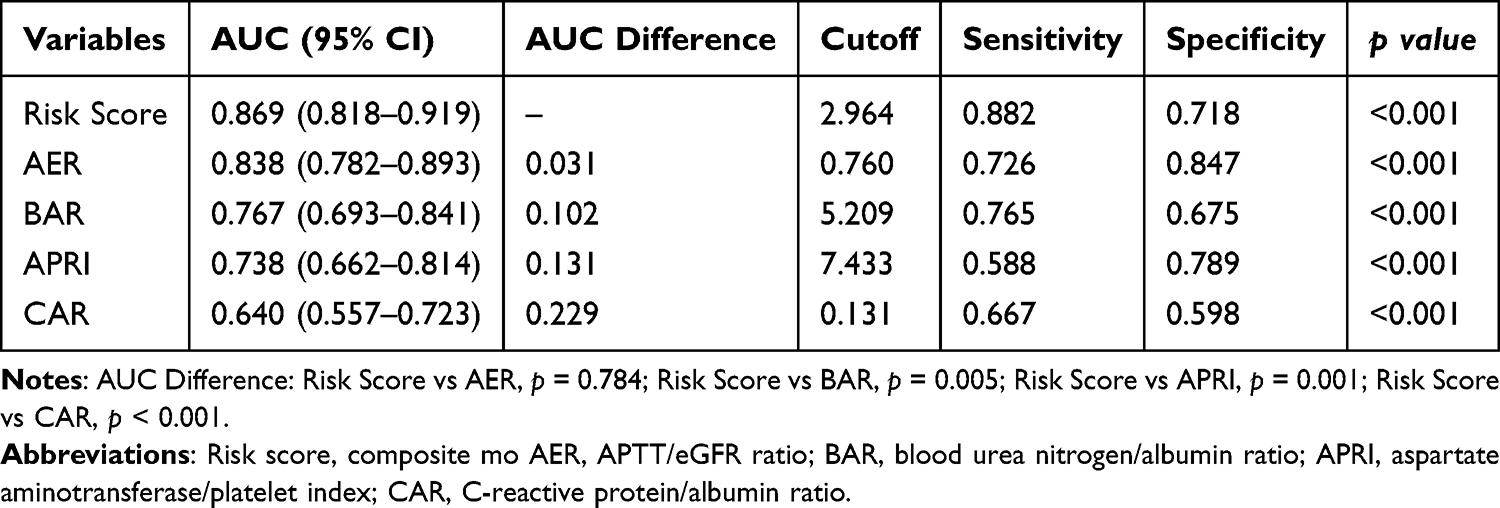 |
Table 3 Performance Comparison of Predictive Metrics for SFTS Fatal Outcomes Using ROC Curves |
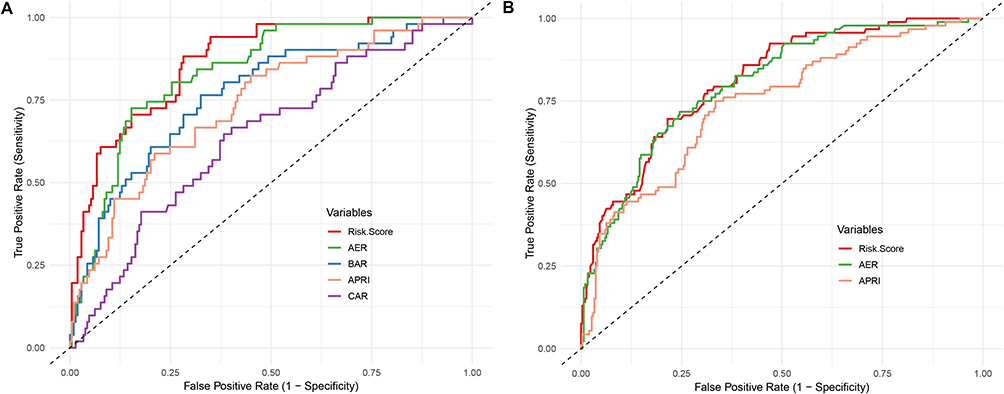 |
Figure 2 Comparative the Receiver Operating Characteristic (ROC) curve analysis of novel risk model, simplified AER index, and conventional biomarkers. (A) Model development data outcomes; (B) Validation data outcomes. Abbreviations: Risk score, composite mo AER, APTT/eGFR ratio; BAR, blood urea nitrogen/albumin ratio; APRI, aspartate aminotransferase/platelet index; CAR, C-reactive protein/albumin ratio. |
External Validation
To validate the clinical utility and the generalizability of the SFTS prognostic risk model (Risk Score) and the simplified indicator (AER), we conducted an independent validation using a publicly available dataset from a multicenter study in Shandong Province, China.22 This validation cohort comprised 394 laboratory-confirmed SFTS cases, with 92 fatalities (23.35% mortality rate), representing a distinct geographic population from our development cohort (central mountainous region vs coastal plain). The prognostic model (Risk Score) demonstrated strong discriminatory ability with an AUC of 0.812 (95% CI: 0.764–0.860) for predicting SFTS mortality. At the optimal cutoff threshold (3.095), the model achieved a sensitivity of 69.6% and specificity of 78.5%. The novel AER index showed comparable diagnostic efficacy, with an AUC of 0.802 (95% CI: 0.752–0.852). Notably, AER exhibited improved sensitivity (0.717) relative to the full model while maintaining moderate specificity (0.755). The AUC difference between the two models was negligible (ΔAUC = 0.01, p = 0.614), demonstrating their equivalent predictive power. The risk score model significantly outperformed the established APRI index (AUC = 0.743, 95% CI: 0.685–0.800, p = 0.018), underscoring the enhanced discriminatory capacity of our proposed framework (Figure 2B).
Discussion
The SFTS is an emerging viral infection characterized by acute onset, thrombocytopenia, and high mortality in severe cases. Transmission occurs primarily via tick bites, with secondary human-to-human spread through exposure to blood, secretions, or contaminated fomites, leading to cluster outbreaks. Early mortality risk prediction using routine early-stage laboratory parameters could significantly enhance clinical decision-making and prognosis optimization. This study integrated traditional survival analysis with machine learning algorithms to identify four core mortality predictors from 68 variables: age, PLT, APTT, and eGFR. These indicators are not isolated risk labels but profoundly reflect the key pathophysiological disturbances in the progression of severe SFTS.
First, advanced age (>56 years) was confirmed as an independent risk factor, consistent with the theory of immunosenescence. With aging, the efficiency of both innate and adaptive immune responses declines, potentially accompanied by a higher baseline inflammatory state.28 This may lead to weakened viral clearance capacity and a greater susceptibility to cytokine storms following SFTSV infection.
Second, severe thrombocytopenia (PLT <44×109/L) is a hallmark feature of SFTS. Its mechanism likely extends beyond simple bone marrow suppression. Studies5,6,28,29 have shown that during the early stages of infection (<14 days), pathological damage is primarily confined to the bone marrow and spleen. During this stage, the number of megakaryocytes in the bone marrow significantly increases, indicating that the body is compensating by enhancing hematopoietic function. Concurrently, the virus replicates within the red pulp macrophages of the spleen and forms complexes with platelets, triggering phagocytosis and clearance by macrophages. This mechanism directly leads to a reduction in peripheral platelets and white blood cells and may exacerbate platelet consumption through immune-mediated platelet clearance or diffuse endothelial injury. The latter is closely associated with the development of multiple organ dysfunction syndrome.
Third, significantly prolonged APTT (≥66.8 s) portends a poor prognosis. APTT measures the intrinsic coagulation pathway. Its prolongation in SFTS may reflect multiple hits: direct or indirect (via inflammatory mediators) viral effects leading to consumption and functional inhibition of coagulation factors (eg, IX, X, XI, XII), as well as decreased levels of natural anticoagulant proteins (eg, protein C, protein S).30 Other studies have also shown that in the fatal cases of Severe Fever with Thrombocytopenia Syndrome (SFTS), the vast majority of patients presented with symptoms such as ecchymosis at the puncture site and disseminated intravascular coagulation.29 This points towards a coagulopathy associated with severe systemic inflammation, akin to the process of immunothrombosis seen in sepsis, where microvascular thrombosis exacerbates tissue ischemia and organ failure.
Finally, early decline in eGFR (≤53 mL/min/1.73 m2) is a powerful predictor of mortality. The mechanisms of SFTS-associated acute kidney injury (AKI) are likely multifactorial, including direct viral attack on renal cells, prerenal injury due to hypotension, toxic substances released from rhabdomyolysis or hemolysis, and tubular damage caused by cytokine storms.31,32 As a comprehensive indicator of glomerular filtration function, a rapid decline in eGFR serves as a sensitive signal of impaired renal and even systemic perfusion and microcirculation, often preceding a significant rise in CRE thus holding crucial early warning value.
The most significant mechanistic insight of this study lies in integrating the two key pathological processes of coagulation dysfunction (prolonged APTT) and renal insufficiency (decreased eGFR) through the AER (APTT/eGFR ratio). From a pathophysiological perspective, an elevated AER may indicate a more dangerous clinical state where the patient simultaneously suffers from significant coagulation system disorder and renal function impairment. These two disturbances may share upstream driving factors, such as severe endothelial injury and uncontrolled systemic inflammatory response. Therefore, as a composite indicator, AER may better capture the overall severity of the disease than either APTT or eGFR alone, explaining its comparable predictive performance to the comprehensive risk model (which integrates age, PLT, APTT, and eGFR) (AUC: 0.838 vs 0.869).
Our methodological innovation—combining LASSO regression with machine learning (XGBoost, Random Forest) for variable screening—effectively overcomes the limitations of traditional approaches. Univariate screening is susceptible to collinearity and false positives, while LASSO, although capable of handling collinearity, struggles to capture complex nonlinear relationships. Machine learning algorithms, through variable importance rankings (eg, Gini index, mean gain), can identify complex interactions and nonlinear associations among variables. By taking the intersection via Venn diagrams, we ensured that the final selected variables are core predictors that demonstrate robustness across multiple statistical paradigms, thereby enhancing the biological interpretability and stability of the model.
Based on the mechanistic understanding above, the Risk Score nomogram and the simplified AER indicator we developed have clear pathways for clinical translation. The nomogram provides clinicians with a visual, quantifiable decision-support tool that integrates multiple continuous variables into a specific mortality risk probability. This aids in more refined risk stratification of patients, identifying high-risk individuals who require immediate intensive care or enhanced treatment.
In contrast, the value of AER lies in its convenience and efficiency. It requires only two routine, rapidly available laboratory tests (APTT and CRE for eGFR calculation) and can be quickly computed at the bedside or in the emergency department. In resource-limited primary care settings or during the initial stages of an outbreak when diagnostic capacity is insufficient, AER can serve as an effective early triage tool. When the AER value exceeds the critical threshold of 0.76, it should strongly alert clinicians to the patient’s high risk of short-term deterioration, prompting consideration for early referral to a center with treatment capabilities.
Several limitations warrant consideration: although eGFR calculations strictly followed the CKD-EPI Asian population-specific equation (recommended by KDIGO), systematic comparisons with alternative eGFR formulas were omitted. Practical constraints prevented the inclusion of cystatin C measurements, which hold critical value for early renal impairment assessment and creatinine-cystatin C combined eGFR algorithms. Additionally, the absence of baseline eGFR data precluded accurate quantification of AKI-related eGFR decline severity in SFTS patients. The clinical implications emphasize that dynamic eGFR monitoring serves as an essential early warning system for acute renal failure in SFTS management. The AER index, incorporating both coagulation abnormalities and renal dysfunction parameters, demonstrates exceptional prognostic value for mortality outcomes. Continuous AER monitoring enables timely diagnosis and therapeutic intervention, thereby potentially reducing case fatality rates. Despite the inherent limitations of this study’s sample size and single-center design, external validation has reinforced the clinical robustness and cross-institutional transferability of the constructed risk model and simplified indicators. Future directions necessitate large-scale, multicenter randomized controlled trials to validate these findings and establish robust evidence-based guidelines for clinical decision-making.
Conclusion
This study not only identified key predictors of mortality in SFTS patients but also elucidated the pathophysiological significance of the interplay between coagulation dysfunction and renal impairment, thereby providing a mechanistic basis for risk stratification. The comprehensive risk model and the simplified AER indicator we developed offer novel tools for SFTS prognosis management, addressing the dual dimensions of “precision” and “accessibility”. These tools are particularly valuable for early identification of high-risk patients, timely warning of acute kidney injury, and guiding tiered interventions in resource-limited settings, ultimately contributing to improved clinical outcomes for this significant emerging infectious disease.
Disclosure
The authors report no conflicts of interest in this work.
References
1. Yu XJ, Liang MF, Zhang SY, et al. Fever with thrombocytopenia associated with a novel bunyavirus in China. New Engl J Med. 2011;364:1523–12. doi:10.1056/NEJMoa1010095
2. Seo J-W, Kim D, Yun N, et al. Clinical update of severe fever with thrombocytopenia syndrome. Viruses. 2021;13:1213. doi:10.3390/v13071213
3. ICTV. ICTV taxonomy history: SFTS virus. Available from: https://talk.ictvonline.org/taxonomy/p/taxonomy-history?taxnode_id=20141803&src=NCBI&ictv_id=20141803(ICTV, 2020).
4. Chen C, Li J, Zhou Y, et al. Latest advances and prospects in the pathogenesis, animal models, and vaccine research of severe fever with thrombocytopenia syndrome virus. Front Immunol. 2025;16:1624290. doi:10.3389/fimmu.2025.1624290
5. Sun H, Hu Q, Lu S, et al. Current status of severe fever with thrombocytopenia syndrome in China (Review). Int J Mol Med. 2025;56(5):1–17. doi:10.3892/ijmm.2025.5610
6. Peng C, Hao Y, Yuan Y, et al. Bandavirus dabieense: a review of epidemiology, clinical characteristics, pathophysiology, treatment and prevention. Virulence. 2025;16:2520343. doi:10.1080/21505594.2025.2520343
7. Kim K-H, Yi J, Kim G, et al. Severe fever with thrombocytopenia syndrome, South Korea, 2012. Emerg Infect Dis. 2013;19. doi:10.3201/eid1911.130792
8. Takahashi T, Maeda K, Suzuki T, et al. The first identification and retrospective study of severe fever with thrombocytopenia syndrome in Japan. J Infect Dis. 2014;209:816–827. doi:10.1093/infdis/jit603
9. Tran XC, Yun Y, Van An L, et al. Endemic severe fever with thrombocytopenia syndrome, Vietnam. Emerg Infect Dis. 2019;25:1029–1031. doi:10.3201/eid2505.181463
10. Xu N, Wen S, Yao Y, et al. Two-transcript signature for differentiation and clinical outcomes in severe fever with thrombocytopenia syndrome (SFTS) patients: a double-blind, multicenter, validation study. J Clin Microbiol. 2025;63:e0128224. doi:10.1128/jcm.01282-24
11. Li H, Lu Q-B, Xing B, et al. Epidemiological and clinical features of laboratory-diagnosed severe fever with thrombocytopenia syndrome in China, 2011–17: a prospective observational study. Lancet Infect Dis. 2018;18:1127–1137. doi:10.1016/S1473-3099(18)30293-7
12. Yang T, Huang H, Jiang L, et al. Overview of the immunological mechanism underlying severe fever with thrombocytopenia syndrome (Review). IntJ Mol Med. 2022;50. doi:10.3892/ijmm.2022.5174
13. Etheart MD, Kligerman M, Augustin PD, et al. Effect of counselling on health-care-seeking behaviours and rabies vaccination adherence after dog bites in Haiti, 2014–15: a retrospective follow-up survey. Lancet Glob Health. 2017;5:e1017–e1025. doi:10.1016/S2214-109X(17)30321-2
14. Lin T-L, Ou S-C, Maeda K, et al. The first discovery of severe fever with thrombocytopenia syndrome virus in Taiwan. Emerg Microbes Infect. 2020;9:148–151. doi:10.1080/22221751.2019.1710436
15. Liu Y, Li Q, Hu W, et al. Person-to-person transmission of severe fever with thrombocytopenia syndrome virus. Vector-Borne Zoonotic Dis. 2012;12:156–160. doi:10.1089/vbz.2011.0758
16. Zhou C-M, Qi R, Qin X-R, et al. Oral and ocular transmission of severe fever with thrombocytopenia syndrome virus. Infect Med. 2022;1:2–6. doi:10.1016/j.imj.2021.12.002
17. Liu Z, Zhang R, Zhou W, et al. High levels of C-reactive protein-to-albumin ratio (CAR) are associated with a poor prognosis in patients with severe fever with thrombocytopenia syndrome in early stage. J Med Virol. 2022;94:5375–5384. doi:10.1002/jmv.27972
18. Zhang K, Tan YH, Cao KL, et al. Aspartate transferase-to-platelet ratio (APRI): a novel predictor of fatal outcome in patients with SFTS. J Infect. 2023;87:465–468. doi:10.1016/j.jinf.2023.03.012
19. Wang Y, Qin LH, Zhang K, et al. Blood urea nitrogen to albumin ratio is a novel predictor of fatal outcome for patients with severe fever with thrombocytopenia syndrome. J Med Virol. 2024;96:e29731. doi:10.1002/jmv.29731
20. Wu J, Shen X. Blood urea nitrogen to albumin ratio could be used to predict clinical outcome for patients with severe fever with thrombocytopenia syndrome. J Med Virol. 2024;96:e29933. doi:10.1002/jmv.29933
21. Cao K, Ma A, Zhang K, et al. Blood urea nitrogen–to–serum albumin ratio predicts fatal outcomes in severe fever with thrombocytopenia syndrome patients. Am JTrop Med Hyg. 2024;111:113–120. doi:10.4269/ajtmh.23-0811
22. Fang K, Song X, Bo J. A nomogram to predict mortality in patients with severe fever with thrombocytopenia syndrome. Sci Rep. 2024;14:10627.
23. Zhong F, Lin X, Zheng C, et al. Establishment and validation of a clinical risk scoring model to predict fatal risk in SFTS hospitalized patients. BMC Infect Dis. 2024;24. doi:10.1186/s12879-024-09898-6
24. Jin C, Liang M, Ning J, et al. Pathogenesis of emerging severe fever with thrombocytopenia syndrome virus in C57/BL6 mouse model. Proc Natl Acad Sci U S A. 2012;109:10053–10058. doi:10.1073/pnas.1120246109
25. Kidney Disease: Improving Global Outcomes (KDIGO) CKD Work Group. Kidney disease: improving global outcomes CKDWG. KDIGO 2024 clinical practice guideline for the evaluation and management of chronic kidney disease. Kidney Int. 2024;105:S117–S314. doi:10.1016/j.kint.2023.10.018
26. Ministry of Health of People’s Repubic of China. National guideline for prevention and control of severe fever with thrombocytopenia syndrome (2010 edition). Chin J Clin Infect Dis. 2010;4:193–194.
27. Stevens LA, Claybon MA, Schmid CH, et al. Evaluation of the chronic kidney disease epidemiology collaboration equation for estimating the glomerular filtration rate in multiple ethnicities. Kidney Int. 2011;79:555–562. doi:10.1038/ki.2010.462
28. Müller L, Di Benedetto S. How immunosenescence and inflammaging may contribute to hyperinflammatory syndrome in COVID-19. Int J Mol Sci. 2021;22(22):12539. doi:10.3390/ijms222212539
29. Hou H, Zou S, Wei W, et al. Kinetics and prognostic significance of laboratory markers in patients with severe fever with thrombocytopenia syndrome: insight from a comprehensive analysis. J Infect Dis. 2024;229:1845–1855. doi:10.1093/infdis/jiad426
30. Xia Y, Jia B, Chen Y, et al. Clinical value of coagulation parameters in predicting the severity of severe fever with thrombocytopenia syndrome. Front Microbiol. 2024;15. doi:10.3389/fmicb.2024.1335664
31. Zhang Z, Hu X, Jiang Q, et al. Clinical characteristics and outcomes of acute kidney injury in patients with severe fever with thrombocytopenia syndrome. Front Microbiol. 2023;14:1236091. doi:10.3389/fmicb.2023.1236091
32. Zhang Z, Hu X, Du Q, et al. Rhabdomyolysis in severe fever with thrombocytopenia syndrome: associations with acute kidney injury and mortality. J Med Virol. 2024;96:e70095. doi:10.1002/jmv.70095
 © 2026 The Author(s). This work is published and licensed by Dove Medical Press Limited. The
full terms of this license are available at https://www.dovepress.com/terms
and incorporate the Creative Commons Attribution
- Non Commercial (unported, 4.0) License.
By accessing the work you hereby accept the Terms. Non-commercial uses of the work are permitted
without any further permission from Dove Medical Press Limited, provided the work is properly
attributed. For permission for commercial use of this work, please see paragraphs 4.2 and 5 of our Terms.
© 2026 The Author(s). This work is published and licensed by Dove Medical Press Limited. The
full terms of this license are available at https://www.dovepress.com/terms
and incorporate the Creative Commons Attribution
- Non Commercial (unported, 4.0) License.
By accessing the work you hereby accept the Terms. Non-commercial uses of the work are permitted
without any further permission from Dove Medical Press Limited, provided the work is properly
attributed. For permission for commercial use of this work, please see paragraphs 4.2 and 5 of our Terms.