Back to Journals » Clinical Epidemiology » Volume 14
Development and Validation of a Nordic Multimorbidity Index Based on Hospital Diagnoses and Filled Prescriptions
Authors Kristensen KB ![]() , Lund LC, Jensen PB, Broe A
, Lund LC, Jensen PB, Broe A ![]() , Rotbain E
, Rotbain E ![]() , Damkier P
, Damkier P ![]() , Pottegård A
, Pottegård A ![]() , Andersen JH
, Andersen JH ![]() , Højlund M, Olesen M
, Højlund M, Olesen M ![]() , Rasmussen L, Hansen MR
, Rasmussen L, Hansen MR ![]() , Ernst MT, Wesselhoeft R, Henriksen DP, Reilev M, Bliddal M
, Ernst MT, Wesselhoeft R, Henriksen DP, Reilev M, Bliddal M ![]() , Hallas J
, Hallas J ![]()
Received 10 December 2021
Accepted for publication 6 April 2022
Published 27 April 2022 Volume 2022:14 Pages 567—579
DOI https://doi.org/10.2147/CLEP.S353398
Checked for plagiarism Yes
Review by Single anonymous peer review
Peer reviewer comments 4
Editor who approved publication: Professor Henrik Toft Sørensen
Kasper Bruun Kristensen,1 Lars Christian Lund,1 Peter Bjødstrup Jensen,1 Anne Broe,1 Emelie Rotbain,2 Per Damkier,1,3,4 Anton Pottegård,1 Jacob Harbo Andersen,1 Mikkel Højlund,1,5 Morten Olesen,1 Lotte Rasmussen,1 Morten Rix Hansen,1,3,4 Martin Thomsen Ernst,1 Rikke Wesselhoeft,1,6 Daniel Pilsgaard Henriksen,3 Mette Reilev,1 Mette Bliddal,1,7 Jesper Hallas1
1Clinical Pharmacology, Pharmacy and Environmental Medicine, Department of Public Health, University of Southern Denmark, Odense, Denmark; 2Department of Hematology, Odense University Hospital, Odense, Denmark; 3Department of Clinical Pharmacology, Odense University Hospital, Odense, Denmark; 4Department of Clinical Research, University of Southern Denmark, Odense, Denmark; 5Department of Psychiatry Aabenraa, Mental Health Services in the Region of Southern Denmark, Aabenraa, Denmark; 6Child and Adolescent Psychiatry Odense, Mental Health Services in the Region of Southern Denmark, Odense, Denmark; 7Research Unit OPEN, Department of Clinical Research, University of Southern Denmark, Odense, Denmark
Correspondence: Jesper Hallas, Clinical Pharmacology, Pharmacy and Environmental Medicine, Department of Public Health, University of Southern Denmark, J.B. Winsløws Vej 19, 2, Odense, 5000, Denmark, Tel +4565503010, Email [email protected]
Purpose: To develop the Nordic Multimorbidity Index (NMI), a multimorbidity measure specifically suited to the Nordic health and administrative registry data based on current diagnosis, treatment, and coding practices.
Methods: The NMI was developed to predict 5-year mortality in a population-based cohort of randomly sampled Danish residents aged ≥ 40 years (n = 425,087) followed from 2013 to 2018. Included predictors were selected from hospital diagnoses and filled drug prescriptions based on a combination of subject matter knowledge and a data-driven approach using backwards elimination. The performance of the NMI was assessed in a temporal validation cohort of Danish residents followed from 2007 to 2012 and in six cohorts of new users of selected drugs. The discriminative performance of the NMI, Charlson Comorbidity Index (CCI) and the Elixhauser Comorbidity Index (ECI) was assessed using the c-statistic from logistic regression models with 5-year mortality as dependent variable and the multimorbidity index score, age, and sex as independent variables.
Results: The NMI included 50 predictors. In the temporal validation cohort, the c-statistic of the NMI (0.887, 95% CI 0.883– 0.890) exceeded that of the CCI (0.871, 95% CI 0.868– 0.874) and ECI (0.866, 95% CI 0.863– 0.870). In all new user cohorts, the NMI outperformed the other indices with c-statistics ranging from 0.781 (95% CI 0.779– 0.784) to 0.838 (95% CI 0.834– 0.842).
Conclusion: The NMI predicted 5-year mortality in a general Danish population and six cohorts of new users of selected drugs and was superior to the CCI and ECI. The NMI could be preferred over these indices to quantify the level of multimorbidity for, eg, descriptive purposes or confounding control. The NMI should be validated in other patient populations and other Nordic countries.
Keywords: multimorbidity, comorbidity, pharmacoepidemiology, prognosis, risk score
Introduction
Routinely collected administrative and healthcare data have been used for decades to assess safety of drugs and other medical interventions and play an increasing role in the evaluation of drug efficacy and treatment.1,2 However, in non-randomized studies, confounding has to be accounted for. While routinely collected healthcare data often provide detailed information on diagnoses and prescriptions, measures of the general physical condition and health of a given individual are rarely available. Comorbidity or multimorbidity indices are often used as proxies hereof by aggregating a range of conditions into a single numerical variable. They are easy to apply and provide a standardized summary of a range of health-related conditions. The most commonly used indices are the Charlson Comorbidity Index (CCI) developed in 1987 to predict 1-year mortality in hospitalized patients and the Elixhauser Comorbidity Index (ECI) developed in 1998 to predict in-hospital mortality, length of hospital stay, and hospital charges.3,4 The CCI included 19 weighted medical conditions and has since been adapted to use with administrative data by assigning ICD-9 and ICD-10 codes to the conditions and combining leukemia and lymphoma with any malignancy resulting in 17 conditions.5–9 The ECI originally included 30 comorbidities as dichotomous variables describing the presence of a given condition. In 2009, van Walraven et al assigned weights to 21 of the Elixhauser conditions based on their association with in-hospital mortality.10 There are several reasons that these and other indices may not perform optimally in summarizing morbidity in the general population of the Nordic countries. The Nordic countries provide a unique data source for health research with individual level data on, among others, hospital diagnoses and prescription drug use.11 These data are not necessarily identical to data collected by manual chart review since the underlying data infrastructure is different, eg, hospital diagnoses are likely influenced by geographical coding practices. Further, the CCI and ECI were developed on hospitalized patients in North America, limiting the generalizability of these indices to a general population in the Nordic countries. Lastly, since the development of the CCI and ECI, diagnosis, treatment, and prognosis of many conditions have changed substantially. For example, survival in HIV-positive individuals dramatically changed upon introduction of reverse transcriptase-inhibitors in 1996,12 the prognosis of many cancers has improved,13 and mortality rates have decreased in patients with diabetes.14
A general multimorbidity index designed specifically for use in the Nordic countries does not exist. The Nordic countries provide a unique setting for pharmacoepidemiologic research due to their nationwide individual-level registries and for providing government-funded universal taxed-based health care.11 With the increasing use of Nordic registry data to evaluate safety and effectiveness of drugs and other medical interventions,15 we aimed to develop a multimorbidity index that reflects current clinical practice and data infrastructure in the Nordic countries.
Materials and Methods
We developed the Nordic Multimorbidity Index (NMI) based on the ability to predict 5-year mortality in the Danish population aged 40 years and older. A list of candidate variables was identified by clinical review of all hospital diagnoses and prescription drugs with a prevalence above 1 in 1000 individuals and, from these, the final predictors were selected using backwards elimination. A total of 50 predictors were included, and the NMI was calculated as a single numeric score by summing the weights of each predictor. The performance of the NMI was assessed in a temporal validation cohort and in six cohorts of new users of selected drugs and compared to the performance of the CCI and ECI.
Data Sources
In Denmark, health care services are provided through a tax-funded health care system with coverage for all residents. All residents in Denmark have been assigned a unique personal identification number since 1968 allowing for individual level linkage across the Danish health and administrative registries.16 The Danish National Patient Register contains information on all in-patient visits since 1978 and all outpatient visits, emergency room visits, and psychiatric contacts since 1995. From 1994 and onwards, diseases have been classified according to the International Classification of Diseases (ICD)-10 system.17 The Danish National Prescription Registry contains data on all prescription drugs dispensed at outpatient pharmacies since 1995.18 Drug substances were classified according to the 2020 WHO Anatomical Therapeutic Chemical (ATC) Classification System in this study.19
Population
The study population consisted of a random 20% sample of all Danish individuals born in 1977 or before. This population was split randomly assigning 75% of the individuals to a development cohort (2013–2018) and the remaining 25% to a temporal validation cohort (2007–2012).
The development cohort was created by assigning a random index date between Jan 1, 2013 to Dec 31, 2013 to everyone and including individuals alive and aged 40 years or older at the index date. To allow for complete covariate assessment, we required continuous Danish residency 5 years prior to the index date. Individuals were followed from the index date until death, migration, or end of follow-up 5 years after the index date, whichever occurred first. Individuals who migrated during follow-up were excluded.
The temporal validation cohort was created by assigning a random index date to everyone between Jan 1, 2007 and Dec 31, 2007 applying the same eligibility criteria as the development cohort. Thus, the validation cohort was separated in time, serving as a validation of the model across calendar time and assessment of transportability of the index over time.
Next, we constructed six validation cohorts of new users of selected drugs aiming to imitate typical study populations in pharmacoepidemiologic studies. The source population for the new user cohorts were all Danish individuals born in 1953 or before. We identified new users of six drug classes: bisphosphonates (ATC code: M05BA, M05BB), long-acting muscarinic antagonists (LAMA, ATC code: R03BB04–R03BB07), low-dose oral methotrexate (ATC code: L04AX03), statins (ATC code: C10AA), urate lowering drugs (ATC code: M04AA), and warfarin (ATC code: B01AA03). New users during 2004 to 2013 were included, and cohort entry was defined by the first ever prescription fill. To allow for complete covariate assessment, individuals who did not reside in Denmark continuously 5 years prior to cohort entry were excluded. Individuals were followed until death, migration, or end of follow-up 5 years after cohort entry. Individuals who migrated during follow-up were excluded.
Outcome
We developed the NMI to predict 5-year all-cause mortality. This time span was chosen to capture conditions reflecting mild-to-moderate multimorbidity that will not necessarily influence short-term mortality and because a non-hospitalized, general population has a long life expectancy despite of multimorbidity.
Candidate Predictors
Potential predictors included filled prescriptions at community pharmacies and primary and secondary diagnoses from in- and outpatient hospital visits. Prescription fills were recorded in the 6-months period prior to the index date, while diagnoses were recorded 5 years prior to the index date. The presence of a diagnosis or prescription fill was defined as one or more diagnoses/prescription fills during the respective assessment windows. A 5-year assessment window for diagnoses was chosen to avoid overlap between development and validation periods and to ensure identical look-back periods for each cohort. We applied a shorter assessment window of 6 months for prescriptions to capture current drug use, as former use may represent conditions that are no longer present.
To assemble a list of clinically relevant candidate predictors with face validity, all codes with a prevalence above 1 in 1000 in the development cohort were assessed by three medical doctors (DPH, MR, and KBK). For this purpose, prescriptions were truncated to the fourth ATC level which depicts the chemical subgroup of the drug, eg, C10AA: HMG CoA reductase inhibitors (statins), and ICD-10 codes were truncated to the first three characters designating the category of the diagnosis, eg, I10: Essential (primary) hypertension. We did not consider the ICD chapters: O00-O99; Pregnancy, childbirth, and the puerperium, R00-R99; Symptoms, signs, and abnormal clinical and laboratory findings, not elsewhere classified, S00-T99; Injury, poisoning, and certain other consequences of external causes, and Z00-Z99; Factors influencing health status and contact with health services. ATC and ICD-10 codes were not included as candidate predictors if they were imprecisely defined, did not reflect diseases or chronic conditions, were not expected to meaningfully predict mortality, or were otherwise thought to have low face validity, eg, ICD-10 code K92: Other diseases of digestive system and ATC code R01AX: Other nasal preparations. Selected ICD-10 codes were combined to a single group, eg, J12-J18 were combined to the group “Pneumonia”. The grouping of ICD-10 codes was guided by existing suggested or validated coding algorithms for the Danish registries.17,20 We allowed conditions with a prevalence below 1 in 1000 to be included in groups when these were deemed to belong naturally to that group, eg, I72: Other aneurysm and dissection was included in the group “Aneurysm and dissection of aorta and other arteries” even though its prevalence was below 1 in 1000. We used ICD-10 codes with four digits when relevant, eg, K221: Ulcer of esophagus was included with K25-K28 in the group “Peptic ulcers”. Likewise, selected ATC codes were combined by either truncating to the third level of the ATC code or by combining relevant codes, eg, R03AC02–R03AC05 were combined to the group “Short-acting beta agonists”.
To explore the discrimination of each of the candidate predictors and their strength of association with age, we plotted the c-statistic from a logistic regression model with the predictor and age as independent variables and 5-year mortality as dependent variable according to the strength of correlation between the predictor and age expressed by Pearson’s correlation coefficient.
Development of the NMI
To construct a multimorbidity index that was easy to communicate and apply in research, we used a combination of subject matter knowledge and a data-driven approach for predictor selection. First, candidate predictors were selected and grouped based on review by three medical doctors as described above. We then used a backwards elimination approach, where age (numeric), sex, and the identified candidate predictors were included as independent variables in a logistic regression model with death within 5-years as dependent variable. The predictor with the highest p-value was eliminated whereafter the model was refitted with the remaining predictors. This process was repeated until 50 predictors (in addition to age, sex, and the intercept) remained. This number of predictors was chosen as a trade-off between a simple index that is feasible to implement while still achieving a high predictive performance. The c-statistic to discriminate 5-year mortality was plotted against the number of predictors in the model to visualize loss of discrimination as the number of predictors was reduced.
To ease communication and use of the NMI, we assigned weights to each of the selected 50 predictors by multiplying the beta-coefficient by ten and rounding to the nearest integer.21 The NMI score was then calculated for each individual as the sum of the weights for all predictors that were present before the index date (6 months for prescriptions and 5 years for diagnoses).
Performance
We assessed the performance of the model in the development cohort, the temporal validation cohort and the six new user cohorts by fitting a logistic regression model with 5-year mortality as dependent variable and the NMI (numeric), age (numeric), and sex as independent variables and estimating the predicted probability of death within 5 years for each individual. The performance of ECI and CCI was similarly estimated by fitting a logistic regression model with 5-year mortality as dependent variable and the CCI/ECI (numeric), age (numeric), and sex as independent variables and estimating the predicted probability of death for each individual from this model. The same covariate assessment window was used to define the CCI/ECI conditions, ie, diagnoses within 5 years before the index date. The CCI was defined according to ICD-10 coding definitions based on Quan et al 2005 (Appendix A), and the original weights for the CCI comorbidities were used.3,8 In a sensitivity analysis, we examined whether the updated CCI weights developed by Quan et al in 2011 performed better than the original weights with regard to discrimination (Appendix A).9 We fitted logistic regression models with age, sex and the CCI scores with the original and the updated weights and then used the CCI weighting algorithm with the highest concordance (c)-statistic for comparison to the NMI. The Elixhauser comorbidities were defined according to ICD-10 coding definitions based on Quan et al 2005 using the van Walraven weighting algorithm (Appendix B).8,10
Discrimination, the ability to discriminate individuals with an outcome from those without the outcome, was assessed using the c-statistic that quantifies the ability to assign higher probabilities to patients who died than to patients who survived. The c-statistic is equal to the area under the receiver operating curve for binary outcomes.22 The values range from 0.5 corresponding to an uninformative model to 1 corresponding to a model with perfect concordance and, although the interpretation of the c-statistic is context dependent, as a rule of thumb values less than 0.7 can be considered poor, values in the range 0.7 to 0.8 can be considered acceptable, and values above 0.8 can be considered excellent.23 The c-statistic was the main performance measure of interest since good discrimination is usually the most relevant quality for research purposes.22 C-statistics with 95% confidence intervals were calculated using the DeLong method.24,25 We assessed discriminative performance for 5-year mortality and, secondarily, for 1- and 2-year mortality. Discriminative performance for 1- and 2-year mortality was assessed similarly by estimating predicted probabilities of death by fitting a logistic regression model with the NMI (using the original weights developed to predict 5-year mortality), age, and sex as independent variables and 1- or 2-year mortality as dependent variables.
Calibration of the NMI was assessed by comparing observed and predicted 5-year mortality by levels of the NMI score. To compare the predicted and observed mortality rates, the NMI was categorized by grouping adjacent NMI scores for each cumulative percentile of 2% from the lowest NMI to the highest. We calculated exact binomial 95% confidence intervals around the observed 5-year mortality proportion in each NMI category.26
Other
Statistical programming was conducted using Stata version 17.0, R version 4.1.2 and R Studio version 2021.09.1+372.27–29
Results
Study Cohorts
The development cohort included 425,087 individuals (Supplemental Materials Figure S1). The median age was 58 years, and 48% were males. Baseline characteristics are shown in Table 1. A total of 38,301 individuals (9.0%) died during the 5-year follow-up period. The temporal validation cohort included 134,545 individuals with a median age of 58 years, 48% males, and a 5-year mortality of 9.6%. The six new user validation cohorts were older, had a higher 5-year mortality ranging from 12.9% to 34.8%, and had more diagnoses and prescription fills compared to the development cohort (Supplemental Materials Table S1 and Figure S2).
 |
Table 1 Baseline Characteristics of the Development and Temporal Validation Cohort |
Potential Predictors
In the development cohort, 526 diagnoses and drugs had a prevalence above 1 in 1000 individuals. After clinical review, this list was reduced and combined to 150 candidate predictors (Supplemental Materials Table S2).
In the univariate analyses of each of these candidate predictors (including adjustment for age), the highest discriminative ability was seen for high-ceiling diuretics, mental and behavioral disorders due to alcohol, chronic lower respiratory diseases and failure, and pneumonia (Supplemental Materials Figure S3). All above mentioned predictors were positively associated with age except mental and behavioral disorders due to alcohol.
Included Predictors and the NMI
The 50 predictors of the NMI selected using the backwards elimination algorithm are shown in Table 2 along with their beta-coefficients and weights. The c-statistic for the model with 50 predictors (0.892) was nearly identical to the c-statistic (0.894) for the full model with all 150 candidate predictors (Supplemental Material Figure S4). The assigned weights of the 50 predictors ranged from −3 to 22. The NMI scores ranged from −5 to 94 with a mean of 3.1 in the development cohort, where approximately half of the population had a score of zero (Table 3). The distribution of the NMI was similar in the temporal validation cohort. In the new user cohorts, the mean NMI score ranged from 5.0 in the statin cohort to 11.0 in the LAMA cohort, and the proportion of individuals with a score of zero ranged from 9% in the LAMA cohort to 30% in the statin cohort.
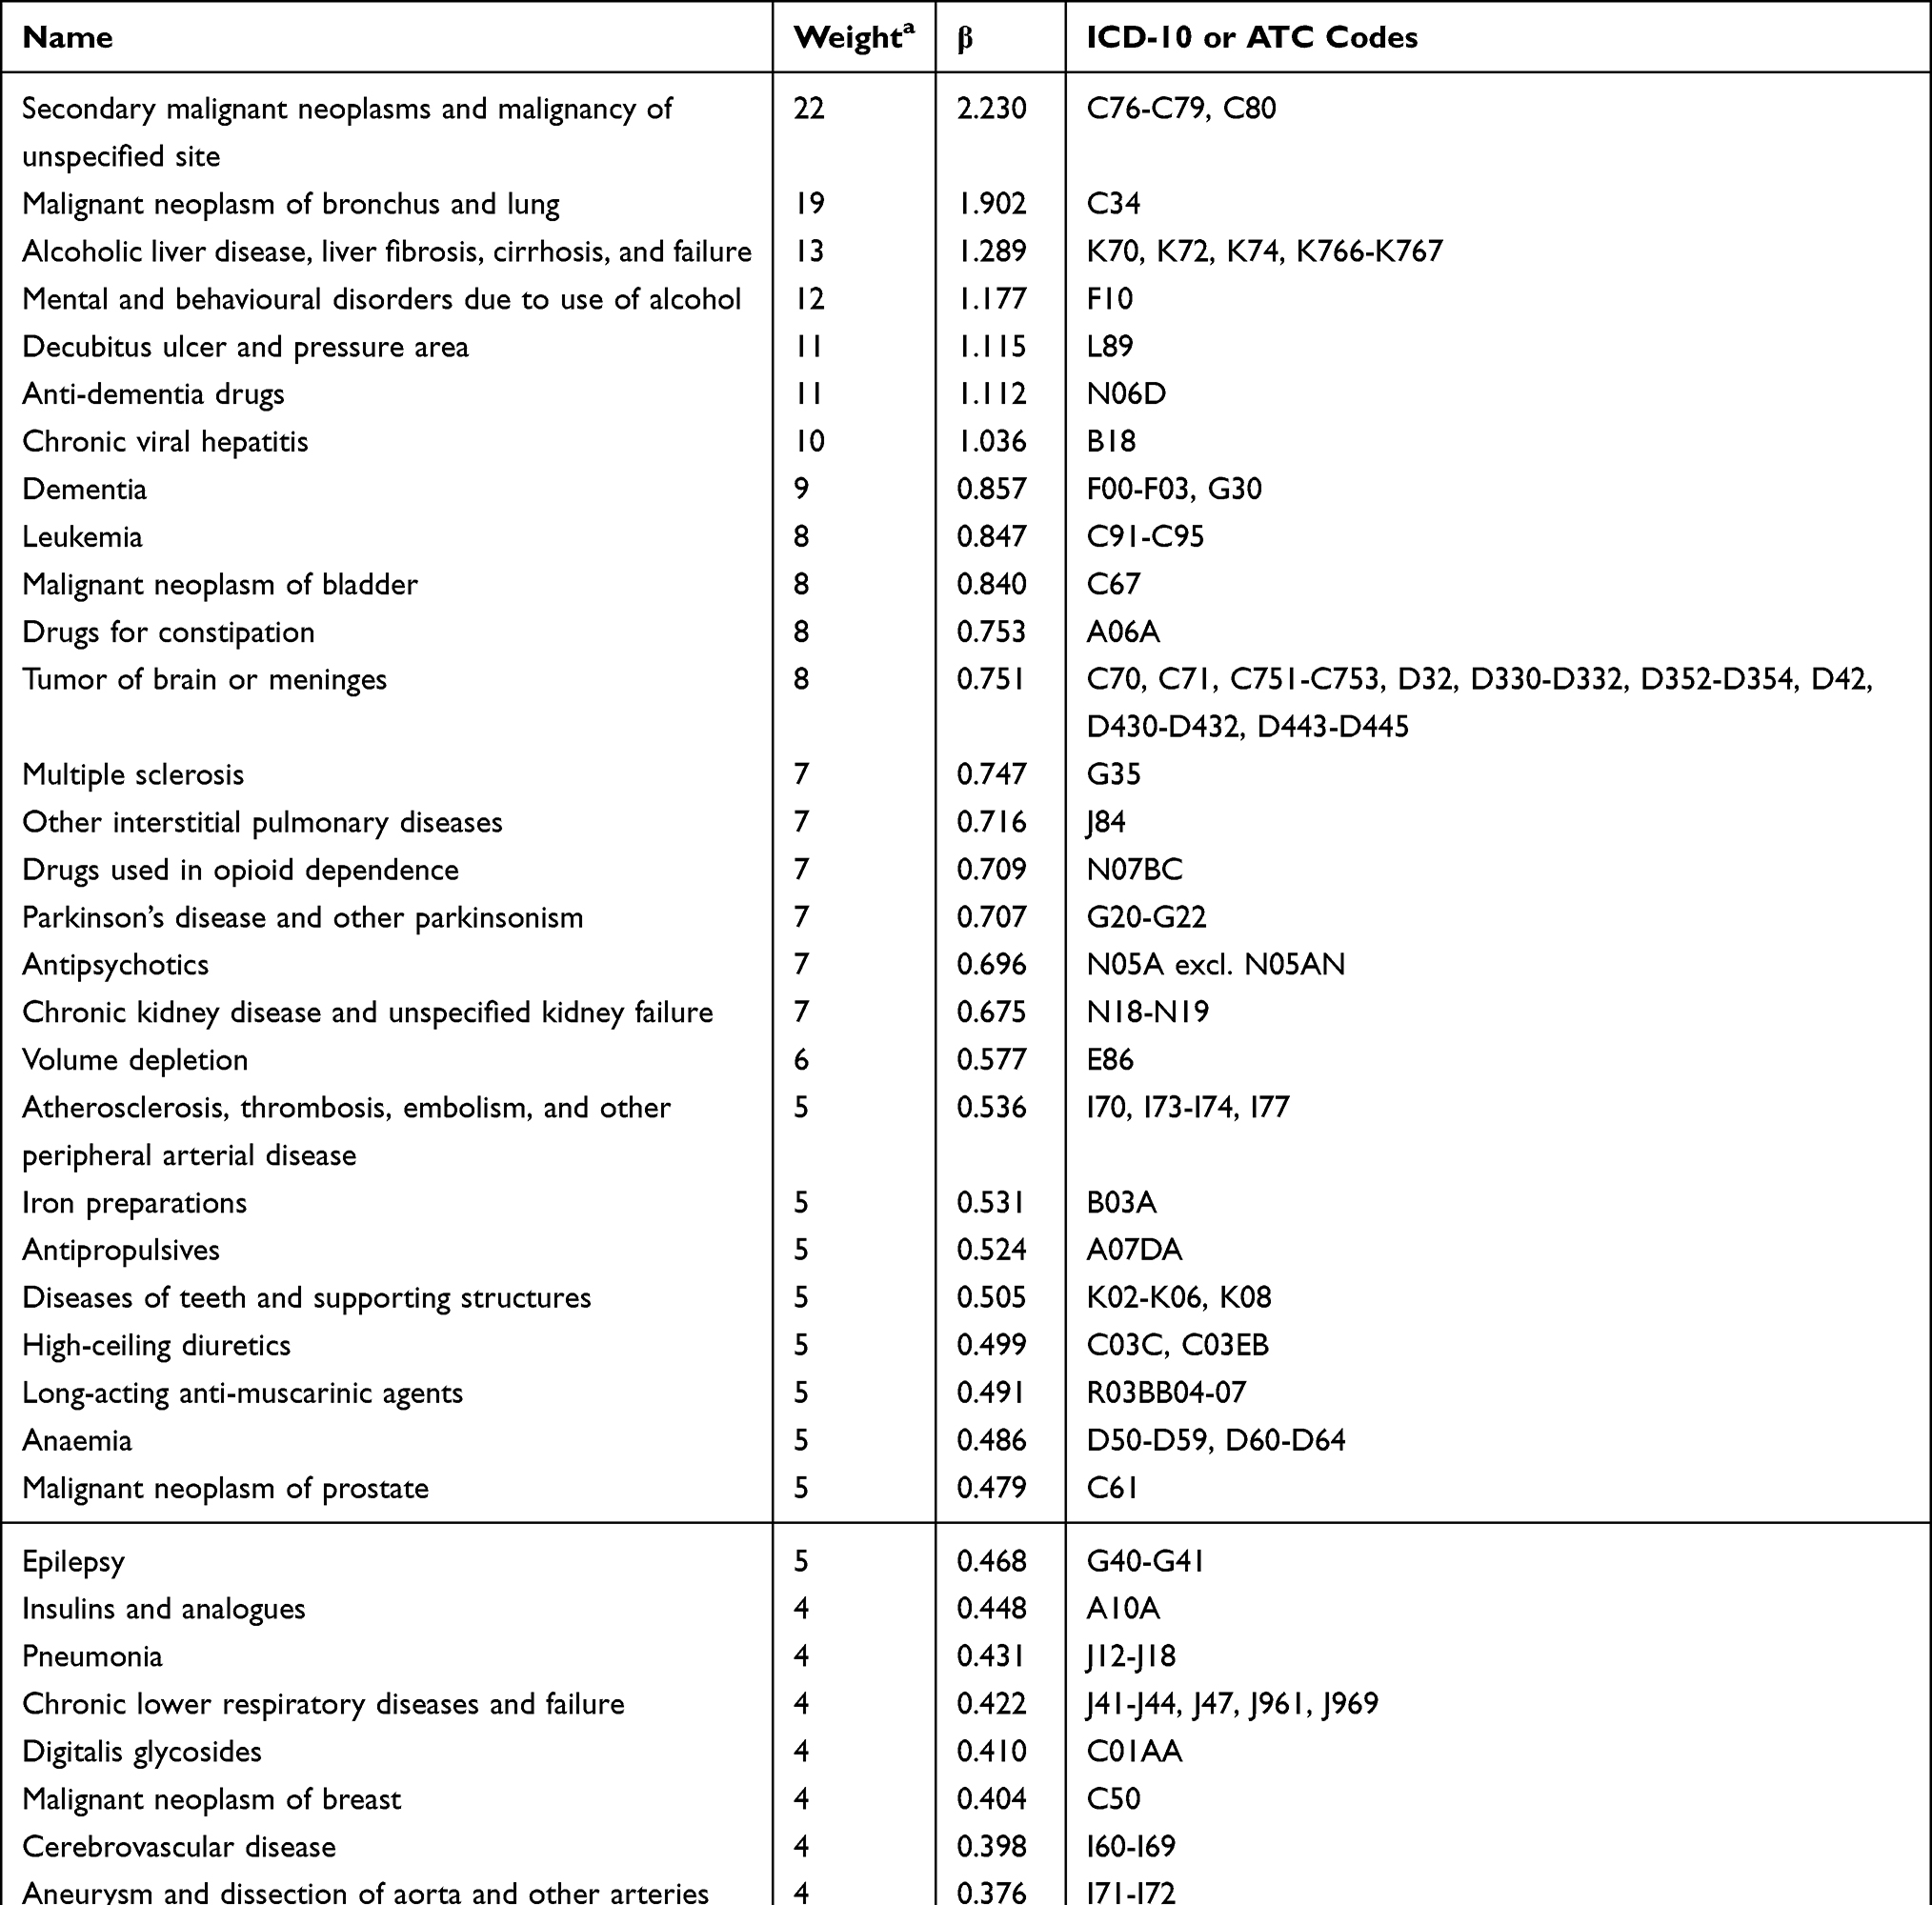 |
Table 2 Included Entities, Beta-Coefficients, and Weights in the Nordic Multimorbidity Index |
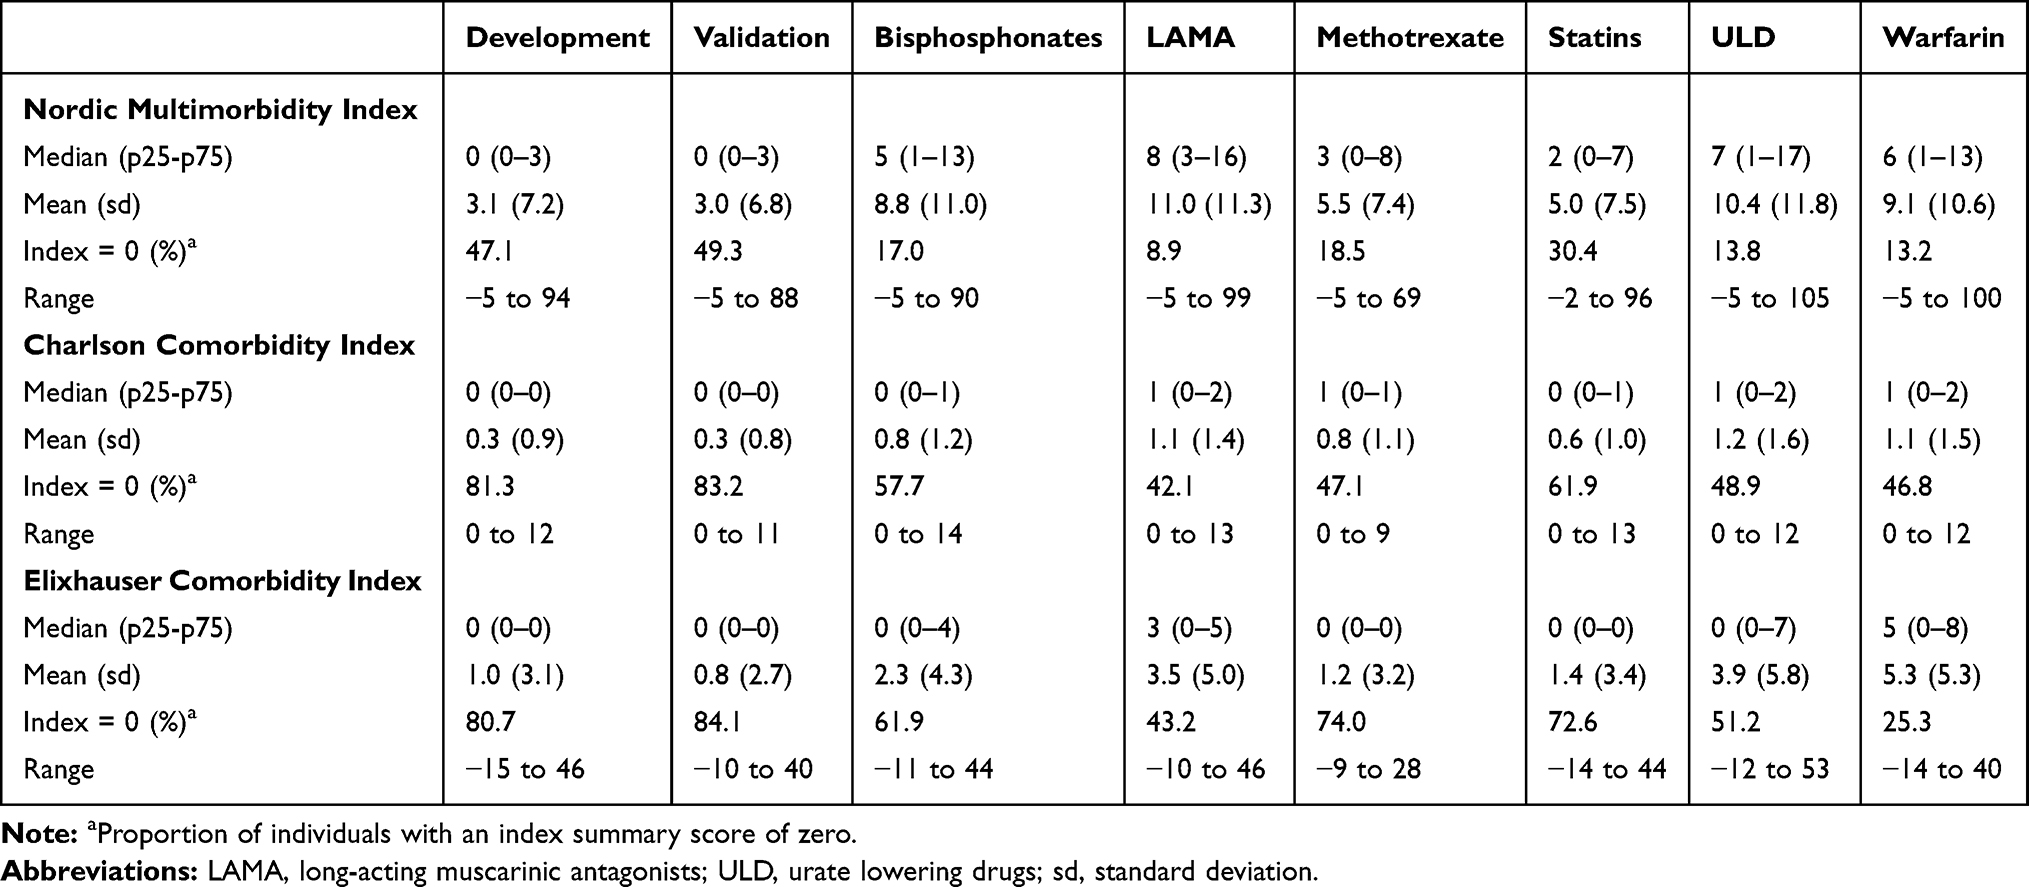 |
Table 3 Distribution of Index Summary Scores in the Development and Validation Cohorts |
The CCI score ranged from 0 to 12 with a mean of 0.3 in the development cohort where 81% had a CCI score of zero (Table 3). For the ECI score, the mean was 1.0 in the development cohort, and 81% had a score of zero.
Performance
The c-statistic for the NMI in the temporal validation cohort was 0.887 (95% CI 0.883–0.890) for 5-year mortality (Table 4). Discrimination improved with 1- and 2-year mortality as outcomes, eg, the c-statistic for 1-year mortality was 0.900 (95% CI 0.894–0.906). The NMI added to the discriminative ability compared to a model with age and sex alone where the c-statistic was 0.846, 95% CI 0.842–0.850 (Figure 1 and Supplemental Materials Figure S5). The c-statistic for the NMI exceeded that of the CCI and ECI for 1-, 2-, and 5-year mortality eg, the c-statistic for the CCI to predict 5-year mortality was 0.871 (0.868–0.874). For the new-user cohorts, the c-statistic for the NMI ranged from 0.781 (95% CI 0.779–0.784) in the LAMA cohort to 0.838 (95% CI 0.834–0.842) in the urate lowering drug cohort. In the new user cohorts, the c-statistic of the NMI exceeded that of sex and age alone as well as the CCI and ECI for 1-, 2- and 5-year mortality (Table 4).
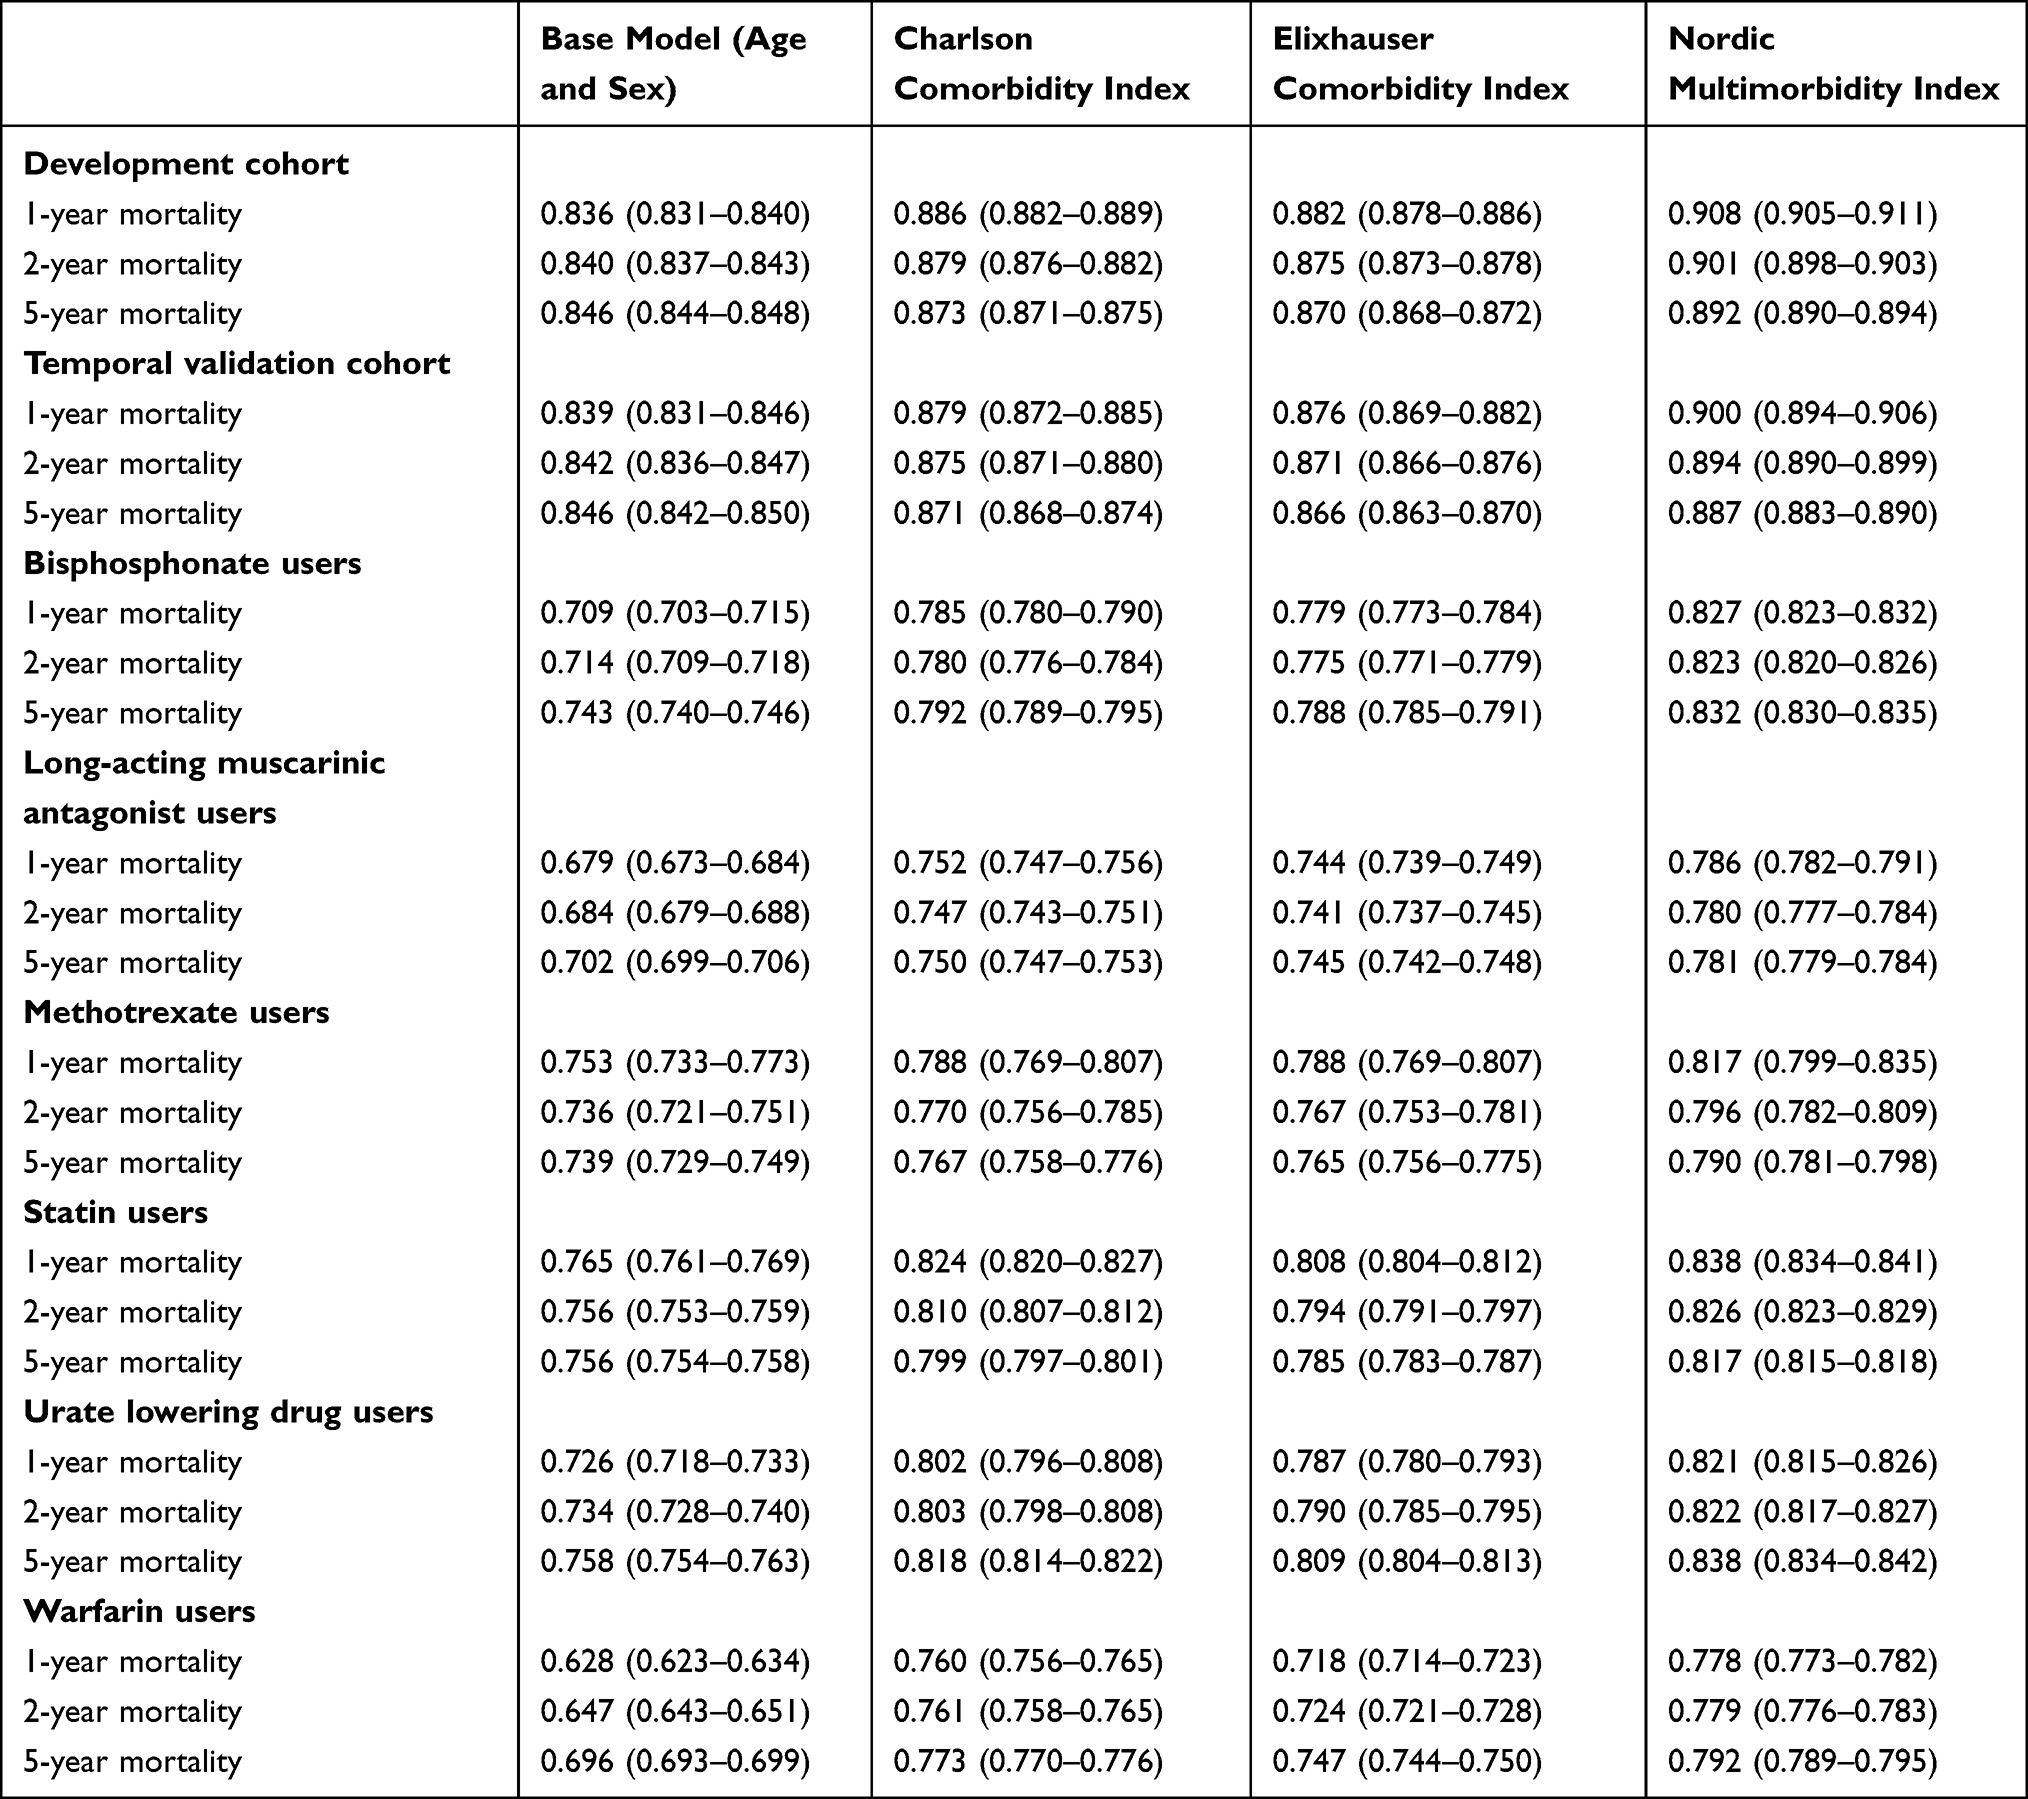 |
Table 4 The c-Statistic with 95% Confidence Intervals for 1-, 2-, and 5-Year Mortality for the Base Model (Age and Sex) and the Base Model in Addition to the Charlson Comorbidity Index, the Elixhauser Comorbidity Index, and the Nordic Multimorbidity Index |
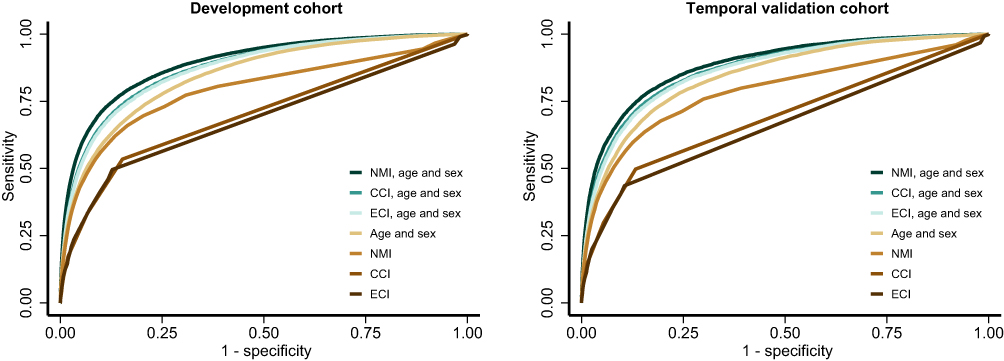 |
Figure 1 ROC curves for 5-year mortality for the Charlson Comorbidity Index (CCI), the Elixhauser Comorbidity Index (ECI), and the Nordic Multimorbidity Index (NMI) with and without the base model (age and sex). |
We examined whether discrimination of the CCI improved when updated weights were used in a sensitivity analysis. This was not the case with a c-statistic for 5-year mortality in the validation cohort of 0.869 (95% CI 0.866 to 0.873) for the updated weights compared to the c-statistic for the original weights of 0.871 (95% CI 0.868 to 0.874).
The agreement between the expected and predicted 5-year mortality rates (ie, calibration) for the NMI was high in the temporal validation cohort as well as the new user cohorts (Figures 2 and 3).
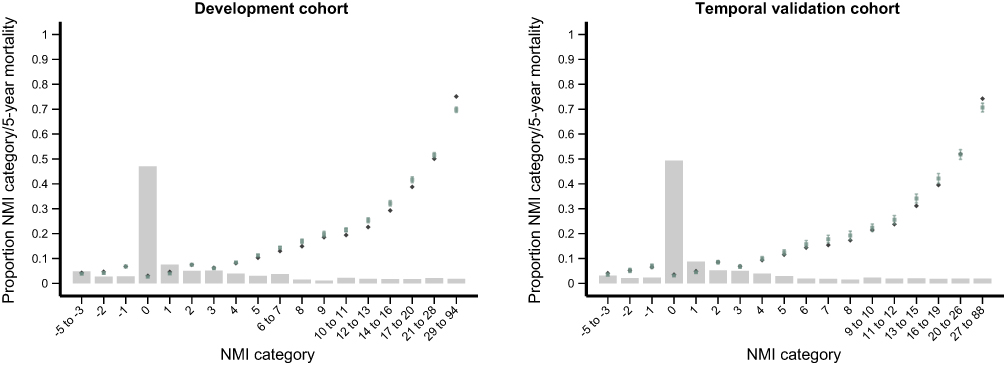 |
Figure 2 Calibration of the Nordic Multimorbidity Index (NMI) for predicting 5-year mortality in the development cohort and temporal validation cohort. Note: The bar chart displays the proportion of individuals within each NMI category and the observed (green squares with 95% confidence intervals) and predicted (blue diamonds) 5-year mortality for each NMI category. |
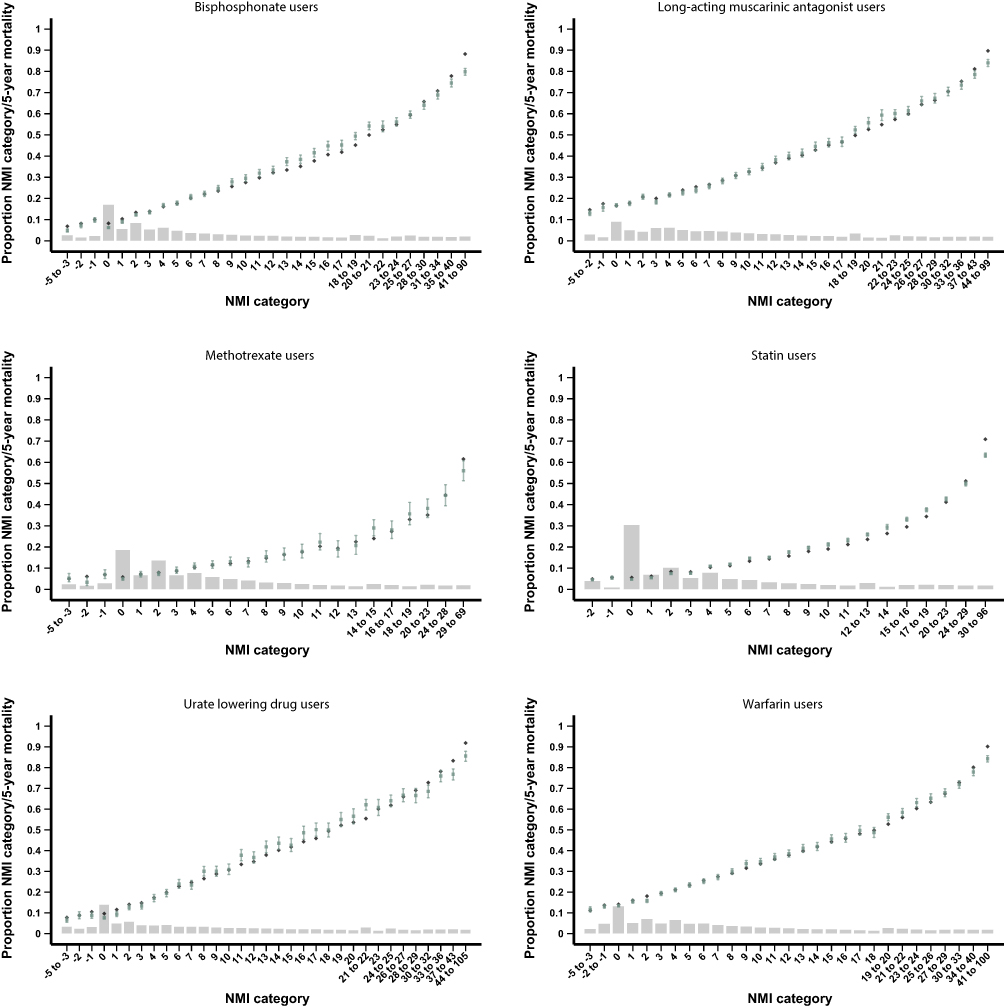 |
Figure 3 Calibration of the Nordic Multimorbidity Index (NMI) for predicting 5-year mortality in the new user validation cohorts. Note: The bar chart displays the proportion of individuals within each NMI category and the observed (green squares with 95% confidence intervals) and predicted (blue diamonds) 5-year mortality for each NMI category. |
Discussion
We developed a multimorbidity index, the Nordic Multimorbidity Index (NMI), specifically suited to the comprehensive and population-wide Nordic health- and administrative registries. The NMI score showed good performance in both the general population and in new users of selected drugs and was superior to the CCI and ECI with regard to discriminative ability. The c-statistics were higher for the NMI for 5-year mortality as well as 1- and 2-year mortality and even though the differences in c-statistics appear small, slight improvements in the c-statistics can substantially improve control of confounding bias.30 The NMI is as easily applied as the CCI and ECI, so this increased performance comes at no additional cost to the researcher. A statistical code example to calculate the NMI including the used ICD-10 and ATC codes is available online (https://pharmacoepi.sdu.dk/nmi/).
The NMI differs from the CCI and ECI in several ways that are likely to contribute to the observed increased performance of the NMI compared to existing indices. First, the NMI was developed in the general population in Denmark rather than hospitalized patients in North America. These populations differ with regard to, among others, age, ethnicity, prevalence of chronic conditions, and mortality rate. Second, the NMI was developed in a cohort followed from 2013 to 2018, while the CCI weights were derived based on patients hospitalized in 1984 and the used ECI weights were based on patients hospitalized between 1996 and 2008.10 It is likely that changes in prognosis of conditions over time may also explain some of the observed differences in performance between the NMI, CCI, and ECI. It is also likely that the data infrastructure and coding practice differ between the Nordic countries and North America and that these have changed over time. Third, the weight derivation methods differed between the indices. The NMI weights were derived by multiplying the beta coefficients by ten and rounding to the nearest integer, while, eg, for the ECI, the weights for each condition was its coefficient divided by the coefficient with the smallest absolute value.10 Fourth, the NMI includes prescription drug use, while the CCI and ECI only include chronic conditions defined by diagnosis codes. By including prescription drug use, a wider array of conditions with potential impact on overall mortality are captured presumably increasing predictive performance. Of the 50 items in the NMI, 21 were prescription drugs. Prescription drug data are readily available in the prescription databases for all Nordic countries.15 Since the vast majority of drugs in Denmark are prescribed in the primary care sector, ie, outside of hospitals,31 the individuals that are typically included in pharmacoepidemiologic studies are probably better represented by the general population than by hospitalized patients. The patient registries of the Nordic countries do not include diagnoses from the primary care sector and by including prescription drugs in the NMI, we were able to include data on treatment and hence the presence of chronic conditions from both the primary care sector and the hospital setting. Fifth, the main outcome of 5-year mortality as opposed to in-hospital mortality may be better suited to capture the impact of less acute and milder comorbidities and serve as a more general marker of the underlying health state and multimorbidity. Finally, the distribution of the NMI, CCI and ECI scores differed notably. The proportion of individuals with a score of zero was high for the CCI and ECI, and the poorer performance in these could partly be explained by the zero-inflated distribution of these scores.
Several comorbidity and multimorbidity indices are available besides the CCI and ECI. For example, the Combined Comorbidity Index that combines Charlson and Elixhauser conditions and has been shown to outperform the CCI and ECI.32 It was outside the scope of this study to compare the performance of the NMI to all existing multimorbidity indices, and we chose the CCI and ECI for comparison due to their widespread use.33 The main rationale for developing the NMI was the lack of an index developed and validated in the Nordic setting with tax-supported universal health care and a long-standing tradition for health and administrative registries and availability of prescription drug data from primary care.11,15
The NMI was developed with the purpose to provide a summary score to adjust for confounding by multimorbidity in research and to describe the multimorbidity level of populations in a standardized way. Multimorbidity or comorbidity summary scores are extensively used in health research as they are simple to use, and a single score can substitute the individual comorbidity variables for confounder adjustment reducing the number of parameters that is included in the model allowing for adjustment of more confounding variables than otherwise possible and, in small datasets, reducing the risk of overfitting.34 The use of multimorbidity summary scores as a means of adjusting for confounding also has its limitations. If the study population differs from the population that was used to derive the multimorbidity score, the performance may be inferior compared to directly adjusting for the individual components of the score. It has been argued that study-specific weights should be estimated, ie, that coefficients for each multimorbidity variable should be estimated directly using the study sample.34 Further, effective means of confounder adjustment exist, including propensity scores and disease risk scores that should be preferred when possible. Multimorbidity scores remain useful when high-dimensional approaches are unfeasible, eg, in studies with small sample sizes, in studies with many potential confounders compared to sample size, or in studies where computational efficiency is a concern such as hypothesis-free drug-outcome screening studies. Depending on the study where the NMI is intended to be used, it may be necessary to review the individual items included in the NMI to avoid items closely related to the exposure under investigation, eg, in a study on effects of statin use, the item statins should be omitted from the NMI.
It is important to note that the derived weights of the predictors should not be interpreted causally. For example, the negative weight of −3 for use of statins should not be interpreted as a protective effect of statins towards 5-year mortality. The negative weight may be driven by the joint model (the other variables included in the model) or reflect prescribing practices where healthier patients with long life expectancy are preferably prescribed statins. Similarly, the high positive weight given to drugs for constipation should not be interpreted as an intrinsic toxicity of laxatives but likely reflects constipation as a frequent manifestation in individuals with multimorbidity. This lack of causal interpretation should not be regarded as a limitation. The overarching purpose of NMI is to capture multimorbidity and while the clinical concept of multimorbidity is somewhat elusive in register-based research, a record of, eg, laxative use might capture some of it.
We did not validate the NMI in an external cohort but performed an in-depth validation of a population separated in time and in six new user cohorts representing study populations of typical pharmacoepidemiologic studies. The NMI was developed using Danish registry data and therefore based on coding and treatment practice in Denmark. Even though the structure of registries in the Nordic countries is highly similar, national differences in ICD-10 coding practices and implementation and subsidizing of drugs are likely and should be considered when applying the model to data from other Nordic countries. Further, the NMI may perform differently in selected subpopulations. Thus, the NMI should be validated further in other specific populations and in other Nordic countries.
In conclusion, we developed a multimorbidity score based on current clinical and coding practice in Denmark. The score had a high predictive performance and was superior to the Charlson and Elixhauser comorbidity indices. The NMI can be used as a confounder summary score and to describe the multimorbidity level in epidemiological studies.
Ethics Approval and Informed Consent
The study was approved by the University of Southern Denmark (reference no 10.891). Ethical approval is not required for register-based studies in Denmark.
Funding
KBK was funded by the Independent Research Fund Denmark (grant 8020-00176B) and the Research Fund of the Region of Southern Denmark (grant 17/33580).
Disclosure
AP and JH report participation in research projects funded by Alcon, Almirall, Astellas, Astra-Zeneca, Boehringer-Ingelheim, Novo Nordisk, Servier and LEO Pharma, all regulator-mandated Phase IV-studies, all with funds paid to the institution where they were employed (no personal fees) and with no relation to the work reported in this paper. ECR received consultancy fees or travel grants from AbbVie, AstraZeneca and Janssen, outside the submitted work. LCL reports participation in research projects funded by Menarini Pharmaceutical and LEO Pharma, with funds paid to the institution where he was employed (no personal fees) and with no relation to the work reported in this paper. MH received honoraria for consultancy for the Lundbeck Foundation without relation to the submitted work. MRH has received grants from Pfizer, paid to his employer, outside the submitted work, has received speaking fees from Novartis outside the submitted work, owns stocks in Novo Nordisk, and is employed in Novo Nordisk from February 1, 2022. LR reports participation in research projects funded by Novo Nordisk, with funds paid to the institution where she was employed (no personal fees) and with no relation to the work reported in this paper. MR reports grants from LEO Pharma, outside the submitted work. The remaining authors declare that they have no competing interests.
References
1. Franklin JM, Schneeweiss S. When and how can real world data analyses substitute for randomized controlled trials? Clin Pharmacol Ther. 2017;102(6):924–933. doi:10.1002/cpt.857
2. Kennedy-Martin T, Curtis S, Faries D, Robinson S, Johnston J. A literature review on the representativeness of randomized controlled trial samples and implications for the external validity of trial results. Trials. 2015;16:495. doi:10.1186/s13063-015-1023-4
3. Charlson ME, Pompei P, Ales KL, MacKenzie CR. A new method of classifying prognostic comorbidity in longitudinal studies: development and validation. J Chronic Dis. 1987;40(5):373–383. doi:10.1016/0021-9681(87)90171-8
4. Elixhauser A, Steiner C, Harris DR, Coffey RM. Comorbidity measures for use with administrative data. Med Care. 1998;36(1):8–27. doi:10.1097/00005650-199801000-00004
5. Deyo RA, Cherkin DC, Ciol MA. Adapting a clinical comorbidity index for use with ICD-9-CM administrative databases. J Clin Epidemiol. 1992;45(6):613–619. doi:10.1016/0895-4356(92)90133-8
6. Romano PS, Roos LL, Jollis JG. Adapting a clinical comorbidity index for use with ICD-9-CM administrative data: differing perspectives. J Clin Epidemiol. 1993;46(10):1075–1079. doi:10.1016/0895-4356(93)90103-8
7. D’Hoore W, Sicotte C, Tilquin C. Risk adjustment in outcome assessment: the Charlson comorbidity index. Methods Inf Med. 1993;32(5):382–387. doi:10.1055/s-0038-1634956
8. Quan H, Sundararajan V, Halfon P, et al. Coding algorithms for defining comorbidities in ICD-9-CM and ICD-10 administrative data. Med Care. 2005;43(11):1130–1139. doi:10.1097/01.mlr.0000182534.19832.83
9. Quan H, Li B, Couris CM, et al. Updating and validating the Charlson comorbidity index and score for risk adjustment in hospital discharge abstracts using data from 6 countries. Am J Epidemiol. 2011;173(6):676–682. doi:10.1093/aje/kwq433
10. van Walraven C, Austin PC, Jennings A, Quan H, Forster AJ. A modification of the elixhauser comorbidity measures into a point system for hospital death using administrative data. Med Care. 2009;47(6):626–633. doi:10.1097/MLR.0b013e31819432e5
11. Furu K, Wettermark B, Andersen M, Martikainen JE, Almarsdottir AB, Sørensen HT. The Nordic countries as a cohort for pharmacoepidemiological research. Basic Clin Pharmacol Toxicol. 2010;106(2):86–94. doi:10.1111/j.1742-7843.2009.00494.x
12. Ghosn J, Taiwo B, Seedat S, Autran B, Katlama C. HIV. Lancet. 2018;392(10148):685–697. doi:10.1016/S0140-6736(18)31311-4
13. Arnold M, Rutherford MJ, Bardot A, et al. Progress in cancer survival, mortality, and incidence in seven high-income countries 1995–2014 (ICBP SURVMARK-2): a population-based study. Lancet Oncol. 2019;20(11):1493–1505. doi:10.1016/S1470-2045(19
14. Butala NM, Johnson BK, Dziura JD, et al. Decade-long trends in mortality among patients with and without diabetes at a major academic medical center. JAMA Intern Med. 2014;174(7):1187–1188. doi:10.1001/jamainternmed.2014.1803
15. Wettermark B, Zoëga H, Furu K, et al. The Nordic prescription databases as a resource for pharmacoepidemiological research–a literature review. Pharmacoepidemiol Drug Saf. 2013;22(7):691–699. doi:10.1002/pds.3457
16. Schmidt M, Schmidt SAJ, Adelborg K, et al. The Danish health care system and epidemiological research: from health care contacts to database records. CLEP. 2019;11:563–591. doi:10.2147/CLEP.S179083
17. Schmidt M, Schmidt SAJ, Sandegaard JL, Ehrenstein V, Pedersen L, Sørensen HT. The Danish national patient registry: a review of content, data quality, and research potential. Clin Epidemiol. 2015;2015:7:449—490. doi:10.2147/CLEP.S91125
18. Pottegård A, Schmidt SAJ, Wallach-Kildemoes H, Sørensen HT, Hallas J, Schmidt M. Data resource profile: the Danish national prescription registry. Int J Epidemiol. 2017;46(3):798–798f. doi:10.1093/ije/dyw213
19. WHO Collaborating Centre for Drug Statistics Methodology, Norwegian Institute of Public Health. Guidelines for ATC Classification and DDD Assignment 2020. WHO Collaborating Centre for Drug Statistics Methodology; 2019. Available from: www.whocc.no.
20. Hvidberg MF, Johnsen SP, Glümer C, Petersen KD, Olesen AV, Ehlers L. Catalog of 199 register-based definitions of chronic conditions. Scand J Public Health. 2016;44(5):462–479. doi:10.1177/1403494816641553
21. Mehta HB, Mehta V, Girman CJ, Adhikari D, Johnson ML. Regression coefficient–based scoring system should be used to assign weights to the risk index. J Clin Epidemiol. 2016;79:22–28. doi:10.1016/j.jclinepi.2016.03.031
22. Steyerberg EW, Vickers AJ, Cook NR, et al. Assessing the performance of prediction models: a framework for traditional and novel measures. Epidemiology. 2010;21(1):128–138. doi:10.1097/EDE.0b013e3181c30fb2
23. Lemeshow S, Sturdivant RX, Hosmer DW Jr, Hosmer DW Jr. Applied Logistic Regression.
24. Robin X, Turck N, Hainard A, et al. pROC: an open-source package for R and S+ to analyze and compare ROC curves. BMC Bioinform. 2011;12(1):77. doi:10.1186/1471-2105-12-77
25. DeLong ER, DeLong DM, Clarke-Pearson DL. Comparing the areas under two or more correlated receiver operating characteristic curves: a nonparametric approach. Biometrics. 1988;44(3):837–845. doi:10.2307/2531595
26. StataCorp. ci — Confidence Intervals for Means, Proportions, and Variances. In: Stata 17 Base Reference Manual. Stata Press; 2021.
27. StataCorp. Stata Statistical Software: Release 17. College Station, TX: StataCorp LLC; 2021. Available From: https://www.stata.com/. Accessed April 9, 2022.
28. R Core Team. R: A Language and Environment for Statistical Computing. Vienna, Austria: R Foundation for Statistical Computing; 2021. Available from: https://www.R-project.org/.
29. RStudio Team. RStudio: Integrated Development Environment for R. Boston, MA: RStudio, Inc.; 2021. Available from: http://www.rstudio.com/.
30. Schneeweiss S, Maclure M. Use of comorbidity scores for control of confounding in studies using administrative databases. Int J Epidemiol. 2000;29(5):891–898. doi:10.1093/ije/29.5.891
31. Pottegård A, Olesen M, Christensen B, Christensen MB, Hallas J, Rasmussen L. Who prescribes drugs to patients: a Danish register‐based study. Br J Clin Pharmacol. 2021;87(7):2982–2987. doi:10.1111/bcp.14691
32. Gagne JJ, Glynn RJ, Avorn J, Levin R, Schneeweiss S. A combined comorbidity score predicted mortality in elderly patients better than existing scores. J Clin Epidemiol. 2011;64(7):749–759. doi:10.1016/j.jclinepi.2010.10.004
33. Yurkovich M, Avina-Zubieta JA, Thomas J, Gorenchtein M, Lacaille D. A systematic review identifies valid comorbidity indices derived from administrative health data. J Clin Epidemiol. 2015;68(1):3–14. doi:10.1016/j.jclinepi.2014.09.010
34. Austin SR, Wong YN, Uzzo RG, Beck JR, Egleston BL. Why summary comorbidity measures such as the Charlson comorbidity index and elixhauser score work. Med Care. 2015;53(9):e65–e72. doi:10.1097/MLR.0b013e318297429c
 © 2022 The Author(s). This work is published and licensed by Dove Medical Press Limited. The
full terms of this license are available at https://www.dovepress.com/terms
and incorporate the Creative Commons Attribution
- Non Commercial (unported, 3.0) License.
By accessing the work you hereby accept the Terms. Non-commercial uses of the work are permitted
without any further permission from Dove Medical Press Limited, provided the work is properly
attributed. For permission for commercial use of this work, please see paragraphs 4.2 and 5 of our Terms.
© 2022 The Author(s). This work is published and licensed by Dove Medical Press Limited. The
full terms of this license are available at https://www.dovepress.com/terms
and incorporate the Creative Commons Attribution
- Non Commercial (unported, 3.0) License.
By accessing the work you hereby accept the Terms. Non-commercial uses of the work are permitted
without any further permission from Dove Medical Press Limited, provided the work is properly
attributed. For permission for commercial use of this work, please see paragraphs 4.2 and 5 of our Terms.