")
Back to Journals » Infection and Drug Resistance » Volume 15
Development and Validation of a Nomogram for Predicting the Risk of Coronavirus-Associated Acute Respiratory Distress Syndrome: A Retrospective Cohort Study
Authors Zhang L, Xu J, Qi X, Tao Z, Yang Z , Chen W, Wang X, Pan T, Dai Y, Tian R, Chen Y, Tang B, Liu Z, Tan R, Qu H, Yu Y, Liu J
Received 7 November 2021
Accepted for publication 12 February 2022
Published 2 May 2022 Volume 2022:15 Pages 2371—2381
DOI https://doi.org/10.2147/IDR.S348278
Checked for plagiarism Yes
Review by Single anonymous peer review
Peer reviewer comments 2
Editor who approved publication: Professor Suresh Antony
Li Zhang,1,* Jing Xu,1,* Xiaoling Qi,1 Zheying Tao,1 Zhitao Yang,2 Wei Chen,3 Xiaoli Wang,1 Tingting Pan,1 Yunqi Dai,1 Rui Tian,1 Yang Chen,1 Bin Tang,1 Zhaojun Liu,1 Ruoming Tan,1 Hongping Qu,1 Yue Yu,1 Jialin Liu1
1Department of Critical Care Medicine, Ruijin Hospital, Shanghai Jiao Tong University School of Medicine, Shanghai, People’s Republic of China; 2Emergency Department, Ruijin Hospital affiliate to Shanghai Jiaotong University School of Medicine, Shanghai, People’s Republic of China; 3Department of Pulmonary and Critical Care Medicine, Ruijin Hospital Affiliate to Shanghai Jiaotong University School of Medicine, Shanghai, People’s Republic of China
*These authors contributed equally to this work
Correspondence: Jialin Liu; Yue Yu, Department of Critical Care Medicine, Ruijin Hospital, Shanghai Jiao Tong University School of Medicine, Shanghai, 200020, People’s Republic of China, Email [email protected]; [email protected]
Background: Since the outbreak of coronavirus disease (COVID-19) in December 2019 in Wuhan, it has spread rapidly worldwide. We aimed to establish and validate a nomogram that predicts the probability of coronavirus-associated acute respiratory distress syndrome (CARDS).
Methods: In this single-centre, retrospective study, 261 patients with COVID-19 were recruited using positive reverse transcription–polymerase chain reaction tests for severe acute respiratory syndrome coronavirus 2 in Tongji Hospital at Huazhong University of Science and Technology (Wuhan, China). These patients were randomly distributed into the training cohort (75%) and the validation cohort (25%). The factors included in the nomogram were determined using univariate and multivariate logistic regression analyses based on the training cohort. The area under the receiver operating characteristic curve (AUC), consistency index (C-index), calibration curve, and decision curve analysis (DCA) were used to evaluate the efficiency of the nomogram in the training and validation cohorts.
Results: Independent predictive factors, including fasting plasma glucose, platelet, D-dimer, and cTnI, were determined using the nomogram. In the training cohort, the AUC and concordance index were 0.93. Similarly, in the validation cohort, the nomogram still showed great distinction (AUC: 0.92) and better calibration. The calibration plot also showed a high degree of agreement between the predicted and actual probabilities of CARDS. In addition, the DCA proved that the nomogram was clinically beneficial.
Conclusion: Based on the results of laboratory tests, we established a predictive model for acute respiratory distress syndrome in patients with COVID-19. This model shows good performance and can be used clinically to identify CARDS early.
Trial Registration: Ethics committee of Ruijin Hospital, Shanghai Jiao Tong University School of Medicine (No.:(2020) Linlun-34th).
Keywords: COVID-19, CARDS, nomogram, risk factor, prediction
Introduction
Since December 2019, there has been an outbreak of pneumonia caused by a new type of coronavirus in Wuhan, China, and named coronavirus disease (COVID-19) by the World Health Organization.1–5 Since 1 January 2020, more than 90 million confirmed cases and more than 2 million deaths have been reported worldwide. With regard to ICU admission in COVID-19, ARDS, respiratory failure, Sepsis, heart failure, and septic shock, multi-organ failure were the frequently observed complications. However, the reported incidence of ARDS is approximately 15%–30%, higher than that of other organ injuries, such as acute myocardial injury and acute renal injury.6,7 Acute respiratory distress syndrome (ARDS) is a clinical and pathophysiological syndrome caused by various intrapulmonary and extrapulmonary factors, and its most important feature is refractory hypoxaemia.8 To date, the mortality rate of ARDS in hospitalized patients remains as high as 50%.9,10 For some unknown reasons, some patients with mild COVID-19 will rapidly progress to ARDS within a week. Although they can be admitted to the intensive care unit (ICU) for treatment, the mortality rate remains high.11 ARDS caused by COVID-19 seems to have a worse prognosis than ARDS caused by other causes. The mortality rates in the ICU and hospital for typical ARDS were 35.3% and 40.0%, respectively.10 For coronavirus-associated acute respiratory distress syndrome (CARDS), the mortality rate was between 26% and 61.5%.
The early detection of the likelihood of CARDS will help to appropriately identify and classify those who need to accept ICU treatment earlier. However, there are few studies on prediction models for the occurrence of CARDS. Therefore, a predictive model is needed to evaluate the probability of CARDS according to the easily obtainable and quantifiable clinical indicators of the patient. Therefore, we developed a nomogram for predicting the risk of CARDS that can help screen patients who are likely to develop severe respiratory distress in clinical settings.
Materials and Methods
Subjects
We selected patients with COVID-19 admitted to Tongji Hospital at Huazhong University of Science and Technology (Wuhan, China) between 11 February and 31 March 2020. The inclusion criteria were as follows: (1) confirmed diagnosis of COVID-19 by detection of severe acute respiratory syndrome coronavirus 2 (SARS-CoV-2) via reverse transcription–polymerase chain reaction and (2) age >18 years. All eligible patients were randomly assigned to one of two groups in a 3:1 ratio (training cohort and validation cohort, respectively). The study complied with the edicts of the 1975 Declaration of Helsinki and was approved by the principal investigator center, Institutional Review Board of Ruijin Hospital, Shanghai Jiao Tong University School of Medicine (No.:(2020) Linlun-34th). Written informed consent was obtained from patients or their immediate relatives.
Data Collection
We retrospectively reviewed the first-hand clinical database collected within 48 hours of hospitalization. Baseline characteristics, routine laboratory tests and outcomes were recorded. Clinical laboratory tests included fasting plasma glucose (FPG), C-reactive protein (CRP), white blood cell (WBC) count, absolute lymphocyte count, platelet (PLT) count, alanine aminotransferase (ALT), aspartate aminotransferase (AST), albumin, serum creatinine (Scr), BUN, D-dimer, cTnI, IL-6, LDH, and neutrophil-to-lymphocyte ratio (NLR). All laboratory assessments were conducted at each visit in Tongji Hospital by the same trained technicians, strictly following the clinical guidelines.
Definitions
The endpoint event was whether patients with COVID-19 had progressed to ARDS. All patients with ARDS were diagnosed according to the Berlin definition.12 The diagnosis of COVID-19 was based on the Guidelines for Diagnosis and Treatment of Novel Coronavirus Pneumonia (7th version) released by the Health Commission of China. For the diagnosis of severe COVID-19, at least one of the following criteria should have been met: (1) respiratory distress, shortness of breath with respiratory rate ≥30 times/min; (2) arterial oxygen saturation (resting status) ≤93%; (3) partial pressure of oxygen/fraction of inspiration O2 (PaO2/FiO2) ≤300 mm Hg; and 4) have respiratory failure and need for mechanical assistance; shock; “extra pulmonary” organ failure, intensive care unit is needed. Otherwise, the patients were defined to have non-severe COVID-19.
Development and Validation of the Nomogram
According to the results of univariate and multivariate logistic regression analysis, the risk factors of CARDS have been found. Then, the nomogram was developed using the “rms” and “foreign” R packages. The “rms” R package, including nomogram function, was used to calculate equation and draw nomogram. The “foreign” R package was used to read and write data. Firstly, the regression equation was derived from the multivariate logistic regression. Nomogram function transformed the coefficients of logistic regression results in the multivariate logistic regression analysis, and eventually transformed it to nomogram formula. Secondly, in this study, as the most significant risk factor of CARDS, cTnI would be given to the maximum score of 100 points. Based on the cTnI, other risk factors were assigned corresponding score according to the ratio in the nomogram formula. The data was then displayed in the form of nomogram. The corresponding calibration plot, ROC analysis and decision curve analysis (DCA) were performed in the training and validation cohorts to assess the discrimination, the degree of consistency, and the quality of clinical applicability of the nomogram model. The calibration plots were drawn using the “rms” and “foreign” R packages. The “rms” R package, including calibrate function, was used to calculate equation and draw calibration plots. The function of the “foreign” R package was same as the aforementioned. The calibration evaluation of the predictive model was an important indicator for evaluating a certain individual ending event probability. It reflected the degree of consistency of model predicted probability and actual probability. The curve “Ideal” meant standard curve that represents the predicted probability and the actual probability completely matched. And the curve “Logistic calibration” represented a calibration curve of logistic regression predictive model. The consistency was judged by the degree of coincidence of two curves. The DCA curves were drawn using the “rms”, “foreign”, and “nricens” R packages. Many functions were included in the “rms” R package, participated in regression modeling, validation, and graphics. The function of the “foreign” R package was same as the aforementioned. The function of the “nricens” R package was that calculating the net reclassification improvement (NRI) for risk prediction models with binary data. A significant concept in DCA was “probability threshold”, namely, a level of diagnostic certainty above which the patient would choose to be treated. The net benefit was determined by calculating the difference between the expected benefit and the expected harm associated with each proposed testing and treatment strategy. The curve “None” meant that all people are not treated, and the net benefits are 0. The curve “All” was drawn as if all patients receive treatment irrespective of laboratory test results. For any given probability threshold, the curve with the highest net benefit at that threshold was the best choice. Multiple cross-validation results are shown in Table S3.
Statistical Analysis
Schematic figure of the data processing workflow is shown in Figure S1. Because missing values will lead to deviations in the results to a certain extent, before data analysis, multiple imputations were performed on missing data to obtain appropriate values. Discrete variables are reported as frequency and proportions, and continuous variables are reported as the mean ± standard deviation or median with interquartile range as appropriate. Differences between the two groups were tested using the independent-sample t-test, Mann–Whitney U-test, or chi-square test as appropriate, and all analyses were considered significant at P values of <0.05 (two-tailed). Clinical data were processed using SPSS version 23 (IBM Corp., Armonk, NY, USA) and R version 3.4.4.
Results
Baseline Characteristics
Between 11 February and 31 March 2020, 261 patients were hospitalized for COVID-19 diagnosis. Demographic and clinical characteristics of the patients are described in Table 1. A total of 261 patients were randomly divided into the training and validation cohorts in a 3:1 ratio (197 from the training cohort and 64 from the validation cohort). In the training cohort, the most common clinical symptoms of patients with COVID-19 at the time of onset were sore throat (84.26%), expectoration (48.22%), cough (19.8%) and fever (20.81%). Among the patients in the validation cohort, the proportions of the aforementioned symptoms were similar to those in the training cohort. In the training and validation cohorts, the proportion of patients with severe COVID-19 was similar to that of patients with non-severe COVID-19. The same was true for patients with and without ARDS. Within 48h of admission, the median levels of FPG, ALT, AST, Scr, BUN, IL-6, and LDH and WBC, absolute lymphocyte, and PLT counts were within the normal range. However, the median levels of CRP, D-dimer, and cTnI and NLR were elevated.
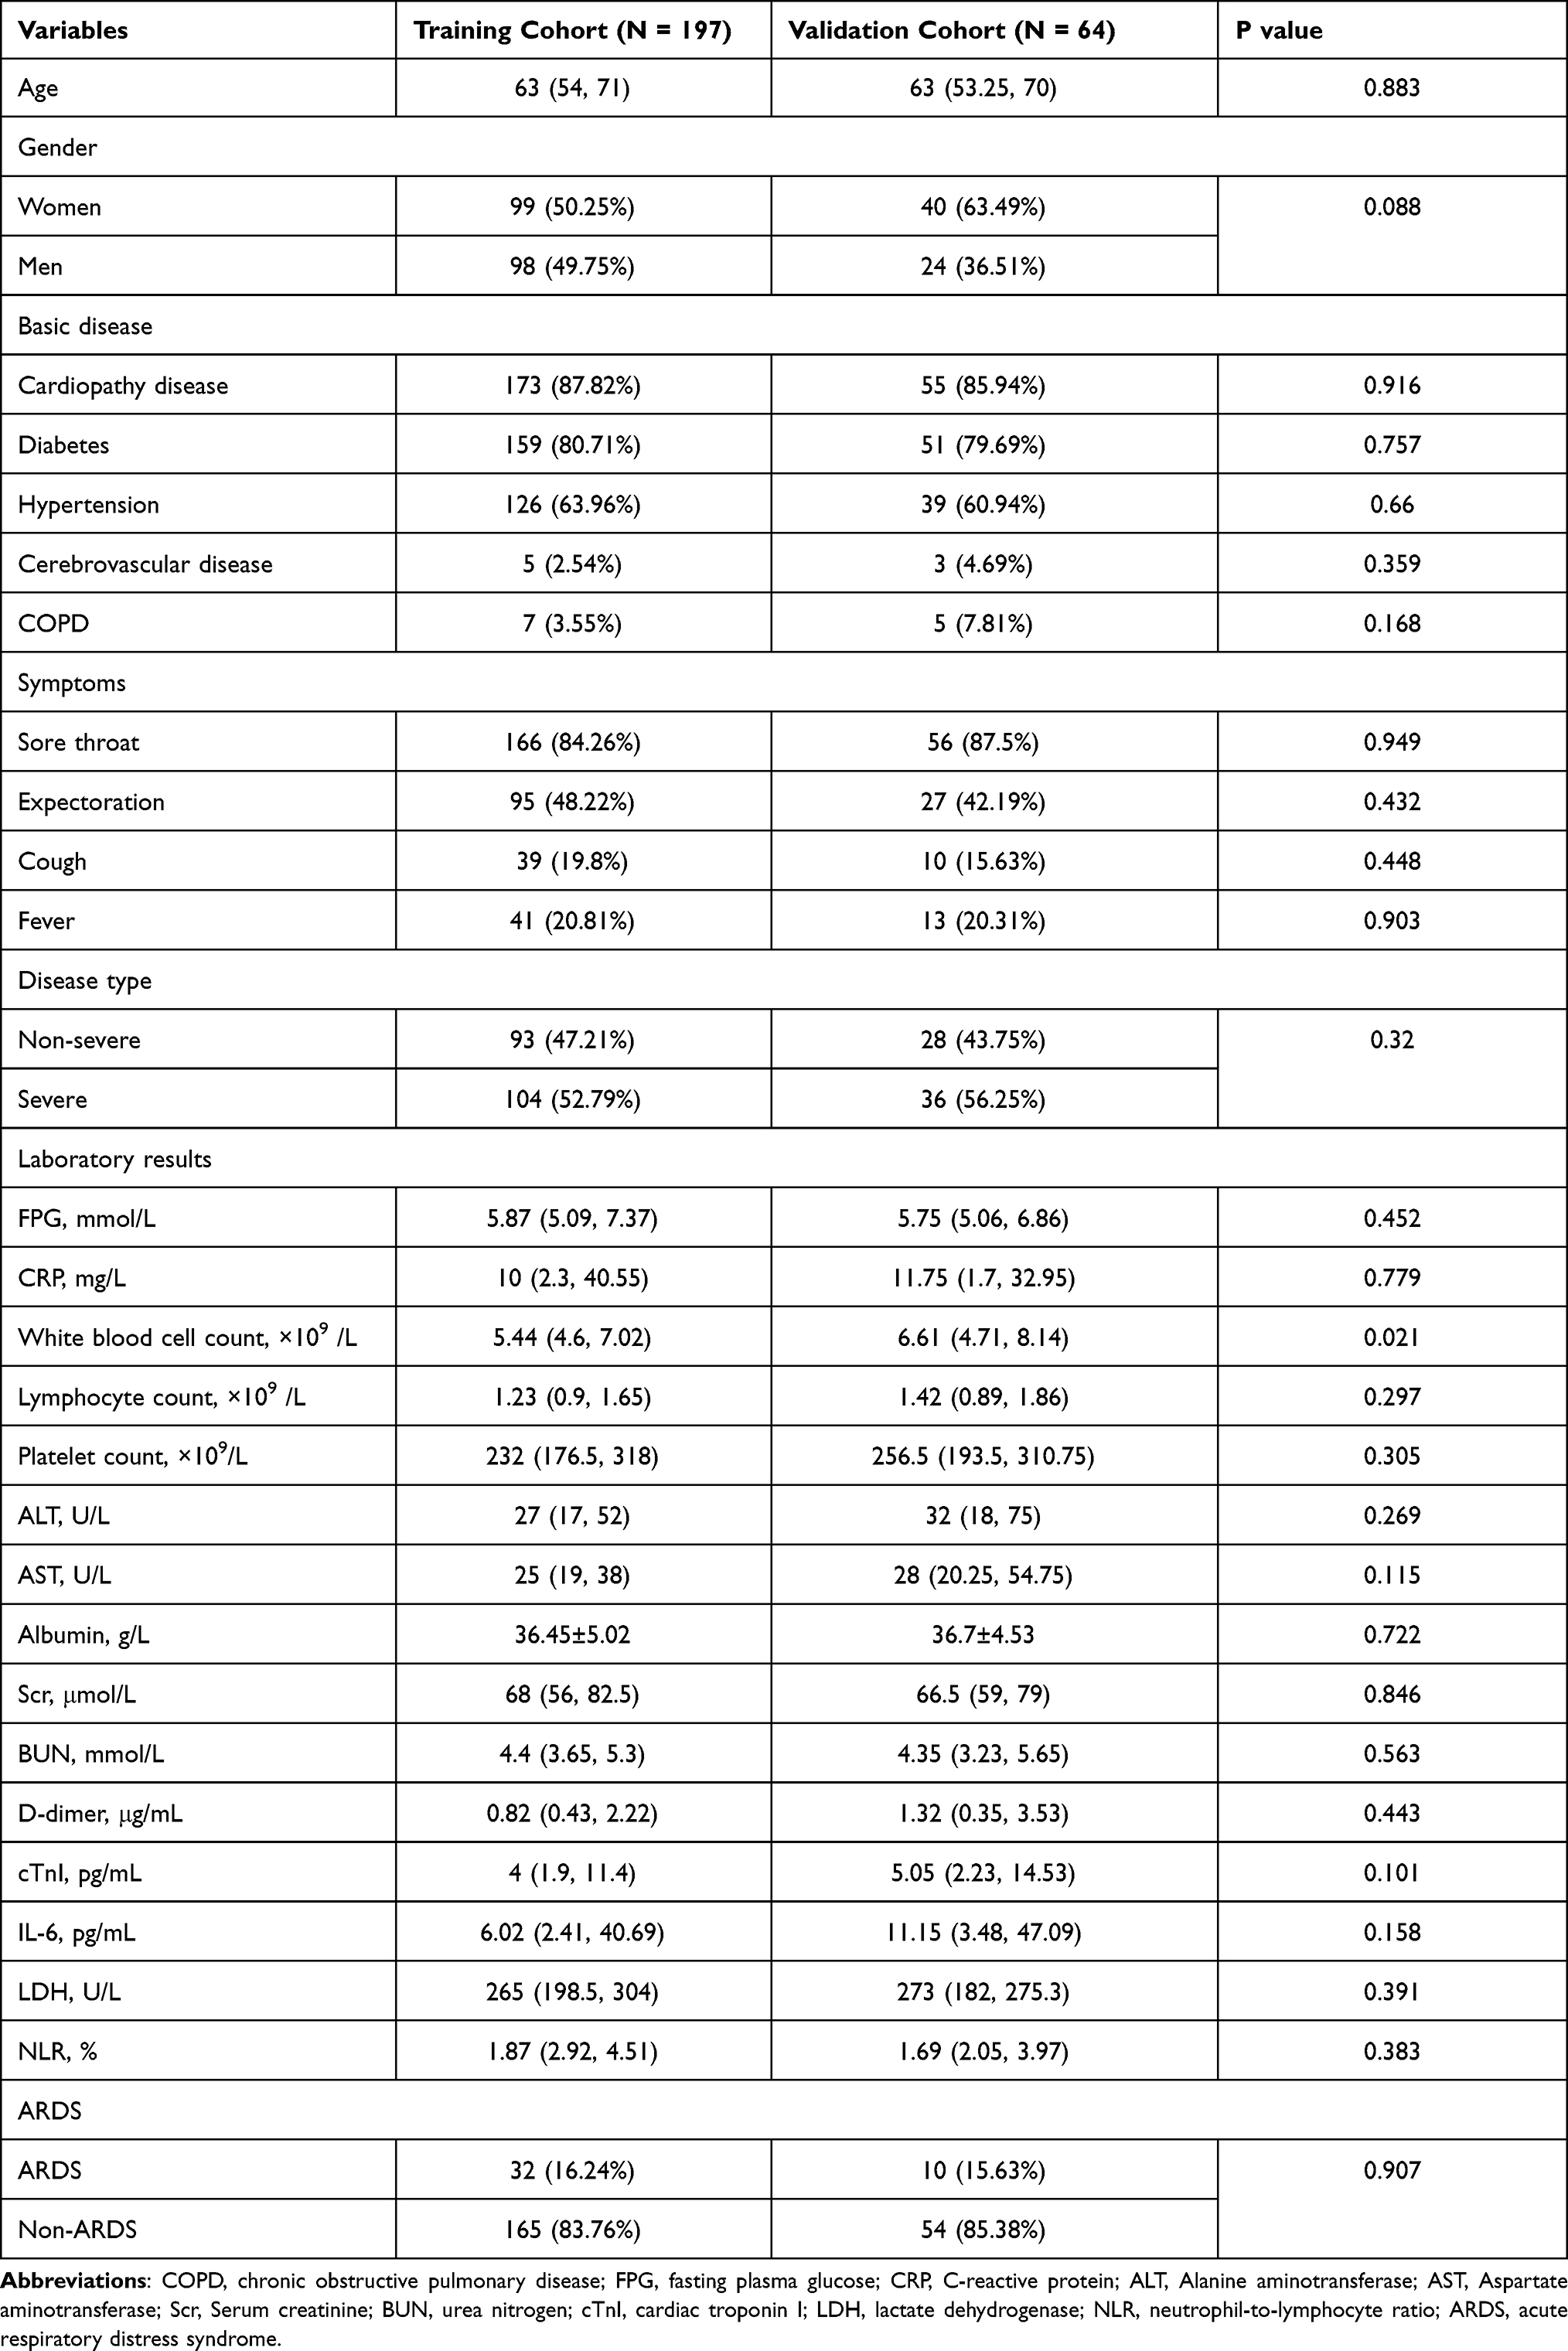 |
Table 1 Baseline Characteristics of Patients in Training Cohort and Validation Cohort |
Factors Associated with ARDS
Based on the basic clinical information of the patients, we explored which factors are risk factors that cause the patient to develop ARDS. Therefore, univariate and multivariate logistic regression analyses of the aforementioned clinical indicators were tested in all 261 patients to identify the risk factors for ARDS. Before the regression analysis, to simplify the scoring system, we converted continuous variables into classified variables. Variable conversion was calculated from the cut-off value of the ROC curve of the variable. The continuous variable is converted into a classified variable with a cut-off value of zero, as shown in Table S1. In univariate regression analysis, factors such as age, FPG, CRP, WBC count, PLT count, D-dimer, and cTnI were closely related to the occurrence of ARDS (Table 2). However, in multivariate logistic regression analysis, only FPG, PLT count, D-dimer, and cTnI were directly and independently linked to the occurrence of ARDS. The regression equation established by multivariate logistic regression analysis is 2.54*FPG-1.13*Platelet+1.63*D-dimer+3.76*cTnI-12.47.
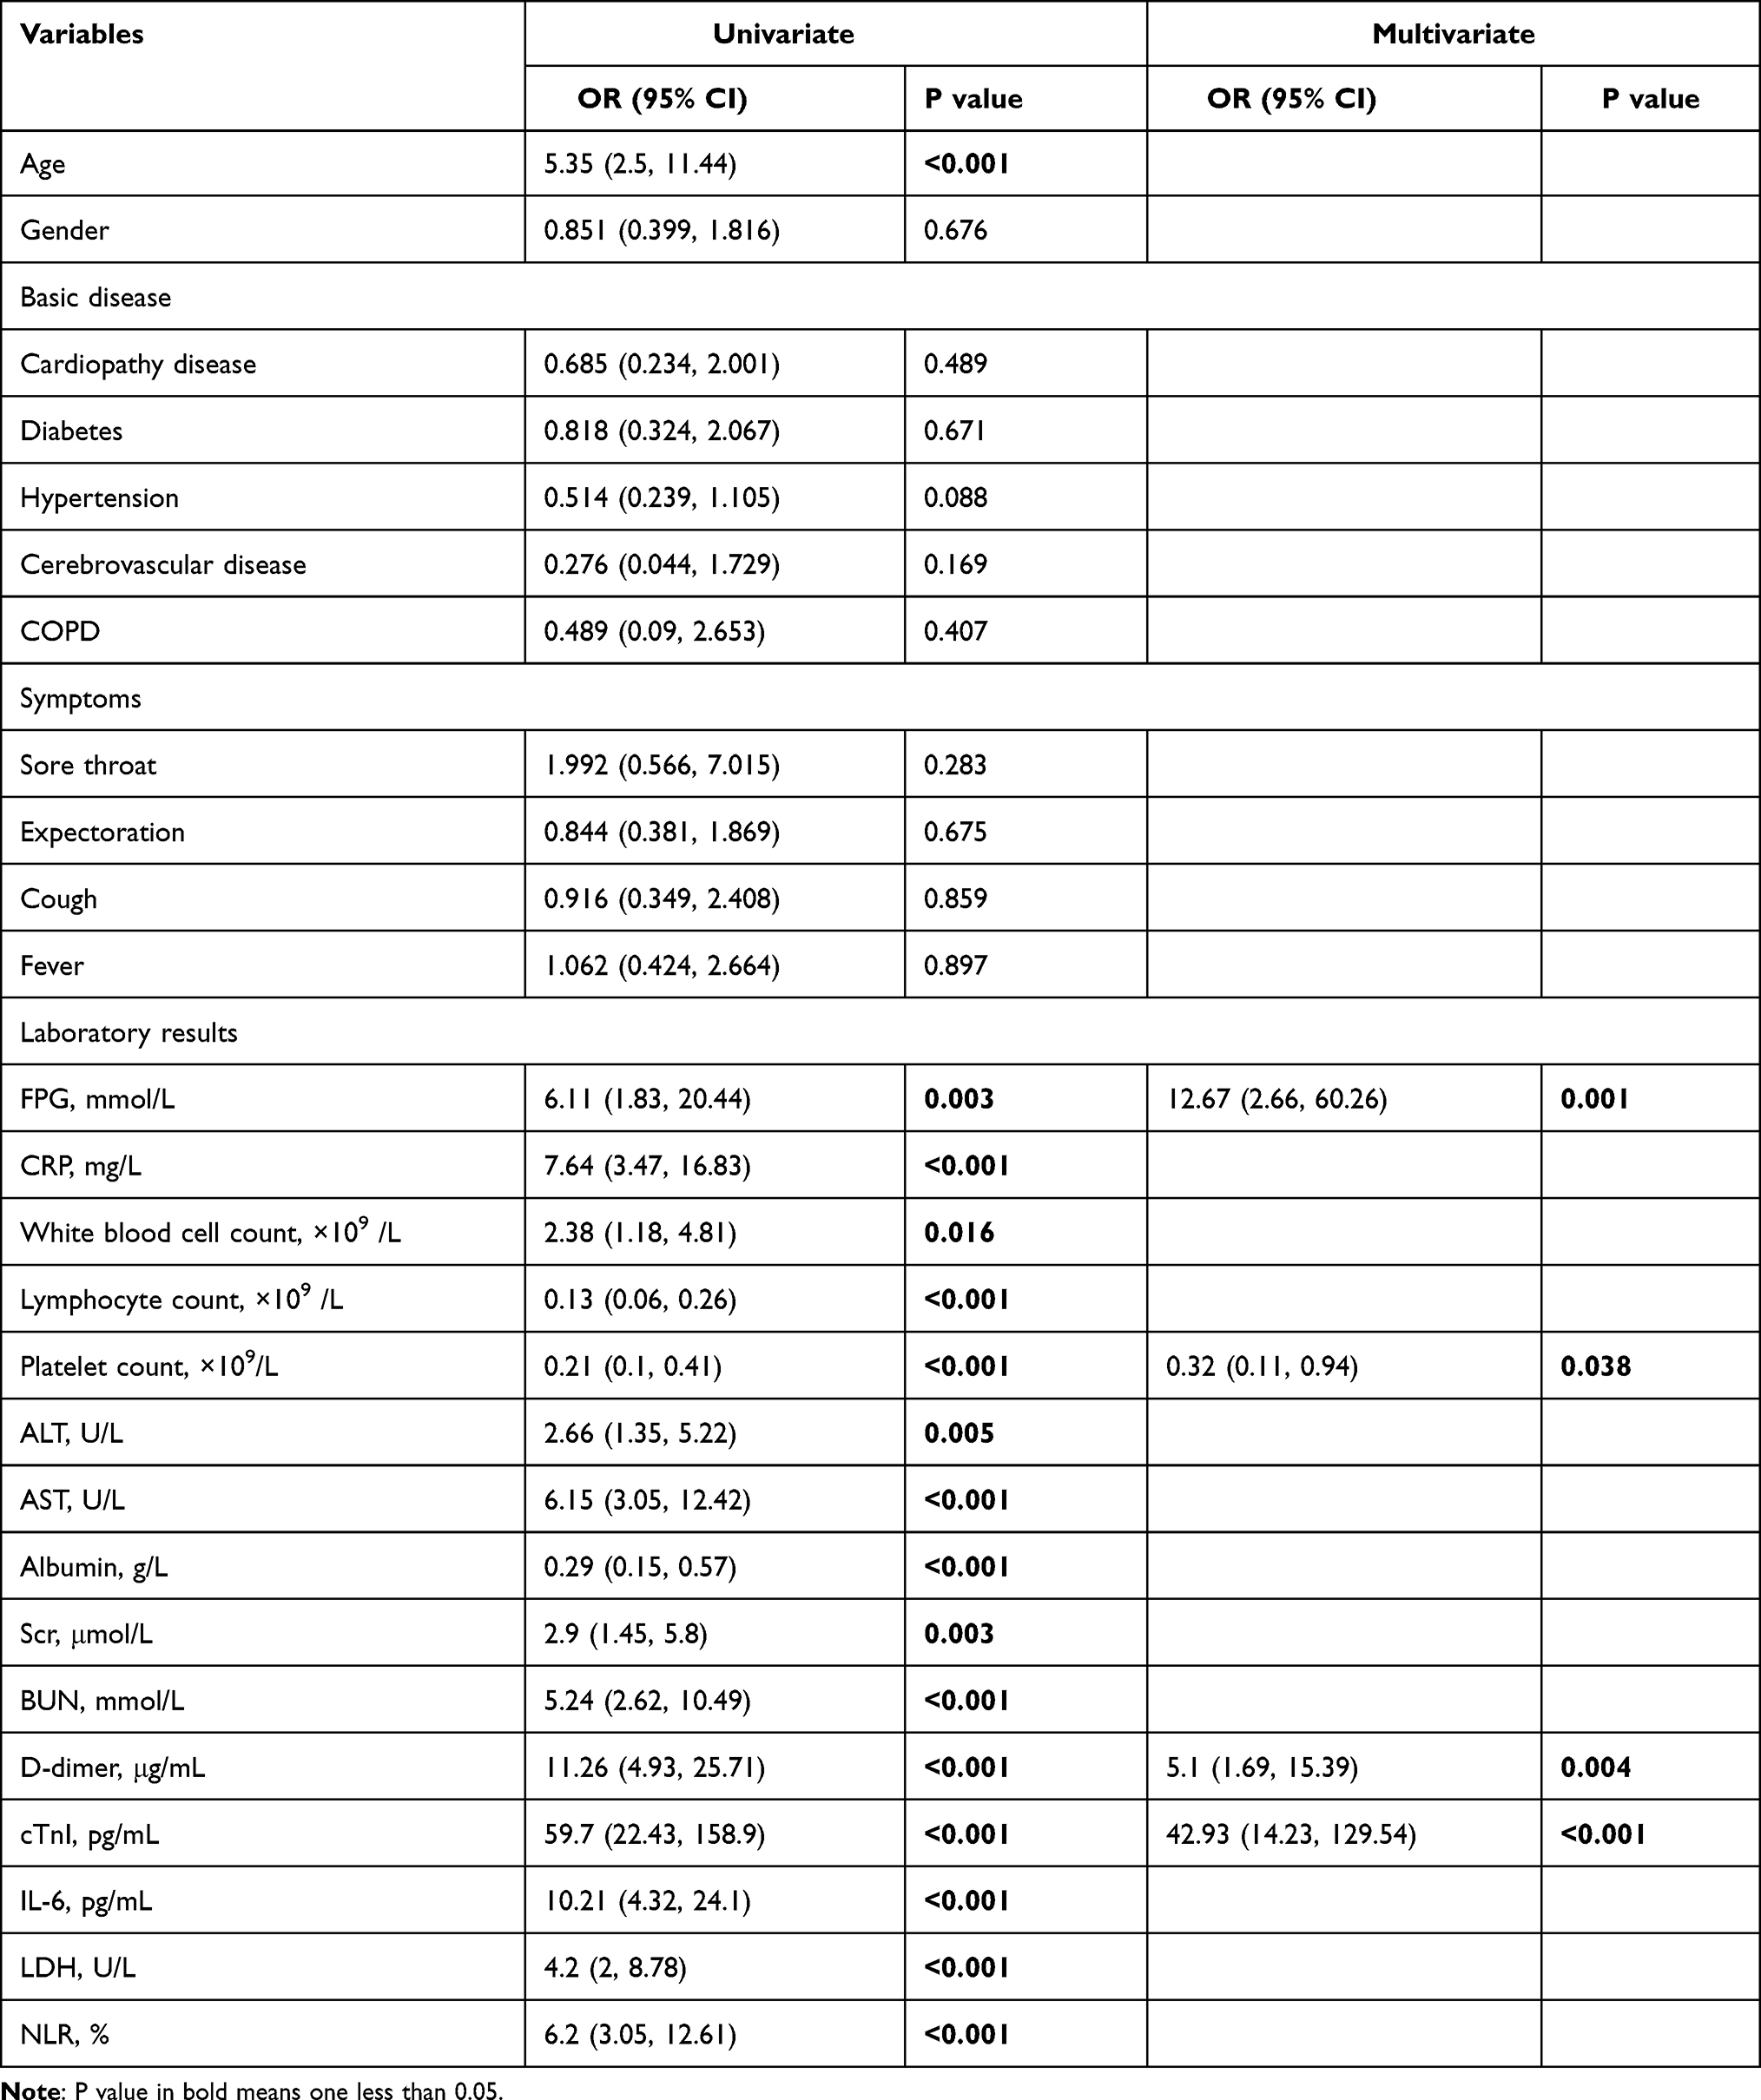 |
Table 2 Univariate and Multivariable Logistic Regression Analysis of the Training Cohort |
Construction of the Prediction Model
In the aforementioned results, the risk factors for ARDS were identified. To formulate an optimal nomogram model, the individual performance of these factors was comprehensively evaluated using ROC analysis. As shown in Figure 1, the AUCs of FPG, PLT, D-dimer, and cTnI were 0.63, 0.72, 0.77, and 0.86 in the training cohort, respectively. In the validation cohort, the AUCs of FPG, PLT, D-dimer, and cTnI were 0.62, 0.54, 0.75, and 0.92, respectively. Therefore, a nomogram for predicting the probability of CARDS was preliminarily constructed using four factors: FPG, PLT, D-dimer, and cTnI (Figure 2). The associated concordance index was 0.93 (95% CI, 0.86–0.99), which indicated that approximately 93% of the probability of the diagnosis of CARDS would be correctly predicted by the nomogram model. These risk factors corresponded to the different scores of the nomogram in accordance with different weights in the aforementioned equation. After calculating the total score, we used it to draw a vertical line to obtain the probability of CARDS. The associated scores for the independent risk factors calculated by the nomogram in the corresponding situation are presented in Table S2.
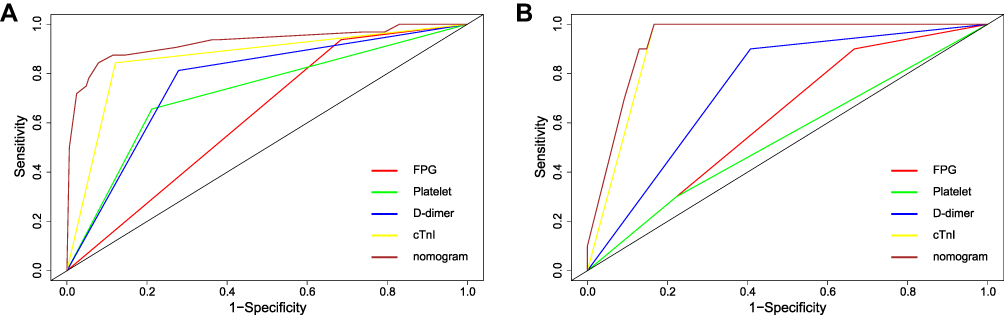 |
Figure 1 ROC curves of the nomogram, FPG, PLT, D-dimer, and cTnI in the training and validation cohorts. (A) ROC curve in training cohort. (B) ROC curve in validation cohort. |
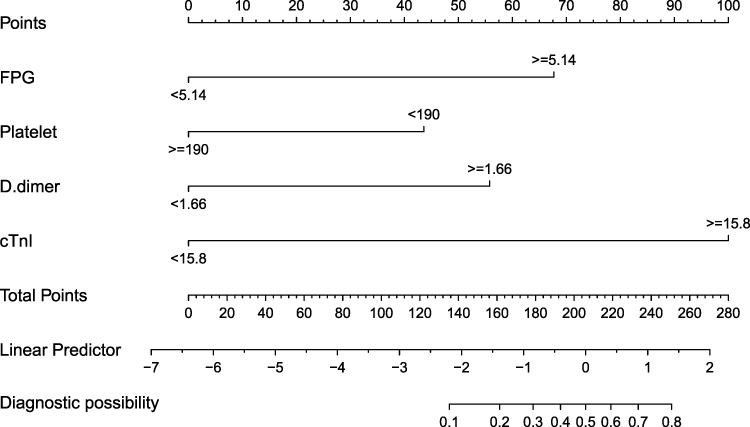 |
Figure 2 The nomogram predicts the probability of hospitalized COVID-19 patients progressing to ARDS. The score for each value is assigned by drawing a line upward to the points line, and the sum of the four scores is plotted on the Total points line. |
Performance of Training Cohort and Validation Cohort Model
To evaluate the diagnostic performance of the model, we drew the ROC curve, calibration plot, and DCA curve of the training cohort. The ROC curve was mainly used to assess the discrimination of the model; that is, a larger AUC value represented a better diagnostic ability. We determined the AUC of the nomogram of the training cohort to be 0.93 (95% CI, 0.86–0.99) (Figure 1A). The calibration evaluation of the predictive model is an important indicator for evaluating a certain individual ending event probability. It reflects the degree of consistency of model predicted probability and actual probability, so it is generally called consistency. With poor calibration, the model is likely to be overestimated or underestimate the risk of disease. When the curve “Logistic calibration” is above the curve “Ideal”, the risk of the predictive model underestimated the risk of disease; when the curve “Logistic calibration” is below the curve “Ideal”, the risk of the predictive model overestimated the risk of disease. The calibration plot demonstrated an almost perfect agreement between the predicted probability and the observed outcome fitted to the ideal line (Brier score 0.058) (Figure 3A). Figure 4A illustrates the decision curves analysis for FPG, PLT, D-dimer, cTnI, and the nomogram model to predict the correct diagnosis of CARDS. The net benefit of the nomogram was better than any other factor between threshold probabilities of 5–90%, which ensured maximum clinical benefit. In addition, we evaluated the prediction model by further observing the statistical results of the validation cohort. The AUC of the nomogram was 0.92 (95% CI, 0.85–0.98) in the validation cohort. The calibration plot also displayed high consistency in the prediction of CARDS (Brier score 0.087) (Figure 3B). Due to the limitations of the number of people in the validation cohort, the nomogram in this group was worse than the training cohort in the DCA curve; however, the nomogram did not perform worse in any other single factor (Figure 4B).
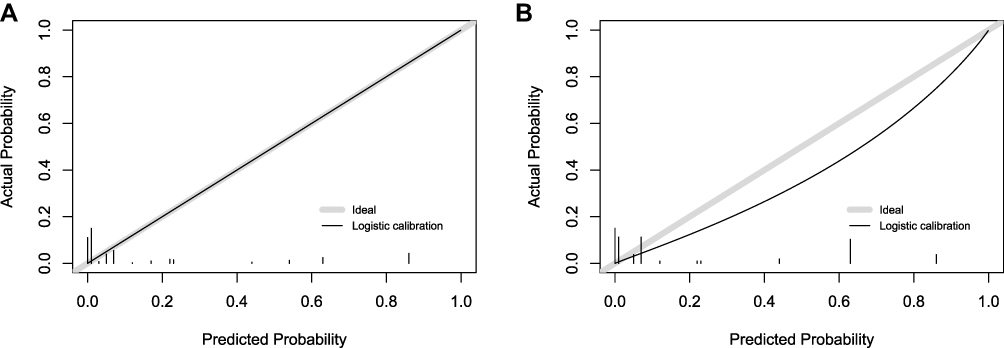 |
Figure 3 Calibration plots for predicting the rate of ARDS in the training and validation cohort. (A) Calibration plot in training cohort. (B) Calibration plot in validation cohort. |
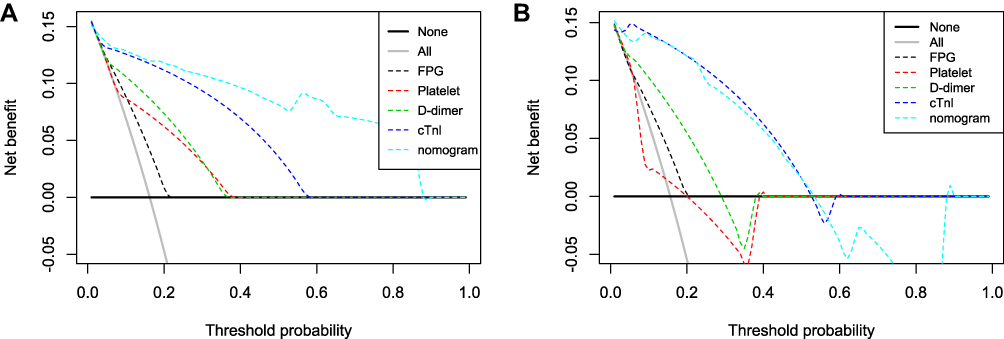 |
Figure 4 The decision curves analysis curves for nomogram in the training and validation cohort. (A) DCA curve in training cohort. (B) DCA curve in validation cohort. |
Discussion
In this study, we developed and validated a nomogram for the early prediction of CARDS in patients with COVID-19. The nomogram based on FPG, PLT count, D-dimer, and cTnI had a discriminatory ability (C-index) of 0.93 (95% CI, 0.86–0.99) in predicting CARDS. CARDS itself has the characteristics of high mortality and difficult detection early.13–15 Therefore, the early detection of CARDS and early intervention are particularly important in clinical practice.
Several studies have developed models that predict the diagnosis and prognosis of COVID-19.16–19 It was reported that a serum fibrinogen level of 617 mg/dL in patients with COVID-19 may help to identify early those with ARDS.20 Zhang et al reported that older age was associated with poor condition and outcome in patients with COVID-19.17 However, there are few studies on prediction models for the occurrence of ARDS. Moreover, the existing research has not established a comprehensive predictive model. It has been reported that older age, initial pulmonary infiltration on a chest radiograph, and CRP are independent predictors of ARDS occurrence in patients with COVID-19 pneumonia.21 However, the previous study did not perform a comprehensive assessment of the scoring system of its predictive model; therefore, it is difficult to determine the clinical benefit of the model. Another study only clarified the risk factor analysis of patients with COVID-19 with ARDS.22 Our study analysed the risk factors for ARDS and established a prediction model. More importantly, we conducted a series of assessments for the discrimination, calibration, and clinical benefits of the model to determine its stability and clinical utility.
According to the aforementioned findings, there are four independent risk factors for CARDS, including FPG, PLT, D-dimer, and cTnI. In this study, higher FPG levels were associated with a greater probability of developing ARDS. Previous studies have shown that the FPG level in the death group was significantly higher than the survival group among patients with COVID-19; that is, an increase in plasma glucose level indicated a worse prognosis for patients.23 Even in patients without diabetes, the FPG level in the death group was significantly higher than the survival group. This shows that FPG is an independent risk factor for COVID-19 and has limited association with the patient’s diabetes history.23,24 Infection may trigger an inflammatory storm, which leads to insulin resistance and ultimately increases the FPG levels. SARS-CoV-2 virus may also directly attack the pancreas and increase the FPG levels.25,26 In the analysis of risk factors, the D-dimer levels were positively correlated with the occurrence of ARDS, while PLT levels were negatively correlated with it. The results of this study are consistent with those of other studies in terms of the characteristics of patients with COVID-19.27,28 Coagulation dysfunction seems to be common in COVID-19 and can be detected by increased D-dimer levels and decreased PLT levels.13,29 Our findings showed that the cTnI level was positively correlated with the probability of CARDS. In previous studies on the basic clinical information of patients with COVID-19, the cTnI level was reported to be significantly related to the severity of the disease; that is, high cTnI levels are positively related to the occurrence of ARDS and poor prognosis in patients30,31 In clinical practice, cTnI is usually used as a sign of heart damage. In patients with COVID-19 complicated by heart damage, the cTnI level was also significantly increased, indicating that the role of cTnI in predicting heart damage is also applicable to patients with COVID-19.31 The systemic inflammatory storm triggered by SARS-CoV-2 infection may be one of the causes of heart damage.32,33 Our study has several strengths. Firstly, the ARDS predictive model established by analysing our existing data has high sensitivity and clinical utility. Secondly, there are fewer evaluation results on the calibration and clinical utility of the predictive model.21,22 In this study, the randomly assigned and independent validation cohort combined with calibration plots and DCA curves can comprehensively and completely evaluate the accuracy, reliability, and clinical utility of this model. Moreover, the clinical indicators involved in this study can be obtained within 24 hours after admission and can be quickly scored and classified according to the patient’s laboratory results, which provides great help for the early recognition of CARDS.
However, this was a single-centre, retrospective study with a small sample size, and our study also has some limitations. Firstly, the individual characteristics of the studied patients affecting the results cannot be excluded. Secondly, due to the limitations of the sample, the number of patients in the validation cohort was relatively small, which makes the consistency poorer than the training cohort in the calibration plot. Thirdly, the range of threshold probability that has a net benefit is too small in the validation cohort.
Conclusion
Our research results showed that the predictive model of CARDS constructed through several simple, quantitative, and easily available laboratory indicators has good clinical significance. This may be helpful in promptly identifying whether patients with COVID-19 can progress to ARDS and adopting precise prevention and targeted treatment measures.
Ethics Approval and Consent to Participate
The study was approved by Ruijin Hospital, Shanghai Jiao Tong University School of Medicine (No.:(2020) Linlun-34th). Written informed consent was obtained from patients or their immediate relatives. A few patients had serious clinical symptoms and could not sign their informed consent. Under emergency, attending doctor contacted the immediate relatives to finish informed consent through the phone and recorded the process. Then, the immediate relatives entered the hospital through the epidemic prevention procedure, and signed an informed consent.
Funding
This study was supported by Medical-engineering Cross Foundation of Shanghai Jiao Tong University grant “2019-nCoV research project” (YG2020YQ30) awarded to JL-L, the National Natural Science Foundation of China (81770005) and (81970005) awarded to JL-L, Three-year plan for developing a public health system of Shanghai (GWV-10.2-XD03) awarded to JL-L.
Disclosure
The authors report no conflicts of interest in this work.
References
1. Zhu N, Zhang D, Wang W, et al. A novel coronavirus from patients with pneumonia in China, 2019. N Engl J Med. 2020;382(8):727–733. doi:10.1056/NEJMoa2001017
2. Zu ZY, Jiang MD, Xu PP, et al. Coronavirus disease 2019 (COVID-19): a perspective from China. Radiology. 2020;296(2):E15–E25. doi:10.1148/radiol.2020200490
3. Chan JF-W, Yuan S, Kok K-H, et al. A familial cluster of pneumonia associated with the 2019 novel coronavirus indicating person-to-person transmission: a study of a family cluster. Lancet. 2020;395(10223):514–523. doi:10.1016/S0140-6736(20)30154-9
4. Hui DS, I Azhar E, Madani TA, et al. The continuing 2019-nCoV epidemic threat of novel coronaviruses to global health - the latest 2019 novel coronavirus outbreak in Wuhan, China. Int J Infect Dis. 2020;91:264–266. doi:10.1016/j.ijid.2020.01.009
5. Li Q, Guan X, Wu P, et al. Early transmission dynamics in Wuhan, China, of novel coronavirus-infected pneumonia. N Engl J Med. 2020;382(13):1199–1207. doi:10.1056/NEJMoa2001316
6. Zhou F, Yu T, Du R, et al. Clinical course and risk factors for mortality of adult inpatients with COVID-19 in Wuhan, China: a retrospective cohort study. Lancet. 2020;395(10229):1054–1062. doi:10.1016/S0140-6736(20)30566-3
7. Wang D, Hu B, Hu C, et al. Clinical characteristics of 138 hospitalized patients with 2019 novel coronavirus-infected pneumonia in Wuhan, China. JAMA. 2020;323(11):1061–1069. doi:10.1001/jama.2020.1585
8. Ranieri VM, Rubenfeld GD, Thompson BT, et al. Acute respiratory distress syndrome: the Berlin Definition. JAMA. 2012;307(23):2526–2533. doi:10.1001/jama.2012.5669
9. Riviello ED, Kiviri W, Twagirumugabe T, et al. Hospital incidence and outcomes of the acute respiratory distress syndrome using the Kigali modification of the Berlin definition. Am J Respir Crit Care Med. 2016;193(1):52–59. doi:10.1164/rccm.201503-0584OC
10. Bellani G, Laffey JG, Pham T, et al. Epidemiology, patterns of care, and mortality for patients with acute respiratory distress syndrome in intensive care units in 50 countries. JAMA. 2016;315(8):788–800. doi:10.1001/jama.2016.0291
11. Wu C, Chen X, Cai Y, et al. Risk factors associated with acute respiratory distress syndrome and death in patients with coronavirus disease 2019 pneumonia in Wuhan, China. JAMA Intern Med. 2020;180(7):934–943. doi:10.1001/jamainternmed.2020.0994
12. Kim J-S, Kim Y-J, Kim M, et al. Impact of lung compliance on neurological outcome in patients with acute respiratory distress syndrome following out-of-hospital cardiac arrest. J Clin Med. 2020;9(2):527.
13. Gibson PG, Qin L, Puah SH. COVID-19 acute respiratory distress syndrome (ARDS): clinical features and differences from typical pre- COVID-19 ARDS. Med J Aust. 2020;213(2):54. doi:10.5694/mja2.50674
14. Ferrando C, Suarez-Sipmann F, Mellado-Artigas R, et al. Clinical features, ventilatory management, and outcome of ARDS caused by COVID-19 are similar to other causes of ARDS. Intensive Care Med. 2020;46(12):2200–2211. doi:10.1007/s00134-020-06192-2
15. Gattinoni L, Coppola S, Cressoni M, Busana M, Rossi S, Chiumello D. COVID-19 does not lead to a “typical” acute respiratory distress syndrome. Am J Respir Crit Care Med. 2020;201(10):1299–1300. doi:10.1164/rccm.202003-0817LE
16. Wynants L, Van Calster B, Collins GS, et al. Prediction models for diagnosis and prognosis of covid-19: systematic review and critical appraisal. BMJ. 2020;369:m1328. doi:10.1136/bmj.m1328
17. Zhang J, Wang X, Jia X, et al. Risk factors for disease severity, unimprovement, and mortality in COVID-19 patients in Wuhan, China. Clin Microbiol Infect. 2020;26(6):767–772. doi:10.1016/j.cmi.2020.04.012
18. Li X, Xu S, Yu M, et al. Risk factors for severity and mortality in adult COVID-19 inpatients in Wuhan. J Allergy Clin Immunol. 2020;146(1):110–118. doi:10.1016/j.jaci.2020.04.006
19. Zheng Z, Peng F, Xu B, et al. Risk factors of critical & mortal COVID-19 cases: a systematic literature review and meta-analysis. J Infect. 2020;81(2):e16–e25. doi:10.1016/j.jinf.2020.04.021
20. Di Micco P, Russo V, Carannante N, Imparato M, Cardillo G, Lodigiani C. Prognostic value of fibrinogen among COVID-19 patients admitted to an emergency department: an Italian Cohort Study. J Clin Med. 2020;9(12):4134. doi:10.3390/jcm9124134
21. Seo J-W, Kim SE, Choi EY, et al. Risk factors and a scoring system to predict ARDS in patients with COVID-19 pneumonia in Korea: a Multicenter Cohort Study. Dis Markers. 2021;2021:8821697. doi:10.1155/2021/8821697
22. Xu W, Sun -N-N, Gao H-N, et al. Risk factors analysis of COVID-19 patients with ARDS and prediction based on machine learning. Sci Rep. 2021;11(1):2933. doi:10.1038/s41598-021-82492-x
23. Wu J, Huang J, Zhu G, et al. Elevation of blood glucose level predicts worse outcomes in hospitalized patients with COVID-19: a retrospective cohort study. BMJ Open Diabetes Res Care. 2020;8(1):e001476. doi:10.1136/bmjdrc-2020-001476
24. Huang Y, Guo H, Zhou Y, et al. The associations between fasting plasma glucose levels and mortality of COVID-19 in patients without diabetes. Diabetes Res Clin Pract. 2020;169:108448. doi:10.1016/j.diabres.2020.108448
25. Marik PE, Raghavan M. Stress-hyperglycemia, insulin and immunomodulation in sepsis. Intensive Care Med. 2004;30(5):748–756. doi:10.1007/s00134-004-2167-y
26. Šestan M, Marinović S, Kavazović I, et al. Virus-induced interferon-γ causes insulin resistance in skeletal muscle and derails glycemic control in obesity. Immunity. 2018;49(1):164–177.e6. doi:10.1016/j.immuni.2018.05.005
27. Sun Y, Koh V, Marimuthu K, et al. Epidemiological and clinical predictors of COVID-19. Clin Infect Dis. 2020;71(15):786–792. doi:10.1093/cid/ciaa322
28. Chen T, Wu D, Chen H, et al. Clinical characteristics of 113 deceased patients with coronavirus disease 2019: retrospective study. BMJ. 2020;368:m1091. doi:10.1136/bmj.m1091
29. Wang J, Hajizadeh N, Moore EE, et al. Tissue plasminogen activator (tPA) treatment for COVID-19 associated acute respiratory distress syndrome (ARDS): a case series. J Thromb Haemost. 2020;18(7):1752–1755. doi:10.1111/jth.14828
30. Li Y, Li H, Zhu S, et al. Prognostic value of right ventricular longitudinal strain in patients with COVID-19. JACC Cardiovasc Imaging. 2020;13(11):2287–2299. doi:10.1016/j.jcmg.2020.04.014
31. Shi S, Qin M, Shen B, et al. Association of cardiac injury with mortality in hospitalized patients with COVID-19 in Wuhan, China. JAMA Cardiol. 2020;5(7):802–810. doi:10.1001/jamacardio.2020.0950
32. Sellers SA, Hagan RS, Hayden FG, Fischer WA. The hidden burden of influenza: a review of the extra-pulmonary complications of influenza infection. Influenza Other Respir Viruses. 2017;11(5):372–393. doi:10.1111/irv.12470
33. de Jong MD, Simmons CP, Thanh TT, et al. Fatal outcome of human influenza A (H5N1) is associated with high viral load and hypercytokinemia. Nat Med. 2006;12(10):1203–1207. doi:10.1038/nm1477
 © 2022 The Author(s). This work is published and licensed by Dove Medical Press Limited. The full terms of this license are available at https://www.dovepress.com/terms.php and incorporate the Creative Commons Attribution - Non Commercial (unported, v3.0) License.
By accessing the work you hereby accept the Terms. Non-commercial uses of the work are permitted without any further permission from Dove Medical Press Limited, provided the work is properly attributed. For permission for commercial use of this work, please see paragraphs 4.2 and 5 of our Terms.
© 2022 The Author(s). This work is published and licensed by Dove Medical Press Limited. The full terms of this license are available at https://www.dovepress.com/terms.php and incorporate the Creative Commons Attribution - Non Commercial (unported, v3.0) License.
By accessing the work you hereby accept the Terms. Non-commercial uses of the work are permitted without any further permission from Dove Medical Press Limited, provided the work is properly attributed. For permission for commercial use of this work, please see paragraphs 4.2 and 5 of our Terms.