")
Back to Journals » Journal of Hepatocellular Carcinoma » Volume 8
Development and Validation of a Metabolic Gene-Based Prognostic Signature for Hepatocellular Carcinoma
Authors Weng J, Zhou C , Zhou Q, Chen W, Yin Y, Atyah M, Dong Q, Shi Y, Ren N
Received 6 January 2021
Accepted for publication 23 February 2021
Published 29 March 2021 Volume 2021:8 Pages 193—209
DOI https://doi.org/10.2147/JHC.S300633
Checked for plagiarism Yes
Review by Single anonymous peer review
Peer reviewer comments 2
Editor who approved publication: Dr Ahmed Kaseb
Jialei Weng,1,* Chenhao Zhou,1,2,* Qiang Zhou,1 Wanyong Chen,1,3 Yirui Yin,1 Manar Atyah,1 Qiongzhu Dong,2– 4 Yi Shi,5 Ning Ren1,3
1Department of Liver Surgery, Liver Cancer Institute, Zhongshan Hospital, Key Laboratory of Carcinogenesis and Cancer Invasion (Ministry of Education), Fudan University, Shanghai, People’s Republic of China; 2Department of Molecular and Cellular Oncology, The University of Texas MD Anderson Cancer Center, Houston, TX, USA; 3Institute of Fudan Minhang Academic Health System, Minhang Hospital, Key Laboratory of Shanghai Municipal Health Commission, Fudan University, Shanghai, People’s Republic of China; 4Institutes of Biomedical Sciences, Fudan University, Shanghai, People’s Republic of China; 5Biomedical Research Centre, Zhongshan Hospital, Fudan University, Shanghai, People’s Republic of China
*These authors contributed equally to this work
Correspondence: Ning Ren
Department of Liver Surgery, Liver Cancer Institute, Zhongshan Hospital, Key Laboratory of Carcinogenesis and Cancer Invasion (Ministry of Education), Fudan University, 180 Fenglin Road, Shanghai, 200032, People’s Republic of China
Tel +86-21-64041990
Email [email protected]
Yi Shi
Biomedical Research Centre, Zhongshan Hospital, Fudan University, 180 Fenglin Road, Shanghai, 200032, People’s Republic of China
Tel +86-21-64041990
Email [email protected]
Background: Hepatocellular carcinoma (HCC) is a malignant tumor with great variation in prognosis among individuals. Changes in metabolism influence disease progression and clinical outcomes. The objective of this study was to determine the overall survival (OS) risk of HCC patients from a metabolic perspective.
Patients and Methods: The model was constructed using the least absolute shrinkage and selection operator (LASSO) COX regression based on The Cancer Genome Atlas (TCGA, n=342) dataset. The International Cancer Genome Consortium (ICGC, n=232), GSE14520 (n=242) datasets, and a clinical cohort (n=64) were then used to assess the prognostic value of the signature.
Results: A 10 metabolic gene-based signature was constructed and verified as a robust and independent prognostic classifier in public and real-world validation cohorts. Meanwhile, the signature enabled the identification of HCC molecular subtypes, yielding an AUC value of 0.678 [95% CI: 0.592– 0.763]. Besides, the signature was associated with metabolic processes like glycolysis, supported by a clear correlation between the risk score and expression of rate-limiting enzymes. Furthermore, high-risk tumor was likely to have a high tumor infiltration status of immunosuppressive cells, as well as elevated expression of some immune checkpoint molecules. For final clinical translation, a nomogram integrating the signature and tumor stage was established, and showed improved predictive accuracy of 3- and 5-year OS and brought more net benefit to patients.
Conclusion: We developed a prognostic signature based on 10 metabolic genes, which has proven to be an independent and reliable prognostic predictor for HCC and reflects the metabolic and immune characteristics of tumors.
Keywords: hepatocellular carcinoma, metabolism-related gene, signature, prognosis
Introduction
It is estimated that there will be 42,810 new cases and 30,160 deaths of primary liver cancer in 2020, of which hepatocellular carcinoma (HCC) accounts for approximately 75%.1,2 The increasing prevalence of non-alcoholic fatty liver disease can partly explain the high incidences of HCC in all cancers.3 HCC also has a poor prognosis because of the delayed diagnosis and increased post-therapeutic recurrence frequency.4 However, the requirements of comprehensive reflection of tumor characteristics and accurate identification of high-risk patients cannot be met by current prognostic evaluation systems. Thus, developing novel prognostic models for improving clinical management and decision-making remains a top priority in this setting.
Metabolic changes, especially metabolic reprogramming, are key in cancer cells because they provide sufficient energy and essential molecules to support the survival advantages of cancer cells.5 Given the key modulation of the liver for whole-body metabolism homeostasis and unique metabolic processes such as bile acid synthesis in this organ, this feature is particularly prominent in HCC.6 Increasing evidence has confirmed that aberrant metabolisms of glucose, lipid, amino acid, acylcarnitine, and lysophosphatidic acid, as well as several metabolic enzymes and metabolites, are involved in HCC progression.5,7–10 For example, in HCC cells, lipid synthesis is enhanced, and increased fatty acids can serve as the energy sources and signaling molecules to promote HCC proliferation.7,11 Besides, a ketogenesis rate-limiting enzyme is downregulated in HCC to decrease the amount of intracellular ketone, promoting HCC progression.12 Therefore, a deeper understanding of the HCC metabolism profiles is highly desirable for the establishment of new therapeutic strategies.
Researchers have also tried to incorporate metabolic-related genes into tumor prognostic models as metabolic changes play a key role in tumorigenesis. For instance, Wang and colleagues identified an 8-gene signature related to energy metabolism as an independent factor for ovarian cancer prognosis.13 Besides, a signature of 9 lipid metabolism-related genes was established to predict the prognosis of glioma.14 As for HCC, several metabolic-related genes have been reported to be associated with patients’ prognosis, such as ACC1 and FASN.15,16 However, effective prognostic signatures based on metabolic-related genes are absent in HCC.
In this study, to reveal the tumor characteristics and evaluate the overall survival (OS) risk of HCC patients from a metabolic perspective, we made a systematic prognostic model construction and validation effort to develop a prognostic panel of 10 metabolic genes that could be applied to the clinic using PCR array. The signature also helped to distinguish molecular subtypes of HCC and to a certain degree to reflect metabolic and immune tumor characteristics. Finally, the predictive accuracy and net benefit of the signature can be further improved when integrated into a nomogram. In summary, we have developed a novel metabolic prognostic signature for risk-stratification, subtype-identification, and treatment-guidance in HCC patients, which has important clinical significance in improving the patient prognosis.
Materials and Methods
Data Collection
In this study, a total of 880 HCC samples from four datasets were analyzed, including one The Cancer Genome Atlas (TCGA) cohort, one Gene Expression Omnibus (GEO) cohort, one International Cancer Genome Consortium (ICGC) cohort, and one Zhongshan Hospital cohort. Gene expression and clinical information of TCGA cohort were acquired from Genomic Data Commons Data Portal and cBioPortal for Cancer Genomics, respectively. Only patients with OS greater than one month were included. RNA-seq data was normalized using the “limma” package in R software (version 3.6.3).17 GSE14520 dataset obtained from our Liver Cancer Institute, Zhongshan Hospital, Fudan University served as an external validation cohort. The microarray data were processed using the Affymetrix platform. In addition, the LINC-JP dataset downloaded from the ICGC website (https://icgc.org/) also acted as a validation cohort. Finally, 64 frozen HCC samples from patients who underwent hepatectomy at Zhongshan Hospital in 2012 were used as a real-world cohort. The patients were enrolled according to the inclusion criteria described in our previous study.18 Clinicopathological data were obtained from electronic medical records. OS was defined as the period between the date of operation and death or last follow-up visit. A metabolic-related gene set was retrieved from “2.cp.kegg.v7.0.symbols” file downloaded from the Molecular Signatures Database (MSigDB) website.
The Ethics Committee of Zhongshan Hospital, Fudan University approved the study with a written informed consent obtained from each participant. The clinical samples collected in this study were conducted in accordance with the Declaration of Helsinki.
PCR Array
RNA was extracted from HCC tissue samples using TRIzol reagent (Invitrogen), and the first-strand cDNA was synthesized using RT2 First Strand cDNA Kit (SA Biosciences, Qiagen, USA). The RT2 Profiler PCR Arrays technology (BioTNT) was then used for simultaneous multi-gene expression measurement. Briefly, synthesized cDNA was added to a PCR array containing primers for 10 selected metabolic-related genes and three housekeeping genes (HMBS, UBC, RNA18SN5) according to the manufacturer’s instructions. A real-time PCR program was then conducted in an ABI Prism 7500 Sequence Detection system. The Ct (cycle threshold) values were normalized using the housekeeping genes, and the relative quantifications of target genes were calculated using the ∆∆Ct method. The sequences of primers used are shown in Supplementary Table S4.
Identification of Molecular Subtypes of HCC in the TCGA Cohort
HCC can be divided into two molecular subtypes with distinct prognoses, namely proliferation and non-proliferation class, based on integrating gene expression profiles with pathways deregulation and epigenetic alterations.19,20 The main traits of the proliferation subtype are associated with activation of pathways involved in cell proliferation, while the non-proliferation subtype is characterized by activation of canonical Wnt/β-catenin signaling pathway. Therefore, we combined gene mutations and pathways activation to distinguish the two subtypes of HCC: tumor with TP53 mutation and activated PI3K/AKT/mTOR or TGF-β pathway was defined as proliferation subtype and tumor with CTNNB1 mutation and activated Wnt/β-catenin pathway was considered as non-proliferation subtype. The pathway gene sets were retrieved from Hallmark gene sets downloaded from the MSigDB website, and the ssGSEA score for the pathways of each sample in the TGCA cohort was calculated using the “gsva” package in R software. Score greater than the median was considered as pathway activation. The TP53 and CTNNB1 mutation profiles of the TCGA cohort were acquired from the cBioPortal website.
Construction of the Prognostic Metabolic-Related Gene Signature
Batch effects of the public datasets were removed using the “sva” package in R software. Differentially expressed metabolic-related genes between normal and tumor tissues of the TCGA dataset were identified using the Wilcoxon test (FDR < 0.05, | Log2(fold-change) | > 1). We then performed a univariate Cox regression analysis in the TCGA cohort to identify metabolic-related genes associated with prognosis (P < 0.05). The least absolute shrinkage and selection operator (LASSO) COX regression analysis was then conducted to construct the prognostic signature with 1000-fold cross-validation using the “glmnet” package in R software.21 Each patient’s risk score in four cohorts was calculated on a signature basis and standardized using SPSS software (version 23.0; IBM). All patients were categorized into high- or low-risk groups based on the median split of the TCGA cohort. The Kaplan–Meier survival curves of high- and low-risk groups were compared using the Log rank test. Next, we performed time-dependent receiver operating characteristic (ROC) analysis using the “timeROC” package in R software to assess the predictive accuracy of the signature.
Construction and Assessment of the Signature-Based Nomogram
Independent OS prognostic factors determined by the multivariate Cox regression analysis of TCGA cohort were integrated to construct the nomogram using the “rms” package in R software. The calibration curve and ROC analysis were subsequently conducted to assess the predictive performance of the nomogram. Additionally, the net clinical benefit of the nomogram was evaluated using decision curve analysis.
Gene Set Enrichment Analysis (GSEA)
To explore the different metabolism and biological pathways between high- and low-risk groups, we performed GSEA in the GSEA software (version 4.0.3) using Hallmark and C2 (KEGG) gene sets downloaded from the MSigDB website. P value and FDR less than 0.05 were considered statistically significant.
Single-Sample Gene Set Enrichment Analysis (ssGSEA)
To investigated the difference of tumor immune cell infiltration landscape between high- and low-risk groups, we performed ssGSEA based on the TCGA dataset using “gsva” package in R software. Using a deconvolution-based method, ssGESA can assess immune cell infiltration in single tumor sample.22 The abundance of immune cell was then clustered using the “sparcl” package in R software.
Statistical Analysis
Continuous variables were presented as median (minimum-maximum), and categorical variables were summarized as frequency (percentage). The Pearson chi-square test was used to analyze the association between signature and clinicopathologic characteristics. Statistical analyses were conducted in SPSS software (version 23.0; IBM) and R software (version 3.6.3). Multivariate Cox regression analysis was performed in a stepwise manner. The ability of the signature to identify molecular subtypes of HCC was evaluated using logistic regression analysis and ROC curve using “pROC” package in R software. In addition, the correlation of the risk score with the expression of metabolic enzymes and immune checkpoint molecules was tested using the “corrplot” package in R software. A two-tailed P value of less than 0.05 was considered statistically significant.
Results
Establishment of a Prognostic Metabolic-Related Gene Signature
Figure 1 summarizes the flow chart of this study. The demographic and clinic characteristics of HCC patients in training and validation cohorts are shown in Table 1. A total of 131 differentially expressed metabolic-related genes were identified in the TCGA dataset (Supplementary Figure S1A, B). We then analyzed a group of 58 candidate OS-associated genes (Supplementary Table S1) screened from the above genes using the COX regression analysis of LASSO. Finally, 10 the most valuable genes were selected to construct the signature (Supplementary Figure S1C, D). The detailed description and coefficients of these genes are shown in Table 2. The signature risk score was defined as the sum of the expression levels of the 10 coefficients-weighted genes: (0.006533217 * HEXB) + (−0.000601418 * CYP2C9) + (0.02286243 * ATIC) + (0.001574899 * G6PD) + (0.008226413 * LPCAT1) + (0.02908161 * RRM1) + (0.013628698 * RRM2) + (0.012162138 * TXNRD1) + (0.006466633 * ME1) + (−0.001026019 * ADH1C). The expression patterns of these genes between normal and HCC tissues were then investigated in the TCGA dataset. The mRNA levels of ADH1C and CYP2C9 in normal liver tissues were higher than in tumor tissues, while the expression patterns of other genes were opposite (Supplementary Figure S2), indicating potentially different roles of these genes in HCC progression.
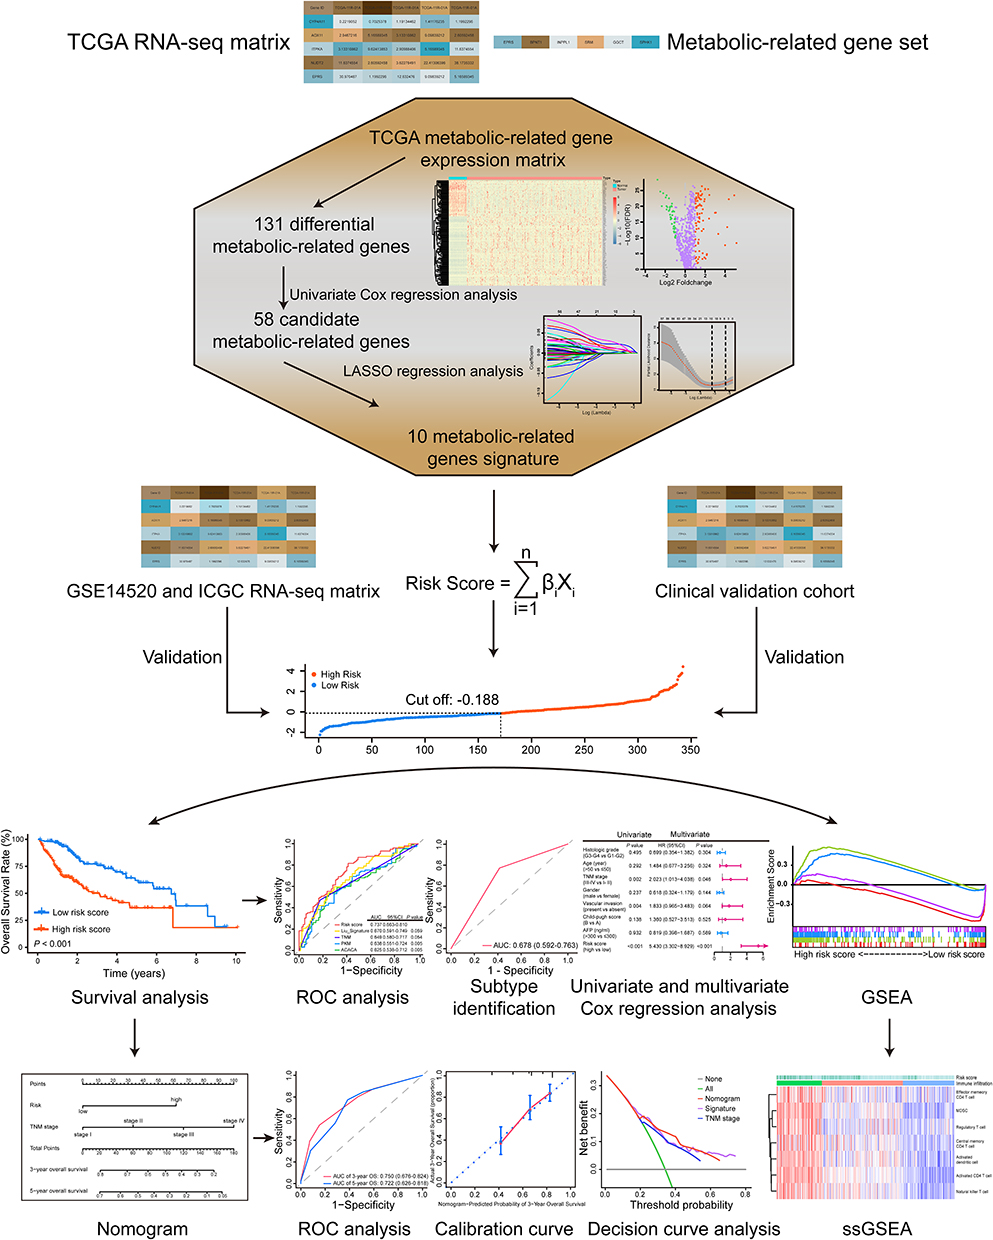 |
Figure 1 The work flow of this study. A 10 metabolic-related gene signature was constructed based on the TCGA RNA-seq matrix and validated in independent public and clinical cohorts. The risk-stratification and subtype-identification ability of the signature were evaluated. A nomogram was also established to improve the predictive accuracy and net benefit of the signature. Besides, the metabolic and immune features associated with the signature were dissected using GSEA and ssGSEA. |
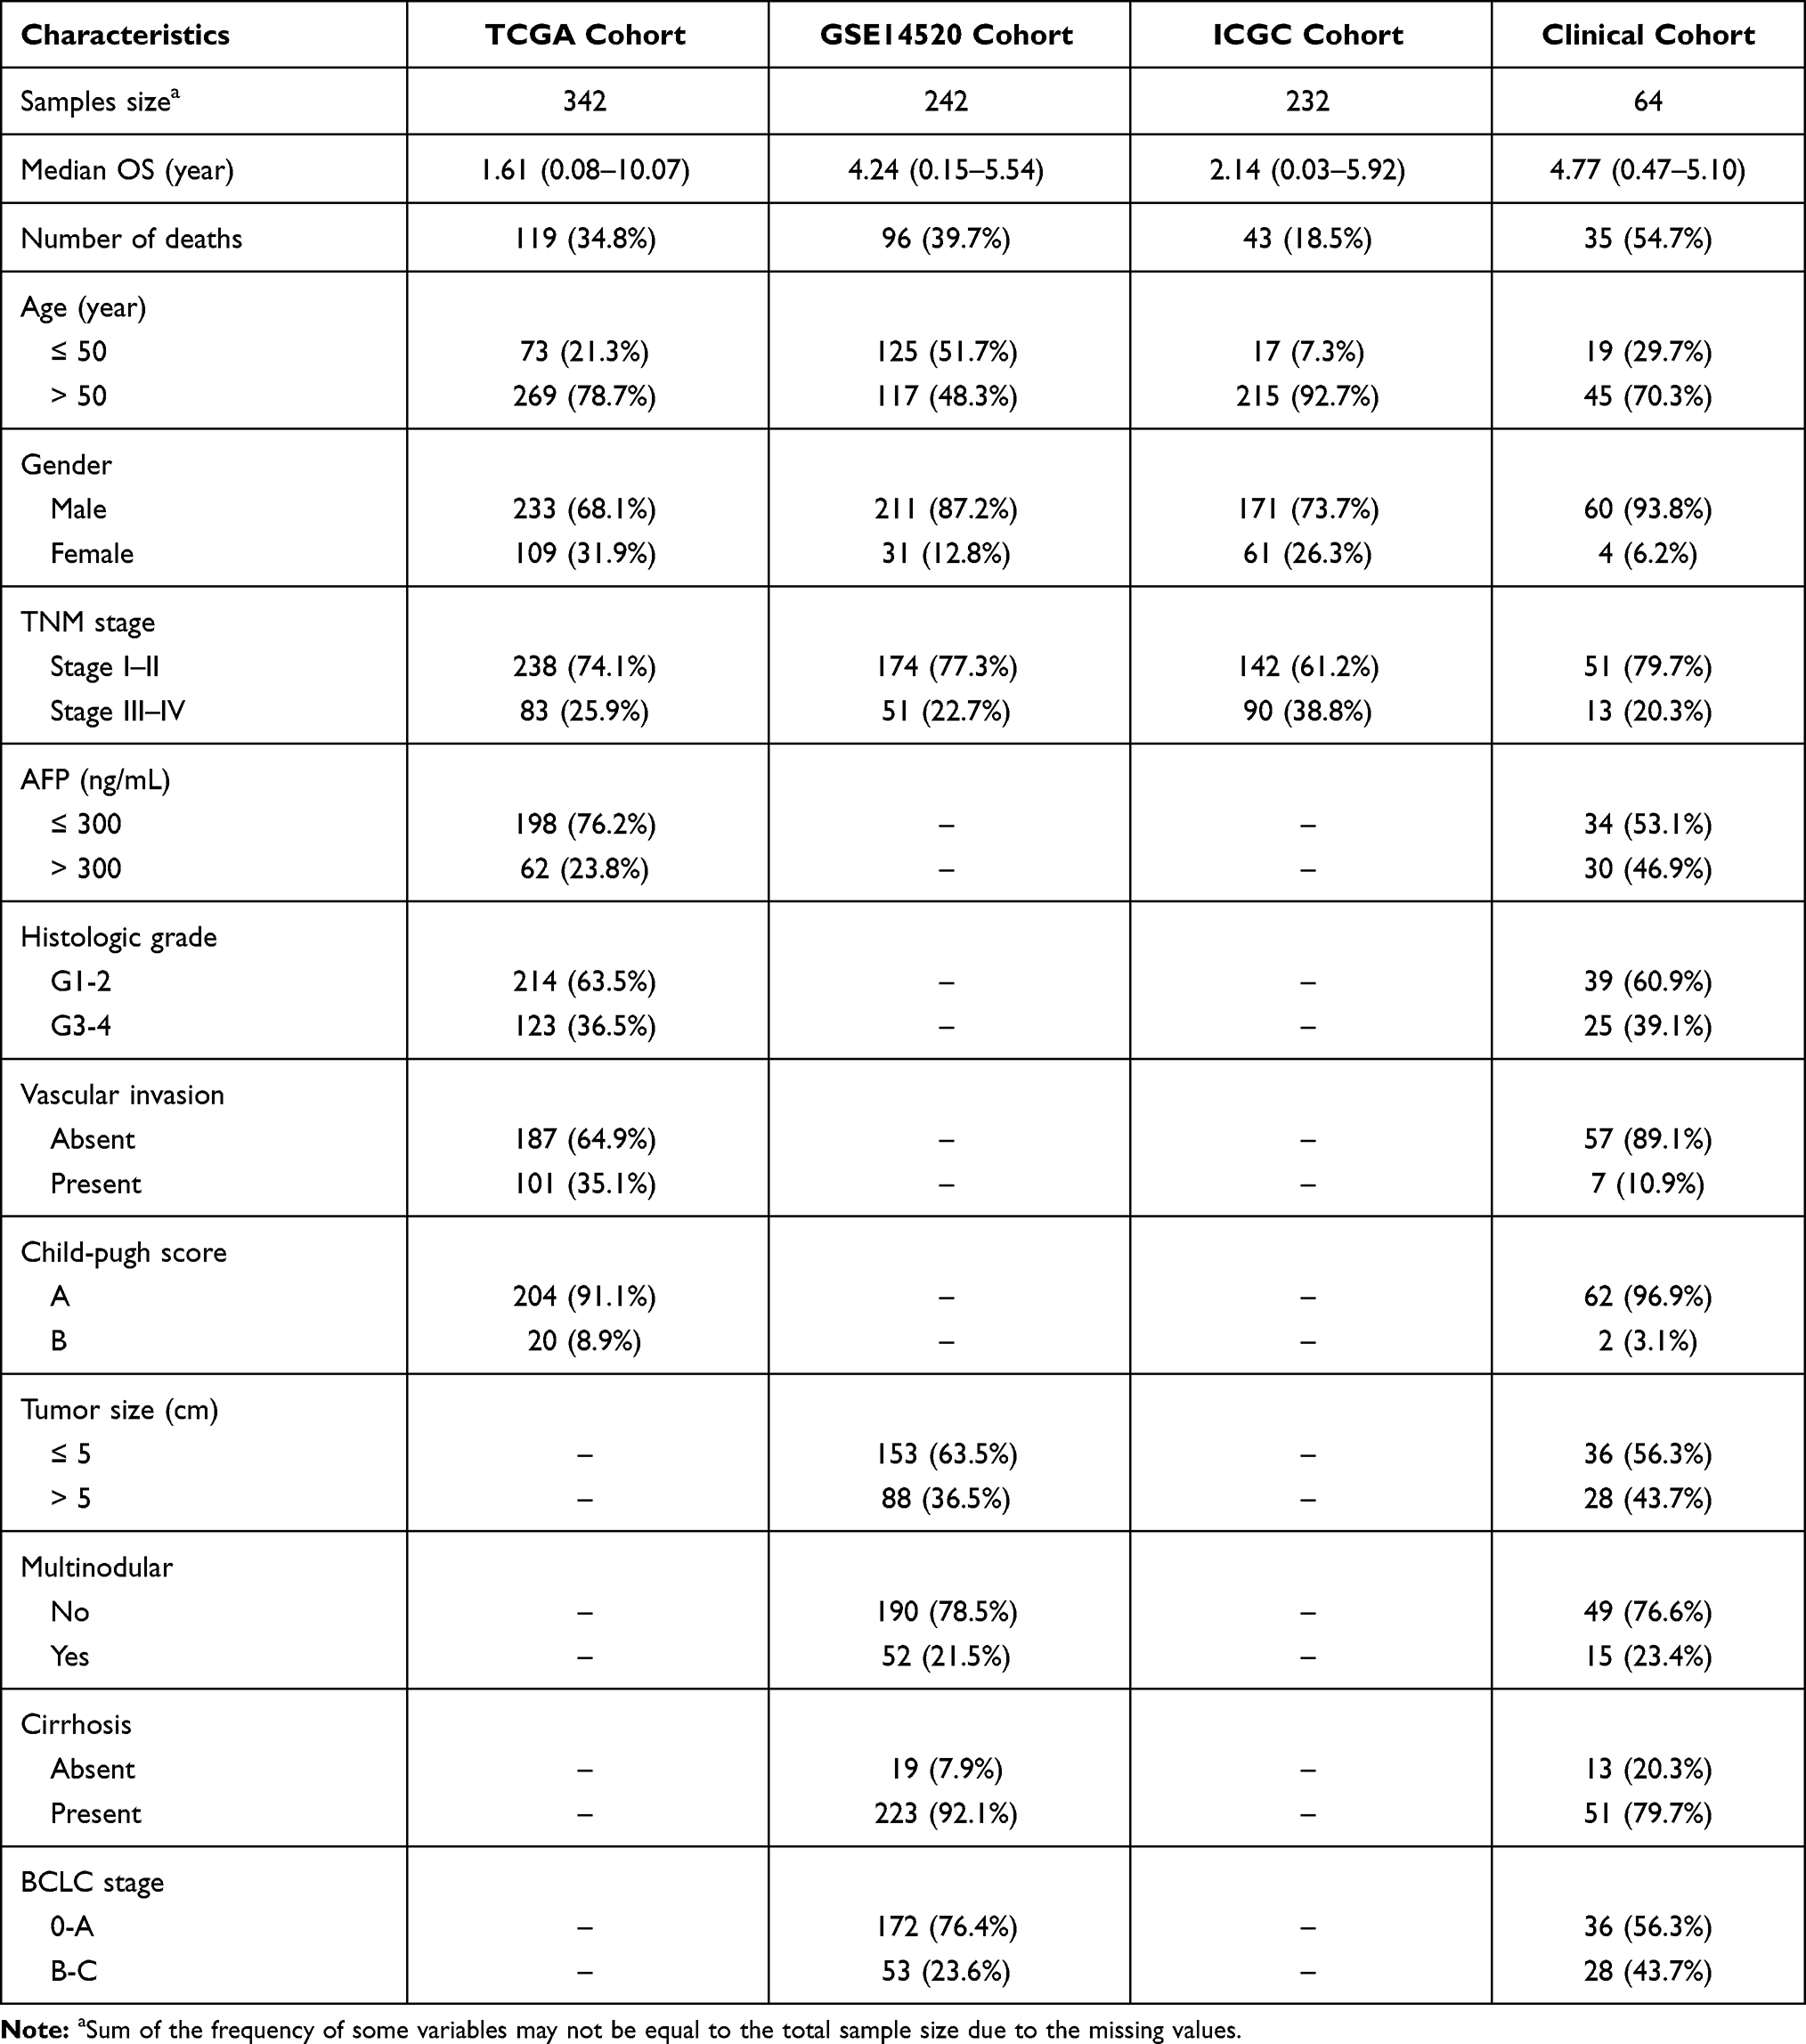 |
Table 1 Clinicopathologic Characteristics of HCC Patients in Training and Validation Cohorts |
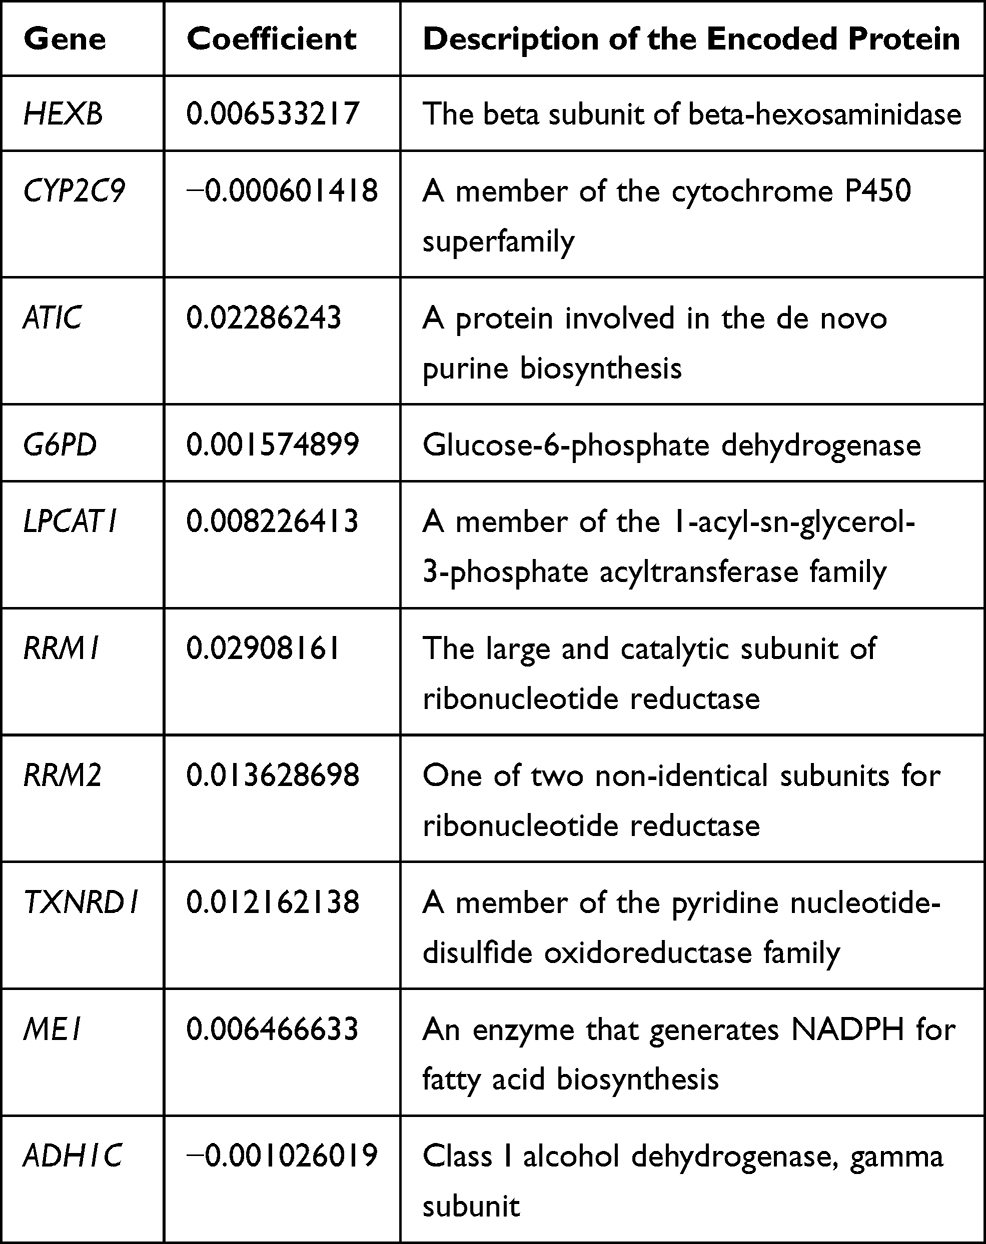 |
Table 2 Description of 10 Metabolic-Related Genes Identified by LASSO Regression Analysis |
The Risk-Stratification and Subtype-Identification Value of the Signature in HCC
After standardization, the median risk score of the TCGA cohort was −0.188 and served as the cut-off point for assigning patients to high- and low-risk groups (Figure 2A). The Kaplan-Meier analysis demonstrated that patients with high risk scores experienced substantially lower OS rates than those with low risk scores (P < 0.001; Figure 2B). To confirm the robust prognostic value of the signature, we further validated these findings in multiple independent public cohorts. Patients were classified into high- and low-risk groups based on the same cut-off point. The results of the survival analyses were consistent with the findings of the training cohort (ICGC: P < 0.001; GSE14520: P = 0.010; Figure 2C–F). The accuracy of the signature in predicting 3- and 5-year OS was then evaluated using time-dependent ROC curves, yielding AUC values of 0.737 [95% CI: 0.663–0.810] and 0.711 [95% CI: 0.616–0.805], respectively, higher than that of several prognosis-associated metabolic genes in HCC such as PKM and ACACA15,23 (Figure 3A–B). Furthermore, our signature had a relatively better predictive output than the tumor-nodes-metastasis (TNM) stage and a published 4‐gene metabolic signature.24
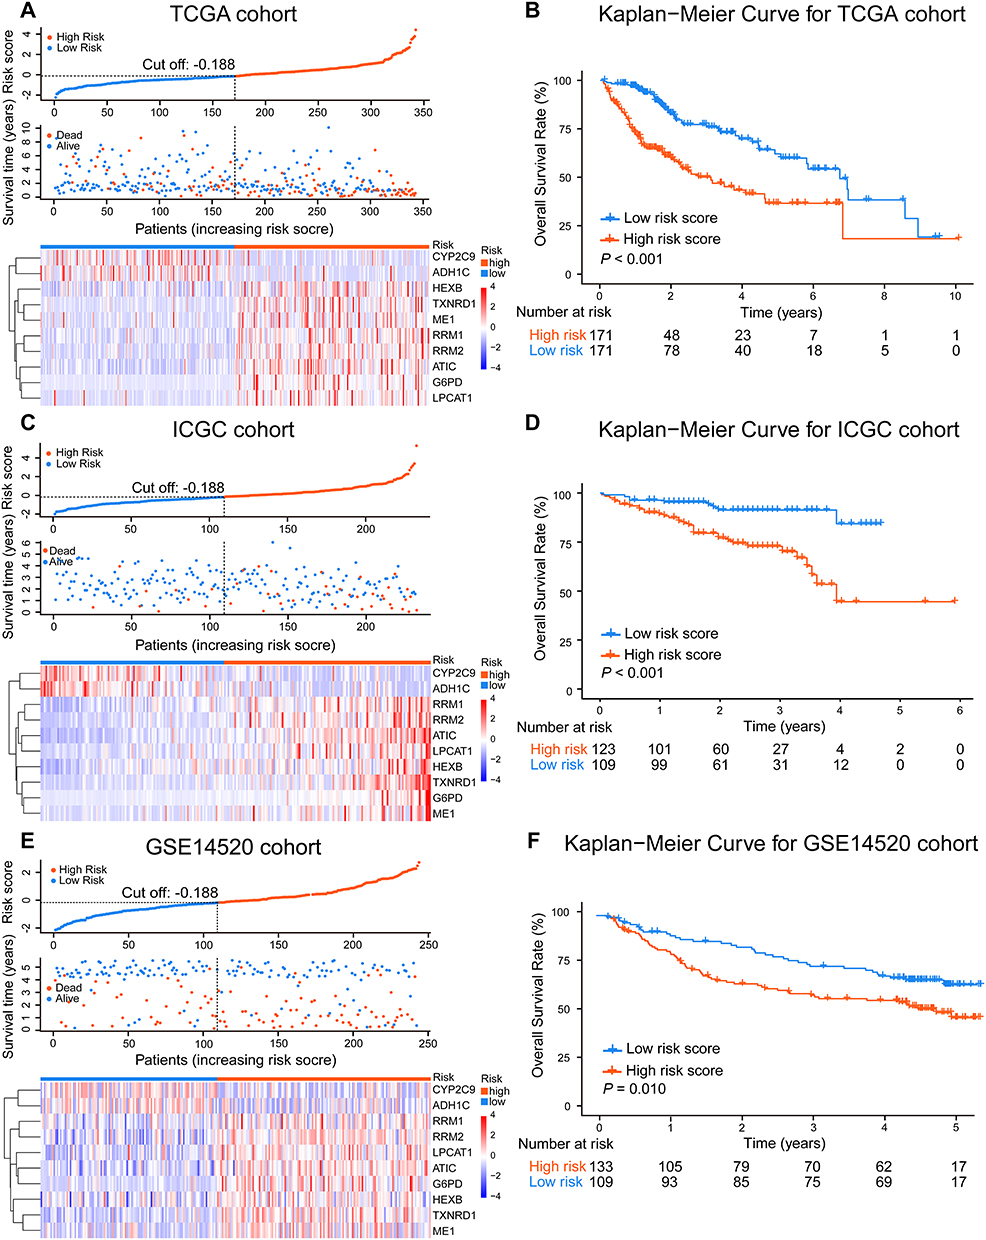 |
Figure 2 The risk-stratification ability of the signature in HCC. The risk score of each patient and the heatmap of selected 10 metabolic-related genes mRNA expression in TCGA (A), ICGC (C), and GSE14520 (E) cohorts. The Kaplan-Meier OS analyses of HCC patients classified by the signature in TCGA (B), ICGC (D), and GSE14520 (F) cohorts. High- and low-risk patients were grouped based on the same cut-off point and survival difference between the two groups was assessed using the Log rank test. |
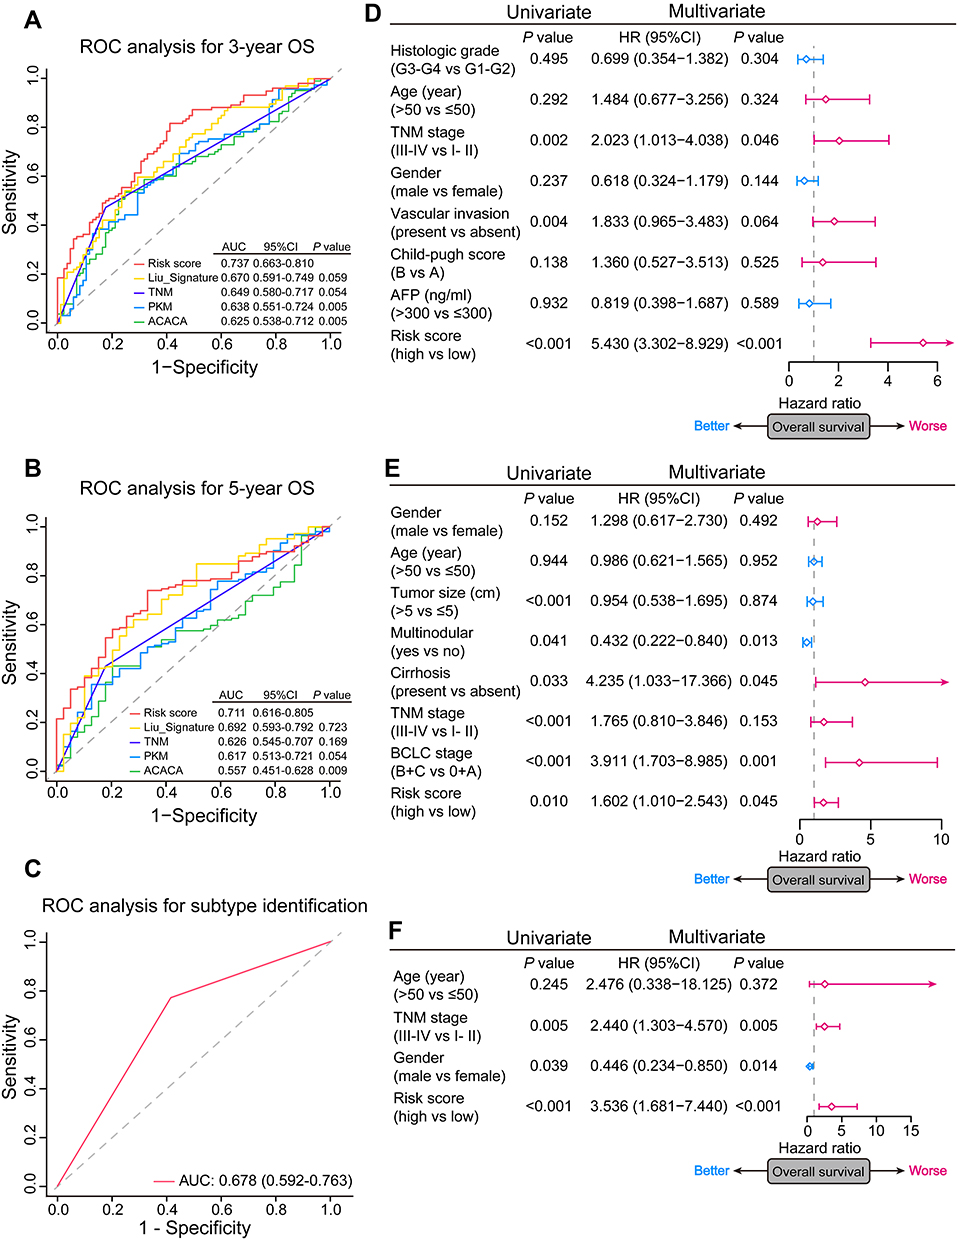 |
Figure 3 The prognostic and subtype-identification value of the signature in HCC. (A and B) Time-dependent ROC analyses of predictive accuracy of the signature, TNM stage, a published metabolic prognostic signature, and several prognosis-associated metabolic genes for 3- and 5-year OS of patients in the TCGA cohort. (C) ROC analyses of predictive accuracy of the signature for HCC molecular subtypes identification. (D–F) Forest plots of univariate and multivariate Cox regression analyses of the OS in the TCGA, GSE14520, and ICGC cohorts. The square represents HR and the horizontal line represents 95% CI. |
Besides risk stratification, we also investigated the ability of the signature to identify molecular subtypes of HCC. A total of 61 and 53 HCCs were identified in the TCGA dataset as proliferation and non-proliferation subtypes. Patients in the proliferation subtype identified had aggressive tumors depicted previously19 as evidenced by the worse outcome (P = 0.049; Supplementary Figure S3), low tumor differentiation (P = 0.224), high alpha-fetoprotein (AFP) levels (P = 0.514), and vascular invasion (P = 0.666) (Table S2). Tumors in the proliferation subtype also had an enrichment of risk scores (P < 0.001; Supplementary Table S2). Furthermore, the ROC curve showed that our signature could distinguish the proliferation and non-proliferation subtypes of HCC (AUC = 0.678 [95% CI: 0.592–0.763]; Figure 3C).
We then explored the relationship between the risk score and clinicopathological features. In TCGA cohort, a high risk score was associated with advanced tumor (P = 0.001), poor tumor differentiation (P < 0.001) and vascular invasion (P = 0.001) (Table 3). A positive correlation between the risk score and the TNM stage was observed in ICGC and GSE14520 cohorts (Table S3). Univariate and multivariate Cox regression analyses indicated that both the risk score (P < 0.001) and the TNM stage (P = 0.046) were independent risk factors for OS in the TCGA cohort (Figure 3D). Similarly, the risk score remained an independent prognostic indicator for OS in the other two validation cohorts (Figure 3E–F). Collectively, these findings highlighted the robustness and independence of our metabolic-related gene signature in predicting unfavorable prognosis, as well as its potential molecular subtype-identification ability in HCC patients.
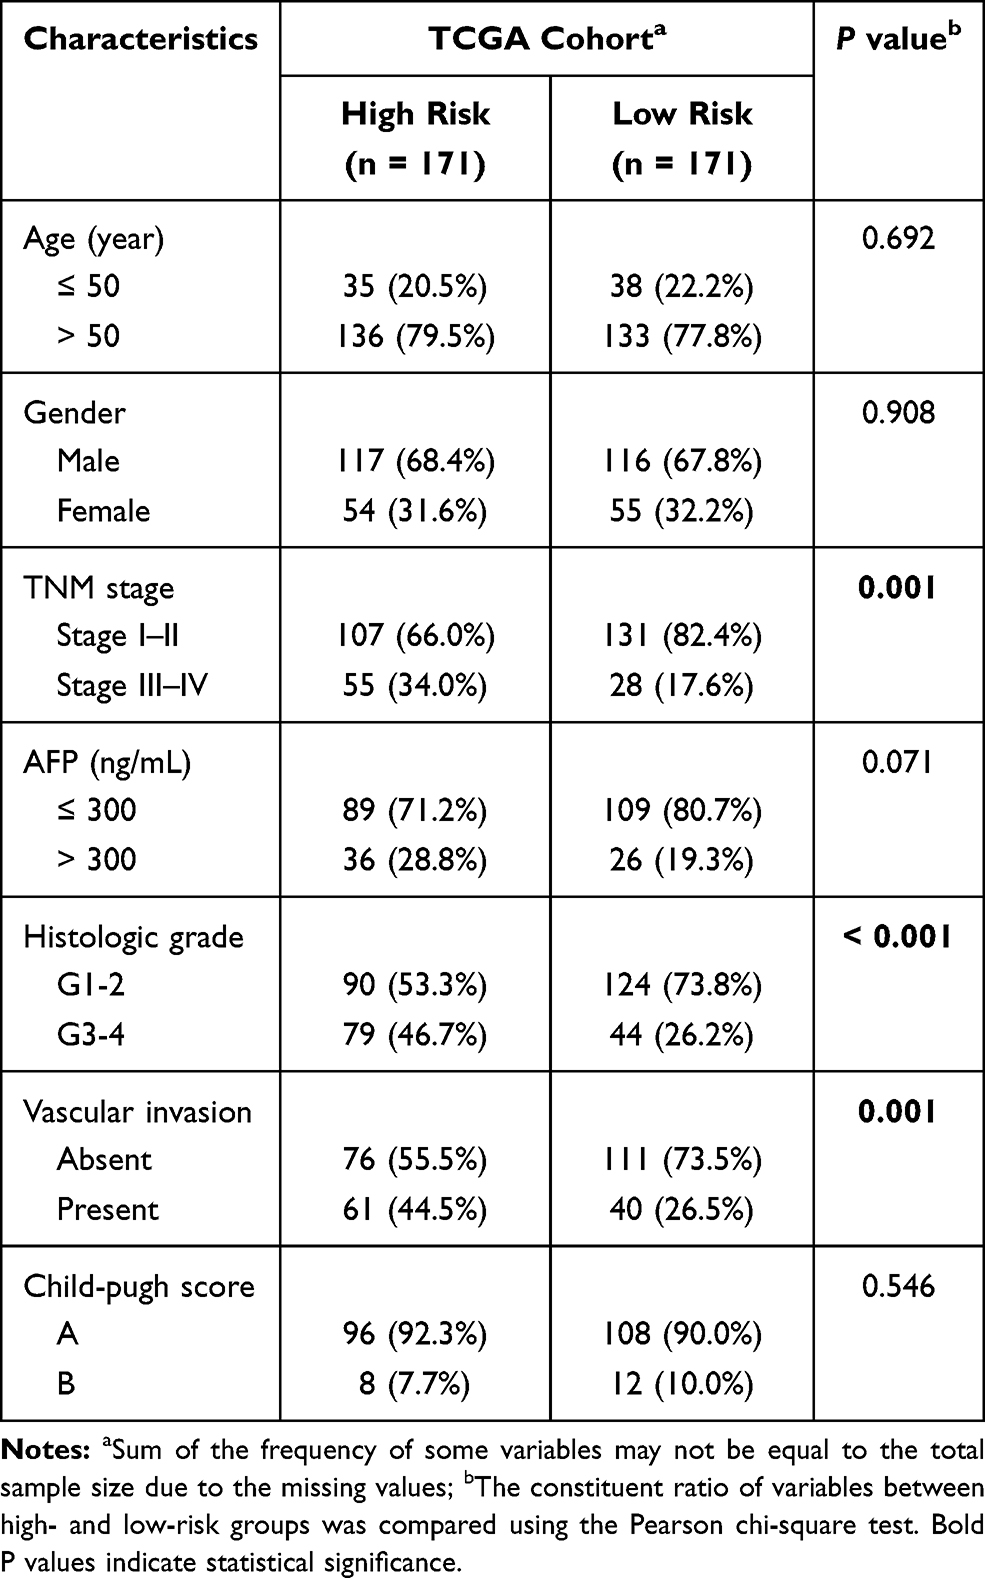 |
Table 3 Correlation of Risk Score with Clinicopathologic Characteristics of HCC Patients in the TCGA Cohort |
Metabolic Changes and Biological Pathways Associated with the Signature
To reveal crucial metabolic changes and pathways related to HCC prognosis, we performed GSEA to investigate the enriched gene sets in high- and low-risk groups of the TCGA cohort. The results of Hallmark and KEGG gene sets showed that several essential metabolic processes such as glycolysis and lipid metabolism were enriched in the high-risk group, whereas processes such as bile acid and fatty acid metabolism were enriched in the low-risk group (Figure 4A). In addition, several cancer-related pathways such as PI3K/AKT/mTOR pathway, Wnt/β-catenin pathway, JAK/STAT3 pathway, and TGF-β pathway appeared to be activated in the high-risk group (Figure 4B). To corroborate the association between signature and metabolic alteration, we further investigated the correlation of risk score with mRNA expression of key rate-limiting enzymes of various important metabolisms. The risk score was strongly positively correlated with the expression of key glycolysis enzymes (PKM) and glycogen synthesis enzymes (GSK3A, CS), but negatively correlated with the expression of key gluconeogenesis enzymes (G6PC, FBP1, PCK1) as shown in Figure 4C. Meanwhile, a significantly positive correlation was observed between the risk score and expression of the fatty acid synthesis enzymes (ACLY, ACACA). Furthermore, ketogenesis seemed to be inhibited in high-risk tumors due to the inverse association of risk score with the expression of ketogenic rate-limiting enzyme (HMGCS2). In summary, the signature can also reflect or predict significant metabolic characteristics and activated biological pathways in HCC besides the prognostic and predictive ability. These altered metabolisms and pathways may play an important role in HCC progression and patient survival.
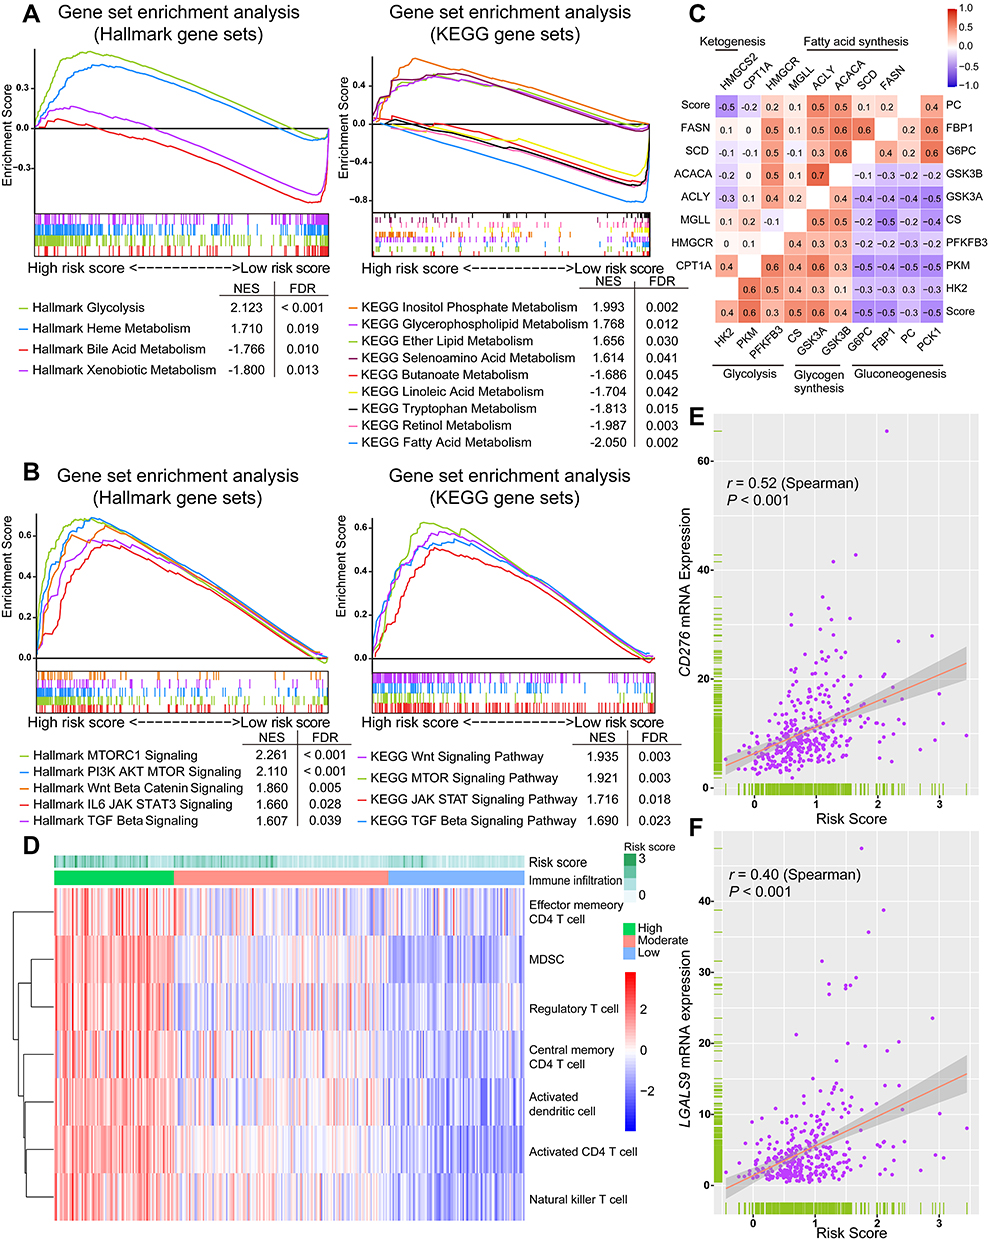 |
Figure 4 Potential metabolic and immune characteristics of HCC associated with the signature. (A) Differentially enriched metabolisms in high- and low-risk groups identified using GSEA. (B) Representative biological pathways enriched in the high-risk group. The metabolisms and biological pathways were ordered based on the normalized enrichment score (NES). (C) Correlation matrix of the risk score and key metabolic rate-limiting enzymes. (D) The heatmap of relative tumor abundance of several immune cell types calculated using ssGSEA. The upper horizontal bars marked the risk score of each tumor sample in the TCGA cohort. (E and F) Spearman correlation of the risk score with mRNA expression of CD276 and LGALS9. |
Alterations of Tumor Immune Features Associated with the Signature
To investigate whether changes occur in tumor immune characteristics relevant to the signature, we carried out a ssGSEA based on the TCGA dataset to determine the relative abundance of several types of immune cells in each sample. The immune cell infiltration was clustered into three subgroups, termed high, moderate, and low infiltration (Figure 4D). The heatmap showed that tumor with high risk score tended to be in a status of relatively high tumor infiltration of memory and activated CD4 T cells, activated DC, NKT, Treg, and myeloid-derived suppressor cells (MDSC). Moreover, to confirm the hypothesis that the level of intra-tumoral immune checkpoint molecule may be affected by the changed tumor immune infiltration, we analyzed the correlation between the risk score and the expression level of known immune checkpoint molecules. Spearman correlation analyses showed a positive correlation between the risk score and the mRNA expression of CD276 (r = 0.52, P < 0.001) and LGALS9 (r = 0.40, P < 0.001) (Figure 4E and F). These findings confirmed the clinical significance of our signature, with a possible role in screening HCC patients for immunotherapy responders.
Clinical Validation of the Prognostic Value of the Signature
To explore the feasibility of translating our signature into a clinical risk-stratification assay, we further measured the expression level of the selected 10 metabolic genes in a clinical cohort of 64 HCC patients using a PCR array. There were 35 deaths (54.7%) and a median OS time of 4.77 years (range, 0.47 to 5.10 years) among these patients (Table 1). 41 patients with a standardized risk score above −0.188 were defined as the high-risk group, and the rest were classified in the low-risk group (Figure 5A). Once again, the duration of OS showed significant variation between high- and low-risk groups (P = 0.009; Figure 5B), consistent with the findings of our training and public validation cohorts. Subsequent univariate and multivariate Cox regression analyses also revealed that high risk score was an independent risk factor for poor OS in HCC patients (HR = 3.145 [95% CI = 1.259–7.853], P = 0.014; Figure 5C). These results clinically validated the robust risk-stratification ability of our signature in HCC, indicating that this metabolic-related gene signature can function in the clinic as an independent classifier for HCC patient stratification.
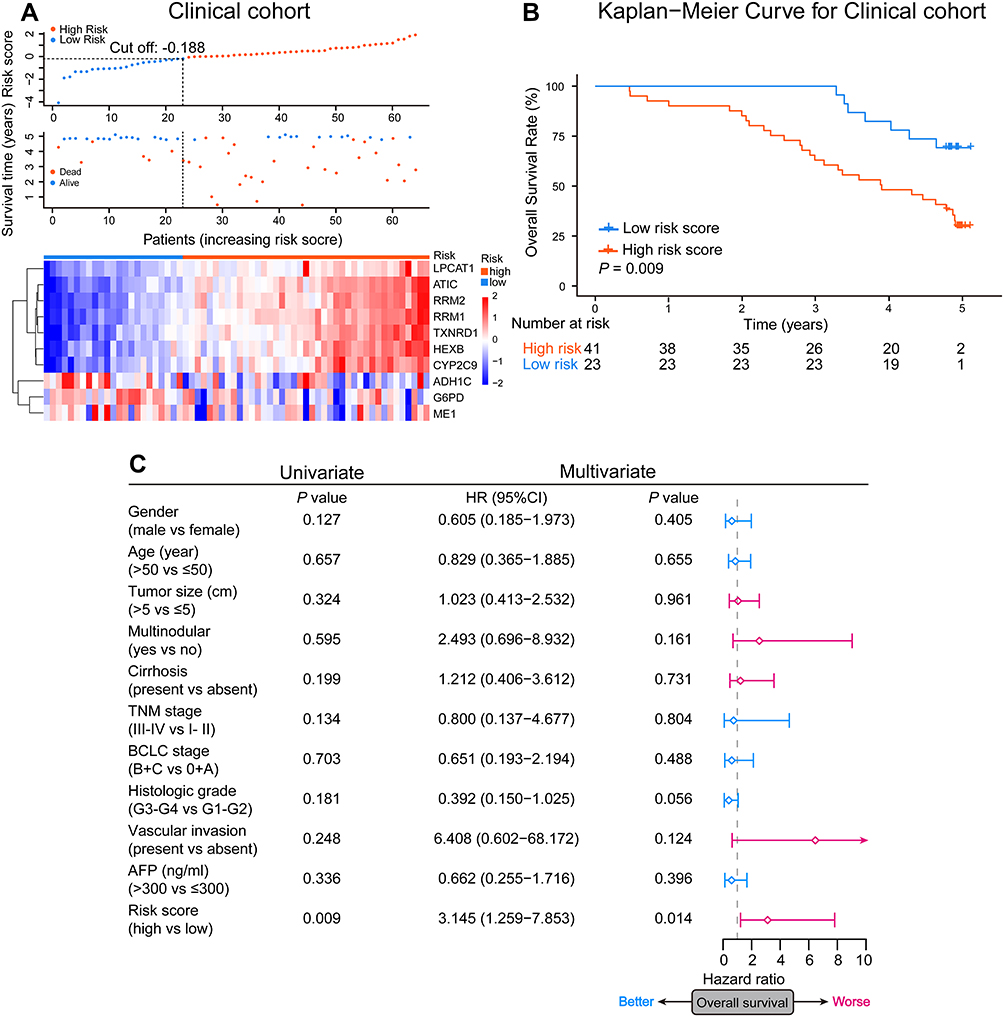 |
Figure 5 Clinical validation of the prognostic value of the signature. (A) Each patient’s risk score and the heatmap of selected 10 metabolic-related genes mRNA expression in the clinical cohort. (B) The Kaplan-Meier OS analyses of HCC patients classified by the signature in the clinical cohort. P value was determined using the Log rank test. (C) Forest plots of univariate and multivariate Cox regression analyses of the OS in the clinical cohort. The square represents HR and the horizontal line represents 95% CI. |
Construction and Assessment of a Signature-Based Nomogram
To improve the predictive performance of our signature and promote its clinical translation, we constructed a nomogram integrating the signature and independent prognostic indicator TNM stage to predict the probability of 3- and 5-year OS in HCC patients (Figure 6A). The calibration curve showed a very consistent actual survival time and a predicted 3- and 5-year OS probability in the TCGA cohort (Figure 6B). The public and clinical validation cohorts also verified the excellent predictive accuracy of the nomogram (Figure 6C–E). Furthermore, ROC analyses demonstrated that when combined with the TNM stage, the discriminatory ability of the signature was significantly enhanced (3-year OS: TCGA, AUC = 0.750 [95% CI: 0.676–0.824]; GSE14520, AUC = 0.727 [95% CI: 0.652–0.802]; ICGC: AUC = 0.743 [95% CI: 0.642–0.844]; Clinical cohort: AUC = 0.735 [95% CI: 0.608–0.861]; 5-year OS: TCGA, AUC = 0.722 [95% CI: 0.626–0.818]; GSE14520, AUC = 0.768 [95% CI: 0.687–0.850]; ICGC: AUC = 0.572 [95% CI: 0.424–0.720]; Clinical cohort: AUC = 0.701 [95% CI: 0.443–0.960]; Figure 7A–D).
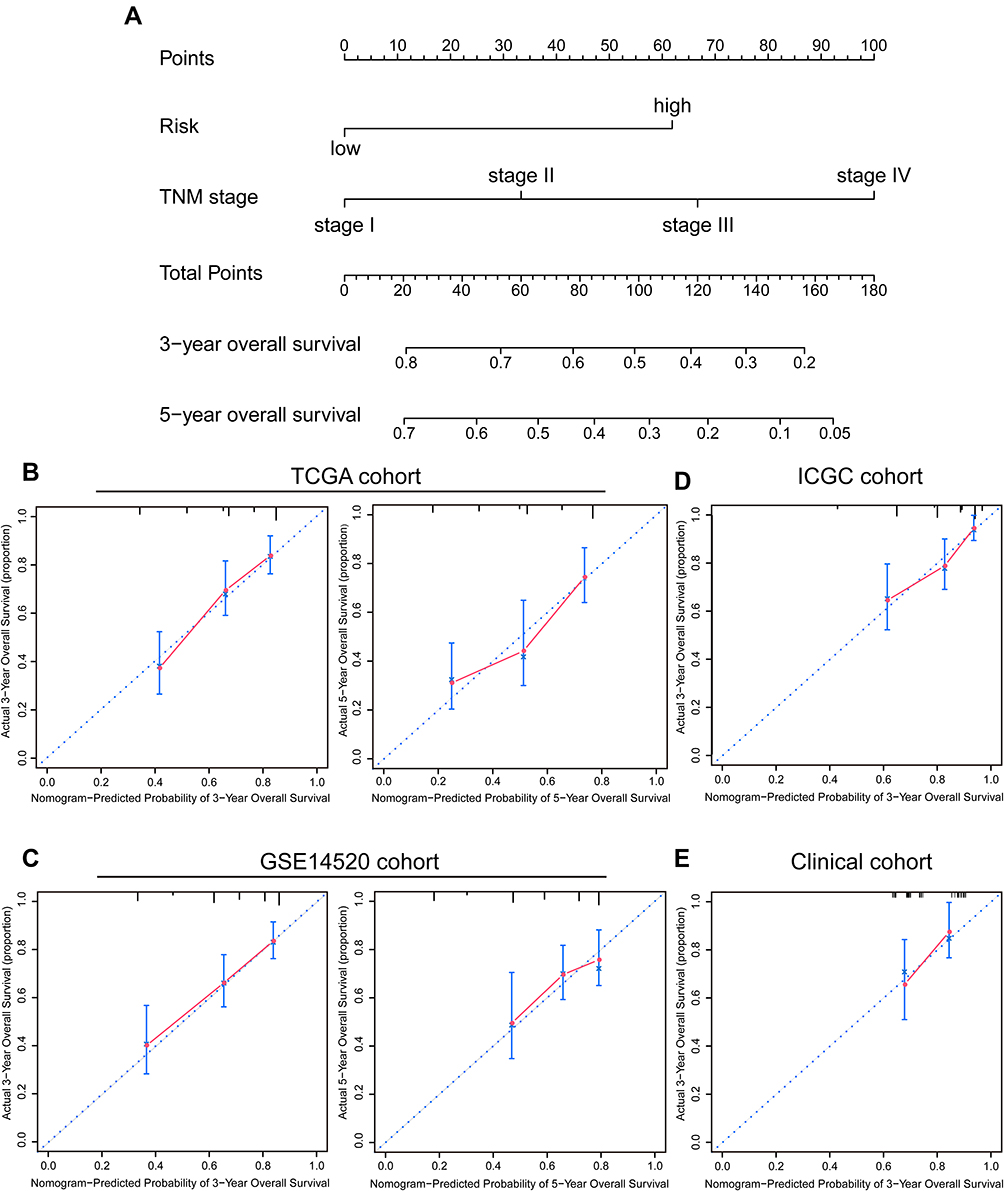 |
Figure 6 Construction and assessment of the signature-based nomogram. (A) A nomogram constructed based on the TCGA cohort for predicting OS of HCC patients. The probability of 3- and 5-year OS can be determined by drawing a vertical line from the total point scale to the corresponding probability axis. (B–E) Calibration curves evaluating the consistency of the actual survival time and nomogram-predicted probability of 3- and 5-year OS in TCGA, GSE14520, ICGC, and clinical cohorts. The 45-degree line represents an ideal predictive accuracy. |
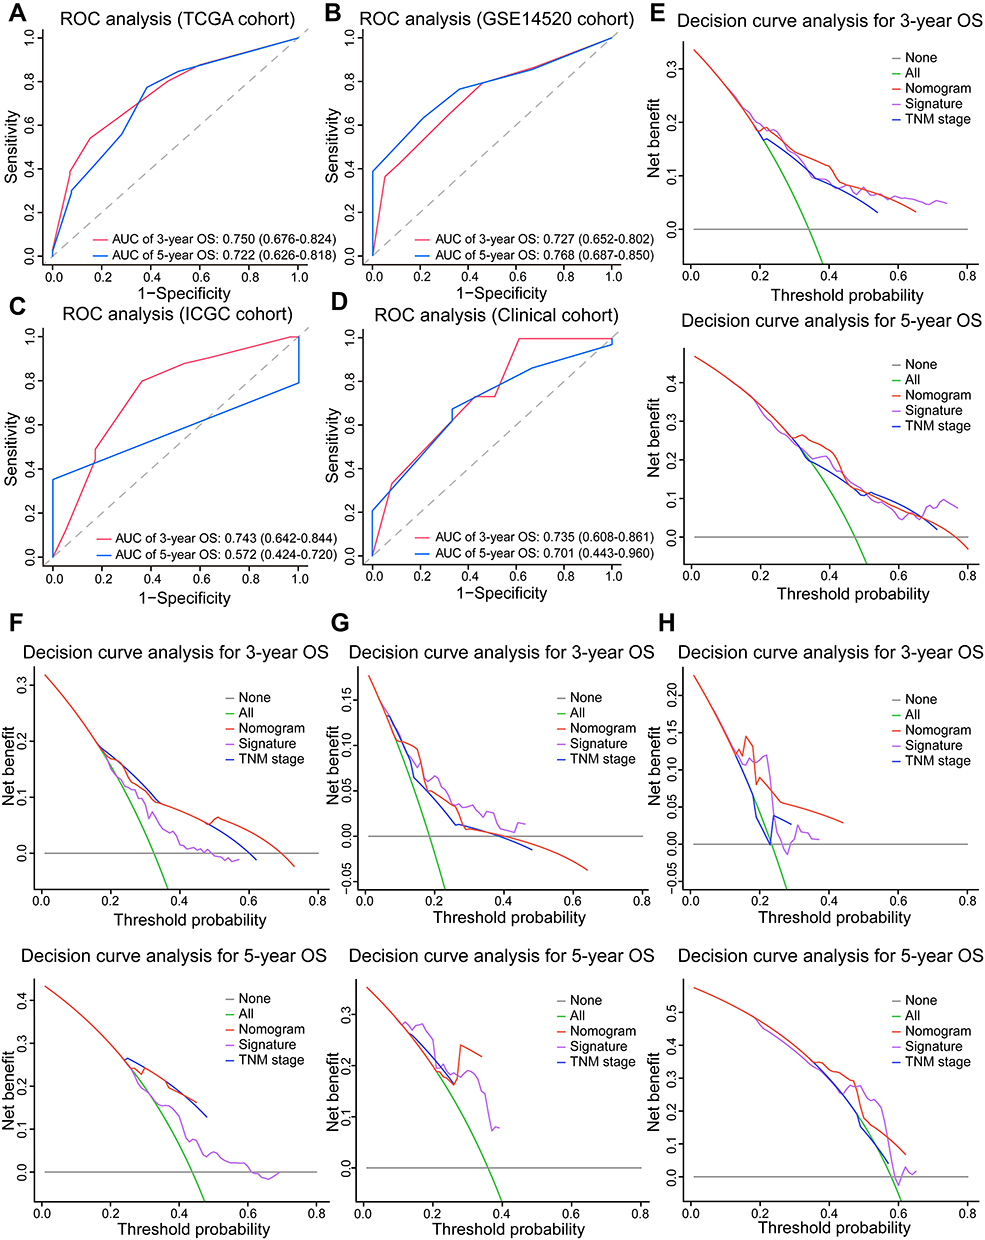 |
Figure 7 The predictive accuracy and net benefit of the signature-based nomogram in HCC. (A–D) ROC analyses of the nomogram’s predictive efficacy for 3- and 5-year OS of patients in TCGA, GSE14520, ICGC, and clinical cohorts. (E–H) Decision curve analysis of the net clinical benefit of the nomogram (red line), the signature (purple line), and TNM stage (blue line) for predicting 3- and 5-year OS of patients in TCGA, GSE14520, ICGC, and clinical cohorts. The gray and green lines represent no deaths and death of all patients within 3 or 5 years, respectively. |
We further performed a decision curve analysis to investigate whether the net clinical benefit of signature or TNM stage alone can be increased when integrated into the nomogram. The TCGA cohort results showed that when the 3- and 5-year OS threshold probability ranged from 0.3 to 0.5, using the nomogram could achieve a greater net benefit than using the signature or TNM stage (Figure 7E). Similarly, the increased net benefit was also observed in three validation cohorts (Figure 7F–H). Collectively, these results highlighted the clinical significance of our signature which had a superior predictive power and brought more net clinical benefit to HCC patients in combination with existing TNM stage.
Discussion
HCC is a fairly heterogeneous tumor with great variation of individual clinical outcome. In this scenario, efforts are underway to develop effective prognostic molecule signatures based on specific characteristics such as TP53 mutation status and gene-related immune status.25,26 The important role of metabolic dysregulation is gradually being recognized in the progression and prognosis of HCC. Therefore, we constructed a novel prognostic signature consisting of 10 metabolic-related genes and validated its robust and independent prognostic value in public datasets and a real-world cohort of HCC patients. Besides, the more adequate clinical validation with a relatively higher predictive accuracy of our signature indicated improved reliability compared to a previously reported 4‐gene metabolic prognostic model.24 Meanwhile, integrating the signature and TNM stage in a nomogram successfully improved the predictive accuracy and provided patients with more net clinical benefit than the signature or TNM stage alone. Therefore, our signature can complement the existing prediction system and have great clinical translational potential in the identification of high-risk HCC patients.
Identification of molecular subtypes can help achieve precise treatment of HCC in the clinic but has not been implemented yet due to the requirement of sophisticated analyses and lack of a consensus on classification standards. In this study, we classified tumors in HCC subtypes based on well-characterized molecular events, and the consistent clinical characteristics of identified subtypes with previous subtypes overview supported our classification. The correlation of the subtypes identified with some clinical features was not significant, partly because of the small number of included patients. Importantly, our signature provides a convenient platform for initial identification of HCC molecular subtypes, allowing clinicians to evaluate the survival risk and tailor individualized treatment regimens for HCC patients using the same risk score.
Another unique advantage of this metabolic gene-based signature is that it can provide a more comprehensive insight into essential metabolic dysregulation during HCC progression. The differentially enriched metabolic processes in both high- and low-risk groups greatly influence the development of HCC and the patient prognosis. For example, enhanced glycolysis is a typical metabolic reprogramming in cancer (Warburg effect) and contributes to the proliferation and metastasis of tumors.27 Lipogenesis is usually upregulated in hepatocarcinogenesis and involved in the antiangiogenic drug resistance and HCC progression.7,28 5-hydroxytryptamine can promote HCC proliferation and angiogenesis by activating the Wnt/β-catenin pathway.29 We also revealed potential oncogenic pathways underlying metabolic abnormalities, some of which have already been reported to be involved in the mechanism of metabolic alterations that promotes HCC.29,30 More specifically, the risk score has been strongly associated with the expression of some key rate-limiting enzymes, confirming the signature metabolic association. The importance of these enzymes, such as FBP1, PCK1, and HMGCS2, in the development of HCC has been highlighted.12,31,32 For instance, FBP1, which is negatively correlated with the risk score, acts as an important metabolic HCC suppressor to inhibit tumorigenesis.32 The dysregulated metabolic landscapes and enzyme expression may partially explain the association of our signature with adverse clinicopathological features and poor prognosis and set the stage for in-depth basic research. Our signature can also reflect specific metabolic characteristics and enzyme targets of tumors with different risk scores, making it attractive in guiding future metabolic therapy for clinical application.
Metabolic changes also have a profound effect on the immune microenvironment of the tumor. In this study, we observed a relatively high tumor infiltration of several immune cell types including NKT, DC, Treg, and MDSC in high-risk group. NKT cells are CD1d restricted and recognize lipid antigens.33 Therefore, altered tumor lipid metabolism is supposed to affect the antigen recognition function of NKT cells. Lipid metabolism can also impair the antigen-presenting ability of DC, thereby facilitating immunosuppression.34 From this point of view, although the infiltration of CD4 T cells, NKT cells, and DC increases in tumors with high risk score, their anti-tumor functions may be abolished by the co-infiltration of Treg and MDSC, as well as aberrant metabolism. This assumption was confirmed by the positive correlation between risk score and expression level of immune checkpoint molecules. Therefore, our signature can, to some extent, reflect the tumor immune characteristics of HCC patients and thus may help guide the HCC immune therapy.
Most metabolic-related genes in the signature have been reported to participate in hepatocarcinogenesis and HCC progression. The ADH1C and CYP2C9 level were higher in the normal liver tissues than tumor tissues, indicating a potential anti-tumor role of two genes. CYP2C9, a drug-metabolizing enzyme, is always downregulated in HCC and inversely associated with hepatocarcinogenesis.35 On the contrary, other genes may act as tumor promoters. The bifunctional enzyme ATIC, for example, promotes the proliferation and invasion of HCC cells through AMPK/mTOR/S6 K1 signaling.36 Besides, TXNRD1 and RRM2 are two reductases that can protect HCC from oxidative stress damage and promote proliferation.37,38 Inhibition the function of these two enzymes can sensitize HCC cells to sorafenib treatment.39,40 RRM2 is also found to promote the RNA replication of hepatitis B and C viruses, two known causes of HCC, indicating an important role of this enzyme in the development of virus-related HCC.41,42 Lysophosphatidylcholine acyltransferase LPCAT1 can regulate phospholipid composition to create a favorable condition for cells, promoting HCC proliferation, migration, and invasion.43 It is reported that glucose-6-phosphate dehydrogenase G6PD can protect tumor cell from aflatoxin-induced cytotoxicity via producing NADPH.44 However, more evidence demonstrates that increased G6PD contributes to proliferation, migration, invasion, and oxaliplatin-resistance of HCC cells by activating the pentose phosphate pathway.45,46 The role of some enzymes like alcohol-metabolizing enzyme ADH1C and malic enzyme ME1 in HCC remains unclear and thus more mechanism research is warranted.
This study has some limitations. First, although we employed a real-world cohort to minimize the adverse impact of incomplete clinical data of HCC patients in public datasets on statistical reliability and validity, a large-scale, prospective and multi-central validation cohort is highly desirable in the future. Second, further investigations are required to assess the additional value of our signature in identifying molecular subtypes and guiding metabolic and immune therapies in HCC.
Conclusions
We developed and validated a 10 metabolic gene-based prognostic signature for HCC based on four independent cohorts. The signature has a robust and independent prognostic value and contributes to subtypes identification in HCC. Also, it can provide a comprehensive view of metabolic and immune features in HCC. The applicability of signature-based nomogram in clinical practice requires further study.
Abbreviations
AFP, alpha-fetoprotein; GEO, Gene Expression Omnibus; GSEA, gene set enrichment analysis; HCC, hepatocellular carcinoma; ICGC, International Cancer Genome Consortium; LASSO, least absolute shrinkage and selection operator; MDSC, myeloid-derived suppressor cells; MSigDB, Molecular Signatures Database; OS, overall survival; ROC, receiver operating characteristic; ssGSEA, single-sample gene set enrichment analysis; TCGA, The Cancer Genome Atlas; TNM, tumor-nodes-metastasis.
Author Contributions
NR and YS conceived and designed the study. JLW and CHZ wrote the manuscript. JLW and QZ generated the figures and tables. WYC and YRY collected clinical samples and data. MA and QZD revised the manuscript. All authors contributed to data analysis, drafting or revising the article, have agreed on the journal to which the article will be submitted, gave final approval of the version to be published, and agree to be accountable for all aspects of the work.
Funding
This work was supported by the Shanghai International Science and Technology Collaboration Program (18410721900), and the National Natural Science Foundation of China (82073208, 81472672).
Disclosure
The authors report no conflicts of interest for this work.
References
1. Siegel RL, Miller KD, Jemal A. Cancer statistics, 2020. CA Cancer J Clin. 2020;70(1):7–30. doi:10.3322/caac.21590
2. Petrick JL, Florio AA, Znaor A, et al. International trends in hepatocellular carcinoma incidence, 1978–2012. Int J Cancer. 2019. doi:10.1002/ijc.32723
3. McGlynn KA, Petrick JL, El-Serag HB. Epidemiology of hepatocellular carcinoma. Hepatology. 2020. doi:10.1002/hep.31288
4. Hou J, Zhang H, Sun B, Karin M. The immunobiology of hepatocellular carcinoma in humans and mice: basic concepts and therapeutic implications. J Hepatol. 2020;72(1):167–182. doi:10.1016/j.jhep.2019.08.014
5. De Matteis S, Ragusa A, Marisi G, et al. Aberrant metabolism in hepatocellular carcinoma provides diagnostic and therapeutic opportunities. Oxid Med Cell Longev. 2018;2018:7512159. doi:10.1155/2018/7512159
6. Piccinin E, Villani G, Moschetta A. Metabolic aspects in NAFLD, NASH and hepatocellular carcinoma: the role of PGC1 coactivators. Nat Rev Gastroenterol Hepatol. 2019;16(3):160–174. doi:10.1038/s41575-018-0089-3
7. Hu B, Lin JZ, Yang XB, Sang XT. Aberrant lipid metabolism in hepatocellular carcinoma cells as well as immune microenvironment: a review. Cell Prolif. 2020;53(3):e12772. doi:10.1111/cpr.12772
8. Kaffe E, Magkrioti C, Aidinis V. Deregulated lysophosphatidic acid metabolism and signaling in liver cancer. Cancers (Basel). 2019;11(11):1626. doi:10.3390/cancers11111626
9. Li S, Gao D, Jiang Y. Function, detection and alteration of acylcarnitine metabolism in hepatocellular carcinoma. Metabolites. 2019;9(2):36. doi:10.3390/metabo9020036
10. Tardelli M, Bruschi FV, Trauner M. The role of metabolic lipases in the pathogenesis and management of liver disease. Hepatology. 2020;72(3):1117–1126. doi:10.1002/hep.31250
11. Budhu A, Roessler S, Zhao X, et al. Integrated metabolite and gene expression profiles identify lipid biomarkers associated with progression of hepatocellular carcinoma and patient outcomes. Gastroenterology. 2013;144(5):1066–1075.e1. doi:10.1053/j.gastro.2013.01.054
12. Wang YH, Liu CL, Chiu WC, Twu YC, Liao YJ. HMGCS2 mediates ketone production and regulates the proliferation and metastasis of hepatocellular carcinoma. Cancers (Basel). 2019;11(12):1876. doi:10.3390/cancers11121876
13. Wang L, Li X. Identification of an energy metabolism-related gene signature in ovarian cancer prognosis. Oncol Rep. 2020;43(6):1755–1770. doi:10.3892/or.2020.7548
14. Wu F, Zhao Z, Chai RC, et al. Prognostic power of a lipid metabolism gene panel for diffuse gliomas. J Cell Mol Med. 2019;23(11):7741–7748. doi:10.1111/jcmm.14647
15. Wang MD, Wu H, Fu GB, et al. Acetyl-coenzyme A carboxylase alpha promotion of glucose-mediated fatty acid synthesis enhances survival of hepatocellular carcinoma in mice and patients. Hepatology. 2016;63(4):1272–1286. doi:10.1002/hep.28415
16. Mounier C, Bouraoui L, Rassart E. Lipogenesis in cancer progression (review). Int J Oncol. 2014;45(2):485–492. doi:10.3892/ijo.2014.2441
17. Ritchie ME, Phipson B, Wu D, et al. limma powers differential expression analyses for RNA-sequencing and microarray studies. Nucleic Acids Res. 2015;43(7):e47. doi:10.1093/nar/gkv007
18. Zhou C, Chen W, Sun J, et al. Low expression of WW domain-containing oxidoreductase associates with hepatocellular carcinoma aggressiveness and recurrence after curative resection. Cancer Med. 2018;7(7):3031–3043. doi:10.1002/cam4.1591
19. Zucman-Rossi J, Villanueva A, Nault JC, Llovet JM. Genetic landscape and biomarkers of hepatocellular carcinoma. Gastroenterology. 2015;149(5):1226–1239.e4. doi:10.1053/j.gastro.2015.05.061
20. Weng J, Atyah M, Zhou C, Ren N. Prospects and challenges of circulating tumor DNA in precision medicine of hepatocellular carcinoma. Clin Exp Med. 2020;20(3):329–337. doi:10.1007/s10238-020-00620-9
21. Tibshirani R. The lasso method for variable selection in the Cox model. Stat Med. 1997;16(4):385–395. doi:10.1002/(sici)1097-0258(19970228)16:4<385::aid-sim380>3.0.co;2-3
22. Tamborero D, Rubio-Perez C, Muinos F, et al. A pan-cancer landscape of interactions between solid tumors and infiltrating immune cell populations. Clin Cancer Res. 2018;24(15):3717–3728. doi:10.1158/1078-0432.Ccr-17-3509
23. Xu Q, Tu J, Dou C, et al. HSP90 promotes cell glycolysis, proliferation and inhibits apoptosis by regulating PKM2 abundance via Thr-328 phosphorylation in hepatocellular carcinoma. Mol Cancer. 2017;16(1):178. doi:10.1186/s12943-017-0748-y
24. Liu GM, Xie WX, Zhang CY, Xu JW. Identification of a four-gene metabolic signature predicting overall survival for hepatocellular carcinoma. J Cell Physiol. 2020;235(2):1624–1636. doi:10.1002/jcp.29081
25. Long J, Wang A, Bai Y, et al. Development and validation of a TP53-associated immune prognostic model for hepatocellular carcinoma. EBioMedicine. 2019;42:363–374. doi:10.1016/j.ebiom.2019.03.022
26. Tang Y, Zeng Z, Wang J, et al. Combined signature of nine immune-related genes: a novel risk score for predicting prognosis in hepatocellular carcinoma. Am J Transl Res. 2020;12(4):1184–1202.
27. El Hassouni B, Granchi C, Valles-Marti A, et al. The dichotomous role of the glycolytic metabolism pathway in cancer metastasis: interplay with the complex tumor microenvironment and novel therapeutic strategies. Semin Cancer Biol. 2020;60:238–248. doi:10.1016/j.semcancer.2019.08.025
28. Iwamoto H, Abe M, Yang Y, et al. Cancer lipid metabolism confers antiangiogenic drug resistance. Cell Metab. 2018;28(1):104–117.e5. doi:10.1016/j.cmet.2018.05.005
29. Fatima S, Shi X, Lin Z, et al. 5-hydroxytryptamine promotes hepatocellular carcinoma proliferation by influencing beta-catenin. Mol Oncol. 2016;10(2):195–212. doi:10.1016/j.molonc.2015.09.008
30. Ally A, Balasundaram M, Carlsen R. Comprehensive and integrative genomic characterization of hepatocellular carcinoma. Cell. 2017;169(7):1327–1341.e23. doi:10.1016/j.cell.2017.05.046
31. Xu D, Wang Z, Xia Y, et al. The gluconeogenic enzyme PCK1 phosphorylates INSIG1/2 for lipogenesis. Nature. 2020;580(7804):530–535. doi:10.1038/s41586-020-2183-2
32. Li F, Huangyang P, Burrows M, et al. FBP1 loss disrupts liver metabolism and promotes tumorigenesis through a hepatic stellate cell senescence secretome. Nat Cell Biol. 2020;22(6):728–739. doi:10.1038/s41556-020-0511-2
33. Zhu H, Zhang Q, Chen G. CXCR6 deficiency ameliorates ischemia-reperfusion injury by reducing the recruitment and cytokine production of hepatic NKT cells in a mouse model of non-alcoholic fatty liver disease. Int Immunopharmacol. 2019;72:224–234. doi:10.1016/j.intimp.2019.04.021
34. Everts B, Amiel E, Huang SC, et al. TLR-driven early glycolytic reprogramming via the kinases TBK1-IKKvarepsilon supports the anabolic demands of dendritic cell activation. Nat Immunol. 2014;15(4):323–332. doi:10.1038/ni.2833
35. Yu D, Green B, Marrone A, et al. Suppression of CYP2C9 by microRNA hsa-miR-128-3p in human liver cells and association with hepatocellular carcinoma. Sci Rep. 2015;5(1):8534. doi:10.1038/srep08534
36. Li M, Jin C, Xu M, Zhou L, Li D, Yin Y. Bifunctional enzyme ATIC promotes propagation of hepatocellular carcinoma by regulating AMPK-mTOR-S6 K1 signaling. Cell Commun Signal. 2017;15(1):52. doi:10.1186/s12964-017-0208-8
37. Lee D, Xu IM, Chiu DK, et al. Induction of oxidative stress through inhibition of thioredoxin reductase 1 is an effective therapeutic approach for hepatocellular carcinoma. Hepatology. 2019;69(4):1768–1786. doi:10.1002/hep.30467
38. Gao J, Chen H, Yu Y, et al. Inhibition of hepatocellular carcinoma growth using immunoliposomes for co-delivery of adriamycin and ribonucleotide reductase M2 siRNA. Biomaterials. 2013;34(38):10084–10098. doi:10.1016/j.biomaterials.2013.08.088
39. Yang PM, Lin LS, Liu TP. Sorafenib inhibits ribonucleotide reductase regulatory subunit M2 (RRM2) in hepatocellular carcinoma cells. Biomolecules. 2020;10(1):117. doi:10.3390/biom10010117
40. Gao Q, Zhang G, Zheng Y, et al. SLC27A5 deficiency activates NRF2/TXNRD1 pathway by increased lipid peroxidation in HCC. Cell Death Differ. 2020;27(3):1086–1104. doi:10.1038/s41418-019-0399-1
41. Kitab B, Satoh M, Ohmori Y, et al. Ribonucleotide reductase M2 promotes RNA replication of hepatitis C virus by protecting NS5B protein from hPLIC1-dependent proteasomal degradation. J Biol Chem. 2019;294(15):5759–5773. doi:10.1074/jbc.RA118.004397
42. Liu X, Xu Z, Hou C, et al. Inhibition of hepatitis B virus replication by targeting ribonucleotide reductase M2 protein. Biochem Pharmacol. 2016;103:118–128. doi:10.1016/j.bcp.2016.01.003
43. Morita Y, Sakaguchi T, Ikegami K, et al. Lysophosphatidylcholine acyltransferase 1 altered phospholipid composition and regulated hepatoma progression. J Hepatol. 2013;59(2):292–299. doi:10.1016/j.jhep.2013.02.030
44. Lin HR, Wu CC, Wu YH, Hsu CW, Cheng ML, Chiu DT. Proteome-wide dysregulation by glucose-6-phosphate dehydrogenase (G6PD) reveals a novel protective role for G6PD in aflatoxin B1-mediated cytotoxicity. J Proteome Res. 2013;12(7):3434–3448. doi:10.1021/pr4002959
45. Lu M, Lu L, Dong Q, et al. Elevated G6PD expression contributes to migration and invasion of hepatocellular carcinoma cells by inducing epithelial-mesenchymal transition. Acta Biochim Biophys Sin (Shanghai). 2018;50(4):370–380. doi:10.1093/abbs/gmy009
46. Yin X, Tang B, Li JH, et al. ID1 promotes hepatocellular carcinoma proliferation and confers chemoresistance to oxaliplatin by activating pentose phosphate pathway. J Exp Clin Cancer Res. 2017;36(1):166. doi:10.1186/s13046-017-0637-7
 © 2021 The Author(s). This work is published and licensed by Dove Medical Press Limited. The full terms of this license are available at https://www.dovepress.com/terms.php and incorporate the Creative Commons Attribution - Non Commercial (unported, v3.0) License.
By accessing the work you hereby accept the Terms. Non-commercial uses of the work are permitted without any further permission from Dove Medical Press Limited, provided the work is properly attributed. For permission for commercial use of this work, please see paragraphs 4.2 and 5 of our Terms.
© 2021 The Author(s). This work is published and licensed by Dove Medical Press Limited. The full terms of this license are available at https://www.dovepress.com/terms.php and incorporate the Creative Commons Attribution - Non Commercial (unported, v3.0) License.
By accessing the work you hereby accept the Terms. Non-commercial uses of the work are permitted without any further permission from Dove Medical Press Limited, provided the work is properly attributed. For permission for commercial use of this work, please see paragraphs 4.2 and 5 of our Terms.